Implementation and Evaluation of Signal Processing Techniques for EEG based Brain Computer Interface
16
Comparison of Adaptive Neuro-Fuzzy and Multi-Layer Perceptron with Levenberg-Marquardt learning algorithm for Classifying EEG Signals Damien Quinn [email protected] Abstract- This paper compares two inherently different approaches to classify electroencephalogram (EEG) data from a brain computer interface (BCI). The first approach is a Multi-Layer Perceptron-Feed forward (MLP-FF) neural network with Levenberg- Marquardt learning algorithm and secondly, a novel hybrid approach of an Adaptive Neuro Fuzzy Inference System (ANFIS) is implemented. ANFIS has an advantage over many other classification algorithms in that it provides a set of parameters and linguistic rules derived from the fuzzy inference system, which can subsequently be used for interpreting relationships between extracted features. The performance of both ANFIS and MLP-FF are compared and analysed. Keywords: Electroencephalogram (EEG), Brain Computer Interface (BCI), Multi-Layer Perceptron Feed Forward Neural Network, (MLP-FF NN), Adaptive Neuro- Fuzzy Inference System (ANFIS) 1. Introduction Brain computer Interface (BCI) is a method of communication based on the neural activity generated by the brain and which is furthermore separate from its normal output pathway of peripheral nerves and muscles. This technology can be utilised to allow individuals with minor and severe movement disabilities and deficiencies to communicate with assistive devices using the brain signals extracted from the individual. In order to control BCI a subject must produce different brain activity patterns that will be interpreted and identified by the system and translated into commands. In Motor Imagery (MI) based BCI’s the subject performs a mental imagination of a specified task or command, whereby the MI is translated into a control signal, using a classification algorithm which classifies the unique
-
Upload
damian-quinn -
Category
Documents
-
view
18 -
download
0
Transcript of Implementation and Evaluation of Signal Processing Techniques for EEG based Brain Computer Interface

Comparison of Adaptive Neuro-Fuzzy and Multi-Layer Perceptron with Levenberg-Marquardt learning algorithm for Classifying EEG Signals
Damien Quinn
Abstract- This paper compares two inherently different approaches to classify electroencephalogram (EEG) data from a brain computer interface (BCI). The first approach is a Multi-Layer Perceptron-Feed forward (MLP-FF) neural network with Levenberg-Marquardt learning algorithm and secondly, a novel hybrid approach of an Adaptive Neuro Fuzzy Inference System (ANFIS) is implemented. ANFIS has an advantage over many other classification algorithms in that it provides a set of parameters and linguistic rules derived from the fuzzy inference system, which can subsequently be used for interpreting relationships between extracted features. The performance of both ANFIS and MLP-FF are compared and analysed.
Keywords: Electroencephalogram (EEG), Brain Computer Interface (BCI), Multi-Layer Perceptron Feed Forward Neural Network, (MLP-FF NN), Adaptive Neuro-Fuzzy Inference System (ANFIS)
1. Introduction
Brain computer Interface (BCI) is a method of communication based on the neural activity generated by the brain and which is furthermore separate from its normal output pathway of peripheral nerves and muscles. This technology can be utilised to allow individuals with minor and severe movement disabilities and deficiencies to communicate with assistive devices using the brain signals extracted from the individual. In order to control BCI a subject must produce different brain activity patterns that will be interpreted and identified by the system and translated into
commands. In Motor Imagery (MI) based BCI’s the subject performs a mental imagination of a specified task or command, whereby the MI is translated into a control signal, using a classification algorithm which classifies the unique electroencephalogram (EEG) patterns of that subjects imagined task. Imagined tasks could range from moving ones foot, pointing ones finger in a stipulated direction or moving ones arm in a dictated motion. Furthermore it has been noted that there exists hemispheric EEG differences between left and right hand manipulation in the initial preparatory stage prior to movement [3], [13], [7] and after movement [14]. During movement the EEG displays a bilateral desynchronization pattern. In the pre-movement period, mu and beta event-related desynchronization (ERD) are of contralateral dominance and after movement the post-movement beta synchronization is mainly localized contra laterally. This knowledge can be used for a BCI by designing an EEG pattern classifier which analyses the current EEG pattern in real time and produces a control signal [14].
Feature extraction is also a prime concern that will substantially affect the accuracy of classifying MI tasks. An effective feature extraction method helps aid and enhances classification performance. A great deal of extraction methods have been proposed. Among them, the band power, Hjorth and AAR parameter model are popular and commonly used [2], [8].
The vast majority of BCI research has been directed at the creation of powerful

signal processing techniques to enable better and increased reliability of the interpretation of EEG signals into coherent control commands [9], [10], [12], [16]. Other more contemporary research has looked at the deployment of neural networks and self-organising fuzzy neural networks have also been implemented to increase feature and signal separability in MI BCI’s [4], [6],[5], [11]. This paper will focus on applying two signal processing approaches namely the application of weighted neural networks as well as the novel hybrid approach of ANFIS. These aforementioned techniques will be used on EEG patterns collected, and used to classify appropriately. The experimental hypothesis forming the basis of this research is whether a hybrid approach of ANFIS can outperform the tried and tested approach of weighted neural networks.
2. Methods and Materials
2.1 Data used
All data extracted were from the data-set 2b from the BCI-IV competition [1]. The data set was comprised of 3 bipolar EEG channels (0.5-100Hz; notch filtered), 3 EOG channels, 250Hz sampling rate, 2 classes based on 9 subjects. The subjects were right-handed, had normal or corrected-to-normal vision and were paid for participating in the experiments. All volunteers were sitting in an armchair, watching a flat screen monitor placed approximately 1 m away at eye level. For each subject 5 sessions are provided, whereby the first two sessions contain training data without feedback (screening), and the last three sessions were recorded with feedback. Extracted features for this experiment include [(F1=activity), (F2=mobility), (F3=complexity), (F4=EEG Mu Rhythm), (F5= EEG Beta Rhythm), (F6=Hjorth), (F7=Bandpower), (F8=Hjorth&Bandpower)].
2.2 Experimental Paradigm
The aforementioned data set was obtained utilising the following experimental cue-based paradigm which consists of two classes, namely MI of the left hand (class 1) and MI of the right hand (class 2). Three EEG channels (C3, Cz, and C4) were recorded in bipolar mode with a sampling frequency of 250 Hz and were bandpass-filtered between 0.5 Hz and 100 Hz, and a notch filter at 50 Hz was enabled. However, here only two channels C3 and C4 are to be utilized. Depicted in figure 1 illustrates the entire process to which a subject was exposed. Initially at 0 s there was a small grey smiley on the centre of the screen. This is to indicate no activity. On the onset of 2 s, a small warning noise (1 kHz, 70ms) rang to indicate that some activity was imminent. Next a cue was presented from 3 s to 7.5 s, and the subject was expected to perform a directed imagination in specific relation to the cue. At 7.5 s the screen went blank and a random interval of between 1 s and 2 s was utilised in order to prevent user adaption.

Figure 1 Timing scheme of the paradigm. (a) The first two sessions (01T, 02T) contain training data without feedback, and (b) the last three sessions (03T, 04E, 05E) with smiley feedback.
Figure 2 Electrode placement
2.3 EEG Classification: Multi-Layer -FF NN (MLP-FF)
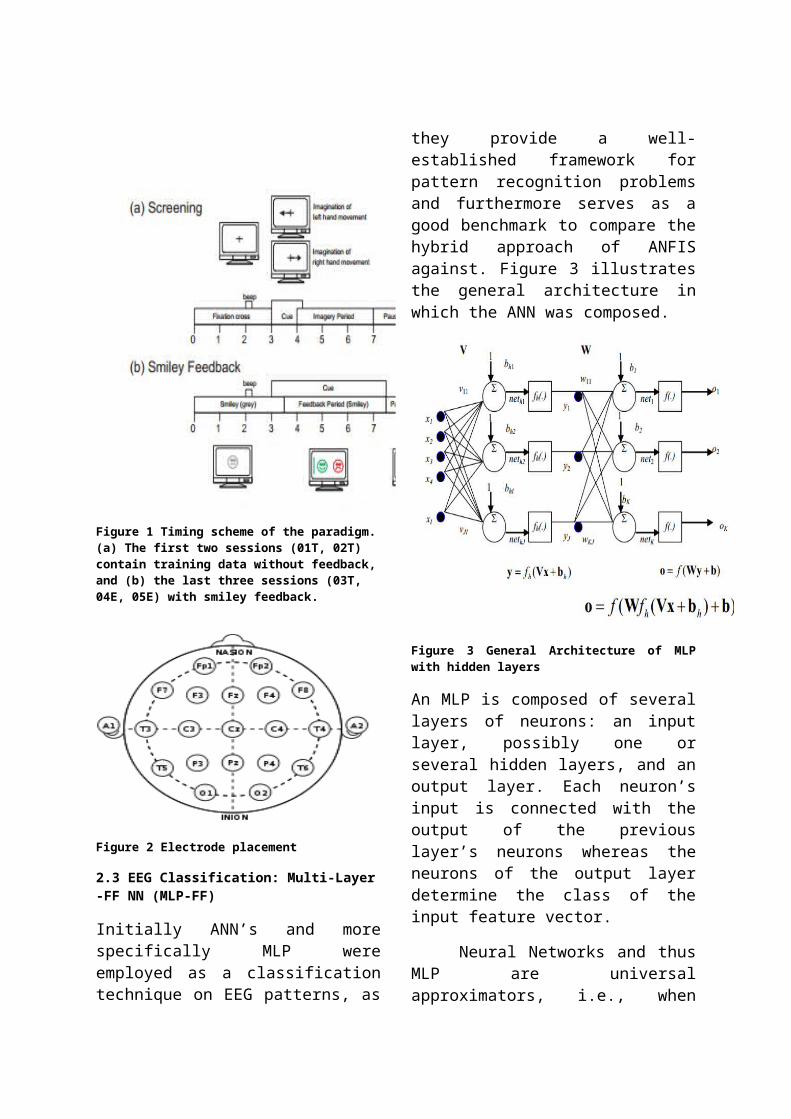
Initially ANN’s and more specifically MLP were employed as a classification technique on EEG patterns, as they provide a well-established framework for pattern recognition problems and furthermore serves as a good benchmark to compare the hybrid approach of ANFIS against. Figure 3
illustrates the general architecture in which the ANN was composed.
Figure 3 General Architecture of MLP with hidden layers
An MLP is composed of several layers of neurons: an input layer, possibly one or several hidden layers, and an output layer. Each neuron’s input is connected with the output of the previous layer’s neurons whereas the neurons of the output layer determine the class of the input feature vector.
Neural Networks and thus MLP are universal approximators, i.e., when composed of enough neurons and layers, they can approximate any continuous function. Added to the fact that they can classify any number of classes, this makes ANN’s very flexible classifiers that can adapt to a great variety of problems. Consequently, MLP, which are the most popular NN used in classification, have been applied to almost all BCI problems such as binary or multiclass synchronous or asynchronous BCI. However, the fact that MLP are universal approximators makes these classifiers sensitive to overtraining, especially with such noisy and non-stationary data as EEG.
In this particular instance, MLP-FF NN with two hidden layers trained by the Levenberg-Marquardt (LM) algorithm was used to classify different combinations of two mental tasks represented by the different EEG features. Originally the LM algorithm was developed to act as an intermediate and address the inherent shortcomings of the more established Gauss-Newton and Gradient Descent. LM is relatively more robust than Gauss-Newton and Gradient Descent, which means in most cases it finds a solution even if it starts very far off the final minimum.
Furthermore in this instance the MLP-FF applies a tan sigmoid
and pure linear
activation function. Also the hidden layers are applied values of 10-12.
Figure 4 Typical Feed Forward network composed of three layers
2.4 EEG Classification: Adaptive Neuro Fuzzy Inference System
The hybrid approach chosen to classify EEG signals appropriately is the Adaptive Neuro-Fuzzy Inference System known more popularly as ANFIS. It takes on the structure of an artificial neural network integrated with a Takagi-Sugeno fuzzy inference system. As it integrates the merits of both fuzzy logic and neural network principles, it has the potential to avail of the advantages of both in a single framework.
Figure 5General overview of ANFIS architecture

In ANFIS the parameters can be estimated in such a way that both the Sugeno and Tsukamoto fuzzy models are represented by the ANFIS architecture. Again with minor constraints the ANFIS model resembles the Radial basis function network (RBFN) functionally. This ANFIS methodology comprises of a hybrid system of fuzzy logic and neural network technique. The fuzzy logic takes into account the imprecision and uncertainty of the system that is being modelled while the neural network gives it a sense of adaptability. Using this hybrid method, at first an initial fuzzy model along with its input variables are derived with the help of the rules extracted from the input output data of the system that is being modelled. Next the neural network is used to fine tune the rules of the initial fuzzy model to produce the final ANFIS model of the system.
Figure 6 Learning fuzzy sets
Figure 7 Learning fuzzy rules
Figure 8 Learning rule weights
ANFIS enhances fuzzy parameter tuning with self-learning capability for achieving optimal prediction objectives. An ANFIS network is a multilayer feed-forward network where each node performs a particular node function on incoming signals. It is characterized with a set of parameters pertaining to that node. To reflect different adaptive capabilities, both square and circle node symbols are used. A square node (adaptive node) has parameters needed to be trained, while a circle node (fixed node) has none. The parameters of the ANFIS network consist of the union of the parameter sets associated to each adaptive node. To achieve a desired input–output mapping, these parameters are updated according to given training data and a recursive least square (RLS) estimate.
One of the prime concerns when utilising ANFIS for classifying data is its inherent ability to generalise when confronted with a small element of data. The generating of a fuzzy inference system in turns leads to a large number of fuzzy rules being extracted which subsequently leads to a large number of ANFIS parameters that need fine tuning. These parameters will not be adjusted accurately if using a small number of training data. For example if you had 8 features for every trail and you had 140 trials, if three fuzzy membership functions were defined for each input feature, that would provide a possible total of 6561 rules which subsequently cannot be trained given a small number of training patterns.

To overcome this problem, subtractive clustering was used and more accurately Genfis2 was invoked to generate a limited number of rules. Genfis2 was used to initially create that Sugeno-type fuzzy inference system and uses subtractive clustering and furthermore requires separate sets of inputs and output data as arguments. Genfis2 was implemented as opposed to Genfis1 as there was more than 6 inputs and a large amount of training data. Furthermore Genfis1 differs from Genfis2 as Genfis1 produces grid partitioning of the input space and thus is more likely to have the problem of the curse of dimensionality while as mentioned previously, Genfis2 uses subtractive clustering. Subtractive clustering aims to uncover pertinent pattersn from within the data by identifyig optimal data points in which to locate cluster centres. These cluster are next used to extract meaningful fuzzy rules.
3. Performance Evaluation
3.1 MLP-FF Performance Evaluation
The experiments were carried out on data ascertained from nine subjects. All data obtained were taken from the BCI experiment mentioned in section 2.1. It is only logical to first interpret the results of implementing neural networks on the EEG sample. Table 1 to Table 9 shows classification results when implementing MLP-FF utilising 2 hidden layers given values of 10-12 respectively. As explained above 8 features have used in the MLP-FF classifier. Extracted features for this experiment include [(F1=activity), (F2=mobility), (F3=complexity), (F4=EEG Mu Rhythm), (F5= EEG Beta Rhythm), (F6=Hjorth), (F7=Bandpower), (F8=Hjorth&Bandpower)]. As features 1-5 have inherently similar qualities, they have been grouped together and an average computed. .
Subject1 F1-F5 Avg.
F6 F7 F8
Correct Classification
51.5% 60.62% 54.37% 55.62%
Incorrect Classification
48.5% 39.38% 45.63% 44.37
Table 1
Subject2 F1-F5 Avg.
F6 F7 F8
Correct Classification
50.16% 52.5% 53.33% 44.16%
Incorrect Classification
49.84% 47.5% 46.67% 55.84%
Table 2
Subject3 F1-F5 Avg.
F6 F7 F8
Correct Classification
50.37% 53.75% 50% 51.87%
Incorrect Classification
49.63% 46.25% 50% 48.13%
Table 3
Subject4 F1-F5 Avg.
F6 F7 F8
Correct Classification
72.37% 84.37% 96.87% 97.50%
Incorrect Classification
27.63% 15.63% 3.13% 2.5%
Table 4
Subject5 F1-F5 Avg.
F6 F7 F8
Correct Classification
58.25% 76.87% 72.50% 78.12%
Incorrect Classification
41.75% 23.13% 27.50% 21.88%
Table 5
Subject6 F1-F5 Avg.
F6 F7 F8
Correct Classification
55.5% 68.75% 63.12% 60%
Incorrect Classification
45.5% 31.25% 36.88% 40%
Table 6
Subject7 F1-F5 Avg.
F6 F7 F8
Correct Classification
48.37% 56.25% 55.62% 56.87%
Incorrect Classification
51.63% 43.75% 44.38% 43.13%
Table 7
Subject8 F1-F5 Avg.
F6 F7 F8
Correct Classification
67.12% 82.5% 73.75% 79.37%
Incorrect Classification
32.88% 17.50% 26.25% 20.63%
Table 8
Subject9 F1-F5 F6 F7 F8

Avg.Correct Classification
59.5% 78.75% 73.75% 70.62%
Incorrect Classification
40.5% 21.25% 26.25% 29.38
Table 9
The architecture of the MLP-FF is based on a straight forward approach with two hidden layers of 10 and 12 nodes respectively, with two outputs and 100 epochs training. For validation purposes, the data was divided into the following ratios to enhance classification- initial training ratio 70/100, initial validation ratio 15/100 and finally test ratio 15/100. The results obtained from implementing MLP-FF with Levenberg-Marquardt training algorithm were comparatively mixed. As seen in the tabled data, the classification accuracy for the two class problem performed better on subject 4. Furthermore it can be seen that the classification accuracy for subject 3 and subject 7 was the worst amongst all other classification scores. Classification accuracy performed as expected in all subjects when applied to feature set 6 (f6) with an average correct classification accuracy of 68.26%. This is to be contrasted against F1-F5 which had a correct classification accuracy of 57.02% which generally classified as many instances incorrectly as correctly. A further aspect to be noted is the quicker time in classification than the hybrid model of ANFIS which will be discussed in the next section.
Figure 9 Validation Performance on Subject 4 F8
Figure 9 above depicts the best classification performance of 97.5% ran over the first 8 initial epochs.
Figure 10 ROC graph on best classification performance (Subject 4 F8)
3.2 ANFIS Performance Evaluation
As seen previously, all experiments were carried on data ascertained from nine subjects. All data obtained were taken from the BCI experiment mentioned in section 2.1. During execution of ANFIS on the

mentioned data set, there was quite a lot of results extracted. Too much to be adequately illustrated on this report. All graphs and execution results as well as source code will be found on disc submitted with this report.
On implementation of ANFIS on the data set a collection of radii were selected as to centre clusters that ranged from 0.5– 1.2 respectively. These radii were selected along with all available features ranging from F1-F8 on all subjects. During the training phase, ANFIS by default utilises a hybrid learning algorithm to identify parameters for the fuzzy inference system (FIS). It utilises a combination of least squares method along with back propagation gradient descent for training FIS membership function parameters to copy a given training data set.
These identified clusters will generate the formation of fuzzy rules. Furthermore it was noted that as the specified cluster radius increased, the number of generated associated rules decreased. The Genfis2.m function in Matlab has been utilised to generate and extract rules. This function extracts rules by first using the results of the subtractive clustering in order to generate the number of rules and antecedent membership functions and then uses linear least squares estimation to determine each subsequent rules consequent equations. Giving 8 input features, each rule will compose of 8 antecedents and one consequent. The radius of each cluster specifies the range of influence of the cluster centre. Hence as mentioned previously, a smaller cluster radius will generate more smaller clusters in the data and inevitable more rules. The analysis of the generated rules can provide pertinent information about the relationship and interaction of selected features.
Furthermore it was noted during execution trials that as the specified cluster radius
increased the training error increased while the checking error decreased as shown in figure 11 and figure 12. This also led to less rules being generated.
Figure 11Training error subject 7 radius cluster size 0.5
Figure 12Training error subject 7 radius cluster 1.2
Also noted was, as the setting of the radius was set smaller, generated a higher classification. For example, using subject 7, F6 and setting radius to 1.2 gave a classification accuracy of 58.75%, whereas using the same subject, same feature but a smaller radius of 0.5 elicited a higher classification accuracy of 67.87%.
Furthermore it was noted that ANFIS performed classification better when compared with MLP-FF. One example is when ANFIS was executed on Subject 7’s data, on F6 at radius 0.5, it gave a correct

classifcation of 67.87% which is to be contrasted against MLP-FF’s correct classification on the same subject of 56.25%. A demerit of implementing ANFIS is the generally slower execution times as compared against MLP-FF. In most probability this may be due to the excessive functions in which ANFIS must create in order to execure as compared against the computationally simpler model of MLP-FF.
Figure 13 ROC graph using ANFIS on same subject as previous MLP-FF ROC graph as performance comparison
Generally for the majority of executions, ANFIS performed more accurately in terms of correct classification across all 9 subjects and features as further depicted when comparing Figure 13 and Figure 10 respectively.
4. Evaluation & Conclusions
In this paper, the findings of both MLP-FF with Levenberg-Marquardt learning algorithm and ANFIS when deployed on the data set mentioned in section 2.1 were collated and interpreted.
Firstly, it was noticed that MLP-FF performed quite mediocrely eliciting an average correct classification of just under 70%. This is to be contrasted against ANFIS which performed better across most subjects depending on specified parameters set. This performance gulf could be offset by perhaps utilising a different learning algorithm other than Levenberg-Marquardt. An alternative is put forward by [15] which shows promising results. Furthermore the parameters could also be modified in future endeavours to elicit hopefully better classification accuracy. For example extra hidden layers with varying amount of nodes could be implemented in order to extract better results.
It was noted that during the implementation of ANFIS, it proved useful in that it elicited pertinent information about the interaction of input features and their relationship with the associated class labels. As a whole, the ANFIS classifier using fuzzy subtractive clustering and which is trained to modify membership parameters of the inputs and the output has been thoroughly analysed and interpreted. It was noted that by modifying clustering radii, elicited varying amount of rules and hence different classification accuracies. The results obtained from ANFIS were found to be better than those elicited from MLP-FF on most subjects across all features while also providing meaningful linguistic rules to further explain relationships between input features and their associated class labels.
Further investigation using ANFIS could be to compare against other classification

methods such as the linear support vector machine, and perhaps to implement ANFIS on a multiclass classification problem and evaluate the associated results and ultimately the correct classification performance.
References
[1] BCI Competition IV [Online]. Available: http://www.bbci.de/competition/iv/desc_2b.pdf.
[2] D.P. Burke, S.P. Kelly, P. Chazal de, R.B. Reilly, C. Finucane, “A parametric feature extraction and classification strategy for brain–computer interfacing”, IEEE Trans Neural Syst Rehabil Eng, 13 (2005), pp. 12–17
[3] Chatrian, G.E., Petersen, M.C. and Lazarte, J.A. The blocking of the rolandic wicket rhythm and some central changes related to movement. Electroenceph. clin. Neurophysiol., 1959, 11: 497-510.
[4] D. Coyle, “Neural network based auto association and time-series prediction for biosignal processing in brain–computer interfaces,” IEEE Comput. Intell. Mag., vol. 4, no. 4, pp. 47–59, Nov. 2009
[5] D. Coyle, G. Prasad, and T. M. McGinnity, “A time-series prediction approach for feature extraction in a brain–computer interface,” IEEE Trans. Neural Syst. Rehabil. Eng., vol. 13, no. 4, pp. 461–467,Dec. 2005.
[6] D. Coyle, G. Prasad, and T. M. McGinnity, “Faster self-organizing fuzzy neural network training and a hyperparameter analysis for a brain–computer interface,” IEEE Trans. Syst., Man, Cybern., B, Cybern.,vol. 39, no. 6, pp. 1458–1471, Dec. 2009.
[7] Derambure, P., Defebvre, L., Dujardin, K., Bourriez, J.L., Jacquesson, J.M., Destee, A. and Guieu, J.D. Effect of aging on the spatiotemporal pattern of event-related desynchronization during a voluntary movement. Electroenceph. clin. Neurophysiol., 1993, 89: 197-203.
[8] C. Guger, G. Edlinger, W. Harkam, I. Niedermayer, G. Pfurtscheller, “How many people are able to operate an EEG-based brain–computer interface (BCI)?”, IEEE Trans Neural Syst Rehabil Eng, 11 (2003), pp. 145–147
[9] D.J. McFarland, A.T. Lefkowicz, J.R. WolpawDesign and operation of an EEG-based brain–computer interface with digital signal processing technologyBehavior Research Methods, 29 (1997), pp. 337–345
[10] D.J. McFarland, L.M. McCane, S.V. David, J.R. Wolpaw Spatial filter selection for EEG-based
communication Electroencephalography and Clinical Neurophysiology, 103 (1997), pp. 386–394
[11] José del R. Millán, Josep Mouriño, Marco Franzé, Febo Cincotti, Markus Varsta, Jukka Heikkonen, and Fabio Babiloni, “A Local Neural Classifier for the Recognition of EEG Patterns Associated to Mental Tasks”, IEEE TRANSACTIONS ON NEURAL NETWORKS, VOL. 13, NO. 3, MAY 2002
[12] Penny, W.D., & Roberts, S.J. (1999). EEG-based communication via dynamic neural network models. Proceedings, international joint conference on neural networks, Washington, USA, July 1999, CD ROM[13] Pfurtscheller, G. and Berghold, A. Patterns of cortical activation during planning of voluntary movement. Electroenceph. clin. Neurophysiol.,1989, 72: 250-258.
[14] G. Pfurtscheller*, J. Kalcher, Ch. Neuper, D. Flotzinger, M. Pregenzer, “On-line EEG classification during externally-paced hand movements using a neural network-based classifier”, Electroencephalography and clinical Neurophysiology 99 (1996) 416-425
[15] Riedmiller, M., Braun, H., “A direct adaptive method for faster backpropagation learning: the RPROP algorithm”, Neural Networks, 1993., IEEE International Conference, 28 Mar 1993-01 Apr 1993, 586 - 591 vol.1
[16] S.J. Roberts, W.D. PennyReal-time brain–computer interfacing: A preliminary study using baysian learningMedical & Biological Engineering & Computing, 38 (2000), pp. 56–61
Figures
Figure 1 obtained from http://www.bbci.de/competition/iv/desc_2b.pdf
Figure 2 obtained from http://en.wikipedia.org/wiki/10-20_system_(EEG)
Figure 3 obtained from https://learning.ulster.ac.uk/week6/pg7
Figure 4 obtained from http://www.ijser.org/paper/A-Survey-on-FPGA-based-MLP-Realization-for-On-chip-Learning.html
Figure 5 obtained from http://omicsonline.org/2157-7048/images/2157-7048-3-124-g002.gif
Figure 6 obtained from https://learning.ulster.ac.uk/week11/pg6
Figure 7 obtained from https://learning.ulster.ac.uk/week11/pg6
Figure 8 obtained from https://learning.ulster.ac.uk/week11/pg6

Figure 9 obtained from this research
Figure 10 obtained from this research
Figure 11 obtained from this research
Figure 12 obtained from this researchFigure 13 obtained from this research