Digital Analysis Of EEG Brain Signal - WebmedCentral.com · 2011-12-22 · Digital Analysis Of EEG...
22
Article ID: WMC001193 2046-1690 Digital Analysis Of EEG Brain Signal Corresponding Author: Mr. Rash Dubey, Asst. Prof., E & IE, APJ College of Engg., Sohna, Gurgaon, 121003 - India Submitting Author: Dr. Rash B Dubey, Professor, ECE Dept, Hindu College of Engg, Sonepat, 121003 - India Article ID: WMC001193 Article Type: Research articles Submitted on:19-Nov-2010, 06:02:11 AM GMT Published on: 20-Nov-2010, 01:40:52 AM GMT Article URL: http://www.webmedcentral.com/article_view/1193 Subject Categories:BRAIN Keywords:ECG brain signal, Fourier transform, Independent component analysis. How to cite the article:Dubey R , Pathak A . Digital Analysis Of EEG Brain Signal . WebmedCentral BRAIN 2010;1(11):WMC001193 Source(s) of Funding: not applicable Competing Interests: N.A. Webmedcentral > Research articles Page 1 of 22
Transcript of Digital Analysis Of EEG Brain Signal - WebmedCentral.com · 2011-12-22 · Digital Analysis Of EEG...
Article ID: WMC001193 2046-1690
Digital Analysis Of EEG Brain SignalCorresponding Author:Mr. Rash Dubey,Asst. Prof., E & IE, APJ College of Engg., Sohna, Gurgaon, 121003 - India
Submitting Author:Dr. Rash B Dubey,Professor, ECE Dept, Hindu College of Engg, Sonepat, 121003 - India
Article ID: WMC001193
Article Type: Research articles
Submitted on:19-Nov-2010, 06:02:11 AM GMT Published on: 20-Nov-2010, 01:40:52 AM GMT
Article URL: http://www.webmedcentral.com/article_view/1193
Subject Categories:BRAIN
Keywords:ECG brain signal, Fourier transform, Independent component analysis.
How to cite the article:Dubey R , Pathak A . Digital Analysis Of EEG Brain Signal . WebmedCentral BRAIN2010;1(11):WMC001193
Source(s) of Funding:
not applicable
Competing Interests:
N.A.
Webmedcentral > Research articles Page 1 of 22
WMC001193 Downloaded from http://www.webmedcentral.com on 22-Dec-2011, 12:01:34 PM
Digital Analysis Of EEG Brain SignalAuthor(s): Dubey R , Pathak A
Abstract
Electroencephalography is the neurophysiologicmeasurement of the electrical activity of the brainusing electrodes placed on the scalp. The resultingtraces are known as electroencephalogram (EEG) andthey represent an electrical signal from a large numberof neurons. The EEG is a brain non-invasiveprocedure frequently used for diagnostic purpose.Instead of electrical currents the voltage differencesbetween different parts of the brain are observed. TheEEG consists of a set of multi-channel signals. Thepattern of changes in signals reflects large-scale brainactivities. In addition the EEG also reflects activationof the head musculature, eye movements, interferencefrom nearby electric devices, and changingconductivity in the electrodes due to the movements ofthe subject or physicochemical reactions at theelectrode sites. In the proposed work advance signalprocessing technique like Fast Fourier Transform andIndependent Component Analysis are used to analyzethe various brain activities. Both the techniques areapplied to single trail multi-channel EEG data. TheFast Fourier transform is to determine the powercontent of the frequency band and estimate thefrequency component while independent componentanalysis performs the blind source of separation ofstatistically independent source and separates thecomponents for their periods of activation
Introduction
Electroencephalography is a medical imagingtechnique that reads scalp electrical activity generatedby brain structures. The electroencephalogram (EEG)is defined as electrical activity of an alternating typerecorded from the scalp surface after being picked upby metal electrodes and conductive media. The EEGmeasured directly from the cortical surface is calledelectrocortiogram while when using depth probes it iscalled electrogram. Thus electroencephalographicreading is a completely non-invasive procedure thatcan be applied repeatedly to patients, normal adults,and children with virtually no risk or limitation.When brain cells are activated, local current flows areproduced. EEG measures mostly the currents that flow
during synaptic excitations of the dendrites of manypyramidal neurons in the cerebral cortex. Differencesof electrical potentials are caused by summedpostsynaptic graded potentials from pyramidal cellsthat create electrical dipoles between soma (body ofneuron) and apical dendrites. Brain electrical currentconsists mostly of Na+, K+, Ca++, and Cl- ions thatare pumped through channels in neuron membranesin the direction governed by membrane potential thedetailed microscopic picture is more sophisticated,including different types of synapses involving varietyof neurotransmitters. Only large populations of activeneurons can generate electrical activity recordable onthe head surface. Between electrode and neuronallayers current penetrates through skin, skull andseveral other layers. Weak electrical signals detectedby the scalp electrodes are massively amplified, andthen displayed on paper or stored to computermemory. Due to capability to reflect both the normaland abnormal electrical activity of the brain, EEG hasbeen found to be a very powerful tool in the field ofneurology and clinical neurophysiology. The electricalsignals generated by the brain represent not only thebrain function but also the status of the whole body.The electrical nature of the human nervous systemhas been recognized for more than a century. It is wellknown that the variation of the surface potentialdistribution on the scalp reflects functional activitiesemerging from the underlying brain .This surfacepotential variation can be recorded by affixing an arrayof electrodes to the scalp, and measuring the voltagebetween pairs of these electrodes, which are thenfiltered, amplified and recorded [1]. Evoked potentialsor event-related potentials (ERPs) are significantvoltage fluctuations resulting from evoked neuralactivity. Evoked potential is initiated by an external orinternal stimulus [2]. Mental operations, such as thoseinvolved in perception, selective attention, languageprocessing and memory, proceed over time ranges inthe order of tens of milliseconds. Whereas PET andMRI can localize regions of activation during a givenmental task, ERPs can help in defining the time courseof these activations amplitudes of ERP componentsare often much smaller than spontaneous EEGcomponents, so they are not to be recognized fromraw EEG trace. They are extracted from set of singlerecordings by digital averaging of epochs of EEGtime-locked to repeated occurrences of sensory,cognitive, or motor events. The spontaneousbackground EEG fluctuations, which are random
Webmedcentral > Research articles Page 2 of 22

WMC001193 Downloaded from http://www.webmedcentral.com on 22-Dec-2011, 12:01:34 PM
relatively to time point when the stimuli occurred, areaveraged out, leaving the event-related brainpotentials. These electrical signals reflect only thatactivity which is consistently associated with thestimulus processing in a time-locked way. The ERPthus reflects, with high temporal resolution, thepatterns of neuronal activity evoked by a stimulus [4].EEG wave’s classification is achieved using anaccurate and highly distinguishable technique. Themethod makes use of both the discrete wavelettransform as well as the discrete Fourier transform.Specially, wavelet transform is used as a classifier ofthe EEG frequencies. In addition, the filtered EEG dataare used as input to the wavelet transform offers aperfect success in the rejecting undesired frequenciesand permits the discrete wavelet transform levels todiscriminate the EEG waves only [3]. EEG signals areconsidered not to be deterministic and they have nospecial characteristics like ECG signals. In addition,when the Fourier transform is applied to successivesegments of an EEG signal, the obtained spectra areobserved to be time varying. This indicates that theEEG signal is also non-stationary. The spectralanalysis based on the Fourier transform classicalmethod assumes the signal to be stationary, andignores any time-varying spectral content of the signalwithin a window [3].EEGLAB, runs under the cross-platform MATLABenvironment for processing collections of single-trialand/or averaged EEG data of any number of channels.Available functions include EEG data, channel andevent information importing, data visualization,preprocessing, independent component analysis (ICA)and time/frequency decompositions including channeland component cross-coherence supported bybootstrap statistical methods based on data re-sampling. EEGLAB functions are organized into threelayers. Top-layer functions allow users to interact withthe data through the graphic interface without needingto use MATLAB syntax. Menu options allow users totune the behavior of EEGLAB to available memory.Middle-layer functions allow users to customize dataprocessing using command history and interactive popfunctions [5].Decomposition of the EEG signal using ICA is arecently developed and practical technique for EEGdata analysis. ICA method determines source signalsfrom their mixture. This analysis allows us tounderstand the sources of EEG signal. The simpleexample with the real EEG data is considered in orderto resolve the sources of the artifacts and the sourcesof useful signal. It is also emphasized the clinicalsignificance of each component and hence theimportance of ICA method in clinical practice [8-9].
Autoregressive (AR) spectral estimation techniquesare known to provide better resolution than classicalperiodogram methods when short segments of dataare select for analysis. It has been observed that theenergy in the EEG data segment is concentrated notin the beginning but somewhere in between the initialand the final positions thus confirming fact that EEG isa mixed delay signal. This position where the energy isconcentrated has been obtained with the help of leastsquares wave shaping filter. It is also shown that theknowledge of the position where the energy in thesignal is concentrated can be used in making a betterspectral estimation of short segments of EEG data [10].Single-channel blind source separation (BSS)technique can be used to decompose a single-channelrecording of brain activity into its constituentcomponents. This technique is used to identify andisolate rhythmic components underlying the recordings.In practice it is feasible to use band-pass filtering of aknown fixed frequency band for monitoring [11].Decomposition of single-trial multi-channel EEGrecordings onto temporally independent and spatiallystationary source signals, as well as identification andpossible removal of artifacts EEG recordings arecarried out [12].The EEG signal indicates the electrical activity of thebrain. They are highly random in nature and maycontain useful information about the brain state.However, it is very difficult to get useful informationfrom these signals directly in the time domain just byobserving them. They are basically non-linear andnon-stationary in nature. Hence, important featurescan be extracted for the diagnosis of different diseasesusing advanced signal processing techniques. Theeffect of different events on the EEG signal, anddifferent signal processing methods used to extract thehidden information from the signal. Linear, frequencydomain, time-frequency and non-linear techniques likecorrelation dimension (CD), largest Lyapunovexponent (LLE), Hurst exponent (H), differententropies, fractal dimension (FD), Higher OrderSpectra (HOS), phase space plots and recurrenceplots are described [13].The rest of the paper is organized as follows. Section2 provides detai ls of EEG recording andmeasurements techniques. Section 3 gives proposedEEG signal analysis schemes. The Section 4discusses results and conclusions are drawn insection 5.
Methods
1. EEG RECORDING AND MEASUREMENT An EEG
Webmedcentral > Research articles Page 3 of 22
WMC001193 Downloaded from http://www.webmedcentral.com on 22-Dec-2011, 12:01:34 PM
is measured non-invasively using small electrodes thatare attached to the surface of the scalp. The numberof electrodes can vary from one to 256. The electrodesare placed at certain predefined positions according tothe international 10/20 system or variants of thatsystem. The weak electrical activity detected by theelectrodes ranges from 5 to 100 µV, and the frequencyrange of interest is between 1-40 Hz. The EEGrecording can provide clues about the physical andmental state of the subject [2].2.1 Action PotentialsThe information transmitted by a nerve is called anaction potential and are caused by an exchange ofions across the neuron membrane and action potentialis a temporary change in the membrane potential thatis transmitted along the axon. It is usually initiated inthe cell body and normally travels in one direction. Themembrane potential depolarizes, producing a spike.After the peak of the spike the membrane re-polarizes.The potential becomes more negative than the restingpotential and then returns to normal. The actionpotentials of most nerves last between 5 and 10milliseconds. The conduction velocity of actionpotentials lies between 1 and 100 m/s. Action potentialare initiated by many different types of stimuli; sensorynerves respond to many types of stimuli, such aschemical, light, electricity, pressure, touch andstretching. On the other hand, the nerves within thebrain and spinal cord are mostly stimulated bychemical activity at synapses. A stimulus must beabove a threshold level to set off an action potential.Very weak stimuli cause a small local electricaldisturbance, but do not produce a transmitted actionpotential. As soon as the stimulus strength goes abovethe threshold, an action potential appears and travelsdown the nerve.The spike of the action potential is mainly caused byopening of Na channels. The Na pump producesgradients of both Na and K ions. Both are used toproduce the action potential; Na is high outside the celland low inside. Excitable cells have special Na and Kchannels with gates that open and close in responseto the membrane voltage. Opening the gates of Nachannels allows Na to rush into the cell, carryingpositive charge. This makes the membrane potentialpositive, producing the spike. When the dendrites of anerve cell receive the stimulus the Na+ channels willopen. If the opening is sufficient to drive the interiorpotential from −70 mV up to −55 mV, the processcontinues. As soon as the action threshold is reached,additional Na+ channels open. The Na+ influx drivesthe interior of the cell membrane up to approximately+30 mV. The process to this point is calleddepolarization. Then Na+ channels close and the K+
channels open. Since the K+ channels are muchslower to open, the depolarization has time to becompleted. Having both Na+ and K+ Channels open atthe same time would drive the system towardsneutrality and prevent the creation of the actionpotential. Having the K+ channels open, themembrane begins to re-polarize back towards its restpotential [9].The re-polarization typically overshoots the restpotential to a level of approximately −90 mV. This iscalled hyper polarization and would seem to becounterproductive, but it is actually important in thetransmission of information. Hyper polarizationprevents the neuron from receiving another stimulusduring this time, or at least raises the threshold for anynew stimulus. Part of the importance of hyperpolarization is in preventing any stimulus already sentup an axon from triggering another action potential inthe opposite direction. In other words, hyperpolarization ensures that the signal is proceeding inone direction. After hyper polarization, the Na+/K+pumps eventually bring the membrane back to itsresting state of −70 mV the nerve requiresapproximately two milliseconds before anotherstimulus is presented during this time no actionpotential can be generated [9].2.2 Evoked PotentialsEvoked potentials or event-related potentials (ERPs)are significant voltage fluctuations resulting fromevoked neural activity. Evoked potential is initiated byan external or internal stimulus. ERPs are suitablemethodology for studying the aspects of cognitiveprocesses of both normal and abnormal nature.Mental operations, such as those involved inperception, selective attention, language processing,and memory, proceed over time ranges in the order oftens of milliseconds. Amplitudes of ERP componentsare often much smaller than spontaneous EEGcomponents, so they are not to be recognized fromraw EEG trace. They are extracted from set of singlerecordings by digital averaging of epochs of EEGtime-locked to repeated occurrences of sensory,cognitive, or motor events. The spontaneousbackground EEG fluctuations, which are randomrelatively to time point when the stimuli occurred, areaveraged out, leaving the event-related brainpotentials. These electrical signals reflect only thatactivity which is consistently associated with thestimulus processing in a time-locked way. The ERPthus reflects, with high temporal resolution, thepatterns of neuronal activity [9].2.3 EEG ActivityEEG activity can be broken down into 4 distinctfrequency bands namely beta activity > 13 Hz , alpha
Webmedcentral > Research articles Page 4 of 22
WMC001193 Downloaded from http://www.webmedcentral.com on 22-Dec-2011, 12:01:34 PM
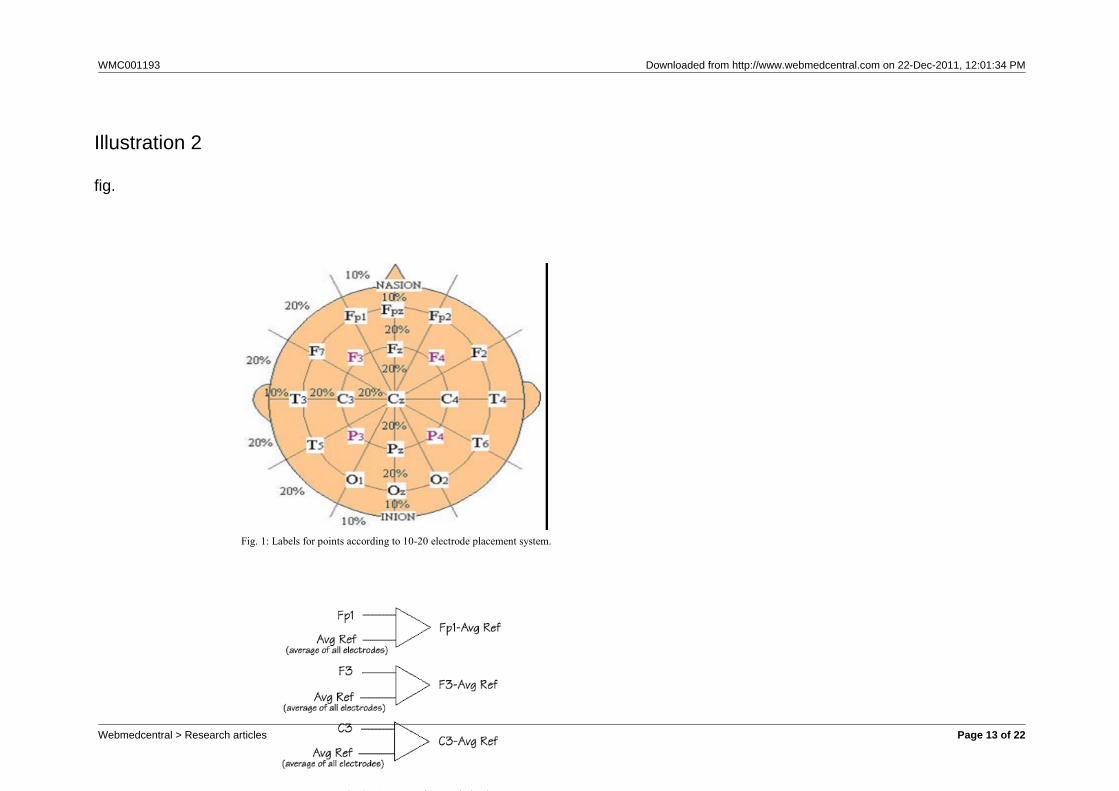
activity 8 Hz-13 Hz , theta activity 4 Hz-7 Hz , deltaactivity < 4 Hz . Beta activity is a normal activitypresent when the eyes are open or closed. It tends tobe seen in the channels recorded from the centre orfront of the head. Some drugs will increase the amountof beta activity in the EEG. Alpha activity is also anormal activity when present in waking adults. It ismainly seen in the channels recorded from the back ofthe head. It is fairly symmetrical and has amplitude of40 µV to 100 µV. It is only seen when the eyes areclosed or reduce in amplitude when the eyes are open.Theta activity can be classed as both a normal andabnormal activity depending on the age and state ofthe patient. In adults it is normal if the patient isdrowsy. However it can also indicate brain dysfunctionif it is seen in a patient who is alert and awake. Inyounger patients, theta activity may be the mainactivity seen in channels recorded from the back andcentral areas of the head [21].Delta activity is only normal in an adult patient if theyare in a moderate to deep sleep. If it is seen at anyother time it would indicate brain dysfunction.Abnormal activity may be seen in all or some channelsdepending on the underlying brain problem. Gamma isthe frequency range approximately 30–100 Hz.Gamma rhythms are thought to represent binding ofdifferent populations of neurons together into anetwork for the purpose of carrying out a certaincognitive or motor function.2.4 Conventional Electrode Positioning The International Federation of Societies forElectroencephalography and Clinical Neurophysiologyhas recommended the conventional electrode setting(also called 10–20) for 21 electrodes, Often theearlobe electrodes called A1 and A2, connectedrespectively to the left and right earlobes, are used asthe reference electrodes. The 10–20 system avoidsboth eyeball placement and considers some constantdistances by using specific anatomic landmarks fromwhich the measurement would be made and then uses10 or 20% of that specified distance as the electrodeinterval. The odd electrodes are on the left and theeven ones on the right. For setting a larger number ofelectrodes using the above conventional system, therest of the electrodes are placed in between the aboveelectrodes with equidistance between them. Forexample, C1 is placed between C3 and Cz representsa larger setting for 75 electrodes including thereference electrodes based on the guidelines by theAmerican EEG Society. Extra electrodes aresometimes used for the measurement of EOG, ECG,and EMG of the eyelid and eye surrounding muscles.In some applications such as ERP analysis and braincomputer interfacing a single channel may be used. In
such applications, however, the position of thecorresponding electrode has to be well determined [4].Fig. 1: Labels for points according to 10-20 electrodeplacement system.The Fig. 1 represent a label points, A = Earlobe, C =central, Pg = nasopharyngeal, P = parietal, F = frontal,Fp = frontal polar, O =occipital. The positions aredetermined by dividing the skull into perimeters byconnecting few reference points on human head.Reference points are notation, which is at the top ofthe nose; level with the eyes, and inions, place on themiddle on the back of the head. From these points, theskull perimeters are measured in the transverse andmedian planes. Electrode locations are determined bydividing these perimeters into 10% and 20% intervals.2.5 EEG Recording TechniquesIn conventional scalp EEG, the recording is obtainedby placing electrodes on the scalp with a conductivegel or paste, usually after preparing the scalp area bylight to reduce impedance due to dead skin cells.Many systems typically use electrodes, each of whichis attached to an individual wire. Some systems usecaps or nets into which electrodes are embedded; thisis particularly common when high-density arrays ofelectrodes are needed. Electrode locations and namesare specified by the international 10–20 system formost clinical and research applications. This systemensures that the naming of electrodes is consistentacross laboratories. In most clinical applications, 19recording electrodes are used. A smaller number ofelectrodes are typically used when recording EEGfrom neonates. Additional electrodes can be added tothe standard set-up when a clinical or researchapplication demands increased spatial resolution for aparticular area of the brain. High-density arrays cancontain up to 256 electrodes more-or-less evenlyspaced around the scalp. Each electrode is connectedto one input of a differential amplifier; a commonsystem reference electrode is connected to the otherinput of each differential amplifier. These amplifiersamplify the voltage between the active electrode andthe reference (typically 1,000–100,000 times, or60–100 dB of voltage gain). Most EEG systems thesedays, however, are digital, and the amplified signal isdigitized via an analog-to-digital converter, after beingpassed through an anti-aliasing filter [13, 20].2.5.1 Recording Electrodes The EEG recording electrodes and their properfunction are critical for acquiring appropriately highquality data for interpretation. Many types ofelectrodes exist, often with different characteristics.Basically there are four types of electrodes are usednamely disposable electrodes, reusable discelectrodes, headbands and electrodes caps, saline
Webmedcentral > Research articles Page 5 of 22
WMC001193 Downloaded from http://www.webmedcentral.com on 22-Dec-2011, 12:01:34 PM
based electrode –needle electrodes. The EEGrecording can last from anything between 15 minutesto 1 hour or longer depending on the situation.Typically the patient will be lying down or sittingrelaxed in a chair. Most of the recording is taken withthe eyes closed, although the patient will be frequentlyasked to open them for short periods. As it is knownfrom tomography different brain areas may be relatedto different functions of the brain. Each scalp electrodeis located near certain brain centers, e.g. F7 is locatednear centres for rational activities, Fz near intentionaland motivational centers, F8 close to sources ofemotional impulses. Cortex around C3, C4, and Czlocations deals with sensory and motor functions.However the scalp electrodes may not reflect theparticular areas of cortex, as the exact location of theactive sources is still open problem due to limitationscaused by the non-homogeneous properties of theskull, different orientation of the cortex sources,coherences between the sources. High impedancecan lead to distortions which can be difficult toseparate from actual signal. It may allow inducingoutside electric frequencies on the wires used or onthe body. Impedance monitors are built in somecommercially available EEG devices. In order toprevent signal distortions impedances at eachelectrode contact practically, impedance of the wholecircuit comprising two electrodes is measured, but builtin impedance checks usually display results alreadydivided by two. Physical references can be chosen asvertex (Cz), linked-ears, linked-mastoids, contralateral-ear, C7 reference, bipolar references, and tip ofthe nose. Reference-free techniques are representedby common average reference, weighted averagereference, and source derivation. Each technique hasits own set of advantages and disadvantages. Thechoice of reference may produce topographicdistortion if relatively electrically neutral area is notemployed [13, 20].2.5.2 Amplifiers and FiltersThe signals need to be amplified to make themcompatible with devices such as displays, recorders,or A/D converters. Amplifiers adequate to measurethese signals have to satisfy very specif icrequirements. They have to provide amplificationselective to the physiological signal, rejectsuperimposed noise and interference signals, andguarantee protection from damages through voltageand current surges for both patients and electronicequipment. The basic requirements that a biopotentialamplifier has to satisfy are: i) the physiological processto be monitored should not be influenced in any wayby the amplifier, ii) The measured signal should not bedistorted, iii) the amplifier should provide the best
possible separation of signal and interferences, and iv)the amplifier has to offer protection of the patient fromany hazard of electric shock.Proper design of the amplifier provides rejection of alarge portion of the signal interferences. The desiredbiopotential appears as the differential signal betweenthe two input terminals of the differential amplifier. Theamplifier gain is the ratio of the output signal to theinput signal. In order to provide optimum signal qualityand adequate voltage level for further signalprocessing, the amplifier has to provide a gain of100-100,000 and needs to maintain the best possiblesignal-to-noise ratio. In order to decrease an impact ofelectrically noisy environment differential amplifiersmust have high common-mode rejection ratios (atleast 100 dB) and high input impedance (at least 100M Ohms). The common-mode rejection ratio is theratio of the gain of differential mode over the gain ofthe common mode. When computers are used asrecording devices, channels of analog signal arerepeatedly sampled at a fixed time interval and eachsample is converted into a digital representation by ananalog- to-digital (A/D) converter. The A/D converter isinterfaced to a computer system so that each samplecan be saved in the computer’s memory [13, 20].2.5.3 ArtifactsAmong basic evaluation of the EEG traces belongsscanning for signal distortions called artifacts. Usuallyit is a sequence with higher amplitude and differentshape in comparison to signal sequences that doesn’tsuffer by any large contamination. The artifacts in therecorded EEG may be either patient-related ortechnical. Patient-related artifacts are unwantedphysiological signals that may significantly disturb theEEG. Technical artifacts, such as AC power line noise,can be decreased by decreasing electrode impedanceand by shorter electrode wires. The most commonEEG artifact sources can be classified in two minorbody movements such as EMG, ECG, eye movementand sweating. Secondly 50/60 Hz, impedancefluctuation, cable movement broken wires contact, lowbattery, too much electrode.Excluding the artifacts segments from the EEG tracescan be managed by the trained experts orautomatically. For better discrimination of differentphysiological artifacts, additional electrodes formonitoring eye movement, ECG and muscle activitymay be important. For multichannel montages,electrode caps are preferred, with number ofelectrodes installed on its surface commonly usedscalp electrodes consist of Ag-AgCl disks, 1 to 3 mmin diameter, with long flexible leads that can beplugged into an amplifier. AgCl electrodes canaccurately record also very slow changes in potential.
Webmedcentral > Research articles Page 6 of 22
WMC001193 Downloaded from http://www.webmedcentral.com on 22-Dec-2011, 12:01:34 PM
Needle electrodes are used for long recordings andare invasively inserted under the scalp [11].2.5.4 EEG analysis and clinical useThe EEG reports consist of a number of differentsections. The recordist may prepare a reportdescribing the type of activity seen in the recordtogether with changes produced by deep breathingand photic stimulation. With an increase in the numberof long recordings being carried out, manydepartments make use of detection algorithms such asspike and seizure detection. Although it is stillnecessary for the clinician to review the completerecord, such programmers will mark and highlightsections of interest. The most efficient method ofimplementing these algorithms is for the detection tobe carried out on-line. Other methods of analyzingEEG data include power spectrum analysis. A FastFourier Transform (FFT) is performed on sections ofEEG data to determine the power content of the fourmain frequency bands. The resulting waveforms canbe displayed as a brain map which will show the scalpdistribution of the power within each frequency band.The amplitude of the different waveforms at a singlepoint can also be displayed in a similar format. Thistype of display provides a more objective analysis ofthe EEG activity compared to a subjective visualanalysis by a physician. Simultaneous videomonitoring of the patient during the EEG recording isbecoming more popular. It allows the physician toclosely correlate EEG waveforms with the patient’sactivity and may help produce a more accuratediagnosis. The EEG is frequently used in the investigation ofsleep disorders especially sleep apnoea. EEG activitytogether with other physiological signals such as heartrate, airflow, respiration, oxygen saturation and limbmovement are measured simultaneously. Theserecordings are usually carried out overnight althoughsome sleep studies can be carried out in thedepartment during the day under strictly controlledconditions. A routine clinical EEG recording typicallylasts 20–30 minutes and usually involves recordingfrom scalp electrodes. Routine EEG is typically uses inthe clinical circumstances like; i) To distinguishepileptic seizures from other types of spells, such aspsychogenic non- epileptic seizures, syncope,sub-cortical movement disorders and migrainevariants, ii) to differentiate organic encephalopathy ordelirium from primary psychiatric syndromes such ascatatonia , and iii) to serve as an adjunct test of braindeath. At times, a routine EEG is not sufficient,particularly when it is necessary to record a patientwhile he/she is having a seizure [13, 20].2.6 Representation of the EEG Channel
The combination of all electrodes with reference andground this representation of electrode is calledmontage [13].Bipolar Montage Each channel represents the difference between twoadjacent electrodes. The entire montage consists of aseries of these channels. For example, the channelFp1-F3 represents the difference in voltage betweenthe Fp1 electrode and the F3 electrode. The nextchannel in the montage, F3-C3, represents the voltagedifference between F3 and C3, and so on through theentire array of electrodes. EEG machines use adifferential amplifier to produce each channel or traceof activity. Each amplifier has two inputs. An electrodeis connected to each of the inputs. Differentialamplifiers measure the voltage difference between thetwo signals at each of its inputs. The resulting signal isamplified and then displayed as a channel of EEGactivity.Referential Montage Each channel represents the difference between acertain electrode and a designated reference electrode.There is no standard position for this reference; it is,however, at a different position than the recordingelectrodes. Midline positions are often used becausethey do not amplify the signal in one hemisphere vs.the other. Another popular reference is linked ears,which is a physical or mathematical average ofelectrodes attached to both earlobes and mastoids.Average Reference Montage The outputs of all of the amplifiers are summed andaveraged and this averaged signal is used as thecommon reference for each channel. Averagereference derivation activity from all the electrodes aremeasured, summed together and averaged beforebeing passed through a high value resistor. Theresulting signal is then used as a reference electrodeand connected to input 2 of each amplifier and isessentially inactive. All EEG systems will allow theuser to choose which electrodes are to be included inthis calculation.Fig. 2:- Average reference derivationLaplacian MontageEach channel represents the difference between anelectrode and a weighted average of the surroundingelectrode. When analog EEG is used, the technologistswitches between montages during the recording inorder to highlight or better characterize certainfeatures of the EEG [13].2.7 Principle of EEG DiagnosisThe EEG signal is closely related to the level ofconsciousness of the person. As the activity increases,the EEG shifts to higher dominating frequency andlower amplitude. When the eyes are closed, the alpha
Webmedcentral > Research articles Page 7 of 22
WMC001193 Downloaded from http://www.webmedcentral.com on 22-Dec-2011, 12:01:34 PM
waves begin to dominate the EEG. When the personfalls asleep, the dominant EEG frequency decreases.In a certain phase of sleep, rapid eye movement called(REM) sleep, the person dreams and has activemovements of the eyes, which can be seen as acharacteristic EEG signal. In deep sleep, the EEG haslarge and slow deflections called delta waves. Nocerebral activity can be detected from a patient withcomplete cerebral death. Fig. 3 shows various EEGactivities [13].Fig. 3: EEG activity is dependent on the level ofconsciousness.3 THE PROPOSED EEG SIGNAL ANALYSISSCHEMESEEG signals are the signatures of neural activities.They are captured by multiple-electrode EEGmachines either from inside the brain, over the cortexunder the skull, or certain locations over the scalp andcan be recorded in different formats. The signals arenormally presented in the time domain, but many newEEG machines are capable of applying simple signalprocessing tools such as the Fourier transform toperform frequency analysis and equipped with someimaging tools to visualize EEG topographies. Therehave been many algorithms developed so far forprocessing EEG signals. The operations include, butare not l imi ted to, t ime-domain analysis,frequency-domain analysis, spatial-domain analysis,and multiway processing. Also, several algorithmshave been developed to visualize the brain activityfrom images reconstructed from only the EEGs.Separation of the desired sources from themultisensor EEGs has been another research area.This can later lead to the detection of brainabnormalities such as epilepsy and the sourcesrelated to various physical and mental activities.Spectral estimation helps in finding the pulse rhythmspresent in the EEG signal. The short segment of EEGdata is analyzed for spectral parameters such aslocation and amount of spectral energy. The mainobjective of using prediction methods is to find a set ofmodel parameters that best describe the signalgeneration system. Such models generally require anoise-type input. We need wavelet transform (WT) toanalyze non-stationary signals, i.e., whose frequencyresponse varies in time. Fourier transform (FT) is notsuitable for non-stationary signals; wavelet transformdecomposes a signal onto a set of basis functionscalled wavelets. The proposed work uses fast Fouriertransform and ICA for the analysis of ECG brainsignals.3.1 Fast Fourier Transform (FFT)Mathematical transformations are applied to signals toobtain further information from that signal time-domain
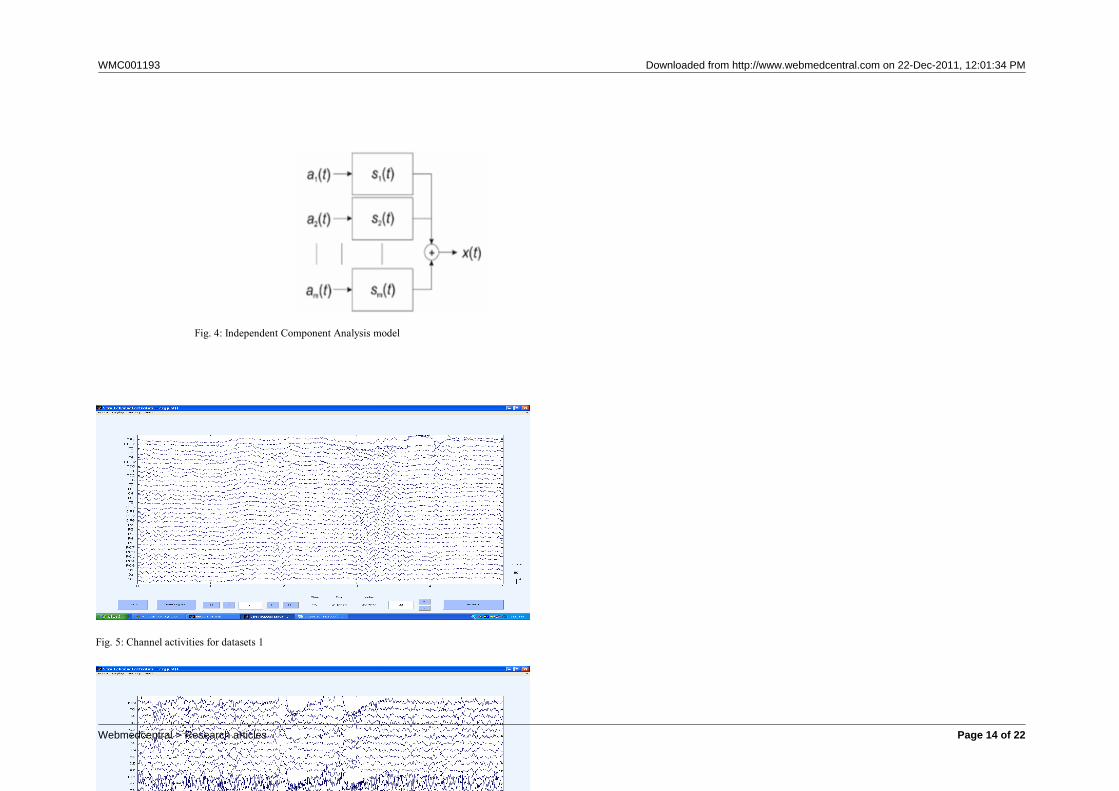
signal as a raw signal and a signal that has beentransformed by any of the available mathematicaltransformations as a processed sign almost of thesignals in practice, are time-domain signals in theirraw format. That is, whatever that signal is measuring,is a function of time. In other words, when we plot thesignal one of the axes is time (independent variable),and the other (dependent variable) is usually theamplitude. When we plot time-domain signals, weobtain a time-amplitude representation of the signal.This representation is not always the bestrepresentation of the signal for most signal processingrelated applications. In many cases, the mostdistinguished information is hidden in the frequencycontent of the signal. The frequency spectrum of asignal is basically the frequency components of thatsignal. The frequency spectrum of a signal showswhat frequencies exist in the signal. Spectral analysisof a signal involves decomposition of the signal into itsfrequency components. In other words, the originalsignal can be separated into its sub spectralcomponents by using spectral analysis methods.Among spectral analysis techniques, Fourier transformis considered to be the best transformation betweentime and frequency domains because of it being timeshift invariant. The Fourier transform pairs areexpressed as. Let x0... xN-1 be complex numbers.The DFT is defined by the formulaWhere and N = Length x(n)This means that by using Fourier transform, thefrequency components that the EEG signal includescan be estimated. The peak frequency bands of thesepeaks may indicate a pathological case such asepilepsy, tumors [22].3.2 independent Component Analysis (ICA)Independent component analysis (ICA) is a relativelyrecent method for blind source separation (BSS),which has shown to outperform the classical principalcomponent analysis (PCA) in many applications. Inparticular, it has been applied for the extraction ofocular artifacts from the EEG, where principal PCAcould not separate eye artifacts from brain signals,especially when they have comparable amplitudes ICAperforms BSS of statistically independent sources,assuming linear mixing of the sources at the sensors,generally using techniques involving higher-orderstatistics or temporal decorrelation. In the standard,noise free, formulation of the ICA problem,Fig. 4: Independent Component Analysis modelIn Fig. 4 its observed signals x(t) are assumed to be alinear mixture of an equal number of unknown butstatistically independent source signals s(t), i.e., ICAassumes the existence of n signals that are linearmixtures of m unknown independent source signals. At
Webmedcentral > Research articles Page 8 of 22
WMC001193 Downloaded from http://www.webmedcentral.com on 22-Dec-2011, 12:01:34 PM
time instant i, the observed n-dimensional data vectorx (i) = [x1(i)...Xn(i)]T is given by the modelWhere x(i ) = As(i)
where both the independent source signals s(i) =[s1(i)...sm(i)] and the mixing matrix A = [akj] areunknown. Other conditions for the existence of asolution are (1) n =m (there are at least as manymixtures as the number of independent sources), and(2) up to one source may be Gaussian. Under theseassumptions, the ICA seeks a solution of the formsˆ(i) = Bx(i)Where B is called the separating matrix.ICA separates EEG signals including artifacts intoindependent components based on the characteristicsof the data, without relying on the availability of one ormore clean reference channels for each type of artifact.This avoids the problem of mutual contaminationbetween regressing and regressed channels.ICA-based artifact removal can preserve all of therecorded tr ia ls, a crucial advantage overrejection-based methods when limited data areavailable, or when blinks and muscle movementsoccur too frequently, as in some subject groups.Unlike regression methods, ICA-based artifact removalcan preserve data at all scalp channels, includingfrontal sites [8].3.4 Overview of EEGLABEEGLAB is an interactive matlab toolbox forprocessing continuous and event-related EEG, MEGand other electrophysiological data incorporating ICA,time/frequency analysis, artifact rejection,event-related statistics, and several useful modes ofvisualization of the averaged and single-trial data.EEGLAB provides an interactive graphic user interface(GUI) allowing users to flexibly and interactivelyprocess their high-density EEG and other dynamicbrain data using (ICA) and/or time/frequency analysis(TFA), as well as standard averaging methods.EEGLAB offers a wealth of methods for visualizingand modeling event-related brain dynamics, both atthe level of individual EEGLAB 'datasets' and/oracross a collection of datasets brought together in anEEGLAB study set [5]
Results
2 RESULTS4.1 Datasets and Channel ActivitiesTwo datasets are shown in Table1 and Table 2 whichare acquired from SVS Medical College, Hyderabad,India. The outcomes of these data sets when loadedto EEGLAB are shown in Fig. 5 and Fig. 6. Table1:
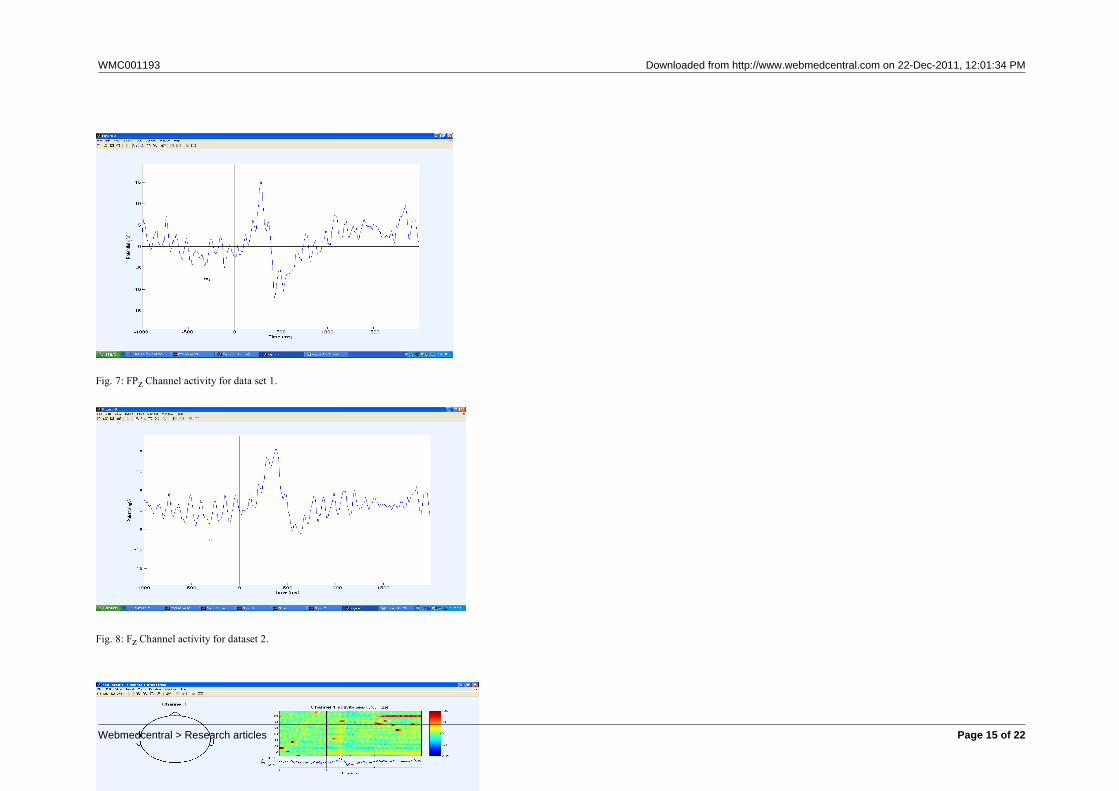
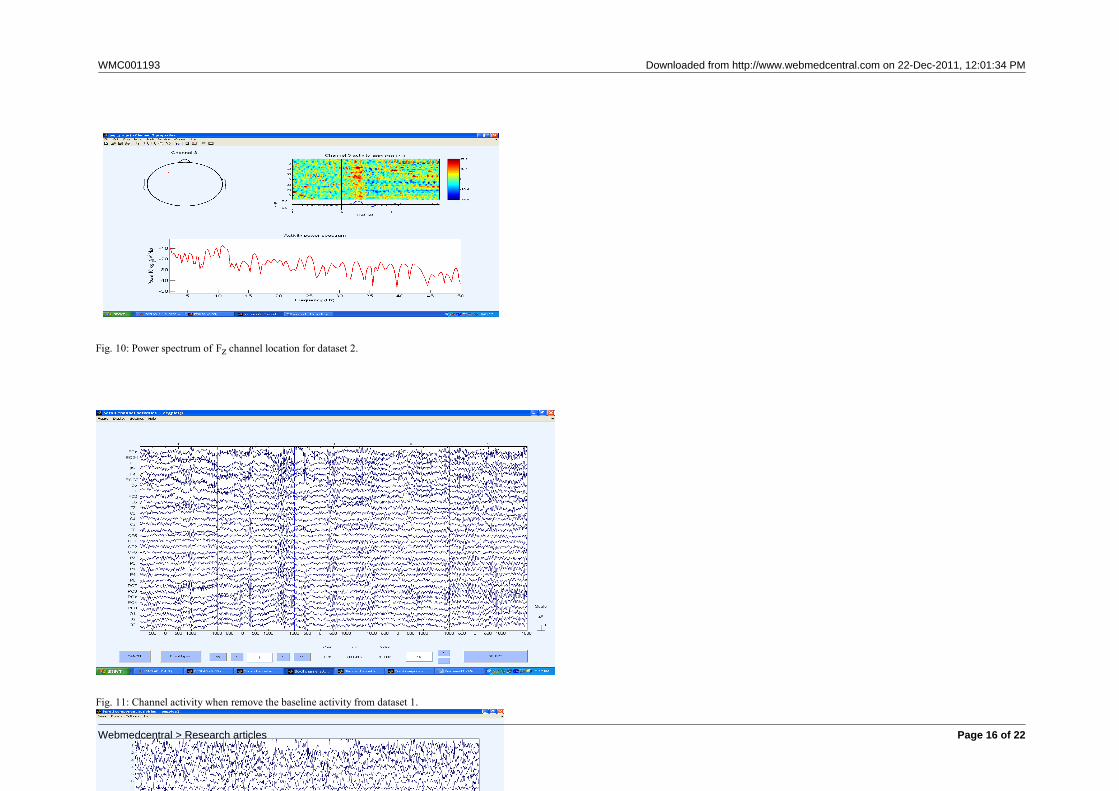
Data set 1 of visual attention task. Table 2:- Data set 2of mental task.Fig. 5: Channel activities for datasets 1Fig. 6: Channel activities for datasets 24.2 Channel Location SelectionElectrode location are placed according the 10- 20system. The earlobe electrodes called A1 and A2,connected respectively to the left and right earlobes,are used as the reference electrodes. The 10–20system avoids both eyeball placement and considerssome constant distances by using specific anatomiclandmarks from which the measurement would bemade and then uses 10 or 20% of that specifieddistance as the electrode interval.Fig. 7: FPz Channel activity for data set 1.Fig. 8: Fz Channel activity for dataset 2.To analyses and detect the component of eye blink indataset 1and dataset 2 for FPz and Fz channellocation is consider. Fig. 7 and Fig. 8 shows EEGsignal of these channel location in time domain and-1000 ms to 0 ms is baseline state and 0 ms to 500 msare the time period of visual attention and mentalprocess. 4.3 Results of FFTA Fourier Transform is performed on the section ofEEG data to determine the power content of thefrequency band .The resulting waveform can bedisplayed as a brain map which will shows the scalpdistribution of the power within each frequency bandand the frequency component that the EEG signalinclude can de estimated. Fig. 9 and Fig. 10 shows thepower spectrum of FPz and Fz channel location and tostudy the power spectrum for both location ,there issharp edges in frequency band ,its indicate the eyecomponent is present during the attention and mentaltask process.Fig. 9: Power spectrum of FPz channel location fordataset 1.Fig. 10: Power spectrum of Fz channel location fordataset 2.4.4 Results of ICAICA performs the blind source separation ofstatistically independent source and its assume theneural activity contributing to EEG signal are thespatially stationary through time and its ICAdecompose at 32 and 21 scalp electrodecorresponding to the sources for dataset 1 and dataset2. Fig. 11 and Fig. 12 show the channel activities ofdataset 1 and dataset 2 after removing the baselineactivity from the datasets. Fig. 11: Channel activity when remove the baselineactivity from dataset 1.Fig. 12: Channel activity when remove the baselineactivity from data set 2.
Webmedcentral > Research articles Page 9 of 22
WMC001193 Downloaded from http://www.webmedcentral.com on 22-Dec-2011, 12:01:34 PM
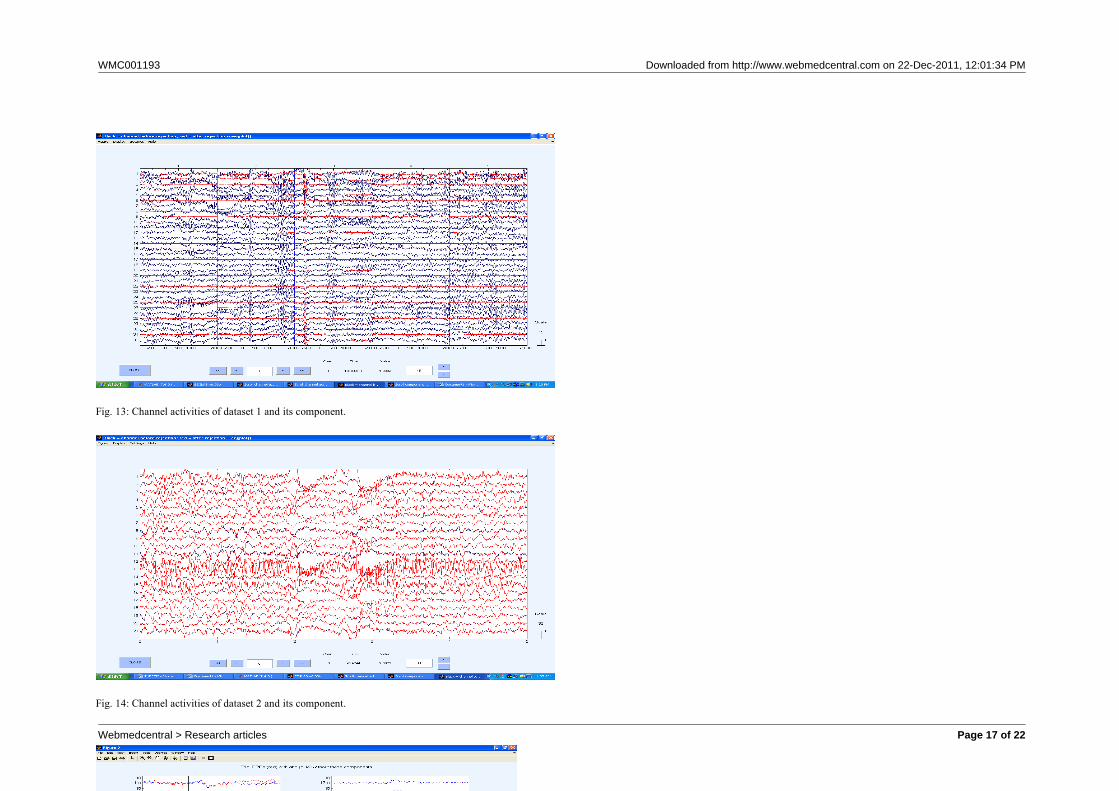
4.4.1 Datasets with its Independent ComponentsSimulation shows that ICA derives a componentaccounting for their joint occurrence and separatecomponent accounting for their period of activation.Fig. 13 and Fig. 14 shows Channel activities when weapply the ICA algorithm for dataset 1 and dataset 2, itsremoves the independent component from the dataand shown as red in Fig. 13 and Fig. 14.Fig. 13: Channel activities of dataset 1 and itscomponent.Fig. 14: Channel activities of dataset 2 and itscomponent.4.4.2 Event Related Potential
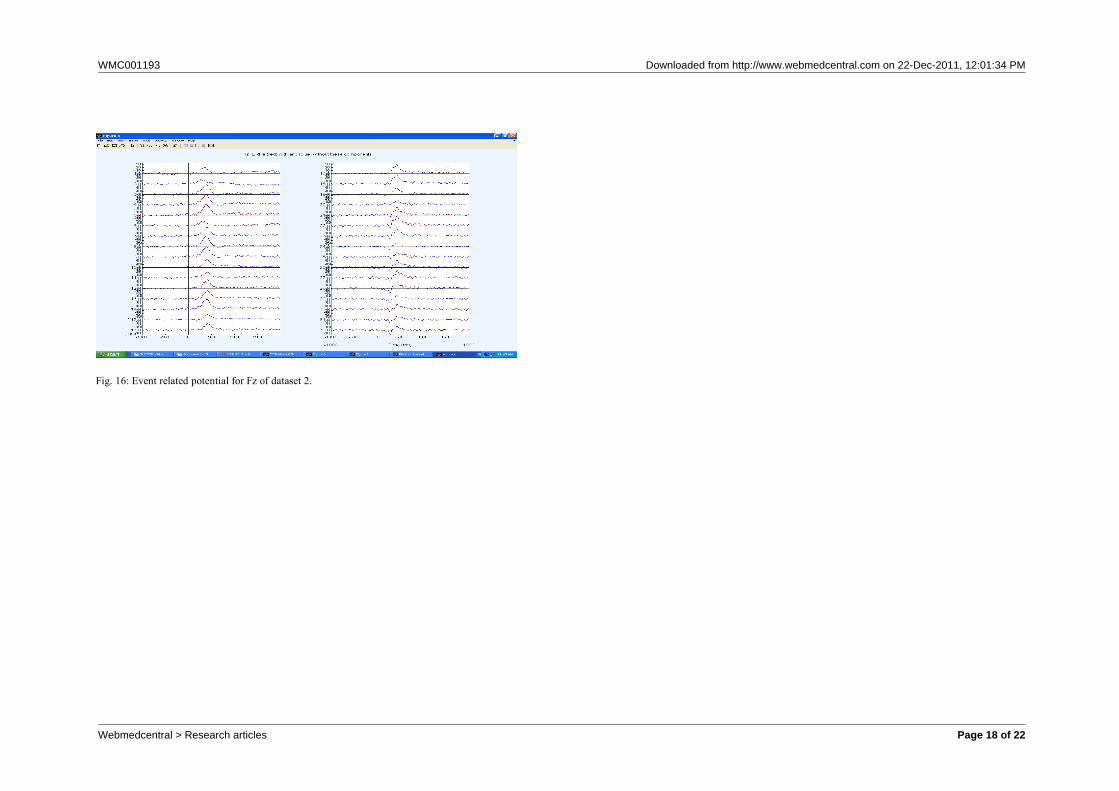
Simulation result shows the amplitude of ERPcomponent much smaller than spontaneous EEGcomponent and it’s reflecting only stimulus processingactivity. Fig. 15 and Fig. 16 shows the event relatedpotential for channel location FPz and Fz and itsshows trail ERP with eye component in EEG patternfrom dataset 1 and dataset 2.
Fig. 15: Event related potential for FPz of dataset 1.
Fig. 16: Event related potential for Fz of dataset 2.
Conclusions
Electroencephalography belongs to electro biologicalimaging tools which is widely used in medical andresearch areas. Signal processing and machinelearning based method play crucial role in moderncognitive neuroscience research for betterunderstanding of various brain function such ascognitive, emotion, memory and attention. EEG basedmeasurement is most common used due to its goodtemporal resolution, low cost and non invasive but dueto the noisy and non stationary and non linearcharacteristics of these function is a higher challengingjob automated computerized analysis of these signalhas great advantage in medical diagnostic as well asrehabilitation engineering for designing brain computerinterface system. The advances signal processingtechniques has been used for detection andseparation of brain signals. The Fourier Transform isused to detect the brain activities in power spectrumand analysis of the EEG pattern whiles its fail toseparate the component like eye blinking. Toovercome this problem another technique independentcomponent analysis is used to separate accurately theeye blink component in the channel location in FPz andFz position. Localization of brain signal sources isanother direction of further future research. This maybe achieved by developing new algorithm for the
localization of the sources with in the brain and tovisualize and understand the macroscopic braindynamics.
Acknowledgement(s)
Authors wish to thank to SVS Medical College,Hyderabad, India for providing us to use the datasets.
Authors Contribution(s)
Tested and compared two methods for ECG brainsignals.
References
[1] F. S. Tyner, J. R.Knott,” Fundamentals of EEGtechnology, Volume 1: Basic concepts and methods”,Raven press, New York 1990.[2] S. Teplan, “fundamentals of EEG measurement”,Institute of Measurement Science, Slovak Academy ofSciences Slovaki 12, 1745-1758, 2000[3] M. Shaker “EEG Waves Classifier using WaveletTransform and Fourier Transform” Department ofElectrical Engineering, National Institute of Technology, Calicut, 10, 127-152, 1998.[4] S. Sanei and J. A. Chambers, “EEG SignalProcessing”, Wiley - Interscience, 2007.[5] A, Makeig, “EEGLAB: an open source toolbox foranalysis of single-trial EEG dynamics includingindependent component analysis.” ClinicalNeurophysiology, 11(10):17-19, 2003.[6] T. P., Makeig, J.Courchesne, “Removal of eyeactivity artifacts from visual Event-related potentials innorma l and c l in i ca l sub jec ts ” , C l in i ca lNeurophysiology, 111(10):1745- 1758, 2000.[7] A. J. Karhunen, and E. Oja.,” IndependentComponent Analysis.” John Wiley, New York, 2001.[8] S .Bell, T.P .Sejnowski, "Independent componentanalysis Electroencephalographic data." Advances inNeural Information Processing Systems 8, 145-151,2002.[9] T.W. Picton et. al. “Guidelines for usingevent-related potentials to study cognition: Recordingstandards and publication criteria”. Psychophysiology37, 127-152, 2000.[10] C. Lee, T. McKeown, MJ,"RemovingElectroencephalographic Artifacts by Blind So Table2:- Data Sets of mental task Separat ion,"Psychophysiology 37, 63-78, 2000[11 ] T .P Jung , S . Make ig , "Remov ing
Webmedcentral > Research articles Page 10 of 22
WMC001193 Downloaded from http://www.webmedcentral.com on 22-Dec-2011, 12:01:34 PM
Electroencephalographic Artifacts: Comparison Between ICA and PCA", In: Neural Networks forSignal Processing VIII, 63- 72, 1998.[12] M. A Arserim, “The Estimation of Brain Signalswith Modern Spectral Analysis Methods”, MasterThesis, Diyarbakir, Turkey, 2001.[13] H.N. Nagel, Biopotential Amplifiers. In: J.D.Bronzino ed. The Biomedical EngeneeringHandbook, pp. 1185-1195, CRC Press, Florida 1998.[14] L. A. Farwell and E. Donchin. “Talking off the topof your head: Toward a mental prosthesis utilizinge v e n t - r e l a t e d b r a i n p o t e n t i a l s ” ,Electroencephalography and Clinical Neurophysiology,70:510–523, 1988.[15] S. Gevins. “Overview of computer analysis”.,Methods of Analysis of Brain Electrical and MagneticSignals, volume 1 of EEG Handbook, chapter 3, pages31–83, Elsevier Science Publishers BiomedicalDivision, 1987.[16] J. G. Proakis and D. G.Manolakis. DigitalSignalProcessing. MacMillan,New York, 1992.[17] S. Uchida, J. D. March, “A Comparison ofPeriod.Lateral specialization of cognitive mode EEGfrequency analysis”, Psychophysiology, 11:567–578,1998.[18] N. Hazarika, J.Z. Chen, A.C. Tsoi and A.Sergejew, Classification of EEG signals using the wavelet transform, Signal Processing, 59 (1): 61–72,2004.[19] M. Unser and A. Aldroubi, A review of wavelets inbiomedical applications, Proceedings of the IEEE 84(4): 626–638, 2003.[20] R. Agarwal, J. Gotman, D. Flanagan and B.Rosenblatt, “Automatic EEG analysis during long-termmonitoring in the ICU”, Electroencephalography andClinical Neurophysiology 107 (1): 44–58.2005.[21] J. Ofhede, M. Thordstein, “Automatic classificationof background EEG activity in healthy andsickneonates”, Journal of Neural Engineering, 7: 1-12,2010.[22] W. James, A. Peter, “The Fast Fourier Transformand Its Applications”, IEEE Trans on Education, 12(1),1969.
Webmedcentral > Research articles Page 11 of 22

WMC001193 Downloaded from http://www.webmedcentral.com on 22-Dec-2011, 12:01:34 PM
1
Channel per frame 32Frame per epoch 3050Epoch 1Events 154Sampling rate 128HzEpoch start Time(sec.)
00.00
Epoch and time 238.305Average reference YesChannel Location YesICA weight YesChannel per frame 21Frame per epoch 150000Epoch 1Events 1Sampling rate 250Epoch start Time (sec.) 00.00Epoch and time 599.996Average reference yesChannel Location yesICA weight yes
Table1: Data set 1 of visual attention task. Table 2:- Data set 2 of mental task.
Illustrations
Illustration 1
table
Webmedcentral > Research articles Page 12 of 22
WMC001193 Downloaded from http://www.webmedcentral.com on 22-Dec-2011, 12:01:34 PM
1
Fig. 1: Labels for points according to 10-20 electrode placement system.
Fig. 2:- Average reference derivation
Fig. 3: EEG activity is dependent on the level of consciousness.
Illustration 2
fig.
Webmedcentral > Research articles Page 13 of 22
WMC001193 Downloaded from http://www.webmedcentral.com on 22-Dec-2011, 12:01:34 PM
2
Fig. 4: Independent Component Analysis model
Fig. 5: Channel activities for datasets 1
Fig. 6: Channel activities for datasets 2
Webmedcentral > Research articles Page 14 of 22
WMC001193 Downloaded from http://www.webmedcentral.com on 22-Dec-2011, 12:01:34 PM
3
Fig. 7: FPz Channel activity for data set 1.
Fig. 8: Fz Channel activity for dataset 2.
Fig. 9: Power spectrum of FPz channel location for dataset 1.
Webmedcentral > Research articles Page 15 of 22
WMC001193 Downloaded from http://www.webmedcentral.com on 22-Dec-2011, 12:01:34 PM
4
Fig. 10: Power spectrum of Fz channel location for dataset 2.
Fig. 11: Channel activity when remove the baseline activity from dataset 1.
Fig. 12: Channel activity when remove the baseline activity from data set 2.
Webmedcentral > Research articles Page 16 of 22
WMC001193 Downloaded from http://www.webmedcentral.com on 22-Dec-2011, 12:01:34 PM
5
Fig. 13: Channel activities of dataset 1 and its component.
Fig. 14: Channel activities of dataset 2 and its component.
Fig. 15: Event related potential for FPz of dataset 1.
Webmedcentral > Research articles Page 17 of 22
WMC001193 Downloaded from http://www.webmedcentral.com on 22-Dec-2011, 12:01:34 PM
6
Fig. 16: Event related potential for Fz of dataset 2.
Webmedcentral > Research articles Page 18 of 22

WMC001193 Downloaded from http://www.webmedcentral.com on 22-Dec-2011, 12:01:34 PM
DisclaimerThis article has been downloaded from WebmedCentral. With our unique author driven post publication peerreview, contents posted on this web portal do not undergo any prepublication peer or editorial review. It iscompletely the responsibility of the authors to ensure not only scientific and ethical standards of the manuscriptbut also its grammatical accuracy. Authors must ensure that they obtain all the necessary permissions beforesubmitting any information that requires obtaining a consent or approval from a third party. Authors should alsoensure not to submit any information which they do not have the copyright of or of which they have transferredthe copyrights to a third party.
Contents on WebmedCentral are purely for biomedical researchers and scientists. They are not meant to cater tothe needs of an individual patient. The web portal or any content(s) therein is neither designed to support, norreplace, the relationship that exists between a patient/site visitor and his/her physician. Your use of theWebmedCentral site and its contents is entirely at your own risk. We do not take any responsibility for any harmthat you may suffer or inflict on a third person by following the contents of this website.
Webmedcentral > Research articles Page 19 of 22
WMC001193 Downloaded from http://www.webmedcentral.com on 22-Dec-2011, 12:01:34 PM
Reviews
Review 1
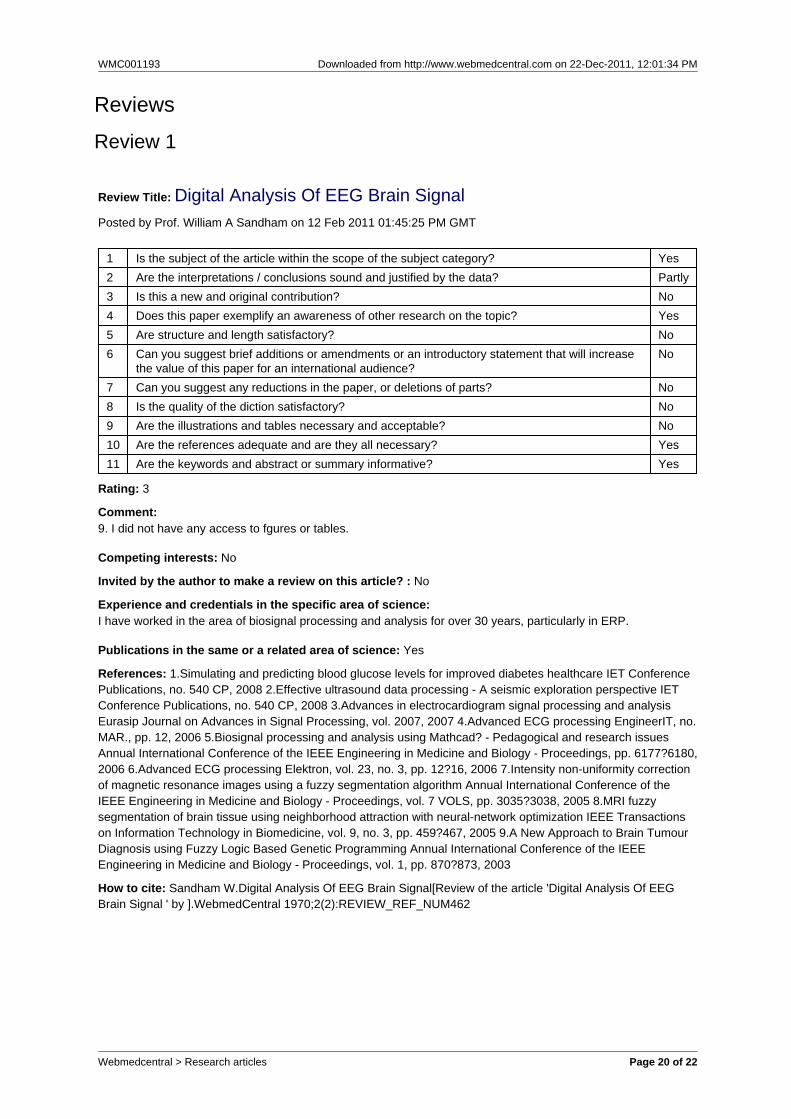
Review Title: Digital Analysis Of EEG Brain SignalPosted by Prof. William A Sandham on 12 Feb 2011 01:45:25 PM GMT
1 Is the subject of the article within the scope of the subject category? Yes
2 Are the interpretations / conclusions sound and justified by the data? Partly
3 Is this a new and original contribution? No
4 Does this paper exemplify an awareness of other research on the topic? Yes
5 Are structure and length satisfactory? No
6 Can you suggest brief additions or amendments or an introductory statement that will increasethe value of this paper for an international audience?
No
7 Can you suggest any reductions in the paper, or deletions of parts? No
8 Is the quality of the diction satisfactory? No
9 Are the illustrations and tables necessary and acceptable? No
10 Are the references adequate and are they all necessary? Yes
11 Are the keywords and abstract or summary informative? Yes
Rating: 3
Comment: 9. I did not have any access to fgures or tables.
Competing interests: No
Invited by the author to make a review on this article? : No
Experience and credentials in the specific area of science: I have worked in the area of biosignal processing and analysis for over 30 years, particularly in ERP.
Publications in the same or a related area of science: Yes
References: 1.Simulating and predicting blood glucose levels for improved diabetes healthcare IET ConferencePublications, no. 540 CP, 2008 2.Effective ultrasound data processing - A seismic exploration perspective IETConference Publications, no. 540 CP, 2008 3.Advances in electrocardiogram signal processing and analysisEurasip Journal on Advances in Signal Processing, vol. 2007, 2007 4.Advanced ECG processing EngineerIT, no.MAR., pp. 12, 2006 5.Biosignal processing and analysis using Mathcad? - Pedagogical and research issuesAnnual International Conference of the IEEE Engineering in Medicine and Biology - Proceedings, pp. 6177?6180,2006 6.Advanced ECG processing Elektron, vol. 23, no. 3, pp. 12?16, 2006 7.Intensity non-uniformity correctionof magnetic resonance images using a fuzzy segmentation algorithm Annual International Conference of theIEEE Engineering in Medicine and Biology - Proceedings, vol. 7 VOLS, pp. 3035?3038, 2005 8.MRI fuzzysegmentation of brain tissue using neighborhood attraction with neural-network optimization IEEE Transactionson Information Technology in Biomedicine, vol. 9, no. 3, pp. 459?467, 2005 9.A New Approach to Brain TumourDiagnosis using Fuzzy Logic Based Genetic Programming Annual International Conference of the IEEEEngineering in Medicine and Biology - Proceedings, vol. 1, pp. 870?873, 2003
How to cite: Sandham W.Digital Analysis Of EEG Brain Signal[Review of the article 'Digital Analysis Of EEGBrain Signal ' by ].WebmedCentral 1970;2(2):REVIEW_REF_NUM462
Webmedcentral > Research articles Page 20 of 22

WMC001193 Downloaded from http://www.webmedcentral.com on 22-Dec-2011, 12:01:34 PM
Review 2
Review Title: UntitledPosted by Dr. S.K. Chakarvarti on 21 Dec 2010 06:42:48 AM GMT
1 Is the subject of the article within the scope of the subject category? Yes
2 Are the interpretations / conclusions sound and justified by the data? Partly
3 Is this a new and original contribution? No
4 Does this paper exemplify an awareness of other research on the topic? Yes
5 Are structure and length satisfactory? No
6 Can you suggest brief additions or amendments or an introductory statement that will increasethe value of this paper for an international audience?
No
7 Can you suggest any reductions in the paper, or deletions of parts? No
8 Is the quality of the diction satisfactory? No
9 Are the illustrations and tables necessary and acceptable? No
10 Are the references adequate and are they all necessary? Yes
11 Are the keywords and abstract or summary informative? Yes
Rating: 0
Comment: 1.In the title, acronym “Eeg”should be replaced with”EEG”2. In the abstract, ‘Instead of electrical currents the voltage differences between different parts of the brain isobserved” ,should be corrected to “Instead of electrical currents the voltage differences between different parts ofthe brain are observed.”Similarly, the sentence “The former and latter is applied to single trail multi-channel EEGdata”, should be changed to “Both the techniques are applied to single trail multi-channel EEG data”.3.It is not appropriate to say that” Electroencephalography is a medical imaging technique that reads scalpelectrical activity generated by brain structures.’. Should be changed suitably and worded properly. 4.The entire text should be rechecked thoroughly for many grammatical corrections to be introduced.5. “The Fourier transform pairs are expressed as. Let x0... xN-1 be complex numbers. The DFT is defined by theformula Where and N = Length x(n)”Entire script above is incomplete and ambiguous. May be replaced properly.
Invited by the author to make a review on this article? : Yes
Publications in the same or a related area of science: No
How to cite: Chakarvarti S.Untitled[Review of the article 'Digital Analysis Of EEG Brain Signal ' by].WebmedCentral 1970;1(12):REVIEW_REF_NUM272
Webmedcentral > Research articles Page 21 of 22

WMC001193 Downloaded from http://www.webmedcentral.com on 22-Dec-2011, 12:01:34 PM
DisclaimerThis article has been downloaded from WebmedCentral. With our unique author driven post publication peerreview, contents posted on this web portal do not undergo any prepublication peer or editorial review. It iscompletely the responsibility of the authors to ensure not only scientific and ethical standards of the manuscriptbut also its grammatical accuracy. Authors must ensure that they obtain all the necessary permissions beforesubmitting any information that requires obtaining a consent or approval from a third party. Authors should alsoensure not to submit any information which they do not have the copyright of or of which they have transferredthe copyrights to a third party.
Contents on WebmedCentral are purely for biomedical researchers and scientists. They are not meant to cater tothe needs of an individual patient. The web portal or any content(s) therein is neither designed to support, norreplace, the relationship that exists between a patient/site visitor and his/her physician. Your use of theWebmedCentral site and its contents is entirely at your own risk. We do not take any responsibility for any harmthat you may suffer or inflict on a third person by following the contents of this website.
Webmedcentral > Research articles Page 22 of 22