Impact of Hydrodynamic Interaction Between Pontoons on ...
10
IMPACT OF HYDRODYNAMIC INTERACTION BETWEEN PONTOONS ON GLOBAL RESPONSES OF A LONG FLOATING BRIDGE UNDER WIND WAVES Xu Xiang Fjord-crossing Development Project Department, Norwegian Public Roads Administration, NPRA, Oslo, Norway Thomas Viuff Department of Marine Technology, Norwegian University of Science and Technology, NTNU, Trondheim, Norway Bernt Leira Department of Marine Technology, Norwegian University of Science and Technology, NTNU, Trondheim, Norway Ole Øiseth Department of Structural Engineering, Norwegian University of Science and Technology, NTNU, Trondheim, Norway ABSTRACT The hydrodynamic interaction between floating bridge pontoons and its impact on the bridge global responses are investigated in the current study. The global model for end-anchored floating bridge for Bjørnefjord crossing is modelled in ORCINA- OrcaFlex. Forty-six pontoons are used to support the bridge, with a centerline distance of 100m between two pontoons. Two models are setup for comparison: (1) The OrcaFlex model with hydrodynamic coefficients of pontoons without hydrodynamic interaction; (2) The OrcaFlex model with hydrodynamic interaction coefficients, which were calculated by ANSYS- AQWA. Firstly, a case study of hydrodynamic interaction effects on added mass, potential damping and diffraction force is given, showing that the piston and sloshing modes have strong correlation with the resonances. Then two sea states were run on the two models with and without hydrodynamic interaction effects. The first order wave effects are included in the analysis. The observed extremes of the time-domain bridge girder bending moments and motions were compared between two models. The comparison shows both reduction and increase of bridge responses depending on the wave directions. A sensitivity test of drag coefficients applied on the pontoon vertical motion is carried out as a rough examination of the neglected viscous damping on the hydrodynamic resonances. The viscous damping effects on the resonances should be further quantified. INTRODUCTION The Norwegian Public Roads Administration (NPRA) has been working on finding the best solutions of crossing the wide (up to 6000m) and deep (up to 1350m) Norwegian fjords along the Coastal Highway Route E39. Many research and engineering design activities are being carried out under the project framework. An earlier study of the floating project group has investigated the impact of viscous damping from a eigen-modes- tuning flange attached to the pontoons on the global bridge responses, Xiang, et. al. (2017). For the current study, the end- anchored floating bridge concept for the Bjørnafjord is investigated. A concept illustration of the bridge is Figure 1. Figure 1 Concept illustration of the end-anchored floating bridge crossing the Bjørnefjord; (Statens vegvesen, 2017) Figure 1 shows that the distances between floating pontoons are in the same order of the pontoon dimensions. In the design shown here the distance between the facing sides of pontoons is around Proceedings of the ASME 2018 37th International Conference on Ocean, Offshore and Arctic Engineering OMAE2018 June 17-22, 2018, Madrid, Spain OMAE2018-78625 1 Copyright © 2018 ASME Downloaded From: http://proceedings.asmedigitalcollection.asme.org on 11/14/2018 Terms of Use: http://www.asme.org/about-asme/terms-of-use
Transcript of Impact of Hydrodynamic Interaction Between Pontoons on ...

IMPACT OF HYDRODYNAMIC INTERACTION BETWEEN PONTOONS ON GLOBAL RESPONSES OF A LONG FLOATING BRIDGE UNDER WIND WAVES
Xu Xiang Fjord-crossing Development Project Department, Norwegian Public Roads Administration, NPRA,
Oslo, Norway
Thomas Viuff Department of Marine Technology, Norwegian University of Science and Technology, NTNU,
Trondheim, Norway
Bernt Leira Department of Marine Technology, Norwegian University of Science and Technology, NTNU,
Trondheim, Norway
Ole Øiseth Department of Structural Engineering, Norwegian
University of Science and Technology, NTNU, Trondheim, Norway
ABSTRACT
The hydrodynamic interaction between floating bridge pontoons and its impact on the bridge global responses are investigated in the current study. The global model for end-anchored floating bridge for Bjørnefjord crossing is modelled in ORCINA-OrcaFlex. Forty-six pontoons are used to support the bridge, with a centerline distance of 100m between two pontoons. Two models are setup for comparison: (1) The OrcaFlex model with hydrodynamic coefficients of pontoons without hydrodynamic interaction; (2) The OrcaFlex model with hydrodynamic interaction coefficients, which were calculated by ANSYS-AQWA. Firstly, a case study of hydrodynamic interaction effects on added mass, potential damping and diffraction force is given, showing that the piston and sloshing modes have strong correlation with the resonances. Then two sea states were run on the two models with and without hydrodynamic interaction effects. The first order wave effects are included in the analysis. The observed extremes of the time-domain bridge girder bending moments and motions were compared between two models. The comparison shows both reduction and increase of bridge responses depending on the wave directions. A sensitivity test of drag coefficients applied on the pontoon vertical motion is carried out as a rough examination of the neglected viscous damping on the hydrodynamic resonances. The viscous damping effects on the resonances should be further quantified.
INTRODUCTION
The Norwegian Public Roads Administration (NPRA) has been working on finding the best solutions of crossing the wide (up to
6000m) and deep (up to 1350m) Norwegian fjords along the Coastal Highway Route E39. Many research and engineering design activities are being carried out under the project framework. An earlier study of the floating project group has investigated the impact of viscous damping from a eigen-modes-tuning flange attached to the pontoons on the global bridge responses, Xiang, et. al. (2017). For the current study, the end-anchored floating bridge concept for the Bjørnafjord is investigated. A concept illustration of the bridge is Figure 1.
Figure 1 Concept illustration of the end-anchored floating bridge crossing the Bjørnefjord; (Statens vegvesen, 2017)
Figure 1 shows that the distances between floating pontoons are in the same order of the pontoon dimensions. In the design shown here the distance between the facing sides of pontoons is around
Proceedings of the ASME 2018 37th InternationalConference on Ocean, Offshore and Arctic Engineering
OMAE2018June 17-22, 2018, Madrid, Spain
OMAE2018-78625
1 Copyright © 2018 ASMEDownloaded From: http://proceedings.asmedigitalcollection.asme.org on 11/14/2018 Terms of Use: http://www.asme.org/about-asme/terms-of-use

85-90 meters. This means that the hydrodynamic interaction between the pontoons may not be neglected when simulating the global bridge responses under wave effects. This is the main topic of the current study. Many researchers have studied the hydrodynamic interaction between floaters and ships in the past 30 years. The 3-D boundary element method (BEM) research by Li (2001), Chen (2004), and Xiang (2007) presented successful application of frequency-domain analysis for hydrodynamic interaction between two ships either stationary or advancing in waves. Xiang and Faltinsen (2011) developed a time domain solution for the linear loads and motions of two parallel advancing ships in waves based on Rankine source distribution, which was validated with the experiments from Kashiwagi (2005) and Ronæss (2002). The resonant motion of the water field in the confined zone between two floating bodies should be specially addressed due to that potential flow theory neglects the viscous effects, thus, tends to overestimate the resonance fluid motions. It is more important when the two floaters have no forward speed. Numerically, Newman (2004) introduced an artificial lid method, and Chen (2004) introduced a free surface damping coefficient to the BEM equations. The application of an artificial lid and free surface damping should be supported by experimental input or CFD. The 2-D fully nonlinear numerical wave tank developed by Kristiansen and Faltinsen (2008, 2009) based on a ‘Green’s 2nd identity + inviscid vortex tracking method’ for resonant wave elevation between two hulls showed good agreement with experimental results. They concluded that flow separation is the main cause of discrepancy between the model test and linear potential theory. Seif and Inoue (1998) addressed the possible impact of hydrodynamic interaction between pontoons and its impact on the global response analysis of a floating bridge for a structure with dimensions of Bergsøysund bridge in Norway. Even though no hydrodynamic coefficients with interaction were applied in their analysis of global bridge responses, the authors pointed out that the issue should be further addressed. Fu et. al. (2017) has proposed a method to investigate the floating bridge under inhomogeneous environmental conditions. They have divided a floating bridge to a multibody system in which motions of each pontoon are solved and further used as the input of the nodes motions in a beam structure that represents the bridge girder. Further, the influence of inhomogeneous conditions along the bridge has been investigated.
GLOBAL BRIDGE MODELLING AND ANALYSIS The end-anchored floating bridge across the Bjørnafjord has the following major structural elements:
Bridge girder (carriage way) Pontoons
Columns (between pontoons and bridge girder) Abutment South (south support of bridge) Cable-stayed bridge (tower, cables) Abutment North Filling and approach bridge North
In addition, an overview of the end-anchored floating bridge is shown in Figure 2. Figure 3 shows different types of pontoons used along floating bridge from Axis-3 to Axis-48. The largest pontoon, Axis-3, is designed taking into account the requirements from ship collision accidental limit state (ALS).
Figure 2 Overview of the end-anchored Bjørnefjord floating bridge; in the upper figure: the pontoon one starts from no. 3, in total 46 pontoons; in the lower figure: the curvature of the bridge in the horizontal plane (Statens vegvesen, 2017)
Figure 3 Four types pontoons along the bridge; from left: pontoon for Axis-3, Axis-4-6, Axis-7-12, Axis-13-48; dimensions are given in mm (Statens vegvesen, 2017)
Figure 4 Nomenclature for pontoons: the weak axis bending moment means the moment around y-axis of the bridge girder, and the pendulum motion of the pontoon refers to the surge motion as shown in the figure
2 Copyright © 2018 ASMEDownloaded From: http://proceedings.asmedigitalcollection.asme.org on 11/14/2018 Terms of Use: http://www.asme.org/about-asme/terms-of-use

A floating bridge segment including a pontoon, column and bridge deck shown in Figure 4 illustrates nomenclature for pontoon motions, local pontoon and bridge deck coordinate systems. The definition is different from systems commonly used by naval architects. The bridge deck coordinate system is used as the global system with the origin positioned at bridge deck on Axis-1 shown in Figure 2. The wave directions is defined relative the global system, thus the 180 degree means that the waves is going in the negative X-axis, and 90 degree the positive Y-axis. Figure 5 shows the wave direction with a wavy arrow in the XYZ system. In addition, in the following description, the weak axis bending moment refers to the moment around y-axis of the bridge girder, the strong axis bending moment refers to the moment around z-axis of the bridge girder.
Figure 5 The definition of wave direction under the floating bridge global system. Note that the origin of the XYZ system shown here does not represent its true position
HYDRODYNAMIC COEFFICIENTS FROM POTENTIAL FLOW SOLVER One basic input of the pontoon properties to the global analysis is the hydrodynamic coefficients. And this input is different for pontoons with or without hydrodynamic interaction effects. The potential flow theory is applied here for solving these coefficients. The coefficients will be further used by the global analysis of the whole bridge in OrcaFlex. Thus, it is important to make the coordinate systems used in the potential flow solver (AQWA) and global bridge solver (OrcaFlex) consistent. In this part we look into two issues:
A. Coordinate systems in AQWA for multibody analysis; B. Interaction effects shown by the added mass, potential
damping and excitation loads. Issue A: In the AQWA system, there is a common global coordinate system. The hydrodynamic coefficients of each body in a multibody analysis should not all refer to the global system, but this should be proved by test cases. It should be studied how the body-fixed coordinate systems for each pontoon are defined. The purpose of this check is to identify this issue.
A case study is setup. Table 1 includes two groups of pontoons. Group 1 includes two identical pontoons with parallel local coordinate systems, while group 2 includes two identical pontoons with un-parallel local coordinate systems. Considering that rotational added mass, damping coefficients and excitation loads are referring to a specific axis, group 1 can be used to test if the results are about the global coordinate system or the local coordinate system. In addition, group 2 can be used to test if the results are about the parallel translated local coordinate system or a rotated local coordinate system. Table 1 also presents the locations of the four pontoons in the global coordinate system, indicating that they are quite far away, and thus the hydrodynamic interaction effects are trivial.
Pontoon Geometry X Y Z Heading
(deg) Group
Axis-8 Axis-7-12 1269.1 -555.3 0 0 1
Axis-12 Axis-7-12 1657.7 -647.7 0 0 Axis-22 Axis-13-48 2651.6 -741.0 0 0.37 2 Axis-48 Axis-13-48 5131.7 -64.1 0 30.17 Table 1 Pontoons in the case setup for coordinate system check
The dimensional added mass coefficients A11 and A66 are given in Figure 6 and Figure 7. Figure 6 shows the calculated A11 for two groups of pontoons. It is seen that for pontoon group 2 the coefficients are different, which means that the local coordinate system is not rotating with the rotation of body, thus the local coordinate system should be parallel to the global system. Figure 7 shows the rotational added mass coefficients around z- axis. It is obvious that the pontoons in each group have identical A66 values. This proves that (1) The rotational mode quantities are referred to each body’s local system; (2) The hydrodynamic interaction between these bodies under given relative positions are negligible.
Figure 6 Added mass A11 for four pontoons for identifying the reference coordinate systems
3 Copyright © 2018 ASMEDownloaded From: http://proceedings.asmedigitalcollection.asme.org on 11/14/2018 Terms of Use: http://www.asme.org/about-asme/terms-of-use
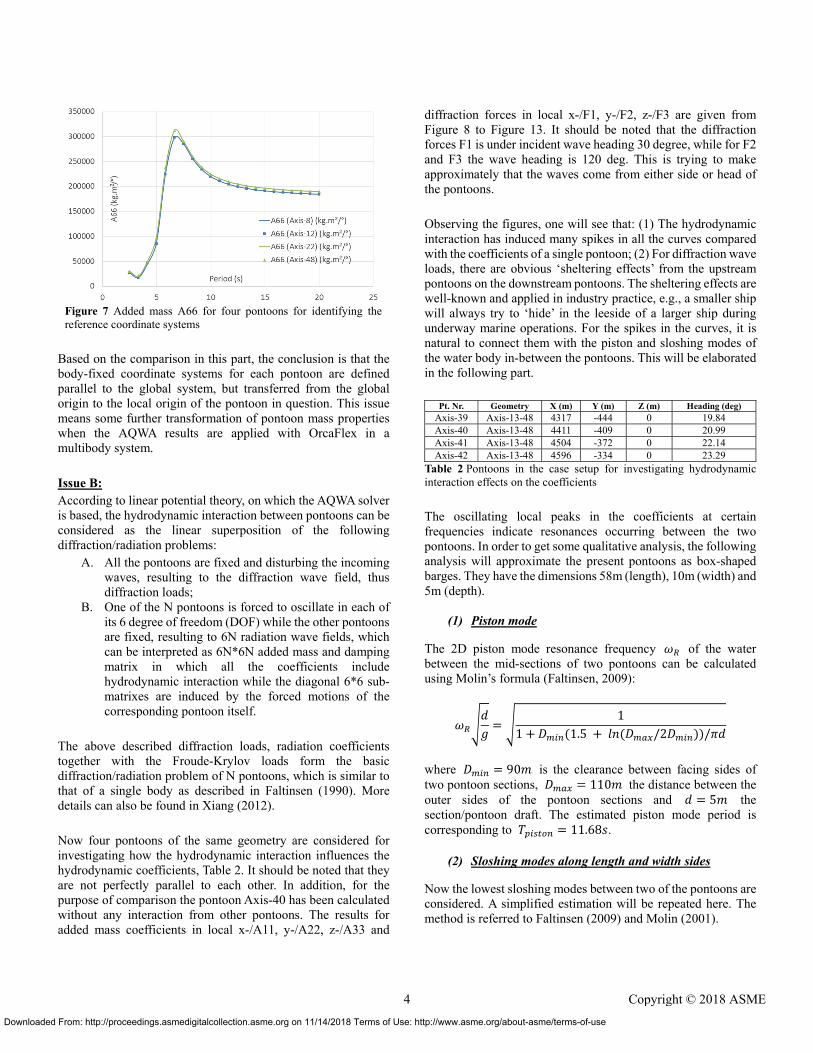
Figure 7 Added mass A66 for four pontoons for identifying the reference coordinate systems
Based on the comparison in this part, the conclusion is that the body-fixed coordinate systems for each pontoon are defined parallel to the global system, but transferred from the global origin to the local origin of the pontoon in question. This issue means some further transformation of pontoon mass properties when the AQWA results are applied with OrcaFlex in a multibody system. Issue B: According to linear potential theory, on which the AQWA solver is based, the hydrodynamic interaction between pontoons can be considered as the linear superposition of the following diffraction/radiation problems:
A. All the pontoons are fixed and disturbing the incoming waves, resulting to the diffraction wave field, thus diffraction loads;
B. One of the N pontoons is forced to oscillate in each of its 6 degree of freedom (DOF) while the other pontoons are fixed, resulting to 6N radiation wave fields, which can be interpreted as 6N*6N added mass and damping matrix in which all the coefficients include hydrodynamic interaction while the diagonal 6*6 sub-matrixes are induced by the forced motions of the corresponding pontoon itself.
The above described diffraction loads, radiation coefficients together with the Froude-Krylov loads form the basic diffraction/radiation problem of N pontoons, which is similar to that of a single body as described in Faltinsen (1990). More details can also be found in Xiang (2012). Now four pontoons of the same geometry are considered for investigating how the hydrodynamic interaction influences the hydrodynamic coefficients, Table 2. It should be noted that they are not perfectly parallel to each other. In addition, for the purpose of comparison the pontoon Axis-40 has been calculated without any interaction from other pontoons. The results for added mass coefficients in local x-/A11, y-/A22, z-/A33 and
diffraction forces in local x-/F1, y-/F2, z-/F3 are given from Figure 8 to Figure 13. It should be noted that the diffraction forces F1 is under incident wave heading 30 degree, while for F2 and F3 the wave heading is 120 deg. This is trying to make approximately that the waves come from either side or head of the pontoons. Observing the figures, one will see that: (1) The hydrodynamic interaction has induced many spikes in all the curves compared with the coefficients of a single pontoon; (2) For diffraction wave loads, there are obvious ‘sheltering effects’ from the upstream pontoons on the downstream pontoons. The sheltering effects are well-known and applied in industry practice, e.g., a smaller ship will always try to ‘hide’ in the leeside of a larger ship during underway marine operations. For the spikes in the curves, it is natural to connect them with the piston and sloshing modes of the water body in-between the pontoons. This will be elaborated in the following part.
Pt. Nr. Geometry X (m) Y (m) Z (m) Heading (deg) Axis-39 Axis-13-48 4317 -444 0 19.84 Axis-40 Axis-13-48 4411 -409 0 20.99 Axis-41 Axis-13-48 4504 -372 0 22.14 Axis-42 Axis-13-48 4596 -334 0 23.29
Table 2 Pontoons in the case setup for investigating hydrodynamic interaction effects on the coefficients
The oscillating local peaks in the coefficients at certain frequencies indicate resonances occurring between the two pontoons. In order to get some qualitative analysis, the following analysis will approximate the present pontoons as box-shaped barges. They have the dimensions 58m (length), 10m (width) and 5m (depth).
(1) Piston mode
The 2D piston mode resonance frequency of the water between the mid-sections of two pontoons can be calculated using Molin’s formula (Faltinsen, 2009):
11 1.5 /2 /
where 90 is the clearance between facing sides of two pontoon sections, 110 the distance between the outer sides of the pontoon sections and 5 the section/pontoon draft. The estimated piston mode period is corresponding to 11.68 .
(2) Sloshing modes along length and width sides
Now the lowest sloshing modes between two of the pontoons are considered. A simplified estimation will be repeated here. The method is referred to Faltinsen (2009) and Molin (2001).
4 Copyright © 2018 ASMEDownloaded From: http://proceedings.asmedigitalcollection.asme.org on 11/14/2018 Terms of Use: http://www.asme.org/about-asme/terms-of-use

Firstly, the lowest sloshing modes along the pontoon length. Odd integer numbers of half sine waves along the length 58 satisfy the Dirichlet boundary condition at the open ends of the restricted water body. This means that the corresponding sloshing modes are:
, 3 , 5 , 7 … 2n 1 1,2,3. . Besides, we also give the estimation of lowest sloshing mode along the gap width 90 , corresponding one odd integer number of half cosine wave along the gap width:
, 3 , 5 , 7 … 2n 1 1,2,3. .
Mode No. 2D Longitudinal
Sloshing Modes (s) 2D Transverse
Sloshing Modes (s) 1 8.62 10.74 2 4.98 6.20 3 3.86 4.80 4 3.26 4.06 5 2.87 3.58 6 2.60 3.24 7 2.39 2.98
Piston mode (s) 11.68 Table 3 Estimated piston and sloshing modes of the restricted water body between two pontoons
The values for piston mode, lowest longitudinal and transverse sloshing modes are also marked as ‘+’ in all the figures showing the added mass and diffraction force RAOs. They are distributed over a wide range down from the piston mode. It can be observed that the spikes of curves reflect both the piston and sloshing modes, though it is difficult for us to conclude the clear relationship between the resonance modes and the peaks in the curves. This may be due to the fact that we have a relatively large gap, thus the 3D effects play a relatively important role and the simplified estimation is not sufficient. Further, the pontoons are with two circular ends in reality, which is different from the assumed two rectangular boxes. Also, one should pay attention to the fact that the force RAOs shown here are for diffraction forces, which should be added with the Froude Krylov force to form the excitation loads.
Figure 8 Added mass A11 of four interacting pontoons compared with a single pontoon Axis-39 under different periods (s)
Figure 9 Added mass A22 of four interacting pontoons compared with a single pontoon Axis-39 under different periods (s)
Figure 10 Added mass A33 of four interacting pontoons compared with a single pontoon Axis-39 under different periods (s)
Figure 11 Diffraction force F1 RAO of four interacting pontoons compared with a single pontoon Axis-39 under different periods (s)
Figure 12 Diffraction force F2 RAO of four interacting pontoons compared with a single pontoon Axis-39 under different periods (s)
5 Copyright © 2018 ASMEDownloaded From: http://proceedings.asmedigitalcollection.asme.org on 11/14/2018 Terms of Use: http://www.asme.org/about-asme/terms-of-use

Figure 13 Diffraction force F3 RAO of four interacting pontoons compared with a single pontoon Axis-39 under different periods (s)
IMPLEMENTATION OF INTERACTION EFFECTS IN THE GLOBAL ANALYSIS MODEL The added mass, potential damping and wave load coefficients from the BEM solver will be further used OrcaFlex for global bridge response analysis. In the model the pontoons are modelled as diffraction/radiation bodies, and the bridge girders, pontoon columns and bridge tower/stay cables are modelled as lines with the proposed cross section properties. More details about OrcaFlex modelling strategy are referred to the software user manual, Orcina (2018). For the cases studied here, only first order wave effects are included. The forty-six pontoons have been divided into three groups for BEM analysis of hydrodynamic interaction coefficients. This is due to two reasons:
(1) The problem size and accuracy in AQWA, which has a limitation of total panels around 30,000 (including the irregular-frequency removing internal lid panels); in addition, in the AQWA GUI it is not directly available for the user to use symmetry for reducing the computational cost, though this issue is not relevant for the hydrodynamic interaction problems.
(2) The limitation of OrcaFlex interaction group has a maximum number of 20 bodies per group. Figure 14 presents an example of part of the hydrodynamic interaction panel model.
Figure 14 Panel model in AQWA: the 46 pontoons are divided into 3 groups for calculating hydrodynamic interaction coefficients
The imported hydrodynamic coefficients should be consistent with the global bridge model on coordinate systems used. This issue has been discussed earlier. In the OrcaFlex model, compared with OrcaFlex model with no hydrodynamic interaction, the transformation to be carried out is for the mass matrix of the pontoons. This is due to the fact that, in the OrcaFlex model with not interaction, the mass matrix is always referred to the local coordinate systems going through the pontoon’s symmetry planes. Based on rigid body dynamics, the transformation of the inertia matrix from the original local coordinate system to the rotated local coordinate system that is parallel to the global system can be done through
Here refers to the moment of inertia matrix in the rotated local coordinate system. For the current case, the rotation is about z axis, which leaving the z component unchanged. And the
matrix reduces to, 00
0 0 1
00
0 0 1
00
0 0 1
This gives, ∗ ∗ ∗ ∗
The implementation of hydrodynamic interaction coefficients in the global bridge model increase significantly the problem scale and computation cost. This is mainly due to the fact that the interacting motion modes are increased from 6 for a single body to 6N for N bodies, thus greatly increase the scale of hydrodynamic coefficient matrix which is used as the input for calculating the retardation functions for time domain analysis, for example. A 3 hours simulation takes around 36 hours on a computer workstation while an analysis without hydrodynamic interaction runs for a few hours.
ENVIRONMENTAL CONDITIONS A screening of all the possible environmental conditions has been carried out for discovering the most adverse conditions under hydrodynamic interaction effects accounted for. This is a very time-consuming process. Only two cases are selected for presentation here for comparison of results from bridge models with and without hydrodynamic interaction, Table 4. Both the wave condition parameters given in the table are for JONSWAP of which further details can be found in DNV (2010). Long waves are considered for the simulations. The two cases selected include one case (no.1) with waves going almost in the direction of bridge girder, and one cases with waves
6 Copyright © 2018 ASMEDownloaded From: http://proceedings.asmedigitalcollection.asme.org on 11/14/2018 Terms of Use: http://www.asme.org/about-asme/terms-of-use
of 115 deg, somewhere perpendicular to part of the floating bridge. Considering the wave directions, one would expect that the ‘sheltering effects’ for case no.1, which will probably reduce the responses of most of the pontoons that are ‘sheltered’ by the upstream pontoons. For case 2, the wave direction shows that there will be less shelter effects, while the diffraction and radiation effects may mean extra wave loading systems on the pontoons. However, whether the extra loading systems mean amplification or reduction will be depending on the relative locations of the pontoons. The effects will be further explained in the later part together with the analysis results.
Case no Wave direction (deg) Hs (m) Tp (s) 1* 180 1.5 5 2 115 2.8 5.3
Table 4 Selected cases used for comparison of bridge global responses with/wo hydrodynamic interaction, for each case 10 seeds are run and the average of the observed maximum used; *: for this case Gamma = 1.0, else Gamma = 2.0.
SIMULATIONS AND ANALYSIS RESULTS The maximum responses of the bridge under ultimate limiting states are of practical design interest. In addition, for time domain analysis it is important to see how the statistic values converge with regard to random seeds, simulation numbers etc. This issue has been examined for a floating bridge in Viuff et. al. (2018). Since the extreme value analysis is not the main topic for this paper, here we use the average of the observed maximum values under 10 random seeds. For each seed a one-hour simulation is carried out. The time domain analysis results are post processed for comparison. The following values are post-processed and collected for comparison:
The 6-DOF motions and accelerations of the pontoon column connecting locations;
The weak axis and strong axis bending moments at the locations.
The weak and strong axis bending moments are composed of two parts, the static and dynamic parts:
, , ,
, , , The static part can be obtained from the static analysis of the global model, while the dynamic part, is the result of dynamic loading. Here the presented results include both parts. Only the dynamic part is presented for motion results. In the current paper, the weak and strong axis moments, and heave (Z) motions of all the pontoons are presented for the selected cases. The results are given from Figure 15 to Figure 20. In each case, both the extreme positive and negative values are reported. The lines shown in figures refer to the bridge/pontoon responses accounting for no hydrodynamic interaction effects.
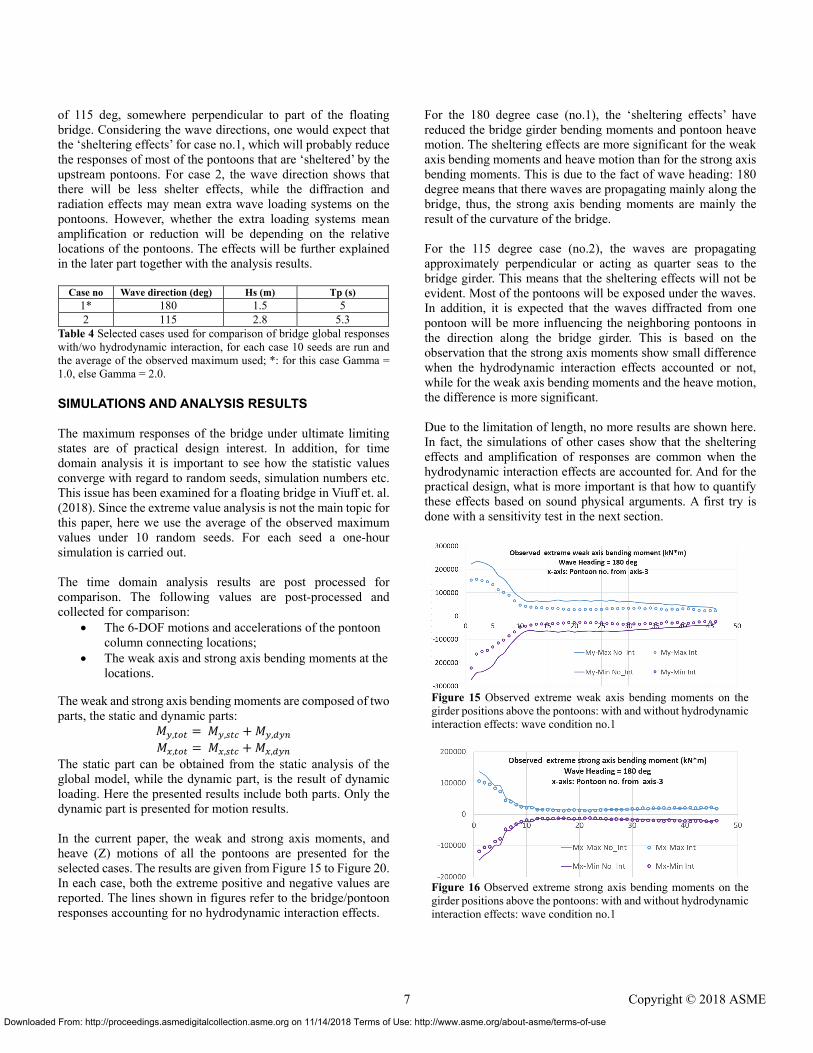
For the 180 degree case (no.1), the ‘sheltering effects’ have reduced the bridge girder bending moments and pontoon heave motion. The sheltering effects are more significant for the weak axis bending moments and heave motion than for the strong axis bending moments. This is due to the fact of wave heading: 180 degree means that there waves are propagating mainly along the bridge, thus, the strong axis bending moments are mainly the result of the curvature of the bridge. For the 115 degree case (no.2), the waves are propagating approximately perpendicular or acting as quarter seas to the bridge girder. This means that the sheltering effects will not be evident. Most of the pontoons will be exposed under the waves. In addition, it is expected that the waves diffracted from one pontoon will be more influencing the neighboring pontoons in the direction along the bridge girder. This is based on the observation that the strong axis moments show small difference when the hydrodynamic interaction effects accounted or not, while for the weak axis bending moments and the heave motion, the difference is more significant. Due to the limitation of length, no more results are shown here. In fact, the simulations of other cases show that the sheltering effects and amplification of responses are common when the hydrodynamic interaction effects are accounted for. And for the practical design, what is more important is that how to quantify these effects based on sound physical arguments. A first try is done with a sensitivity test in the next section.
Figure 15 Observed extreme weak axis bending moments on the girder positions above the pontoons: with and without hydrodynamic interaction effects: wave condition no.1
Figure 16 Observed extreme strong axis bending moments on the girder positions above the pontoons: with and without hydrodynamic interaction effects: wave condition no.1
7 Copyright © 2018 ASMEDownloaded From: http://proceedings.asmedigitalcollection.asme.org on 11/14/2018 Terms of Use: http://www.asme.org/about-asme/terms-of-use

Figure 17 Observed extreme heave motion of the pontoons: with and without hydrodynamic interaction effects: wave condition no.1
Figure 18 Observed extreme weak axis bending moments on the girder positions above the pontoons: with and without hydrodynamic interaction effects: wave condition no.2
Figure 19 Observed extreme strong axis bending moments on the girder positions above the pontoons: with and without hydrodynamic interaction effects: wave condition no.2
Figure 20 Observed extreme heave motion of the pontoons: with and without hydrodynamic interaction effects: wave condition no.2
HYDRODYNAMIC DAMPING: A SENSITIVITY STUDY The results shown above did not account for the viscous damping on the resonance of fluid between two pontoons. In practice, this may be important, as indicated by Kristiansen and Faltinsen (2008, 2009). The nonlinearities of the free surface conditions may also play an important factor, Faltinsen, Rognebakke, & Timokha (2007). However, here it would be difficult to find out proper damping coefficient based on methods applied by the authors mentioned above, especially for the 3-D pontoon geometriese. Instead we do a sensitivity tests: different drag coefficients will be applied in the pontoon heave motions. Only the drag term in the Morison's equation is needed since the inertia force contribution has already been accounted for by the diffraction/radiation theory coefficients. The drag force part of Morison's equation is written as
12
| |
Here is the drag area, the drag coefficient and the fluid relative velocity to the pontoon. The drag coefficients for sensitivity tests will be based on model tests carried out for the pontoons, Statens vegvesen (2017a, 2017b). Here we refer to one ellipse shape pontoon, with major/minor axis lengths 72.0m/25.0m, and draft 9.40m. Forced oscillation were carried out for the pontoon under full-scale periods between 3.5s – 15s. The measured force time series include both linear and quadratic damping contributions. Based on assumption that the linear damping can be represented by the potential flow damping calculated from potential flow solvers, the quadratic damping coefficients were identified based on a least-square method, Statens vegvesen (2017b). The identified quadratic damping coefficients vary significantly across periods of forced oscillation. The corresponding drag coefficients have values range in (0, 14) based on the following definition:
2
Here means the frequency dependent dimensional quadratic damping, the drag area and the water density.
8 Copyright © 2018 ASMEDownloaded From: http://proceedings.asmedigitalcollection.asme.org on 11/14/2018 Terms of Use: http://www.asme.org/about-asme/terms-of-use

Figure 21 Observed extreme weak axis bending moments on the girder positions above the pontoons: vertical drag coefficient sensitivity test, wave condition no.2
Figure 22 Observed extreme strong axis bending moments on the girder positions above the pontoons: vertical drag coefficient sensitivity test: wave condition no.2
Figure 23 Observed extreme heave motion of the pontoons: with and without hydrodynamic interaction effects: vertical drag coefficient sensitivity test: wave condition no.2
The case no.2 was re-calculated for 4 and 8. The results for the same quantities have been presented from Figure 21 to Figure 23. Here the results from the model with interaction effect, but no damping applied is presented by the red curves, considered as an ‘envelope’ of all the results. The results from the model without interaction effects are presented as black circles. In general the loads and motions responses are reduced by taking into account this effects.
For this sensitivity test case, the drag/damping effects are shown to be more efficient in taking down the vertical motion than the bridge moments. Further, the sensitivity of the studied responses are not high to the drag coefficients for the case in question. However, this is not concluding before more cases are included and a further look into other response quantities.
CONCLUDING REMARKS
The current study has investigated the hydrodynamic interaction between floating bridge pontoons and its impact on the global responses of the bridge. The comparison of bridge weak/strong axis bending moments shows that the interaction between pontoons can give both reduced (sheltering effects) and increased responses of the bridge under the same wave conditions. Investigating of the hydrodynamic coefficients (added mass, potential damping and diffraction force response amplitude operator, RAO) of a four pontoons system has shown that the hydrodynamic interaction effects make the coefficients highly resonant. A rough estimation of the piston and sloshing modes of the water field between pontoons indicates that there are many modes down from piston mode ( 11.68 ). And it shows strong correlation between the piston/sloshing modes and the resonance of hydrodynamic coefficients. Sheltering effects are also observed in the comparison of diffraction force RAOs. The wave conditions shown for this paper are selected for demonstration purpose, and represent only two of the nine cases screened by the current study. In addition, long waves are applied for the study. Wave spreading and other wave spectrum parameters are also of interest for further study. The current study has not considered the second order wave loads. This should be further included by first studying a proper representation of the second order wave loads under hydrodynamic interaction. For floating bridges, the slowly varying loads are more relevant for the design than the sum-frequency wave loads. Further, it is anticipated that the end-anchored bridge is less sensitive to such effects compared with the straight, side-anchored (by mooring lines) bridges. In general, the current analysis results are considered conservative. It is based on potential theory, for which the viscous effects are neglected. And it has been shown by many studies that the viscous effects are important for hydrodynamic interaction problems. This effects has been preliminarily touched upon in the current study by a sensitivity test of vertical drag coefficient applied on the pontoons. It was shown that the damping will be more efficient on reducing the vertical pontoon motions than on the bridge girder moments. This is not concluding but this behaviour is beneficial for the design since the service limit states will be better met by properly taking this effect into account. This issue should be further investigated with CFD or model tests. In addition, the wave conditions used here
9 Copyright © 2018 ASMEDownloaded From: http://proceedings.asmedigitalcollection.asme.org on 11/14/2018 Terms of Use: http://www.asme.org/about-asme/terms-of-use

are from the ultimate limiting states. For the service limit states the waves are generally less significant, thus the responses will go further down. The including of hydrodynamic interaction effects will significantly increase the computation cost. It will be even more demanding when a time domain analysis is run under different wave seeds. Thus, even if it is anticipated that hydrodynamic interaction effects may be an issue, it is not recommended to account for this effects for all of the design cases at the early phase. It is recommended to run such cases only for the sensitive cases based on preliminary and more detailed case analysis of models without interaction effects. It must be acknowledged that the issue addressed here is only one of many challenges for accurate prediction of the design loads and responses of the floating bridge in question. For such a super structure, the wind is of equivalent importance, or contributes even more loads and displacements under some conditions. Thus, it is always important to identify the potential risks and mitigate them by engineering judgments based on sound physical arguments and tentative computations.
ACKNOWLEDGMENTS
The Coastal Highway Route E39 Project of Norwegian Public Roads Administration (Statens vegvesen) has funded the work. All our colleagues at Statens vegvesen floating bridge project group are acknowledged for discussion on this. Dr. Arnt Fredriksen of Multiconsult is acknowledged for discussion of this issue with the first author and an initial investigation of the interaction hydrodynamic coefficients (from WAMIT) of another (side-anchored) floating bridge concept. Prof. Odd Faltinsen of NTNU is also acknowledged for discussion.
REFERENCES Faltinsen, O.M. (1993). Sea loads on ships and offshore
structures (Vol. 1). Cambridge university press. Faltinsen, O. M., Rognebakke, O. F., & Timokha, A. N.
(2007). Two-dimensional resonant piston-like sloshing in a moonpool. Journal of Fluid Mechanics, 575, 359-397.
DNV (2010). DNV-RP-C205: Environmental conditions and environmental loads. Norway: Det Norske Veritas.
Molin, B. (2001). On the piston and sloshing modes in moonpools. Journal of Fluid Mechanics, 430, 27-50.
Chen, X.B. (2004) Hydrodynamics in Offshore and Naval Applications - Part I, Keynote Lecture, the 6th International Conference on Hydrodynamics, Perth, Australia.
Kashiwagi, M., Endo, K., Yamaguchi, H. (2005) Wave drift forces and moments on two ships arranged side by side in waves. Ocean Engineering, 32 (5-6), pp. 529-555.
Kristiansen T., Faltinsen,O.M. (2008) Application of a vortex tracking method to the piston-like behavior in a semi-entrained vertical gap. Applied Ocean Research, 30: pp.1-16.
Kristiansen T., Faltinsen,O.M. (2009a). Studies on resonant water motion between a ship and a fixed terminal in shallow water. J. Offshore Mech. And Arctic Eng. 131, 11 pages.
Li, L. (2001) Numerical seakeeping predictions of shallow water effect on two ship interactions in waves, PhD thesis, Dalhousie University.
Newman J.N. (2004) Progress in wave load computations on offshore structures, Presentation at OMAE’04, Vancouver.
Fu, S., Wei, W., Ou, S., Moan, T., Deng, S., & Lie, H. (2017). A Time-Domain Method for Hydroelastic Analysis of Floating Bridges in Inhomogeneous Waves. In ASME 2017 36th International Conference on Ocean, Offshore and Arctic Engineering (pp. V009T12A010-V009T12A010). American Society of Mechanical Engineers.
ANSYS Inc. (2018) AQWA User Manual. ANSYS Inc. Orcina (2018) OrcaFlex Documentation.
https://www.orcina.com/SoftwareProducts/OrcaFlex/Documentation/index.php Accessed 18/01/2018.
Ronæss, M. (2002) Wave induced motions of two ships advancing on parallel course. Dr. Ing. thesis, Dept. of Marine Hydrodynamics, NTNU, Trondheim.
Seif, M. S., Inoue, Y. (1998). Dynamic analysis of floating bridges. Marine structures, 11(1-2), 29-46.
Statens vegvesen (2017a) Floating bridge pontoons model tests by SINTEF OCEAN.
Statens vegvesen (2017b) Correlation report between model tests and design by Multiconsult with partners.
Xiang, X., Miao, Q.M, Chen, X-B, Kuang X.F. (2007) Numerical study on Coupled Motion Response of Two Side-by-side Ships in Waves. Asia-Link International Conference on Ship Design, Construction and Operation, Harbin, China.
Xiang, X., Svangstu, E., Nedrebø, Ø., Jakobsen, B., Eidem, M. E., Larsen, P. N., & Sørby, B. (2017). Viscous Damping Modelling of Floating Bridge Pontoons with Heaving Skirt and its Impact on Bridge Girder Bending Moments. In ASME 2017 36th International Conference on Ocean, Offshore and Arctic Engineering (pp. V07BT06A001-V07BT06A001). American Society of Mechanical Engineers.
Xiang, X., & Faltinsen, O. M. (2011). Time domain simulation of two interacting ships advancing parallel in waves. In Proc. of 30th Int. Conf. on Ocean, Offshore and Arctic Engineering (OMAE2011), Rotterdam (Netherlands) (pp. 1-13).
Xiang, X. (2012). Maneuvering of two interacting ships in waves. PhD thesis, NTNU, Trondheim, Norway.
Viuff, T.H., Leira B.J., Xiang, X. &Øiseth O.A. Estimating extreme response of a floating bridge structure. (Submitted to the Journal of Engineering Structures, Nov. 30, 2017)
10 Copyright © 2018 ASMEDownloaded From: http://proceedings.asmedigitalcollection.asme.org on 11/14/2018 Terms of Use: http://www.asme.org/about-asme/terms-of-use