Imaging and PDA Analysis of a GDI Spray in the Near Nozzle ...
10
Imaging and PDA Analysis of a GDI Spray in the Near Nozzle Region by G. Wigley 1 , M. Goodwin 1 , G. Pitcher 2 and D. Blondel 3 1 Aeronautical and Automotive Engineering, Loughborough University, LE11 3TU, UK 2 Lotus Engineering, Hethel, Norwich, NR14 8EZ, UK 3 Dantec Dynamics A/S, DK-2740 Skovlunde, Denmark (1) Email: [email protected] ABSTRACT This paper describes the results found from a combined LDA/PDA and imaging analysis in the near nozzle region of a Mitsubishi pressure swirl GDI injector. Understanding the physical processes and quantifying them in this region are judged vital to the future development of injection systems and predictive simulation tools. The combination of complementary diagnostics allows the morphology of the spray to be identified along with quantifying the velocity and dropsize of the droplets formed. The injector was operated at 50 bar fuel pressure with a fuel solenoid opening time of 0.85 ms corresponding to a fuel delivery of 11.0 mg per injection into ambient air. The LDA/PDA measurement grid started on the axis at 0.5 mm and extended down to 5.0 mm below the nozzle and reached out to 1.0 to 4.0 mm radially respectively. Comprehensive time history profiles of droplet velocity, size and sample number were recorded. They were used to indicate the times at which the spray exhibited different characteristics. These were identified as:- (a) pre-swirl spray, 0.5 ms (b) spray cone starts to develop, 0.58 ms (c) spray cone relaxes, 0.70 ms (d) maximum velocity in spray cone, 0.98 ms (e) spray cone collapses, 1.40 ms and (f) the spray detaches from the nozzle after 1.50 ms. The most effective method to present the spatial and temporal development of the spray characteristics were to superimpose the vector and dropsize field plots, generated from the LDA and PDA data, onto the spray images. Time 0.58 ms Time 0.98 ms Image frames and velocity-size field plots for the pre-swirl spray (left) and for the developing spray cone(right)
Transcript of Imaging and PDA Analysis of a GDI Spray in the Near Nozzle ...

Imaging and PDA Analysis of a GDI Spray in the Near Nozzle Region
by
G. Wigley1, M. Goodwin1, G. Pitcher2 and D. Blondel3
1Aeronautical and Automotive Engineering, Loughborough University, LE11 3TU, UK 2Lotus Engineering, Hethel, Norwich, NR14 8EZ, UK
3Dantec Dynamics A/S, DK-2740 Skovlunde, Denmark
(1)Email: [email protected]
ABSTRACT This paper describes the results found from a combined LDA/PDA and imaging analysis in the near nozzle region of a Mitsubishi pressure swirl GDI injector. Understanding the physical processes and quantifying them in this region are judged vital to the future development of injection systems and predictive simulation tools. The combination of complementary diagnostics allows the morphology of the spray to be identified along with quantifying the velocity and dropsize of the droplets formed. The injector was operated at 50 bar fuel pressure with a fuel solenoid opening time of 0.85 ms corresponding to a fuel delivery of 11.0 mg per injection into ambient air. The LDA/PDA measurement grid started on the axis at 0.5 mm and extended down to 5.0 mm below the nozzle and reached out to 1.0 to 4.0 mm radially respectively. Comprehensive time history profiles of droplet velocity, size and sample number were recorded. They were used to indicate the times at which the spray exhibited different characteristics. These were identified as:- (a) pre-swirl spray, 0.5 ms (b) spray cone starts to develop, 0.58 ms (c) spray cone relaxes, 0.70 ms (d) maximum velocity in spray cone, 0.98 ms (e) spray cone collapses, 1.40 ms and (f) the spray detaches from the nozzle after 1.50 ms. The most effective method to present the spatial and temporal development of the spray characteristics were to superimpose the vector and dropsize field plots, generated from the LDA and PDA data, onto the spray images.
Time 0.58 ms Time 0.98 ms Image frames and velocity-size field plots for the pre-swirl spray (left) and for the developing spray cone(right)

1. INTRODUCTION PDA can be a robust measurement technique but care is needed, in both the measurement and data processing stages, when it is applied to an optically dense spray, a partially atomised spray or when different modes of atomization contribute to the droplet field. Such phenomena occur in the hollow cone sprays produced by pressure swirl and air assist gasoline direct injection, GDI, systems. The complementary nature of PDA and CCD imaging techniques when applied simultaneously can provide a much greater insight into the spray formation processes, Robart (2000). For the Mitsubishi GDI pressure swirl injector four distinct consecutive phases have been identified in characterising the injected spray:- (1) the initial pre-swirl spray, (2) the transient development and break up of the leading edge of the cone, (3) the fully developed 'steady state' cone and (4) the transient collapse of the spray as the injector needle closes, Wigley (2000). The initial pre-swirl spray and the developing spray cone are only partially atomized as they contain fuel elements in the form of ligaments, sheets and filaments as well as droplets produced by prompt atomisation. Dropsize and velocity measurements alone only shed light on the products of the disintegration process rather than directly quantifying the breakup and atomization processes themselves. The consequence of this is that there is lack of agreement between researchers on the mechanics of the disintegration process occurring with injection systems and consequently various breakup and atomization mechanisms have been postulated. The initial conditions existing in the nozzle and in the near nozzle region in terms of the instantaneous mass flow rate, liquid morphology, velocity and droplet size are recognised as the most important factors affecting the spray development. Understanding the physical processes and quantifying the above parameters are judged vital, especially for the future development of predictive simulation tools. This paper describes the results found for a detailed LDA/PDA and imaging analysis in the near nozzle region of a Mitsubishi pressure swirl GDI injector. It is in this region that the imaging is seen as an essential and complementary tool to the PDA. This combined approach allows the morphology of the liquid elements to be identified along with the velocity and dropsize of the droplets formed. 2. INSTRUMENTATION AND EXPERIMENTAL TECHNIQUE 2.1 Injector rig The Mitsubishi GDI injector was supported from a gantry incorporating three precision traverses, two horizontal and one vertical, to position the spray in three orthogonal dimensions relative to the static LDA/PDA measurement volume. The measurement co-ordinates in the vertical plane were from 0.5 to 5.0 mm in steps of 0.5 mm below the nozzle. Each radial scan started from the geometric vertical axis through the nozzle orifice and traversed out, to the periphery of the spray, in 0.1 mm steps for z = 0.5 to 2.0 mm. From z =2.5 to 5.0 mm, the radial increment inside the hollow cone of the spray was set to 0.2 mm until the inside edge of the spray cone was located and the radial increment was then reduced to 0.1 mm. To put this resolution for the traverse scan into perspective, each step represents twice the measurement volume diameter and is equal to the maximum dropsize measurement capability. The positional accuracy for the computerised radial traverse was measured at 0 to –0.02 mm over the full extent of the traverse scan, 4.00 mm at z = 5.0mm. The high fuel pressure was supplied by a pneumatic/hydraulic ram system. The injector was driven by a control unit that provided the electronic timing gate for the solenoid governing the needle control valve in the injector. The cycle time was derived from a function generator which also provided external trigger pulses for synchronising the data acquisition system for the optical diagnostics. The injector was operated at 50 bar fuel pressure with a fuel solenoid opening time of 0.85 ms corresponding to a fuel delivery of 11.0 mg per injection. This is a low load condition producing a brake mean effective pressure of 2 bar at 2000 rpm, equivalent to a vehicle road cruise speed of between 30 to 40 mph. The injection frequency was set at 8 Hz to synchronise with the maximum frame rate of the CCD imaging system and to remove all droplets from the image field before another injection commenced. The experiments used gasoline as there is sufficient evidence to suggest that there are no inert test fluids that can simulate accurately the atomisation characteristics of this fuel, Pitcher 1998. 2.2 PDA System The design and construction of the two component high power, high resolution LDA/PDA transmission system has been well documented, Wigley (1999). The configuration for this application was:- equal beam separations of 50 mm with laser powers of 120 and 250 milliwatts per beam for the 488 and 514 nm wavelengths
respectively. With a 300 mm final focusing lens this resulted in coincident measurement volumes of diameters of 42 and 45 microns with fringe spacings of 2.94 and 3.10 microns for the 488 and 514 nm wavelengths respectively i.e 14 fringes in each measurement volume. The plane of polarization for the laser beams was horizontal i.e. parallel to the scattering plane. The Dantec 57X10 receiver optical system had a scattered light collection lens with a focal length of 310 mm. The receiver was positioned at a scattering angle of 70 degrees to collect the light scattered due to refraction and provide:- (1) a high spatial resolution; the effective measurement volume length was reduced to 0.1 mm; (2) an insensitivity of the dropsize/phase relationship to refractive index changes of the fuel and; (3) the Brewster condition for a high rejection of any reflected components in the scattered light. In order to cover the wide range of dropsizes encountered in the spray the optimum choice of the micrometer setting for receiver aperture was 0.5 mm. The optical configuration resulted in a dropsize measurement resolution of 6.60 degrees/micron and the ability to operate with an estimated maximum droplet concentration of up to 5.103 drops/mm3. Two different generations of signal processors were used in this work, the Dantec Enhanced 58N50 and the latest Dantec BSA-P80. The operational characteristics of the former covariance processor are discussed in detail by Lading (1988) and its performance with regard to velocity and size measurements in fuel injected sprays is well documented. The BSA P80 processor differs significantly in that it employs burst spectral analysis techniques. The BSA P80 processor is based on multi-bit burst detection and multi-bit FFT signal processing. Doppler signal frequencies of up to 180MHz and frequency bandwidths up to 120 MHz can be accommodated. This allows a combination of 28 bandwidths with up to 18 centre frequencies to be specified to give the user the capability of matching the processor bandwidth precisely to the experimental velocity bandwidth. This is essential in harsh measurement applications as is the case reported here of measurements in the near nozzle region of a high pressure swirl gasoline fuel injector. The signals from the photomultipliers are digitised with a resolution of 8 bits. The sampling frequency is automatically adapted to the selected bandwidth allowing a fast transfer of the data with a high accuracy. The signal burst detector is based on amplitude and signal to noise ratio, SNR. This combination ensures a robust detection of all signals, from low to high signal amplitude, and also rejects noise peaks. The SNR is continuously measured and allows the beginning and the end of the burst to be determined. Based on this, the sample interval is automatically centred on the burst peak and adapted to fit to the duration of the burst. The validation of the burst is based on an 8 bit FFT computed by a fast DSP. The Doppler frequency and the phase between signals are derived from the FFT spectrum by zero-padding and curve-fitting. The results are validated by a user specified ratio between the first and second highest spectral peak. The coincidence of two or more signals is validated when the burst detector windows overlap. This dynamic coincidence filtering allows detection of very short as well as long bursts. With this technique, transit times shorter than 50 ns can be handled. The use of advanced buffers provide zero dead time between bursts to attain the highest possible instantaneous data rate. One feature of the P80 processor, much appreciated by the authors, is the provision of an output signal identical to the input of the photomultiplier/head amplifier signal rather than a filtered and amplified ‘monitor’ signal output. This allows both the AC and DC components of the raw Doppler signals to be evaluated. When working in optically dense sprays the DC level is high. Whereas a high gain is required to detect small droplets too high a gain will saturate the amplifier and clip any signal. The gain on the system was set at the clip level for the most optically dense part of the spray i.e. 0.5 mm below the nozzle during the transit of the spray tip. By far the most useful aspect of the P80 signal outputs in this study was that they were used as input signals to the Covariance processor. The Covariance processor was only configured for two component velocity measurements as the signal phase/delay calibration signals were specific to the P80/receiver combination. This ‘back to back’ arrangement provided a reference against which the P80 processor performance could be evaluated. The main operational parameters of the two PDA processors are summarised in Table 1. At each measurement position 20,000 validated data samples were attempted or an elapsed time of 125 seconds was reached i.e. 1000 injections. The outer radial limit of the spray was defined as the next position after which ‘time out’ occurred. Velocity and dropsize data were displayed as discrete scatter plots of each individual sample versus time after the injector electronic trigger. These data were then time bin averaged, over sector sizes of 40 micro-seconds, to produce time varying mean profiles of axial and radial velocity, dropsize and sample number. When the data processing had been completed the time averaged mean data array was collated, for the whole measurement grid, to provide vector and scalar field plots showing the spatial development of the droplet field as a function of time. Invariably the Covariance processor collected the 20,000 velocity-only samples in a shorter time than the BSA P80, especially on the inside edge of the cone. A second Covariance measurement series was performed with a finer measurement grid across the spray cone and a sample count increased to 25,000.
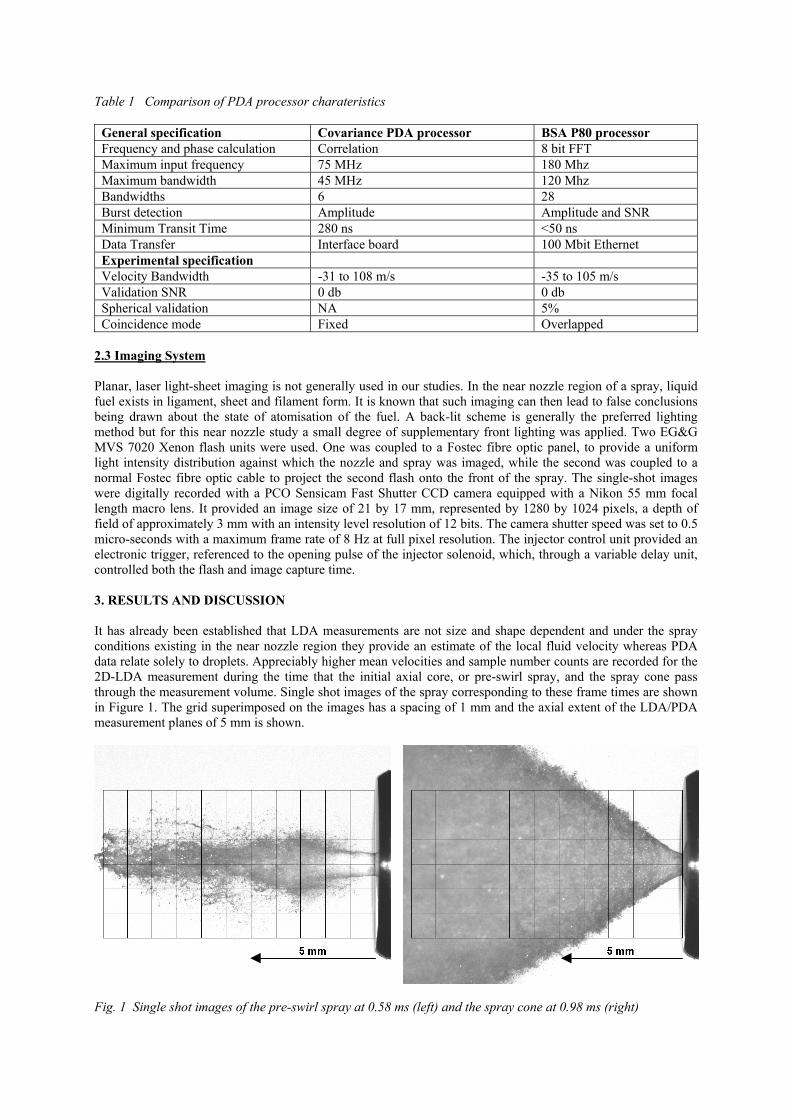
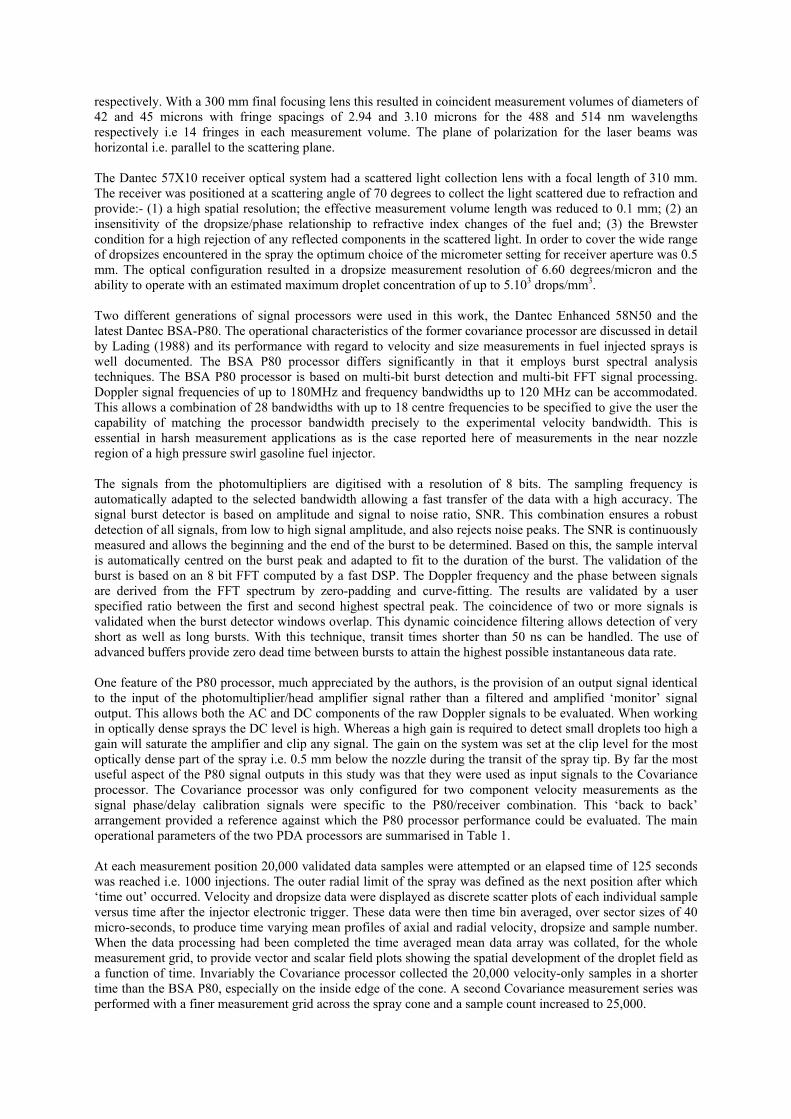
Table 1 Comparison of PDA processor charateristics
General specification Covariance PDA processor BSA P80 processor Frequency and phase calculation Correlation 8 bit FFT Maximum input frequency 75 MHz 180 Mhz Maximum bandwidth 45 MHz 120 Mhz Bandwidths 6 28 Burst detection Amplitude Amplitude and SNR Minimum Transit Time 280 ns <50 ns Data Transfer Interface board 100 Mbit Ethernet Experimental specification Velocity Bandwidth -31 to 108 m/s -35 to 105 m/s Validation SNR 0 db 0 db Spherical validation NA 5% Coincidence mode Fixed Overlapped
2.3 Imaging System Planar, laser light-sheet imaging is not generally used in our studies. In the near nozzle region of a spray, liquid fuel exists in ligament, sheet and filament form. It is known that such imaging can then lead to false conclusions being drawn about the state of atomisation of the fuel. A back-lit scheme is generally the preferred lighting method but for this near nozzle study a small degree of supplementary front lighting was applied. Two EG&G MVS 7020 Xenon flash units were used. One was coupled to a Fostec fibre optic panel, to provide a uniform light intensity distribution against which the nozzle and spray was imaged, while the second was coupled to a normal Fostec fibre optic cable to project the second flash onto the front of the spray. The single-shot images were digitally recorded with a PCO Sensicam Fast Shutter CCD camera equipped with a Nikon 55 mm focal length macro lens. It provided an image size of 21 by 17 mm, represented by 1280 by 1024 pixels, a depth of field of approximately 3 mm with an intensity level resolution of 12 bits. The camera shutter speed was set to 0.5 micro-seconds with a maximum frame rate of 8 Hz at full pixel resolution. The injector control unit provided an electronic trigger, referenced to the opening pulse of the injector solenoid, which, through a variable delay unit, controlled both the flash and image capture time. 3. RESULTS AND DISCUSSION It has already been established that LDA measurements are not size and shape dependent and under the spray conditions existing in the near nozzle region they provide an estimate of the local fluid velocity whereas PDA data relate solely to droplets. Appreciably higher mean velocities and sample number counts are recorded for the 2D-LDA measurement during the time that the initial axial core, or pre-swirl spray, and the spray cone pass through the measurement volume. Single shot images of the spray corresponding to these frame times are shown in Figure 1. The grid superimposed on the images has a spacing of 1 mm and the axial extent of the LDA/PDA measurement planes of 5 mm is shown.
Fig. 1 Single shot images of the pre-swirl spray at 0.58 ms (left) and the spray cone at 0.98 ms (right)
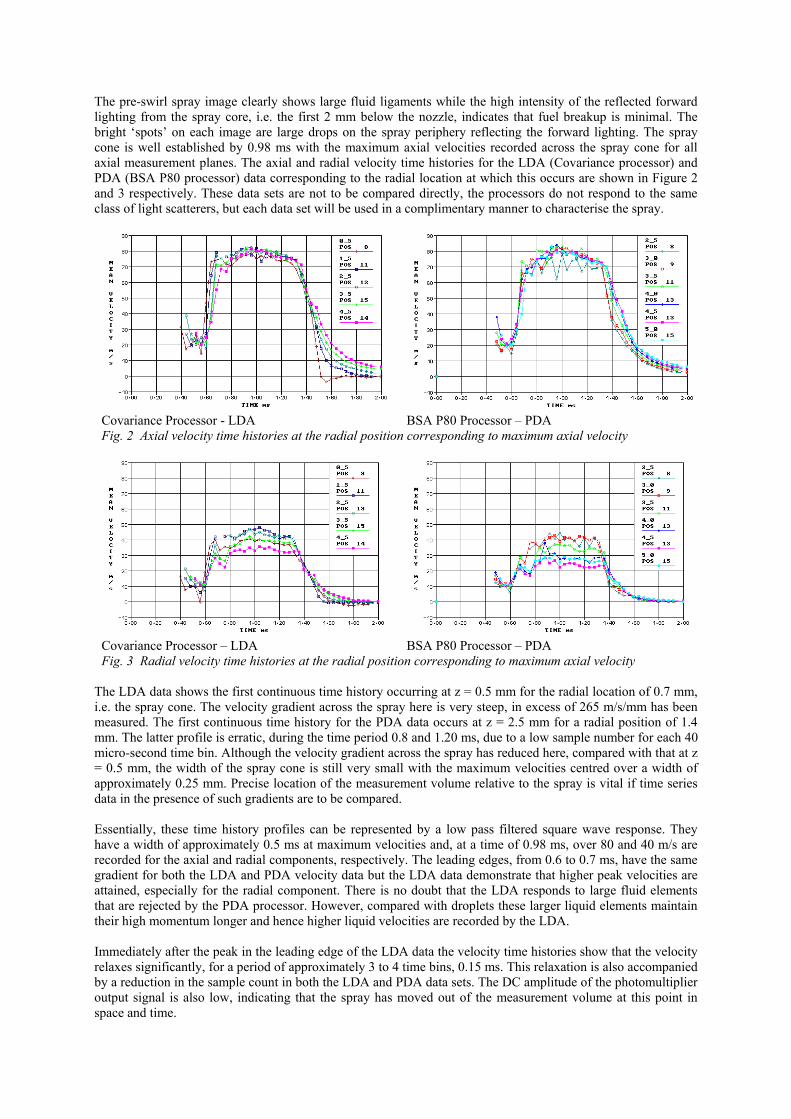
The pre-swirl spray image clearly shows large fluid ligaments while the high intensity of the reflected forward lighting from the spray core, i.e. the first 2 mm below the nozzle, indicates that fuel breakup is minimal. The bright ‘spots’ on each image are large drops on the spray periphery reflecting the forward lighting. The spray cone is well established by 0.98 ms with the maximum axial velocities recorded across the spray cone for all axial measurement planes. The axial and radial velocity time histories for the LDA (Covariance processor) and PDA (BSA P80 processor) data corresponding to the radial location at which this occurs are shown in Figure 2 and 3 respectively. These data sets are not to be compared directly, the processors do not respond to the same class of light scatterers, but each data set will be used in a complimentary manner to characterise the spray.
Covariance Processor - LDA BSA P80 Processor – PDA Fig. 2 Axial velocity time histories at the radial position corresponding to maximum axial velocity
Covariance Processor – LDA BSA P80 Processor – PDA Fig. 3 Radial velocity time histories at the radial position corresponding to maximum axial velocity
The LDA data shows the first continuous time history occurring at z = 0.5 mm for the radial location of 0.7 mm, i.e. the spray cone. The velocity gradient across the spray here is very steep, in excess of 265 m/s/mm has been measured. The first continuous time history for the PDA data occurs at z = 2.5 mm for a radial position of 1.4 mm. The latter profile is erratic, during the time period 0.8 and 1.20 ms, due to a low sample number for each 40 micro-second time bin. Although the velocity gradient across the spray has reduced here, compared with that at z = 0.5 mm, the width of the spray cone is still very small with the maximum velocities centred over a width of approximately 0.25 mm. Precise location of the measurement volume relative to the spray is vital if time series data in the presence of such gradients are to be compared. Essentially, these time history profiles can be represented by a low pass filtered square wave response. They have a width of approximately 0.5 ms at maximum velocities and, at a time of 0.98 ms, over 80 and 40 m/s are recorded for the axial and radial components, respectively. The leading edges, from 0.6 to 0.7 ms, have the same gradient for both the LDA and PDA velocity data but the LDA data demonstrate that higher peak velocities are attained, especially for the radial component. There is no doubt that the LDA responds to large fluid elements that are rejected by the PDA processor. However, compared with droplets these larger liquid elements maintain their high momentum longer and hence higher liquid velocities are recorded by the LDA. Immediately after the peak in the leading edge of the LDA data the velocity time histories show that the velocity relaxes significantly, for a period of approximately 3 to 4 time bins, 0.15 ms. This relaxation is also accompanied by a reduction in the sample count in both the LDA and PDA data sets. The DC amplitude of the photomultiplier output signal is also low, indicating that the spray has moved out of the measurement volume at this point in space and time.

The general trend of these time histories indicates the times at which the spray exhibits different characteristics. These are identified as:- (a) pre-swirl spray, 0.5 ms (b) spray cone starts to develop, 0.58 ms (c) spray cone relaxes, 0.70 ms (d) maximum velocity in spray cone, 0.98 ms (e) spray cone collapses, 1.40 ms and (f) the spray detaches from the nozzle after 1.50 ms. The most effective method to present the spatial and temporal development of the spray characteristics are to superimpose the vector and dropsize field plots, generated from the LDA and PDA data, onto the spray images. The images are based on a mean of five images from five consecutive injections. Two frames are shown in Figure 4 for the spray times of 0.50 and 0.58 ms.
Time 0.50 ms Sector 13 Time 0.58 ms Sector 15 Fig. 4 Image frames and velocity-size field plots for the pre-swirl spray These frames show qualitatively the spatial development of the pre-swirl spray together with the Covariance LDA data for the liquid velocity vector field and the P80 PDA data for the dropsize field. The scale is given by the 0.5 mm axial separation of the LDA/PDA data where the vectors and circles, representing diameter, are centred on the measurement position. The radial extent of the LDA/PDA data is always greater than indicated by the images. The LDA/PDA data are collected from up to 1000 injections at each position and can detect single droplets compared to the five frame averaged images and an imaging system insensitive to small size and low number density droplets. A plug velocity profile of approximately 80 m/s is seen down the axis of the spray core with a flat velocity profile out into the periphery of the spray. The plug flow extends out to a radius of 0.4 and 0.6 mm for the time of 0.50 and 0.58 ms respectively in the axial plane of 5.0 mm. The nozzle orifice diameter is 0.5 mm. The high image intensity in the spray core immediately downstream from the nozzle indicates the most optically dense part of the pre-swirl spray. Nevertheless LDA data were recorded across the whole spray at 1.5 mm below the nozzle at the time of 0.5 ms. At 0.58 ms there is a data ‘dead zone’ that extends from the nozzle down to 3.0 mm and out to a radius of 0.4 mm. The nature of the spray along the axis means that there are few droplets for the P80 processor to identify. Then again, there is also the low probability of the processor validating signals from three channels, for size and axial velocity, and on the fourth channel, the radial component, which means that the PDA data has a greater data ‘dead zone’. This is especially true in the later time frame where dropsize data are rarely seen at radii less than 0.4 mm from the axis in this time frame. What the dropsize data do show though are large droplets, greater than 10 microns mean diameter, present on the spray periphery while droplets larger than this are indicated on the edge of the spray core. These large sizes though are more indicative of a wide dropsize ranges existing.
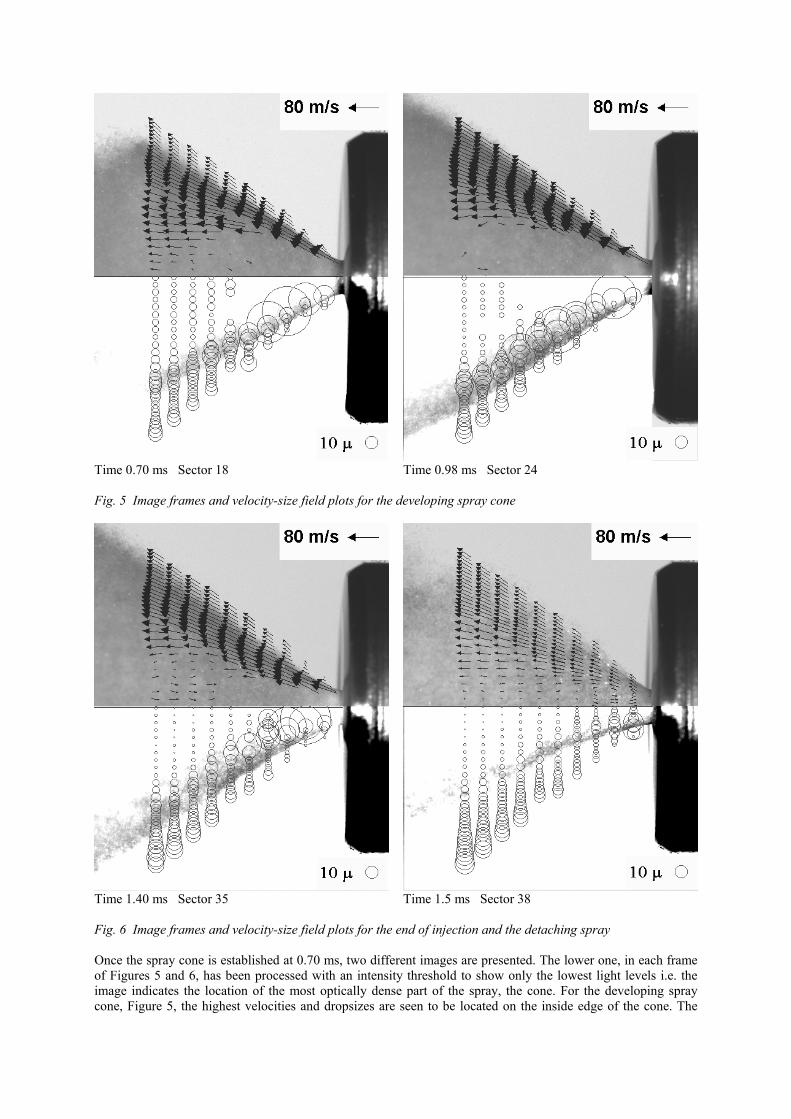
Time 0.70 ms Sector 18 Time 0.98 ms Sector 24 Fig. 5 Image frames and velocity-size field plots for the developing spray cone
Time 1.40 ms Sector 35 Time 1.5 ms Sector 38 Fig. 6 Image frames and velocity-size field plots for the end of injection and the detaching spray Once the spray cone is established at 0.70 ms, two different images are presented. The lower one, in each frame of Figures 5 and 6, has been processed with an intensity threshold to show only the lowest light levels i.e. the image indicates the location of the most optically dense part of the spray, the cone. For the developing spray cone, Figure 5, the highest velocities and dropsizes are seen to be located on the inside edge of the cone. The

velocity profile across the spray cone has been resolved in all axial planes apart from those closer than 1.5 mm to the nozzle. Here the velocity profiles are only captured at the locations corresponding to maximum core velocity and then out radially to the spray periphery. The position of the maximum velocity is also the location at which the highest dropsizes are to be found. The temporal development of the cone between the times 0.7 and 0.98 ms is readily seen by the progression of the largest drops from z = 2 down to 4 mm downstream. The dropsizes presented are arithmetic mean, D10 , diameters, and do not reveal the true nature of the droplet distribution found here. A large range of dropsizes are present and a more detailed analysis would require a velocity – dropsize correlation analysis to be performed as demonstrated by Wigley 2001. What is of significant interest here are the relative distributions of the Covariance LDA and the P80 PDA data. Both show data in the central region, inside the spray cone, but with the PDA data covering a greater area. The velocities are low, with evidence that a recirculation zone is growing and the dropsizes small, generally less than 5 microns. The BSA P80 velocity data confirm that the recirculation zone at 0.98 ms is well pronounced in the z = 5mm plane and extends back to z = 3.5 mm. The prognosis for the P80 processor is good, it has clearly demonstrated here an improved signal detection and validation capability when compared to the Covariance processor operating without the stringent validation requirements needed for size measurements. The velocity components in the spray cone reach a peak at the time 0.98 ms but then decrease slightly by about 10% up to 1.36 ms, see Figures 2 and 3. There is then a sudden drop in velocities, at 1.40 ms, as the needle control valve starts to close. The spray images and velocity – size field plots in Figure 6 capture the spray at this time and again at the time 1.50 ms, i.e. just before the spray detaches from the nozzle. The radial profiles of the flow across the spray cone at 1.40 ms are well resolved although velocity and size data from the inner edge at z = 0.5 and 1.0 mm are still excluded. The recirculation zone is clearly evident in the LDA data from z = 3.5 to 5.0 mm whereas the PDA velocity data, not shown, does confirm that this is the closest approach of the recirculation zone to the nozzle while fuel is being injected under pressure. The dropsize range along the inside surface of the spray cone is still seen to be large but elsewhere the dropsize diameters are decreasing, to 10 microns diameter or less, particularly in the central region of the hollow cone spray. This decrease in dropsize continues throughout the spray through to the end of injection, as can be seen in Figure 6 in the time frame at 1.50 ms. Downstream from the nozzle, between z = 3 and 5 mm, the variation of dropsize appears to increase radially in a near linear manner. Closer to the nozzle , z = 0.5 to 2.0 mm the last of the liquid fuel has emerged from the nozzle and again dropsizes in the spray are seen to exhibit a wide size range. From the velocity vector field in time frame 1.5 ms it can be seen that the whole measurement grid contributes to the plotted flow pattern. The large recirculation zone that had existed at earlier times between z = 3 to 5 mm has collapsed with the droplet field here now being transported downstream. However, a new recirculation zone has appeared, centred on the position z = 1 and r = 0.4 mm. The velocity profile across the cone has relaxed and a near plug flow profile exists, from inside the spray cone out to the spray periphery. On a more quantitative basis the axial and radial velocity profiles and the distribution of samples and dropsizes are now presented and discussed as a function of radial position across the spray. In Figure 7 the BSA P80 data are presented for the time frames 0.98 ms and 1.40 ms. The data exhibit a high degree of consistency and trends can be readily quantified throughout space and time. The axial velocity components, in the upper row, show that the maximum spray cone velocity is virtually constant, between z = 0.5 and 5 mm, at 80 m/s at the time of 0.98 ms and 65 m/s at the time of 1.40 ms. Very steep axial velocity gradients exist, especially between z = 0.5 and 2.0 mm on the outer surface of the cone. It was not possible to record data for the inner surface of the spray cone. Whereas the peak axial velocity is maintained downstream from the nozzle the radial velocity component decays with distance downstream from 45 down to 35 m/s. The velocity profiles across the spray cone are fully resolved for z = 4 mm and below. There almost appears to be a transition in the spray behaviour, starting at z = 3.5 mm, with the growth of the recirculation zone. This transition is also to be seen in the profiles representing the sample number distribution across the spray. It must be noted that these data relate to the number of validated samples, no allowance for the instantaneous validation rate has been made. From z = 0.5 to 3.0 mm there is a large single peak in the sample distribution representing the outer surface of the spray cone. However, below z = 3.5 mm there are secondary peaks occurring between radii of 1.5 and 2.5 mm. These peaks occur on the inner surface of the spray cone relative to the peak in the velocity components.

Time - 0.98ms Time - 1. 40 ms Fig. 7 Radial profiles of axial and radial velocity, samples and dropsizes for the P80 processor If the quality of atomization can be described by a high sample count and a low dropsize then this is found at a peak on the outer surface of the spray cone. The sample counts are high and correlate well with a minimum in the dropsize. Conversely the sample counts are a minimum when the velocity is high and which correlates with a peak in the dropsize profile. The conclusion from this is that the liquid fuel forming the spray cone is aligned with the inner surface. Penetration velocity of these large liquid elements is high and breakup only becomes effective after z = 3.5 mm. The shear across the outer surface of the spray is effective at producing atomization and, with the flat velocity profile, high levels of entrainment.
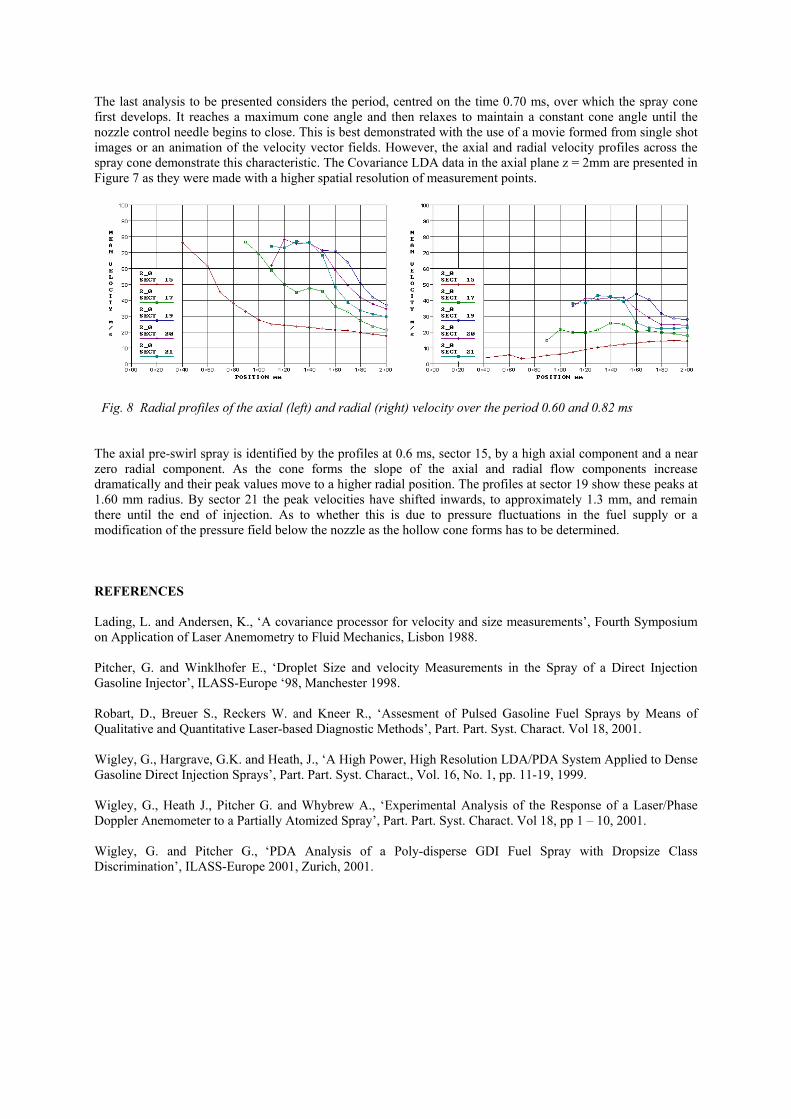
The last analysis to be presented considers the period, centred on the time 0.70 ms, over which the spray cone first develops. It reaches a maximum cone angle and then relaxes to maintain a constant cone angle until the nozzle control needle begins to close. This is best demonstrated with the use of a movie formed from single shot images or an animation of the velocity vector fields. However, the axial and radial velocity profiles across the spray cone demonstrate this characteristic. The Covariance LDA data in the axial plane z = 2mm are presented in Figure 7 as they were made with a higher spatial resolution of measurement points.
Fig. 8 Radial profiles of the axial (left) and radial (right) velocity over the period 0.60 and 0.82 ms
The axial pre-swirl spray is identified by the profiles at 0.6 ms, sector 15, by a high axial component and a near zero radial component. As the cone forms the slope of the axial and radial flow components increase dramatically and their peak values move to a higher radial position. The profiles at sector 19 show these peaks at 1.60 mm radius. By sector 21 the peak velocities have shifted inwards, to approximately 1.3 mm, and remain there until the end of injection. As to whether this is due to pressure fluctuations in the fuel supply or a modification of the pressure field below the nozzle as the hollow cone forms has to be determined. REFERENCES Lading, L. and Andersen, K., ‘A covariance processor for velocity and size measurements’, Fourth Symposium on Application of Laser Anemometry to Fluid Mechanics, Lisbon 1988. Pitcher, G. and Winklhofer E., ‘Droplet Size and velocity Measurements in the Spray of a Direct Injection Gasoline Injector’, ILASS-Europe ‘98, Manchester 1998. Robart, D., Breuer S., Reckers W. and Kneer R., ‘Assesment of Pulsed Gasoline Fuel Sprays by Means of Qualitative and Quantitative Laser-based Diagnostic Methods’, Part. Part. Syst. Charact. Vol 18, 2001. Wigley, G., Hargrave, G.K. and Heath, J., ‘A High Power, High Resolution LDA/PDA System Applied to Dense Gasoline Direct Injection Sprays’, Part. Part. Syst. Charact., Vol. 16, No. 1, pp. 11-19, 1999. Wigley, G., Heath J., Pitcher G. and Whybrew A., ‘Experimental Analysis of the Response of a Laser/Phase Doppler Anemometer to a Partially Atomized Spray’, Part. Part. Syst. Charact. Vol 18, pp 1 – 10, 2001. Wigley, G. and Pitcher G., ‘PDA Analysis of a Poly-disperse GDI Fuel Spray with Dropsize Class Discrimination’, ILASS-Europe 2001, Zurich, 2001.