Ijcatr04041010
12
International Journal of Computer Applications Technology and Research Volume 4– Issue 4, 262 - 273, 2015, ISSN:- 2319–8656 www.ijcat.com 262 CONSEQUENCES OF ROAD TRAFFIC ACCIDENT IN NIGERIA: TIME SERIES APPROACH F.B. Adebola Department of Statistics Federal University of Technology Akure. Nigeria. Ridwan A Sanusi Department of Mathematics and Statistics King Fahd University of Petroleum and Minerals, Saudi Arabia. N.A. Adegoke Department of Statistics Federal University of Technology Akure. Nigeria. Abstract: Road traffic accident in Nigeria is increasing at a worrying rate and has raised one of the country major concerns. We provided appropriate and suitable time series model for the consequences of road accident, the injured, killed and total casualty of the road accident in Nigeria. The most widely used conventional method, Autoregressive Integrated Moving Average (ARIMA) model of time series, also known as Box-Jenkins method is applied to yearly data on the consequences of road accident data in Nigeria from 1960-2013 to determine patterns of road traffic accident consequences; injured, killed and total casualty of the road accident along the Nigeria motorway. Appropriate models are developed for the accident consequences; injured, killed and total casualty. ARIMA (0; 2; 1) model is obtained for the injury and total casualty consequences, whilst ARIMA(1,2,2) model is obtained for the killed consequences, using the data from 1960-2011. The adequacy and the performance of the model are tested on the remaining data from 2012 to 2013. Seven years forecast are provided using the developed models and showed that road traffic accident consequences examined; injured, killed and total casualty would continue to increase on average. Keywords: ARIMA; forecast; injured; killed; casualty 1. INTRODUCTION Road Traffic Accident occurs when there is collision of vehicle with another vehicle, pedestrian and animals among other, which at times result in injury, loss of property and death. As mentioned in [11], road traffic accident leads to approximately two million killed and approximately ten million injuries annually. Also, an estimated value of 3000 people die in the world as a result of road traffic accidents daily. A prediction of global leading causes of killed from 2008 to 2030 by World Health Organization revealed that, if current trends and patterns continue, road traffic accidents will increase from ninth to fifth of world leading cause of killed 3.6% of global killed, up from 2.2% in 2004 [11]. While, disability-adjusted life years will rise from ninth with 2.7% of total disability-adjusted life in 2004 to third and 4.9% of total disability-adjusted life in 2030 [10]. Nigeria, the most populous black country, has the highest rate of mortality from road accidents in the world according to statistics compiled by the Federal Road Safety Commission (FRSC). The country leads 43 other nations with killed in 10,000 vehicle crashes. Ethiopia ranked second with 219 killed per 10,000 vehicles while Malawi, took the third position and Ghana took the fourth position with 183 and 178 killed respectively [1]. Road traffic accidents is one of the leading causes of death among older children and economically active adults between the ages 30 and 49 years ([8];[9]; [6]). Considering the importance of the road and the increased level of road traffic accidents in recent years along the Nigeria roads, this study aimed at characterizing the road traffic accident in Nigeria by providing appropriate models that explain the consequences of killed, injured and the total casualty from road accident in the country so as to provide an enabling base for the development of countermeasures by the government and the traffic control agents to reduce incidences of road traffic accident on the road. Time series analysis encompases methods for analyzing data ordered in time in order to develop appropriate model and other characteristics of the time ordered data. It is commonly used in the fields of business, economics, finance, agriculture among others, as appropriate tool for model building. It systematics examine the ordered data with the aim of studying dynamic regularities that may enable forecasting future or even controlling the variable, the forecast model will then be used to predict future values based on previously observed values. In theory, Auto-regressive Integrated Moving Averages ARIMA Models are the most universal class of models for forecasting a time series data. As proposed by Box and Jenkins, that in general, forecasting based on ARIMA models comprises of three different steps: Model Identification, Parameter estimation and Diagnostic checking. Until a desirable model for the data is identified, the three steps will be repeated [3]. The method of Box and Jenkins dictates an iterative process requiring a sound understanding of time series analysis technique, some degree of judgement and many rounds of trials [13]. Numerous works have been done on the analysis of Road accidents. [5] examined road accidents in Kuwait, he used an ARIMA model and compared it with ANN to predict killed in Kuwait, he concluded that ANN was better in case of long term series without seasonal fluctuations of accidents or autocorrelations’ components. [4] used Bayesian Model for ranking hazardous road sites, their model made use of all relevant information per accident location, including the total number of accidents and the number of killed, as well as the number of slight and serious injuries. Moreover, the model included the use of a cost function to rank the sites with respect to their total expected cost to society.
-
Upload
journalsats -
Category
Engineering
-
view
52 -
download
2
Transcript of Ijcatr04041010

International Journal of Computer Applications Technology and Research
Volume 4– Issue 4, 262 - 273, 2015, ISSN:- 2319–8656
www.ijcat.com 262
CONSEQUENCES OF ROAD TRAFFIC ACCIDENT
IN NIGERIA: TIME SERIES APPROACH
F.B. Adebola
Department of Statistics
Federal University of
Technology Akure.
Nigeria.
Ridwan A Sanusi
Department of Mathematics
and Statistics
King Fahd University of
Petroleum and Minerals,
Saudi Arabia.
N.A. Adegoke
Department of Statistics
Federal University of
Technology Akure.
Nigeria.
Abstract: Road traffic accident in Nigeria is increasing at a worrying rate and has raised one of the country major concerns. We
provided appropriate and suitable time series model for the consequences of road accident, the injured, killed and total casualty of the
road accident in Nigeria. The most widely used conventional method, Autoregressive Integrated Moving Average (ARIMA) model of
time series, also known as Box-Jenkins method is applied to yearly data on the consequences of road accident data in Nigeria from
1960-2013 to determine patterns of road traffic accident consequences; injured, killed and total casualty of the road accident along the
Nigeria motorway. Appropriate models are developed for the accident consequences; injured, killed and total casualty. ARIMA (0; 2;
1) model is obtained for the injury and total casualty consequences, whilst ARIMA(1,2,2) model is obtained for the killed
consequences, using the data from 1960-2011. The adequacy and the performance of the model are tested on the remaining data from
2012 to 2013. Seven years forecast are provided using the developed models and showed that road traffic accident consequences
examined; injured, killed and total casualty would continue to increase on average.
Keywords: ARIMA; forecast; injured; killed; casualty
1. INTRODUCTION Road Traffic Accident occurs when there is collision of
vehicle with another vehicle, pedestrian and animals among
other, which at times result in injury, loss of property and
death. As mentioned in [11], road traffic accident leads to
approximately two million killed and approximately ten
million injuries annually. Also, an estimated value of 3000
people die in the world as a result of road traffic accidents
daily. A prediction of global leading causes of killed from
2008 to 2030 by World Health Organization revealed that, if
current trends and patterns continue, road traffic accidents
will increase from ninth to fifth of world leading cause of
killed 3.6% of global killed, up from 2.2% in 2004 [11].
While, disability-adjusted life years will rise from ninth with
2.7% of total disability-adjusted life in 2004 to third and 4.9%
of total disability-adjusted life in 2030 [10].
Nigeria, the most populous black country, has the highest rate
of mortality from road accidents in the world according to
statistics compiled by the Federal Road Safety Commission
(FRSC). The country leads 43 other nations with killed in
10,000 vehicle crashes. Ethiopia ranked second with 219
killed per 10,000 vehicles while Malawi, took the third
position and Ghana took the fourth position with 183 and 178
killed respectively [1].
Road traffic accidents is one of the leading causes of death
among older children and economically active adults between
the ages 30 and 49 years ([8];[9]; [6]). Considering the
importance of the road and the increased level of road traffic
accidents in recent years along the Nigeria roads, this study
aimed at characterizing the road traffic accident in Nigeria by
providing appropriate models that explain the consequences of
killed, injured and the total casualty from road accident in the
country so as to provide an enabling base for the development
of countermeasures by the government and the traffic control
agents to reduce incidences of road traffic accident on the
road.
Time series analysis encompases methods for analyzing data
ordered in time in order to develop appropriate model and
other characteristics of the time ordered data. It is commonly
used in the fields of business, economics, finance, agriculture
among others, as appropriate tool for model building. It
systematics examine the ordered data with the aim of studying
dynamic regularities that may enable forecasting future or
even controlling the variable, the forecast model will then be
used to predict future values based on previously observed
values. In theory, Auto-regressive Integrated Moving
Averages ARIMA Models are the most universal class of
models for forecasting a time series data. As proposed by Box
and Jenkins, that in general, forecasting based on ARIMA
models comprises of three different steps: Model
Identification, Parameter estimation and Diagnostic checking.
Until a desirable model for the data is identified, the three
steps will be repeated [3]. The method of Box and Jenkins
dictates an iterative process requiring a sound understanding
of time series analysis technique, some degree of judgement
and many rounds of trials [13].
Numerous works have been done on the analysis of Road
accidents. [5] examined road accidents in Kuwait, he used an
ARIMA model and compared it with ANN to predict killed in
Kuwait, he concluded that ANN was better in case of long
term series without seasonal fluctuations of accidents or
autocorrelations’ components. [4] used Bayesian Model for
ranking hazardous road sites, their model made use of all
relevant information per accident location, including the total
number of accidents and the number of killed, as well as the
number of slight and serious injuries. Moreover, the model
included the use of a cost function to rank the sites with
respect to their total expected cost to society.

International Journal of Computer Applications Technology and Research
Volume 4– Issue 4, 262 - 273, 2015, ISSN:- 2319–8656
www.ijcat.com 263
A procedure of Road Traffic Injury (RTI) in China by using
RTI data from 1951 to 2003 was established by [12]. A series
of predictive equations on RTI were established based on
ARIMA models. They concluded that time series models thus
established proves to be of significant usefulness in RTI
prediction. Two time series techniques; ARMA and Holt-
Winters (HW) algorithm to predict annual motor vehicle crash
killed were used by [7]. They concluded that the values
predicted by ARMA models are a little bit higher than the
ones obtained by HW algorithm. Intervention analysis with
univariate Box-Jenkins method to identify whether a change
in a particular policy had made an impact on the trends in
killed and fatality rates in Illinois was used [2]. He developed
ARIMA forecasting model for future trends in motorway
killed in an effort to provide assistance to policy development
in reducing fatality rates in Illinois.
Time series analysis have been used in many fields of research
and road safety is no exception. The results of this research
would also add to the many research works carried out in road
safety.
2. MATERIALS AND METHODS
Data used for the study is a secondary data, it was collected
on yearly basis from the office of the Federal Road Safety
Corps of Nigeria for the period 1960 to 2013. The data
represents the total number of registered consequences of
injuries, killed and total casualty for the period under study.
The Box and Jenkins approach for time series analysis was
employed for data analysis. According to Box and Jenkins,
as mentioned above, the steps include, the identification of
appropriate model for the data under study, estimation of
model parameters, model diagnostic and adequacy checking
and lastly, the model, if found appropriate would be used for
forecasting. Data from 1960 to 2011 are used for models
building, while, data from 2012 to 2013 are used for models
validation and forecast values of the best models for the
variables under study are obtained from 2014 to 2020.
Meanwhile, It is worth mentioning here that because of the
volume of the work, the best models out of several competing
models that explain the variables under study are only
included in the work.
3. MODEL BUILDING The first step in model building is to obtain the time plot of
the data. This will give us an insight of the behaviour of the
series. Figures (1a, 1b, and 1c) show the time series plot of
injuries consequences, killed consequences and total casualty
from the total number of road accident in Nigeria.
The plots exhibit upward and downward movement for all the
three variables under study, with some significant upward and
downward trends at some parts of the series. The mean and
variance of the variables are not stable and varies with time.
The autocorrelation function of the studied variables has
shown in Figure (2a), Figure (2b) and Figure (3) describe the
correlation between values of the studied variables at different
points in time, as a function of the time difference. The first
several autocorrelations are persistently large and trailed off to
zero rather slowly for all the three variables and their spikes
also went of the autocorrelations limit at lag 13 the variables
under study.
Figure 1a: Time Series Plot of Injured Victims from Road
Accidents in Nigeria.
Figure 1b: Time Series Plots of killed from Road Accidents in
Nigeria.
Figures 1c: Time Series Plot of Total Casualty from Road
Accidents in Nigeria.

International Journal of Computer Applications Technology and Research
Volume 4– Issue 4, 262 - 273, 2015, ISSN:- 2319–8656
www.ijcat.com 264
The Augmented Dickey Fuller test as given in Figures (4a and
4b) and Figure (5) give a p-value of 0.91 for the injured
Figure 2a: Correlogram Plot of the Injured Victims Nigeria
Figure 2b: Correlogram Plot of the killed from Road
Accidents in Nigeria
Figure 3: Correlogram Plot of the Total Casualty from Road
Accidents in Nigeria.
Figure 4a: Unit Root Test of Injured consequences from Road
Accidents in Nigeria.
Figure 4b: Unit Root Test of killed from Road Accidents in
Nigeria.
victims, 0.6412 for the killed consequences and 0.8779 for the
total casualty, these indicate the presence of unit roots for the
series. All these aforementioned characteristics of the studied
variables show that the series are not stationary, thus require
differencing.
International Journal of Computer Applications Technology and Research
Volume 4– Issue 4, 262 - 273, 2015, ISSN:- 2319–8656
www.ijcat.com 265
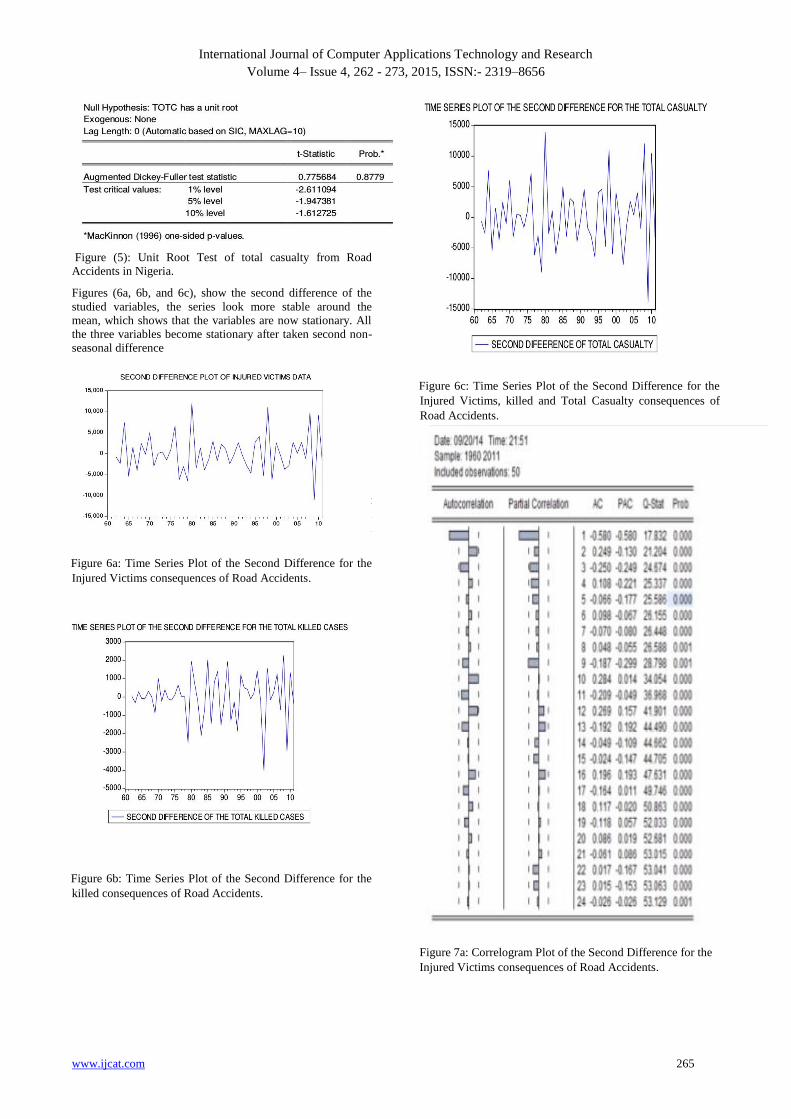
Figure (5): Unit Root Test of total casualty from Road
Accidents in Nigeria.
Figures (6a, 6b, and 6c), show the second difference of the
studied variables, the series look more stable around the
mean, which shows that the variables are now stationary. All
the three variables become stationary after taken second non-
seasonal difference
distinguishing source code text. If Times Roman is not
available, try the font named Computer Modern Roman. On a
Macintosh, use the font named Times. Right margins should
be justified, not ragged.
Figure 6a: Time Series Plot of the Second Difference for the
Injured Victims consequences of Road Accidents.
Figure 6b: Time Series Plot of the Second Difference for the
killed consequences of Road Accidents.
Figure 6c: Time Series Plot of the Second Difference for the
Injured Victims, killed and Total Casualty consequences of
Road Accidents.
Figure 7a: Correlogram Plot of the Second Difference for the
Injured Victims consequences of Road Accidents.

International Journal of Computer Applications Technology and Research
Volume 4– Issue 4, 262 - 273, 2015, ISSN:- 2319–8656
www.ijcat.com 266
Figure 7b: Correlogram Plots of the Second Difference for the
killed consequences of Road Accidents.
Figure 7c: Correlogram Plots of the Second Difference for the
Total Casualty consequences of Road Accidents.
The autocorrelation functions of the second difference for the
studied variables, has shown in Figures (7a, 7b, and 7c), also
confirm that the second difference are now stationary. Also,
the Augmented Dickey Fuller test as given in Figures (8a, 8b,
and 8c) gave a p-value of 0.000 for the Injured victims, 0.0004
for the killed consequences and 0.000 for the total casualty,
these also indicate the absence of unit roots in the series,
which confirm that the second differenced series are
stationary.
Figure 8a: Unit Root Test for the Second Difference for the
Injured Victims consequences of Road Accidents.
Figure 8b: Unit Root Tests for the Second Difference for the
killed consequences of Road Accidents.
Figure 8c: Unit Root Tests for the Second Difference for the
Total Casualty consequences of Road Accidents.
By comparing the autocorrelations functions with their error
limits, the only significant autocorrelations are at lag 1 for all
the three variables, that is, the autocorrelations cut off after
lag one which shows the existence of MA(1) behavior.
Similarly, the partial autocorrelations also cut off after lag one
for the injured consequences and total casualty, this indicates
the existence of AR(1) for the two variables (that is, injured
consequences and total casualty). Meanwhile, the partial
autocorrelation cuts off after lag two for the killed
consequences, which shows the existence of AR(1) and AR(2)
for the variable. Based on the features of the correlogram
plots of the stationary series, the following model in Figure
(1), are suggested.
Table 1: Suggested Models Based on the Correlogram Plots
Injured Victims killed Total Casualty
ARIMA(0,2,1) ARIMA(0,2,2) ARIMA(0,2,1)
ARIMA(1,2,0) ARIMA(1,2,2) ARIMA(1,2,0)
ARIMA(1,2,1) ARIMA(1,2,3) ARIMA(1,2,1)

International Journal of Computer Applications Technology and Research
Volume 4– Issue 4, 262 - 273, 2015, ISSN:- 2319–8656
www.ijcat.com 267
Each of the model is assessed based on its parameter
estimates, the corresponding diagnostics of the residuals, the
AIC and SIC in order to select the best model for forecasting
into the future. Meanwhile, out of all the competing models
that explain the variable of interest, the best models are;
ARIMA(0,2,1) for the Injured Victims consequences,
ARIMA(1,2,2) for killed consequences and ARIMA(0,2,1) for
the total casualty. The models are given in Figures (9a, 9b,
and 10).
Time Series Models for the Injured Victims, killed and
Total Casualty consequences of Road Accidents are given in
Figures (9a, 9b, and 10), the models coefficients are
significant and all the inverted AR roots satisfy the minimum
stationarity condition, the invertibility condition of MA is
satisfied and also. Also, the Durbin-Watson statistics is not far
from 2, which implies that there is no serial correlation in the
model residual, that is the model residual is not forecastable.
Figure 9a: Time Series Models for the Injured Victims
consequences of Road Accidents.
Figure 9b: Time Series Models for the killed consequences of
Road Accidents.
Figure 10: Time Series Models for the consequences of Road
Accidents
Also, all the Q-Stat of the correlogram plot of models
residuals are greater than 0.05 for the lags as given in Figures
(11a and 11b) and Figure (12), these imply that the model
residuals are White-Noise, that is adjacent observations are
not related (random) and which support the fact that the
models may be the appropriate models for the observed time
series.
Figure 11a: Correlogram Plot of the Residuals for the Injured
Victims killed of Road Accidents.

International Journal of Computer Applications Technology and Research
Volume 4– Issue 4, 262 - 273, 2015, ISSN:- 2319–8656
www.ijcat.com 268
Figure 11b: Correlogram Plot of the Residuals for the killed of
Road Accidents.
Figure 12: Correlogram Plot of the Total Casualty
consequences of Road Accidents.
Figure 13a: Unit Root Test for the Injured Victims
consequences of Road Accidents.
Figure 13b: Unit Root Test for the killed consequences of
Road Accidents.
Figure 13c: Unit Root Test for the Total Casualty
consequences of Road Accidents.
The unit roots tests of the models as given in Figures (13a,
13b, and 13c), show that the inverse roots of the models are
within a unit circle, which confirmed that the models in
Figures (9a, and 9b) and Figure (10) are stationary and
invertible. Thus, the models can be written as general linear
form
Figure 14a: Residual Plot for the Injured Victims
consequences of Road Accidents.

International Journal of Computer Applications Technology and Research
Volume 4– Issue 4, 262 - 273, 2015, ISSN:- 2319–8656
www.ijcat.com 269
Figure 14b: Residual Plot for the killed consequences of Road
Accidents.
Figure 14c: Residual Plot for the Total Casualty consequences
of Road Accidents.
The residual plots of the models as shown in Figures (14a,
14b, and 14c), also confirm that the models residuals are
random and non-forecastable, which implies that the models
are good.
Figures (15a, 15b, and 15c) gives the visual representation of
the original Injured consequences, killed consequences and
the Total casualty consequences, the data (blue line) and
confidence interval (red
Figure 15a: In-sample Forecast Graph for the Injured cases.
Figure 15b: In-sample Forecast Graph for the killed cases.
Figure 15c: In-sample Forecast Graph for the Total Casualties.
lines). The in-sample forecasts for the models fall within the
95% confidence Interval. Figures (16a, 16b, and 17) give the
in-sample models evaluations, the bias proportion and
variance proportion, which are used to check how far is the
forecast mean from the mean of the actual series and how far
is the forecast variance from the variance of the actual series
respectively are very close to zero and comparatively much
lower than the covariance proportion which measure the
remaining systematic forecast error. Note, the sum of the bias
proportion, variance proportion and the covariance proportion
is 1.
Figure 16a: In-sample Forecast Evaluation for the Injured
cases.

International Journal of Computer Applications Technology and Research
Volume 4– Issue 4, 262 - 273, 2015, ISSN:- 2319–8656
www.ijcat.com 270
Figure 16b: In-sample Forecast Evaluation for the killed
cases.
Figure 17: In-sample Forecast Evaluation for the
Total Casualties
3.1 MODEL VALIDATION
Table 2: Validation Table for ARIMA(0,2,1) Model of Injured
consequences.
Year Injured
consequences Forecast % Variation
2012 39348 42213.26 7.28%
2013 40057 43261.51 7.99%
After determining the best-fit model for the series and
estimating related parameters, the third phase of Box-Jenkins
fitting model was evaluated for series prediction. Using the
ARIMA (0,2,1) model, the model predicted that in 2012 an
approximately 42213.26 Injure consequences, this gives
7.28% percentage increase when compared with the real value
of 39348 Injured consequences. Also, the model predicted that
in 2013 an approximately 43261.51 Injure consequences, this
gives 7.99% percentage increament when compared with the
real value of 40057 Injured consequences as given in Table
(2).
Table 3: Validation Table for ARIMA(1,2,2) Model of Killed
consequences.
Year killed
consequences Forecast % Variation
2012 6092 6046.28 -0.75%
2013 6544 6236.27 -4.702%
Also, Table (3) gives the model validation for ARIMA (1,2,2)
model. The model predicted that in 2012 an approximately
6046.28 killed consequences of accident, this gives 0.75%
percentage decrease when compared with the real value of
6092 killed consequences. Also, the model predicted that in
2013 an approximately 6236.27 killed consequences, this
gives 4.702% percentage decrease when compared with the
real value of 6544 killed consequences.
Table 4: Validation Table for ARIMA(0,2,1) Model of Total
Casualty.
Lastly, Table (4) gives the model validation for ARIMA
(0,2,1) model. The model predicted that in 2012 an
approximately 46504.31 Total casualty consequences of
accident, this gives 2.34% percentage increase when
compared with the real value of 4544 total casualty
consequences. Also, the model predicted that in 2013 an
approximately 46838.61 total casualty consequences, this
gives 0.51% percentage increase when compared with the real
value of 46601 killed consequences.
Year Total
Casualy Forecast % Variation
2012 45440 46504.31 2.34%
2013 46601 46838.61 0.51%

International Journal of Computer Applications Technology and Research
Volume 4– Issue 4, 262 - 273, 2015, ISSN:- 2319–8656
www.ijcat.com 271
3.2 Models Forecasting
Table 5: Forecast Table for ARIMA(0,2,1) Model of Injured
consequences.
Table 6: Forecast Table for ARIMA(1,2,2) Model of killed
consequences.
Table 7: Forecast Table for ARIMA(0,2,1) Model of Total
Casualty consequences.
Year
Lower
Control
Limit
Forecast
Upper
Control
Limit
2014 32833.4 47415.9 61998.3
2015 30053.2 47145.8 64238.5
2016 27649.7 46679.6 65709.6
2017 26135.3 46897.7 67660.1
2018 24745.0 47274.3 69803.6
2019 22911.4 47098.1 71284.9
2020 21177.0 46794.0 72410.9
Figure 18a: Forecast Plot for the Injured cases.
Figure 18b: Forecast Plot for the killed cases.
Year
Lower
Control
Limit
Forecast
Upper
Control
Limit
2014 31660.6 44309.8 56959.2
2015 30375.7 45358.1 60340.4
2016 29235.8 46406.3 63576.8
2017 28186.1 47454.5 66722.9
2018 27195.4 48502.8 69810.2
2019 26243.8 49551.1 72858.3
2020 25318.2 50599.3 75880.4
Year
Lower
Control
Limit
Forecast
Upper
Control
Limit
2014 2775.5 6261.7 9747.9
2015 2299.2 6424.1 10549.0
2016 1853.8 6472.4 11091.0
2017 1481.3 6615.8 11750.2
2018 1107.5 6680.0 12252.5
2019 785.5 6810.1 12834.6
2020 455.6 6885.4 13315.2

International Journal of Computer Applications Technology and Research
Volume 4– Issue 4, 262 - 273, 2015, ISSN:- 2319–8656
www.ijcat.com 272
Figure 18c: Forecast Plot for the Total Casualties.
3.3 General Difference Form of the
Models. The general difference of ARIMA (0,2,1); Injured
consequences is given as,
Yt = 2Yt−1 − Yt−2 + et − θ1et−1,
Yt = 2Yt−1 − Yt−2 + et − θ1et−1.
Substituting the value θ as given in Figure (9a), then the
model for the Injured consequences becomes,
Yt = 2Yt−1 − Yt−2 + et + 0.954388et−1.
Also, the general difference of ARIMA (1,2,2); killed
consequences is given as,
Yt = 2Yt−1 − Yt−2 + ψ1(Yt−1 − 2Yt−2 + Yt−3) + et − θ1et−1 −
θ2et−2,
but θ1 = 0,
Yt = (2 + ψ1)Yt−1 − (1 + 2ψ1)Yt−2 + ψ1Yt−3 + et − θ2et−2.
Substituting the values of ψ and θ as given in Figure (9b), then
the model for the killed consequences becomes,
Yt = 1.167534Yt−1 + 0.66492Yt−2 − 0.832466Yt−3 + et +
0.968707et−2.
Lastly, the general difference of ARIMA (0,2,1); total casualty
consequences is given as,
Yt = 2Yt−1 − Yt−2 + et − θ1et−1,
Yt = 2Yt−1 − Yt−2 + et − θ1et−1,
Substituting the value θ as given in Figure (10), then the
model for the total casualty consequences becomes,
Yt = 2Yt−1 − Yt−2 + et + 0.959777et−1.
4. Discussion
Road traffic accident in Nigeria is increasing at a worrying
and alarming rate and has raised one of the country major
concerns. Federal Road Safety Corps of Nigeria recognizes
the negative impacts of road safety accident and has
commended the positive contribution of road safety researches
as necessary tools to have significant accident initiatives. The
paper was carried out in order to identify the patterns of road
traffic accident consequences; injured, killed and total
casualty by developing appropriate time series ARIMA
models and predict 7 years consequences of road traffic
accident; injured, killed and total casualty along the Nigeria
motorway.
Time series analysis of the data from the years 1960-2013
showed that patterns of road traffic accident consequence;
injured; killed and total casualty are increasing along the
Nigeria motorway. The most widely used conventional
method of time series known as Autoregressive Integrated
Moving Average (ARIMA) model was applied to the annual-
consequence of road accident data in Nigeria from 1960-2013
to determine patterns of road traffic accident consequences;
injured, killed and total casualty of the road accident along the
Nigeria motorway. After identifying various tentative models
the appropriate models for the accident consequences; injured,
killed and total casualty. ARIMA (0,2,1) model was found to
be suitable model for the injury and total casualty
consequences, whilst ARIMA(1,2,2) model was found to be
suitable model for the killed consequences using the data from
1960-2011. The adequacy and performance of the model were
tested on the remaining data from 2012 to 2013.
We provided 7 years forecasts of the consequences of road
accident using the models developed and they showed that,
road traffic accident consequences examined; injured, killed
and total casualty will continue to increase. The study also
revealed that road traffic accident cases; injured and killed
along the motorway would continue to increase over the next
7 years. This study has provided reliable and genuine
information that could be useful for determining road accident
rate on Nigeria motorway and provide necessary prevention
for the unwanted act. The study will also be used for
providing important information in raising the level of
awareness among stakeholders in road safety, since the
problem has become a growing rife in Nigeria and also, be
useful in setting priorities when planning road traffic accident
interventions. Most Importantly, this study will provide
expected benefit to the road users, Federal Road Safety Corps,
researchers and other stakeholders in understanding the future
rate of the consequences of road accident.
5. RECOMMENDATION We have derived appropriate ARIMA Models that explain the
behaviour and also the future patterns of the consequences of
Road Accident along motor highway in Nigeria. Meanwhile,
caution should be exercise in using the model, as it should not
be used beyond the forecasted period, this is mainly because
long time forecast may give arbitrary large forecast. Also,
appropriate laws should be made to caution drivers that over-
speed beyond the standard. Strict laws should be made to
enforce the use of seat-belt among the driver and also, the
passenger sitting in the front seat. This if enforced may reduce
the critical state of the accident.
The Federal Road Safety Corp (FRSC) and all the
stakeholders in charge of motorway in Nigeria should ensure
proper maintenance of the motorway, it should be maintained
in terms of the use of appropriate materials for patching pot
holes, provision of street lights to aid visibility in the night,
installation of traffic lights at new intersections created along
the road. Also, proper education should be made known to the
drivers on how to overtake on the motorway.

International Journal of Computer Applications Technology and Research
Volume 4– Issue 4, 262 - 273, 2015, ISSN:- 2319–8656
www.ijcat.com 273
Appropriate training and retraining of drivers should be
encourage towards reducing the carnage on over roads this
will greatly reduce the rate of road traffic accident in the
country. Road signals and signs that guide and instruct the
drivers on what is happening in some kilometers ahead should
always be made available on the motorway. Drivers should be discourage from receiving or making calls while driving.
6. REFERENCES
[1] Augustus O Atubi. Road traffic accident variations in
lagos state, nigeria: A synopsis of variance spectra.
African Research Review, 4(2), 2010.
[2] Cemal AYVALIK. Determinants of motor vehicle
fatalities and fatality rates: Some preliminary findings
for illinois.
[3] G.E.P. Box, G.M. Jenkins, and G.C. Reinsel.
Time Series Analysis: Forecasting and
Control. Wiley Series in Probability and Statistics.
Wiley, 2013.
[4] Tom Brijs, Dimitris Karlis, Filip Van den Bossche,
and Geert Wets. A bayesian model for ranking
hazardous road sites. Journal of the Royal Statistical
Society: Series A (Statistics in Society), 170(4):1001–
1017, 2007.
[5] MOHAMMED A Hajeeh. Analysis of traffic
problems in kuwait. 12:85–90, 2012.
[6] Goff Jacobs, Amy Aeron-Thomas, and Angela
Astrop. Estimating global road fatalities.
TRL, 2000.
[7] Cejun Liu and Chou-Lin Chen. Time series analysis
and forecast of annual crash fatalities. parameters,
41876(37501):46251, 2004.
[8] CJL Murray, AD Lopez, World Health Organization,
et al. A comprehensive assessment of mortality and
disability from diseases, injuries, and risk factors in
1990 and projected to 2020. The global burden of
disease. Cambridge (MA): Harvard School of Public
Health, 1996.
[9] Alan Ross, Chris Baguley, and Brian Hills. Towards
Safer Roads in Developing Countries. A Guide for
Planners and Engineers. Prepared by the Ross
Silcock Partnership on
Behalf of and in Association With, the Overseas Unit of
the Transport and Road Research Laboratory. Ross
Silcock Partnership, 1991.
[10] Wim Van Lerberghe. The world health report 2008:
primary health care: now more than ever. World
Health Organization, 2004.
[11] Wim Van Lerberghe. The world health report 2008:
primary health care: now more than ever. World
Health Organization, 2008.
[12] Jin Wen, P Yuan, ZH Deng, KL Liu, Yue-Kang
Zhang, Li-Ke Liu, Bin Kong, and SX Huang. [time-
series analysis on road traffic injury in china].
Sichuan da xue xue bao. Yi xue ban= Journal of
Sichuan University. Medical science edition,
36(6):866–869, 2005.
[13] Chien-Ho Wu. Arima models are clicks away.
Applied mechanics and Materials, 411- 414Publisher
Trans Tech Publications, Switzerland.