HP Service Manager - docs.microfocus.com · Service Desk reports 70 ... Service Manager. Report...
77
HP Service Manager Software Version: 9.41 For the supported Windows® and UNIX® operating systems SM Reports help topics for printing Document Release Date: September 2015 Software Release Date: September 2015
Transcript of HP Service Manager - docs.microfocus.com · Service Desk reports 70 ... Service Manager. Report...
HP Service ManagerSoftware Version: 9.41
For the supported Windows® and UNIX® operating systems
SM Reports help topics for printing
Document Release Date: September 2015Software Release Date: September 2015
Legal Notices
WarrantyThe only warranties for HP products and services are set forth in the express warranty statements accompanying such products and services. Nothing herein should be construed as constituting an additional warranty. HP shall not be liable for technical or editorial errors or omissions contained herein.
The information contained herein is subject to change without notice.
Restricted Rights LegendConfidential computer software. Valid license from HP required for possession, use or copying. Consistent with FAR 12.211 and 12.212, Commercial Computer Software, Computer Software Documentation, and Technical Data for Commercial Items are licensed to the U.S. Government under vendor's standard commercial license.
Copyright Notice© 1994-2015 Hewlett-Packard Development Company, L.P.
Trademark NoticesAdobe® is a trademark of Adobe Systems Incorporated.
Microsoft® and Windows® are U.S. registered trademarks of Microsoft Corporation.
Oracle and Java are registered trademarks of Oracle and/or its affiliates.
UNIX® is a registered trademark of The Open Group.
Linux® is the registered trademark of Linus Torvalds in the U.S. and other countries.
For a complete list of open source and third party acknowledgements, visit the HP Software Support Online web site and search for the product manual called HP Service Manager Open Source and Third Party License Agreements.
Documentation UpdatesThe title page of this document contains the following identifying information:
l Software Version number, which indicates the software version. l Document Release Date, which changes each time the document is updated. l Software Release Date, which indicates the release date of this version of the software.
To check for recent updates or to verify that you are using the most recent edition of a document, go to: https://softwaresupport.hp.com/.
This site requires that you register for an HP Passport and to sign in. To register for an HP Passport ID, click Register on the HP Support site or click Create an Account on the HP Passport login page.
You will also receive updated or new editions if you subscribe to the appropriate product support service. Contact your HP sales representative for details.
SupportVisit the HP Software Support site at: https://softwaresupport.hp.com.
This website provides contact information and details about the products, services, and support that HP Software offers.
HP Software online support provides customer self-solve capabilities. It provides a fast and efficient way to access interactive technical support tools needed to manage your business. As a valued support customer, you can benefit by using the support website to:
l Search for knowledge documents of interest l Submit and track support cases and enhancement requests l Download software patches l Manage support contracts l Look up HP support contacts l Review information about available services l Enter into discussions with other software customers l Research and register for software training
Most of the support areas require that you register as an HP Passport user and to sign in. Many also require a support contract. To register for an HP Passport ID, click Register on the HP Support site or click Create an Account on the HP Passport login page.
To find more information about access levels, go to: https://softwaresupport.hp.com/web/softwaresupport/access-levels.
HPSW Solutions Catalog accesses the HPSW Integrations and Solutions Catalog portal website. This site enables you to explore HP Product Solutions to meet your business needs, includes a full list of Integrations between HP Products, as well as a listing of ITIL Processes. The URL for this website is https://softwaresupport.hp.com/group/softwaresupport/search-result/-/facetsearch/document/KM01702710.
About this PDF Version of Online HelpThis document is a PDF version of the online help. This PDF file is provided so you can easily print multiple topics from the help information or read the online help in PDF format. Because this content was originally created to be viewed as online help in a web browser, some topics may not be formatted properly. Some interactive topics may not
SM Reports help topics for printing
HP Service Manager (9.41) Page 2 of 77

be present in this PDF version. Those topics can be successfully printed from within the online help.
SM Reports help topics for printing
HP Service Manager (9.41) Page 3 of 77
Contents
Service Manager Reports introduction 6
User roles 6
Key concepts 6
Administrator tasks 7
Set home page preferences 8
Service Manager Reports user roles 9
Migrate MySM content 10
My reports 11
Create a report 11
Report properties 12
Report calculation chart properties 14
Sample report for calculation 16
Report duration chart properties 18
Sample report for duration 20
Create a calculation report by using duration metrics 22
Update a report in a dashboard 23
Build the query strings 24
Report types and settings 25
Chart > Pie 26
Chart > Horizontal bar 28
Chart > Vertical bar 30
Chart > Stacked Horizontal bar 32
Chart > Stacked Vertical bar 34
Chart > Number 36
Chart > Line 38
Chart > Area 39
List > Standard list 41
List > Title list 41
Pivot Table 43
My dashboards 46
SM Reports help topics for printing
HP Service Manager (9.41) Page 4 of 77
Create a dashboard 46
Dashboard properties 47
Add reports to a dashboard 47
Update a dashboard 48
Report schedule and distribution 50
Create a report schedule 50
Background schedule process 53
Report schedule task lifecycle 54
Apply a template to complete a report schedule 55
Report administration 56
Report category 56
Add a report category 59
Report running status 60
Configure Report settings 61
Enable Replicated Database 64
Enable query cache 65
Report descriptions and usage 66
Incident Management reports 66
Change Management reports 67
Problem Management reports 69
Service Desk reports 70
Request Fulfillment reports 72
Configuration Item reports 72
Knowledge Management reports 73
License reports 73
SLA reports 74
Time duration and calculation reports 74
Send Documentation Feedback 76
SM Reports help topics for printing
HP Service Manager (9.41) Page 5 of 77
Service Manager Reports introductionThe HP Service Manager Reports feature provides reports and dashboards to enable faster analysis and
improved time to resolution. Service Manager reports organize data into various chart formats, and
dashboards display one or more reports. These reports display relationships among categories of data.
For example, one report might display the number of incidents per customer. Another report might
display the number of incidents by priority. Viewing these reports together as a dashboard enables you
to make better business decisions, such as assigning resources to close incidents.
Service Manager Reports aims to provide a light-weight reporting feature for active operational data,
so the reports are designed to retrieve, represent and visualize at most 100,000 active records out of
millions. To define analytic reports against the entire dataset, use third party business intelligence
tools.
Reports provide a dynamic view of records, data, and relationships. Dashboards collect similar reports
into an overview of data relationships. For example, separate reports can illustrate how many change
requests, open incidents, and requests are pending. A dashboard shows you the balance among change
requests as well as open incidents, and pending requests. Viewing these reports in a dashboard can help
you make decisions about resource allocation and prioritization.
Besides SM Reports, HP Executive Scorecard provides the unique capability to correlate financial data
based on procurements, maintenance, leasing, licenses, labor, and other project-related cost. HP Crystal
Reports provide improved reports and Business objects for the batch scheduling of reports. With the
appropriate developer license for Crystal Reports, all report files (*.rpt) can be customized to meet the
needs of your business. You can choose different reports according to your requirement.
User rolesDescribes SM Reports user roles as implemented by Service Manager.
Report Viewer
Report Designer
Report Manager
Report Administrator
Key conceptsDescribes the most important things that you need to know about how SM Reports module functions.
"My reports" on page 11
"My dashboards" on page 46
"Report schedule and distribution" on page 50
"Report types and settings" on page 25
Additional resources
Processes and Best Practices Guide
HP Service Manager (9.41) Page 6 of 77
Administrator tasksDescribes the Administrator tasks in SM Reports module.
"Configure Report settings" on page 61
"Migrate MySM content" on page 10
"Enable Replicated Database" on page 64
"Configure time duration settings" on page 1
SM Reports help topics for printing
Service Manager Reports introduction
HP Service Manager (9.41) Page 7 of 77
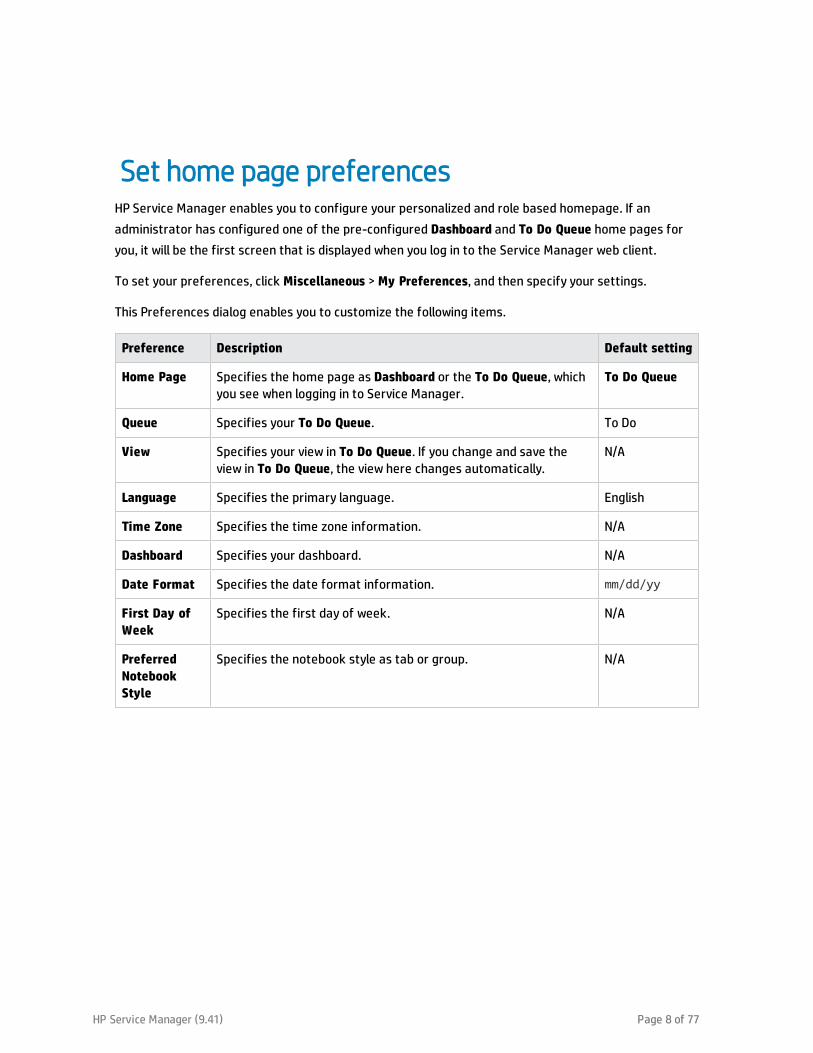
Set home page preferencesHP Service Manager enables you to configure your personalized and role based homepage. If an
administrator has configured one of the pre-configured Dashboard and To Do Queue home pages for
you, it will be the first screen that is displayed when you log in to the Service Manager web client.
To set your preferences, click Miscellaneous > My Preferences, and then specify your settings.
This Preferences dialog enables you to customize the following items.
Preference Description Default setting
Home Page Specifies the home page as Dashboard or the To Do Queue, which you see when logging in to Service Manager.
To Do Queue
Queue Specifies your To Do Queue. To Do
View Specifies your view in To Do Queue. If you change and save the view in To Do Queue, the view here changes automatically.
N/A
Language Specifies the primary language. English
Time Zone Specifies the time zone information. N/A
Dashboard Specifies your dashboard. N/A
Date Format Specifies the date format information. mm/dd/yy
First Day of Week
Specifies the first day of week. N/A
Preferred Notebook Style
Specifies the notebook style as tab or group. N/A
HP Service Manager (9.41) Page 8 of 77
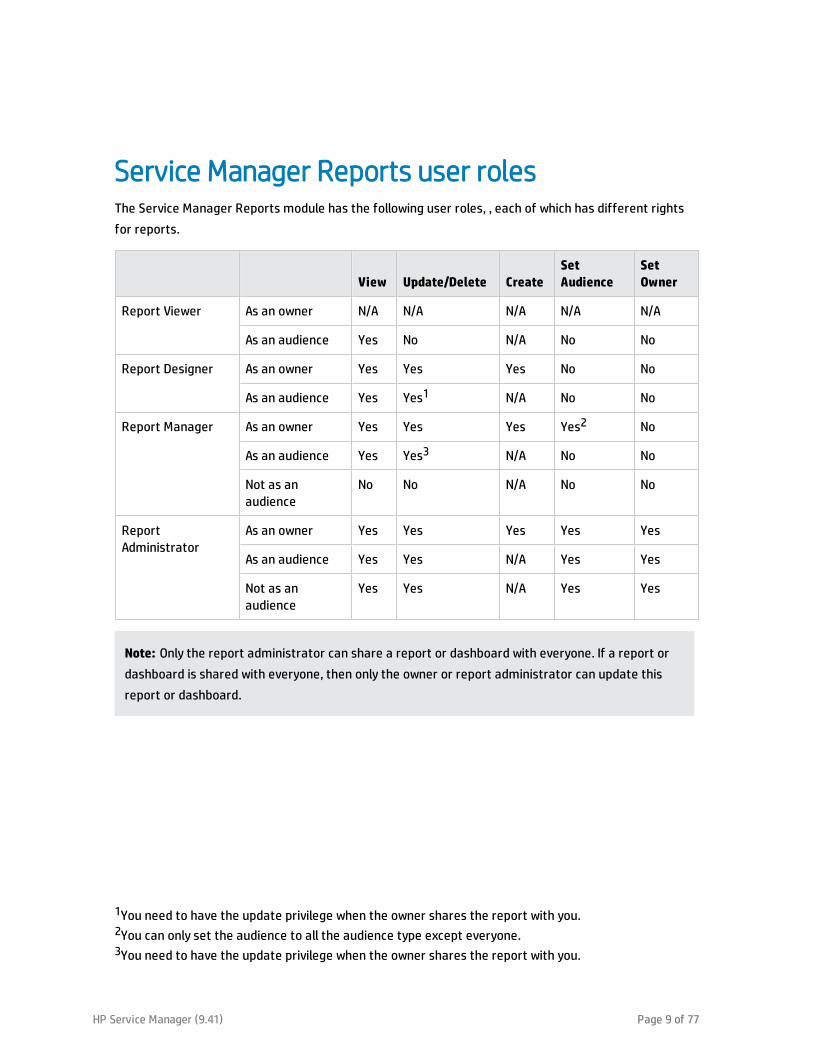
Service Manager Reports user rolesThe Service Manager Reports module has the following user roles, , each of which has different rights
for reports.
View Update/Delete CreateSet Audience
Set Owner
Report Viewer As an owner N/A N/A N/A N/A N/A
As an audience Yes No N/A No No
Report Designer As an owner Yes Yes Yes No No
As an audience Yes Yes1 N/A No No
Report Manager As an owner Yes Yes Yes Yes2 No
As an audience Yes Yes3 N/A No No
Not as an audience
No No N/A No No
Report Administrator
As an owner Yes Yes Yes Yes Yes
As an audience Yes Yes N/A Yes Yes
Not as an audience
Yes Yes N/A Yes Yes
Note: Only the report administrator can share a report or dashboard with everyone. If a report or
dashboard is shared with everyone, then only the owner or report administrator can update this
report or dashboard.
1You need to have the update privilege when the owner shares the report with you.2You can only set the audience to all the audience type except everyone.3You need to have the update privilege when the owner shares the report with you.
HP Service Manager (9.41) Page 9 of 77
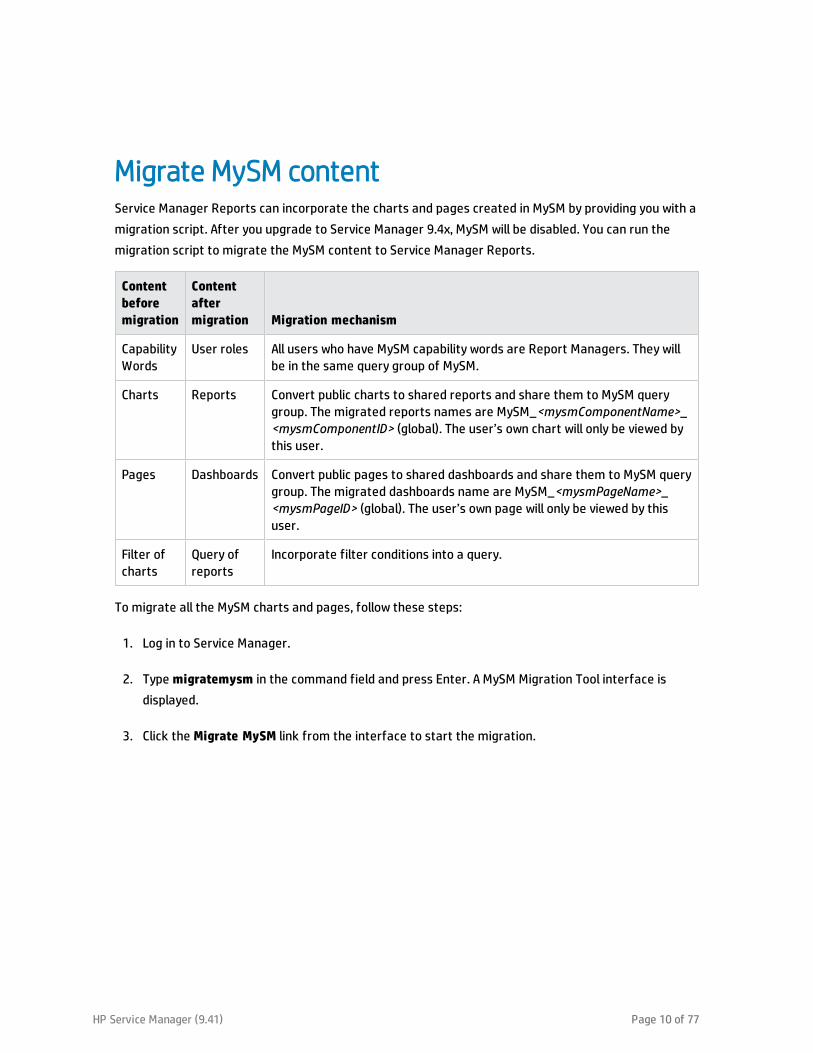
Migrate MySM contentService Manager Reports can incorporate the charts and pages created in MySM by providing you with a
migration script. After you upgrade to Service Manager 9.4x, MySM will be disabled. You can run the
migration script to migrate the MySM content to Service Manager Reports.
Content before migration
Content after migration Migration mechanism
Capability Words
User roles All users who have MySM capability words are Report Managers. They will be in the same query group of MySM.
Charts Reports Convert public charts to shared reports and share them to MySM query group. The migrated reports names are MySM_<mysmComponentName>_<mysmComponentID> (global). The user’s own chart will only be viewed by this user.
Pages Dashboards Convert public pages to shared dashboards and share them to MySM query group. The migrated dashboards name are MySM_<mysmPageName>_<mysmPageID> (global). The user’s own page will only be viewed by this user.
Filter of charts
Query of reports
Incorporate filter conditions into a query.
To migrate all the MySM charts and pages, follow these steps:
1. Log in to Service Manager.
2. Type migratemysm in the command field and press Enter. A MySM Migration Tool interface is
displayed.
3. Click the Migrate MySM link from the interface to start the migration.
HP Service Manager (9.41) Page 10 of 77
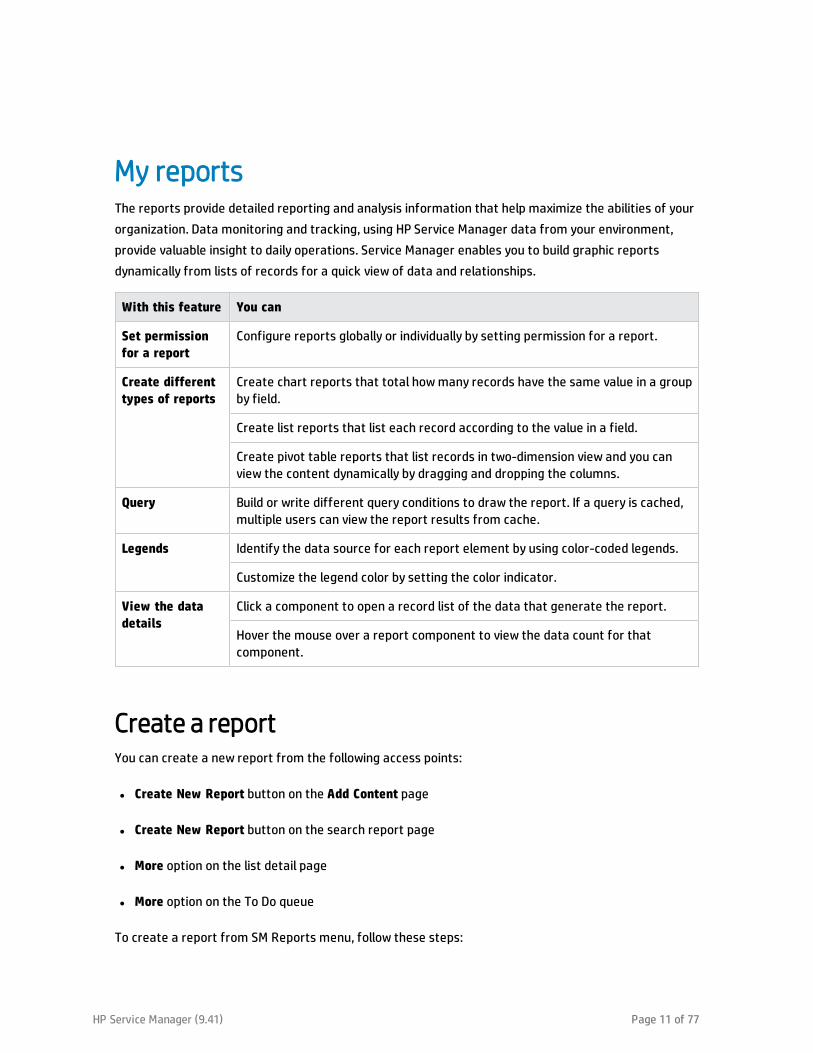
My reportsThe reports provide detailed reporting and analysis information that help maximize the abilities of your
organization. Data monitoring and tracking, using HP Service Manager data from your environment,
provide valuable insight to daily operations. Service Manager enables you to build graphic reports
dynamically from lists of records for a quick view of data and relationships.
With this feature You can
Set permission for a report
Configure reports globally or individually by setting permission for a report.
Create different types of reports
Create chart reports that total how many records have the same value in a group by field.
Create list reports that list each record according to the value in a field.
Create pivot table reports that list records in two-dimension view and you can view the content dynamically by dragging and dropping the columns.
Query Build or write different query conditions to draw the report. If a query is cached, multiple users can view the report results from cache.
Legends Identify the data source for each report element by using color-coded legends.
Customize the legend color by setting the color indicator.
View the data details
Click a component to open a record list of the data that generate the report.
Hover the mouse over a report component to view the data count for that component.
Create a reportYou can create a new report from the following access points:
l Create New Report button on the Add Content page
l Create New Report button on the search report page
l More option on the list detail page
l More option on the To Do queue
To create a report from SM Reports menu, follow these steps:
HP Service Manager (9.41) Page 11 of 77
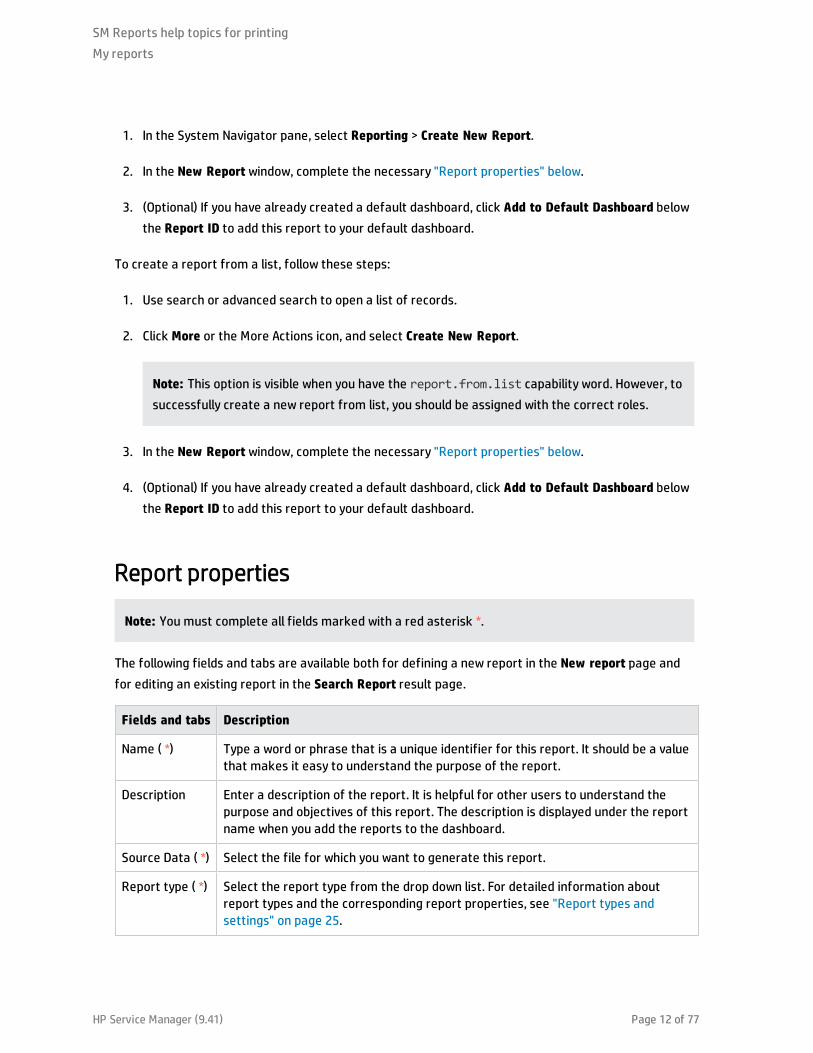
1. In the System Navigator pane, select Reporting > Create New Report.
2. In the New Report window, complete the necessary "Report properties" below.
3. (Optional) If you have already created a default dashboard, click Add to Default Dashboard below
the Report ID to add this report to your default dashboard.
To create a report from a list, follow these steps:
1. Use search or advanced search to open a list of records.
2. Click More or the More Actions icon, and select Create New Report.
Note: This option is visible when you have the report.from.list capability word. However, to
successfully create a new report from list, you should be assigned with the correct roles.
3. In the New Report window, complete the necessary "Report properties" below.
4. (Optional) If you have already created a default dashboard, click Add to Default Dashboard below
the Report ID to add this report to your default dashboard.
Report properties
Note: You must complete all fields marked with a red asterisk *.
The following fields and tabs are available both for defining a new report in the New report page and
for editing an existing report in the Search Report result page.
Fields and tabs Description
Name ( *) Type a word or phrase that is a unique identifier for this report. It should be a value that makes it easy to understand the purpose of the report.
Description Enter a description of the report. It is helpful for other users to understand the purpose and objectives of this report. The description is displayed under the report name when you add the reports to the dashboard.
Source Data ( *) Select the file for which you want to generate this report.
Report type ( *) Select the report type from the drop down list. For detailed information about report types and the corresponding report properties, see "Report types and settings" on page 25.
SM Reports help topics for printing
My reports
HP Service Manager (9.41) Page 12 of 77
Fields and tabs Description
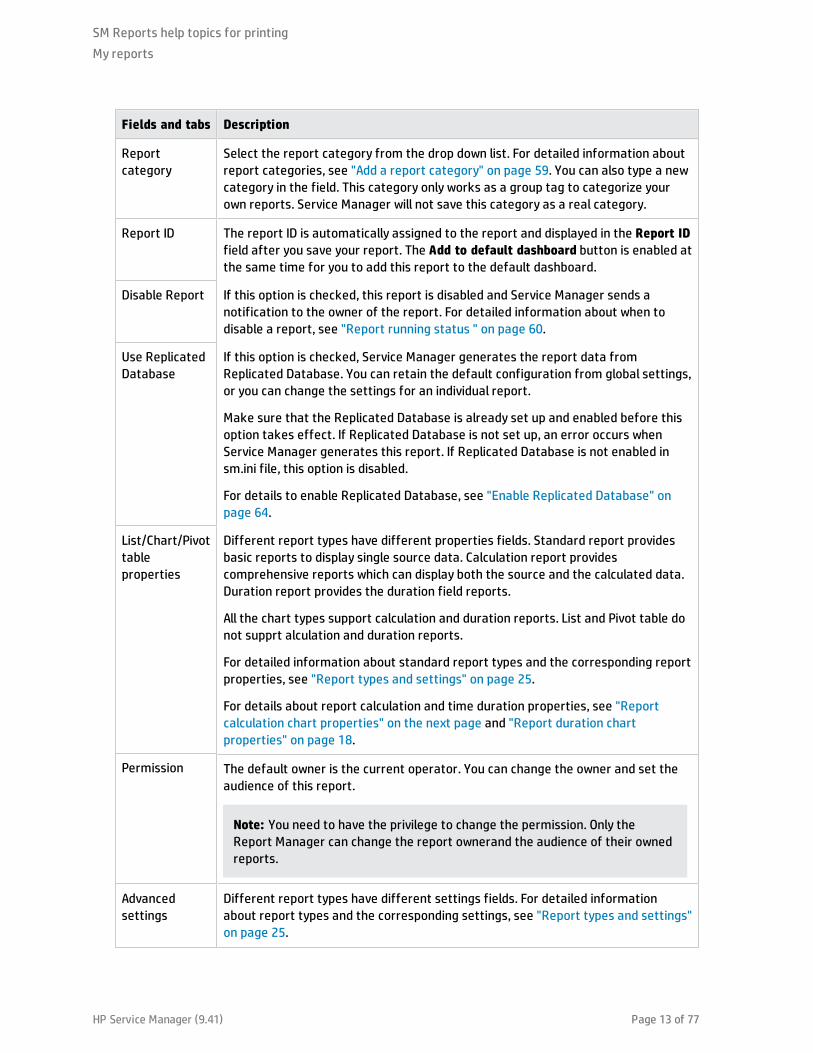
Report category
Select the report category from the drop down list. For detailed information about report categories, see "Add a report category" on page 59. You can also type a new category in the field. This category only works as a group tag to categorize your own reports. Service Manager will not save this category as a real category.
Report ID The report ID is automatically assigned to the report and displayed in the Report ID field after you save your report. The Add to default dashboard button is enabled at the same time for you to add this report to the default dashboard.
Disable Report If this option is checked, this report is disabled and Service Manager sends a notification to the owner of the report. For detailed information about when to disable a report, see "Report running status " on page 60.
Use Replicated Database
If this option is checked, Service Manager generates the report data from Replicated Database. You can retain the default configuration from global settings, or you can change the settings for an individual report.
Make sure that the Replicated Database is already set up and enabled before this option takes effect. If Replicated Database is not set up, an error occurs when Service Manager generates this report. If Replicated Database is not enabled in sm.ini file, this option is disabled.
For details to enable Replicated Database, see "Enable Replicated Database" on page 64.
List/Chart/Pivot table properties
Different report types have different properties fields. Standard report provides basic reports to display single source data. Calculation report provides comprehensive reports which can display both the source and the calculated data. Duration report provides the duration field reports.
All the chart types support calculation and duration reports. List and Pivot table do not supprt alculation and duration reports.
For detailed information about standard report types and the corresponding report properties, see "Report types and settings" on page 25.
For details about report calculation and time duration properties, see "Report calculation chart properties" on the next page and "Report duration chart properties" on page 18.
Permission The default owner is the current operator. You can change the owner and set the audience of this report.
Note: You need to have the privilege to change the permission. Only the Report Manager can change the report ownerand the audience of their owned reports.
Advanced settings
Different report types have different settings fields. For detailed information about report types and the corresponding settings, see "Report types and settings" on page 25.
SM Reports help topics for printing
My reports
HP Service Manager (9.41) Page 13 of 77
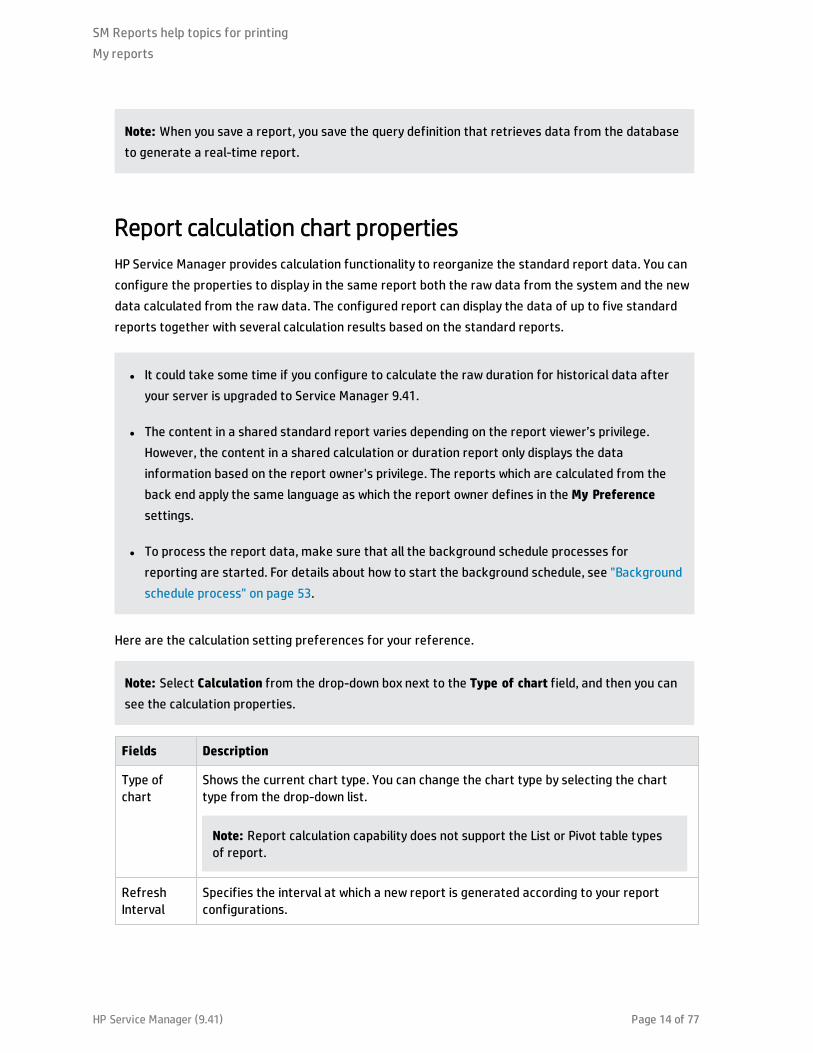
Note: When you save a report, you save the query definition that retrieves data from the database
to generate a real-time report.
Report calculation chart properties
HP Service Manager provides calculation functionality to reorganize the standard report data. You can
configure the properties to display in the same report both the raw data from the system and the new
data calculated from the raw data. The configured report can display the data of up to five standard
reports together with several calculation results based on the standard reports.
l It could take some time if you configure to calculate the raw duration for historical data after
your server is upgraded to Service Manager 9.41.
l The content in a shared standard report varies depending on the report viewer’s privilege.
However, the content in a shared calculation or duration report only displays the data
information based on the report owner's privilege. The reports which are calculated from the
back end apply the same language as which the report owner defines in the My Preference
settings.
l To process the report data, make sure that all the background schedule processes for
reporting are started. For details about how to start the background schedule, see "Background
schedule process" on page 53.
Here are the calculation setting preferences for your reference.
Note: Select Calculation from the drop-down box next to the Type of chart field, and then you can
see the calculation properties.
Fields Description
Type of chart
Shows the current chart type. You can change the chart type by selecting the chart type from the drop-down list.
Note: Report calculation capability does not support the List or Pivot table types of report.
Refresh Interval
Specifies the interval at which a new report is generated according to your report configurations.
SM Reports help topics for printing
My reports
HP Service Manager (9.41) Page 14 of 77
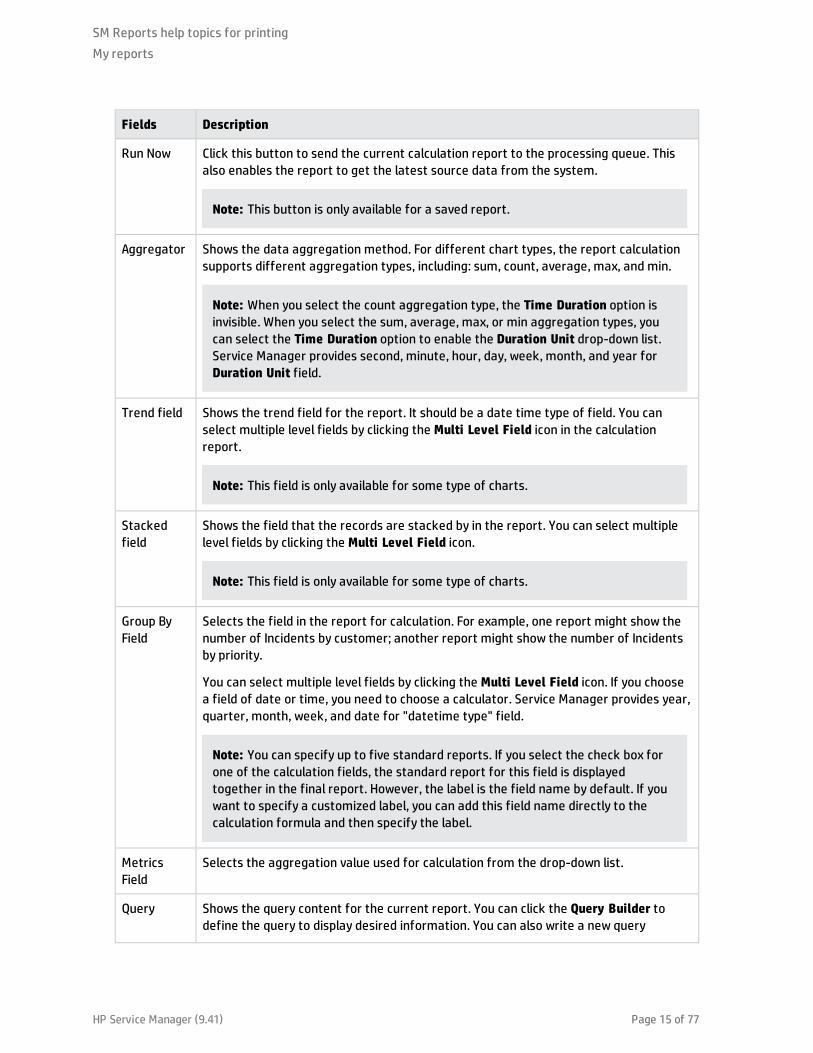
Fields Description
Run Now Click this button to send the current calculation report to the processing queue. This also enables the report to get the latest source data from the system.
Note: This button is only available for a saved report.
Aggregator Shows the data aggregation method. For different chart types, the report calculation supports different aggregation types, including: sum, count, average, max, and min.
Note: When you select the count aggregation type, the Time Duration option is invisible. When you select the sum, average, max, or min aggregation types, you can select the Time Duration option to enable the Duration Unit drop-down list. Service Manager provides second, minute, hour, day, week, month, and year for Duration Unit field.
Trend field Shows the trend field for the report. It should be a date time type of field. You can select multiple level fields by clicking the Multi Level Field icon in the calculation report.
Note: This field is only available for some type of charts.
Stacked field
Shows the field that the records are stacked by in the report. You can select multiple level fields by clicking the Multi Level Field icon.
Note: This field is only available for some type of charts.
Group By Field
Selects the field in the report for calculation. For example, one report might show the number of Incidents by customer; another report might show the number of Incidents by priority.
You can select multiple level fields by clicking the Multi Level Field icon. If you choose a field of date or time, you need to choose a calculator. Service Manager provides year, quarter, month, week, and date for "datetime type" field.
Note: You can specify up to five standard reports. If you select the check box for one of the calculation fields, the standard report for this field is displayed together in the final report. However, the label is the field name by default. If you want to specify a customized label, you can add this field name directly to the calculation formula and then specify the label.
Metrics Field
Selects the aggregation value used for calculation from the drop-down list.
Query Shows the query content for the current report. You can click the Query Builder to define the query to display desired information. You can also write a new query
SM Reports help topics for printing
My reports
HP Service Manager (9.41) Page 15 of 77
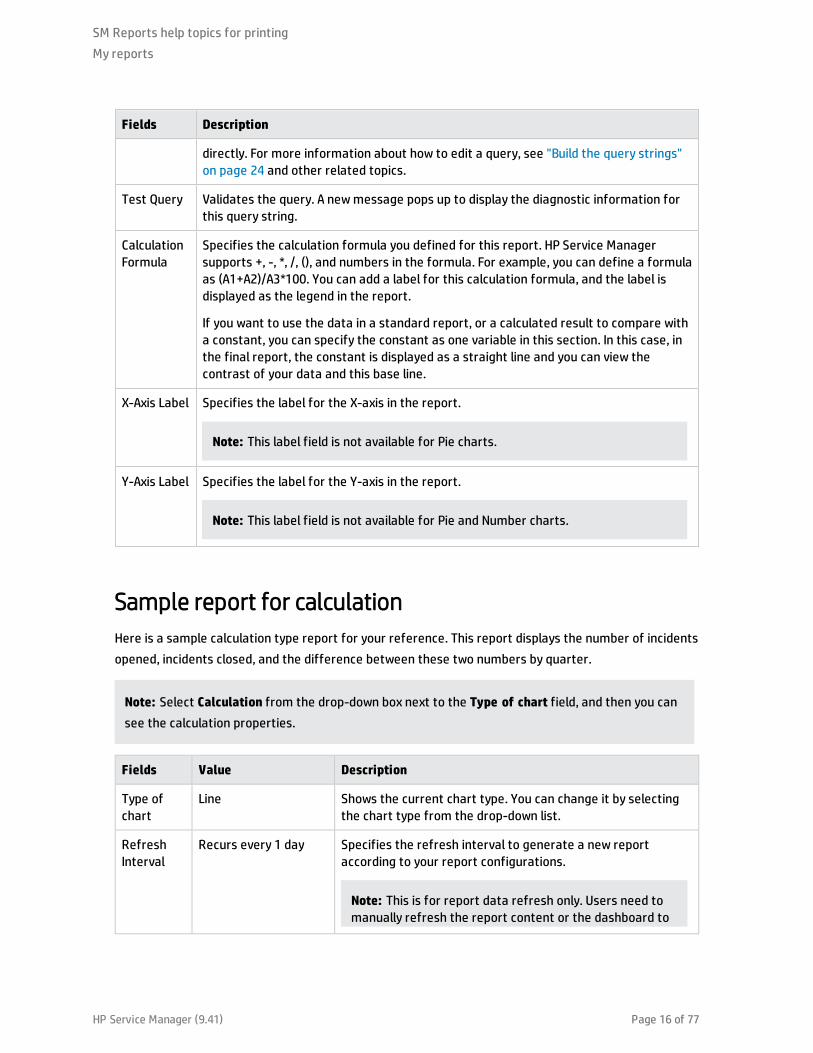
Fields Description
directly. For more information about how to edit a query, see "Build the query strings" on page 24 and other related topics.
Test Query Validates the query. A new message pops up to display the diagnostic information for this query string.
Calculation Formula
Specifies the calculation formula you defined for this report. HP Service Manager supports +, -, *, /, (), and numbers in the formula. For example, you can define a formula as (A1+A2)/A3*100. You can add a label for this calculation formula, and the label is displayed as the legend in the report.
If you want to use the data in a standard report, or a calculated result to compare with a constant, you can specify the constant as one variable in this section. In this case, in the final report, the constant is displayed as a straight line and you can view the contrast of your data and this base line.
X-Axis Label Specifies the label for the X-axis in the report.
Note: This label field is not available for Pie charts.
Y-Axis Label Specifies the label for the Y-axis in the report.
Note: This label field is not available for Pie and Number charts.
Sample report for calculation
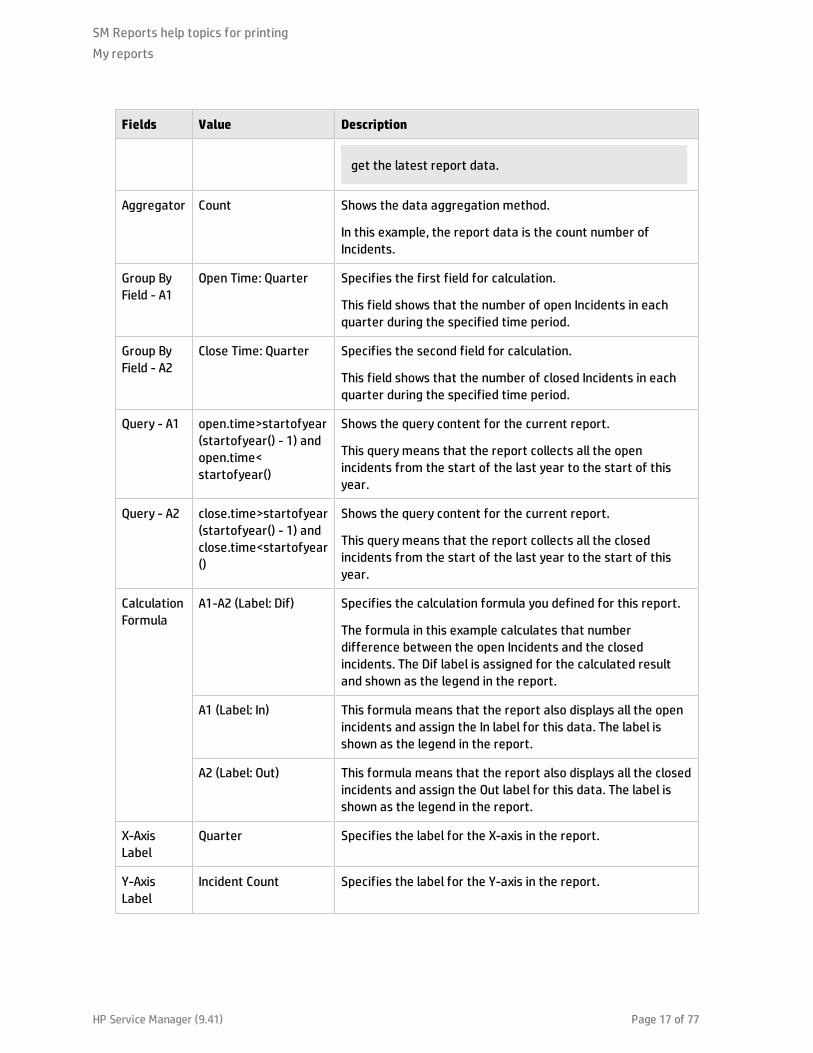
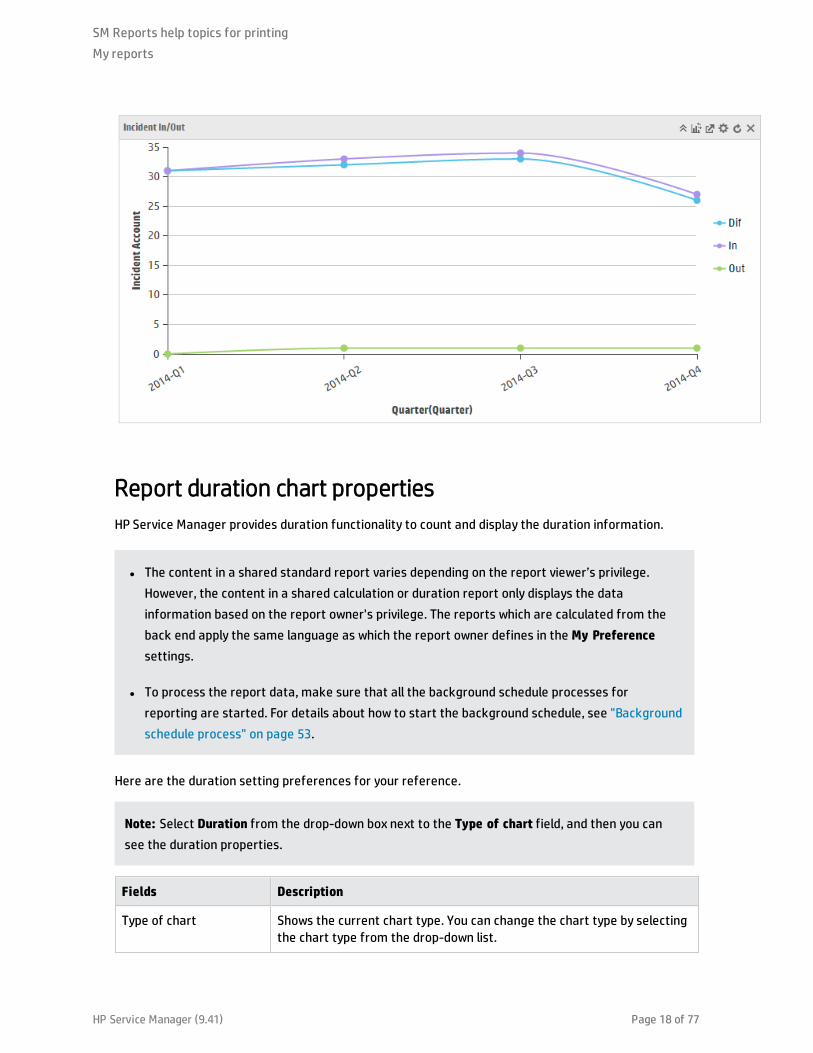
Here is a sample calculation type report for your reference. This report displays the number of incidents
opened, incidents closed, and the difference between these two numbers by quarter.
Note: Select Calculation from the drop-down box next to the Type of chart field, and then you can
see the calculation properties.
Fields Value Description
Type of chart
Line Shows the current chart type. You can change it by selecting the chart type from the drop-down list.
Refresh Interval
Recurs every 1 day Specifies the refresh interval to generate a new report according to your report configurations.
Note: This is for report data refresh only. Users need to manually refresh the report content or the dashboard to
SM Reports help topics for printing
My reports
HP Service Manager (9.41) Page 16 of 77
Fields Value Description
get the latest report data.
Aggregator Count Shows the data aggregation method.
In this example, the report data is the count number of Incidents.
Group By Field - A1
Open Time: Quarter Specifies the first field for calculation.
This field shows that the number of open Incidents in each quarter during the specified time period.
Group By Field - A2
Close Time: Quarter Specifies the second field for calculation.
This field shows that the number of closed Incidents in each quarter during the specified time period.
Query - A1 open.time>startofyear(startofyear() - 1) and open.time< startofyear()
Shows the query content for the current report.
This query means that the report collects all the open incidents from the start of the last year to the start of this year.
Query - A2 close.time>startofyear(startofyear() - 1) and close.time<startofyear()
Shows the query content for the current report.
This query means that the report collects all the closed incidents from the start of the last year to the start of this year.
Calculation Formula
A1-A2 (Label: Dif) Specifies the calculation formula you defined for this report.
The formula in this example calculates that number difference between the open Incidents and the closed incidents. The Dif label is assigned for the calculated result and shown as the legend in the report.
A1 (Label: In) This formula means that the report also displays all the open incidents and assign the In label for this data. The label is shown as the legend in the report.
A2 (Label: Out) This formula means that the report also displays all the closed incidents and assign the Out label for this data. The label is shown as the legend in the report.
X-Axis Label
Quarter Specifies the label for the X-axis in the report.
Y-Axis Label
Incident Count Specifies the label for the Y-axis in the report.
SM Reports help topics for printing
My reports
HP Service Manager (9.41) Page 17 of 77
Report duration chart properties
HP Service Manager provides duration functionality to count and display the duration information.
l The content in a shared standard report varies depending on the report viewer’s privilege.
However, the content in a shared calculation or duration report only displays the data
information based on the report owner's privilege. The reports which are calculated from the
back end apply the same language as which the report owner defines in the My Preference
settings.
l To process the report data, make sure that all the background schedule processes for
reporting are started. For details about how to start the background schedule, see "Background
schedule process" on page 53.
Here are the duration setting preferences for your reference.
Note: Select Duration from the drop-down box next to the Type of chart field, and then you can
see the duration properties.
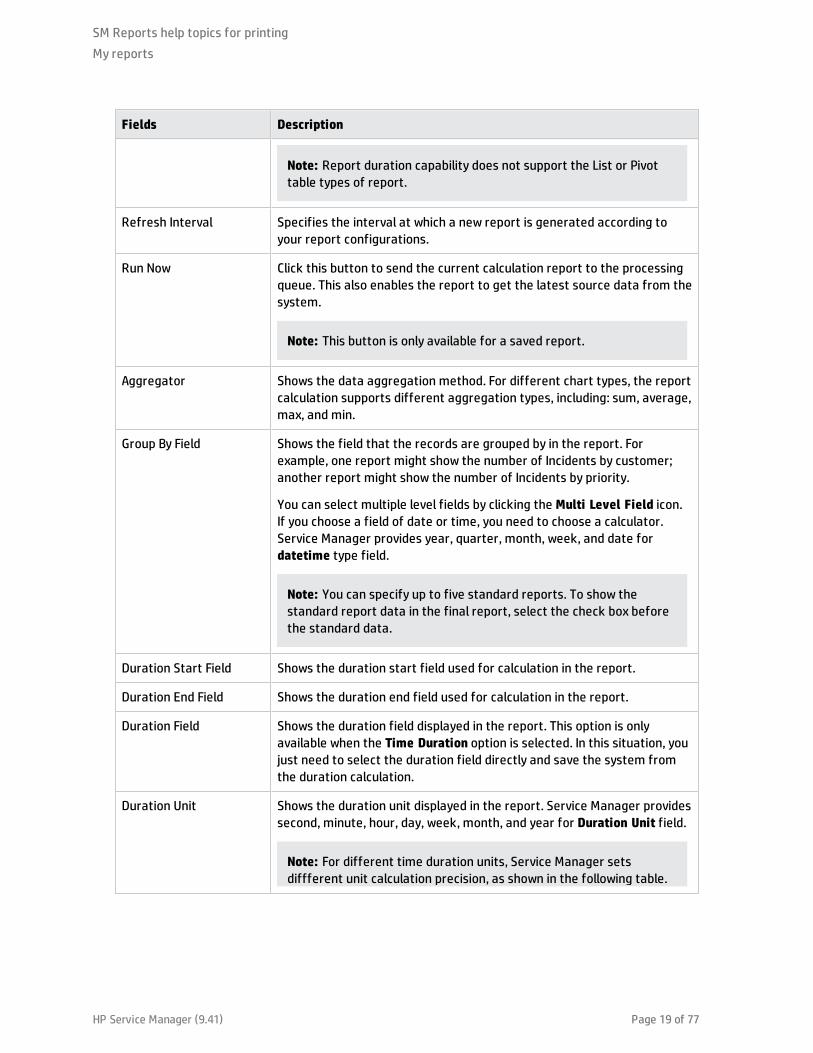
Fields Description
Type of chart Shows the current chart type. You can change the chart type by selecting the chart type from the drop-down list.
SM Reports help topics for printing
My reports
HP Service Manager (9.41) Page 18 of 77
Fields Description
Note: Report duration capability does not support the List or Pivot table types of report.
Refresh Interval Specifies the interval at which a new report is generated according to your report configurations.
Run Now Click this button to send the current calculation report to the processing queue. This also enables the report to get the latest source data from the system.
Note: This button is only available for a saved report.
Aggregator Shows the data aggregation method. For different chart types, the report calculation supports different aggregation types, including: sum, average, max, and min.
Group By Field Shows the field that the records are grouped by in the report. For example, one report might show the number of Incidents by customer; another report might show the number of Incidents by priority.
You can select multiple level fields by clicking the Multi Level Field icon. If you choose a field of date or time, you need to choose a calculator. Service Manager provides year, quarter, month, week, and date for datetime type field.
Note: You can specify up to five standard reports. To show the standard report data in the final report, select the check box before the standard data.
Duration Start Field Shows the duration start field used for calculation in the report.
Duration End Field Shows the duration end field used for calculation in the report.
Duration Field Shows the duration field displayed in the report. This option is only available when the Time Duration option is selected. In this situation, you just need to select the duration field directly and save the system from the duration calculation.
Duration Unit Shows the duration unit displayed in the report. Service Manager provides second, minute, hour, day, week, month, and year for Duration Unit field.
Note: For different time duration units, Service Manager sets diffferent unit calculation precision, as shown in the following table.
SM Reports help topics for printing
My reports
HP Service Manager (9.41) Page 19 of 77
Fields Description
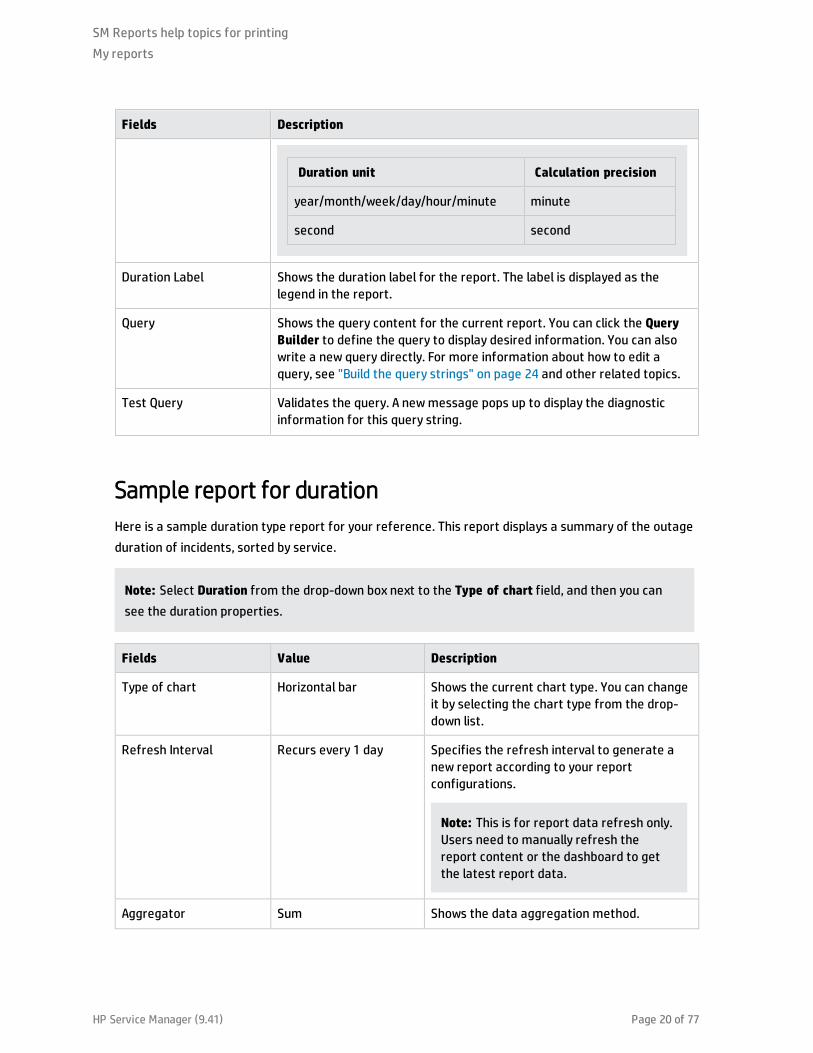
Duration unit Calculation precision
year/month/week/day/hour/minute minute
second second
Duration Label Shows the duration label for the report. The label is displayed as the legend in the report.
Query Shows the query content for the current report. You can click the Query Builder to define the query to display desired information. You can also write a new query directly. For more information about how to edit a query, see "Build the query strings" on page 24 and other related topics.
Test Query Validates the query. A new message pops up to display the diagnostic information for this query string.
Sample report for duration
Here is a sample duration type report for your reference. This report displays a summary of the outage
duration of incidents, sorted by service.
Note: Select Duration from the drop-down box next to the Type of chart field, and then you can
see the duration properties.
Fields Value Description
Type of chart Horizontal bar Shows the current chart type. You can change it by selecting the chart type from the drop-down list.
Refresh Interval Recurs every 1 day Specifies the refresh interval to generate a new report according to your report configurations.
Note: This is for report data refresh only. Users need to manually refresh the report content or the dashboard to get the latest report data.
Aggregator Sum Shows the data aggregation method.
SM Reports help topics for printing
My reports
HP Service Manager (9.41) Page 20 of 77
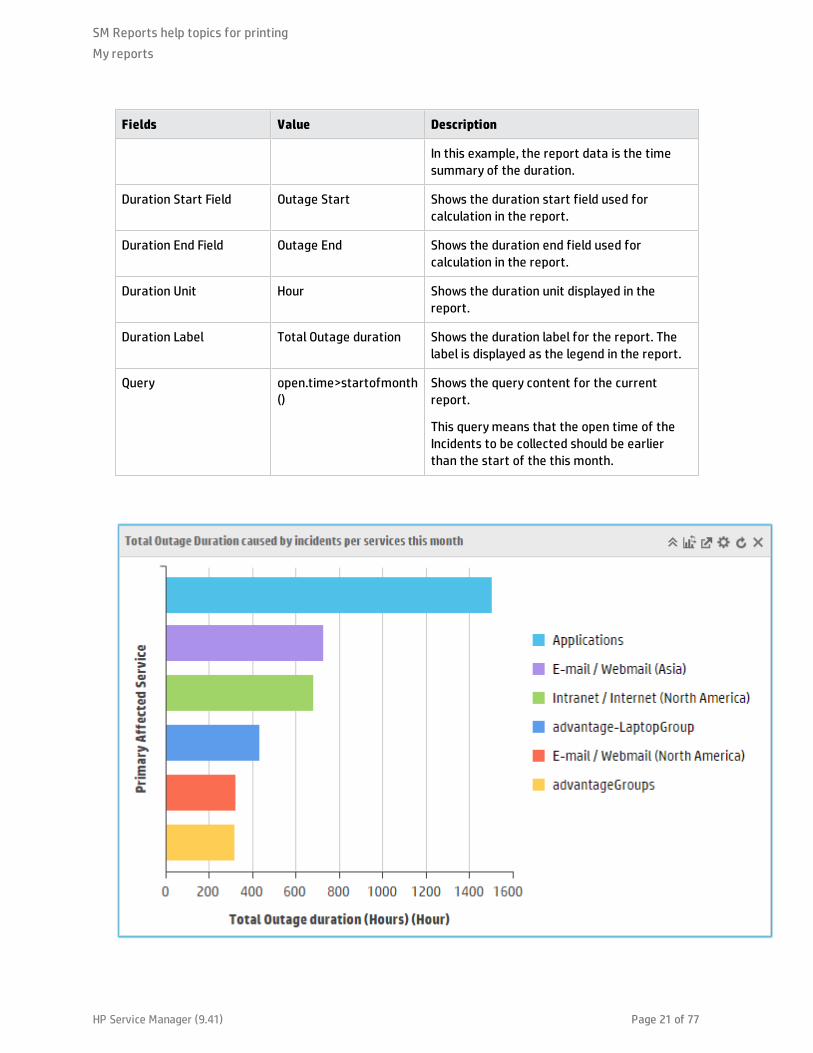
Fields Value Description
In this example, the report data is the time summary of the duration.
Duration Start Field Outage Start Shows the duration start field used for calculation in the report.
Duration End Field Outage End Shows the duration end field used for calculation in the report.
Duration Unit Hour Shows the duration unit displayed in the report.
Duration Label Total Outage duration Shows the duration label for the report. The label is displayed as the legend in the report.
Query open.time>startofmonth()
Shows the query content for the current report.
This query means that the open time of the Incidents to be collected should be earlier than the start of the this month.
SM Reports help topics for printing
My reports
HP Service Manager (9.41) Page 21 of 77
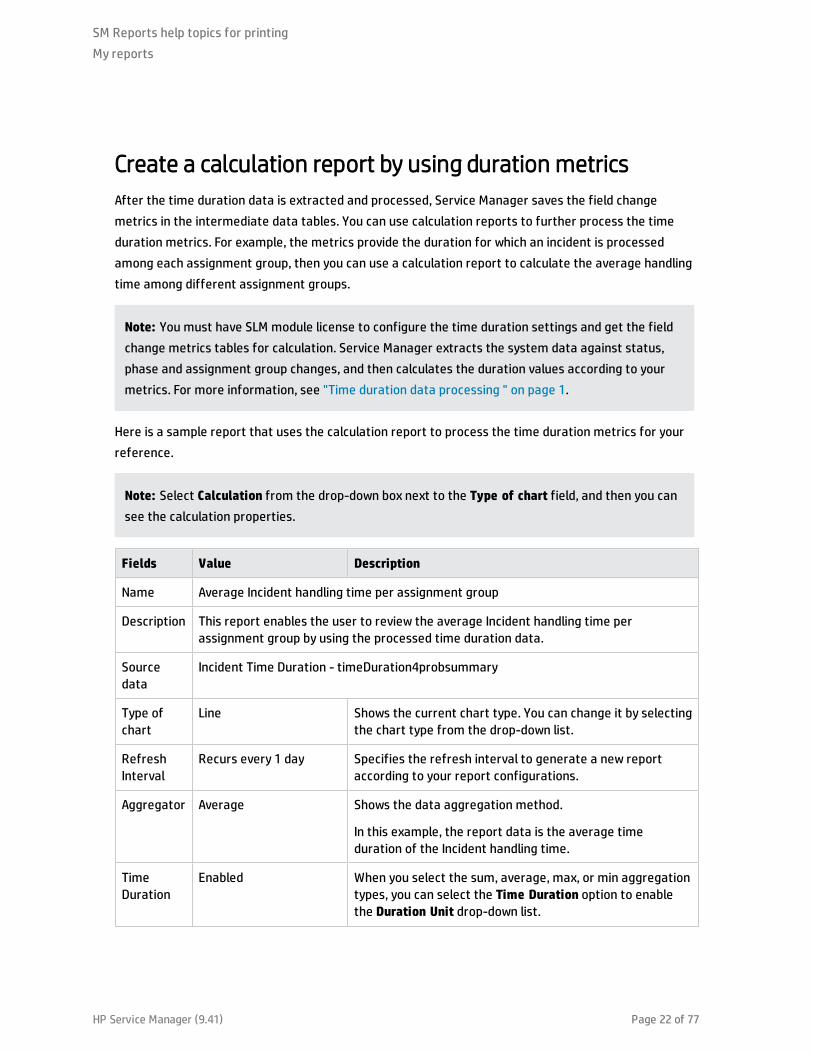
Create a calculation report by using duration metrics
After the time duration data is extracted and processed, Service Manager saves the field change
metrics in the intermediate data tables. You can use calculation reports to further process the time
duration metrics. For example, the metrics provide the duration for which an incident is processed
among each assignment group, then you can use a calculation report to calculate the average handling
time among different assignment groups.
Note: You must have SLM module license to configure the time duration settings and get the field
change metrics tables for calculation. Service Manager extracts the system data against status,
phase and assignment group changes, and then calculates the duration values according to your
metrics. For more information, see "Time duration data processing " on page 1.
Here is a sample report that uses the calculation report to process the time duration metrics for your
reference.
Note: Select Calculation from the drop-down box next to the Type of chart field, and then you can
see the calculation properties.
Fields Value Description
Name Average Incident handling time per assignment group
Description This report enables the user to review the average Incident handling time per assignment group by using the processed time duration data.
Source data
Incident Time Duration - timeDuration4probsummary
Type of chart
Line Shows the current chart type. You can change it by selecting the chart type from the drop-down list.
Refresh Interval
Recurs every 1 day Specifies the refresh interval to generate a new report according to your report configurations.
Aggregator Average Shows the data aggregation method.
In this example, the report data is the average time duration of the Incident handling time.
Time Duration
Enabled When you select the sum, average, max, or min aggregation types, you can select the Time Duration option to enable the Duration Unit drop-down list.
SM Reports help topics for printing
My reports
HP Service Manager (9.41) Page 22 of 77
Fields Value Description
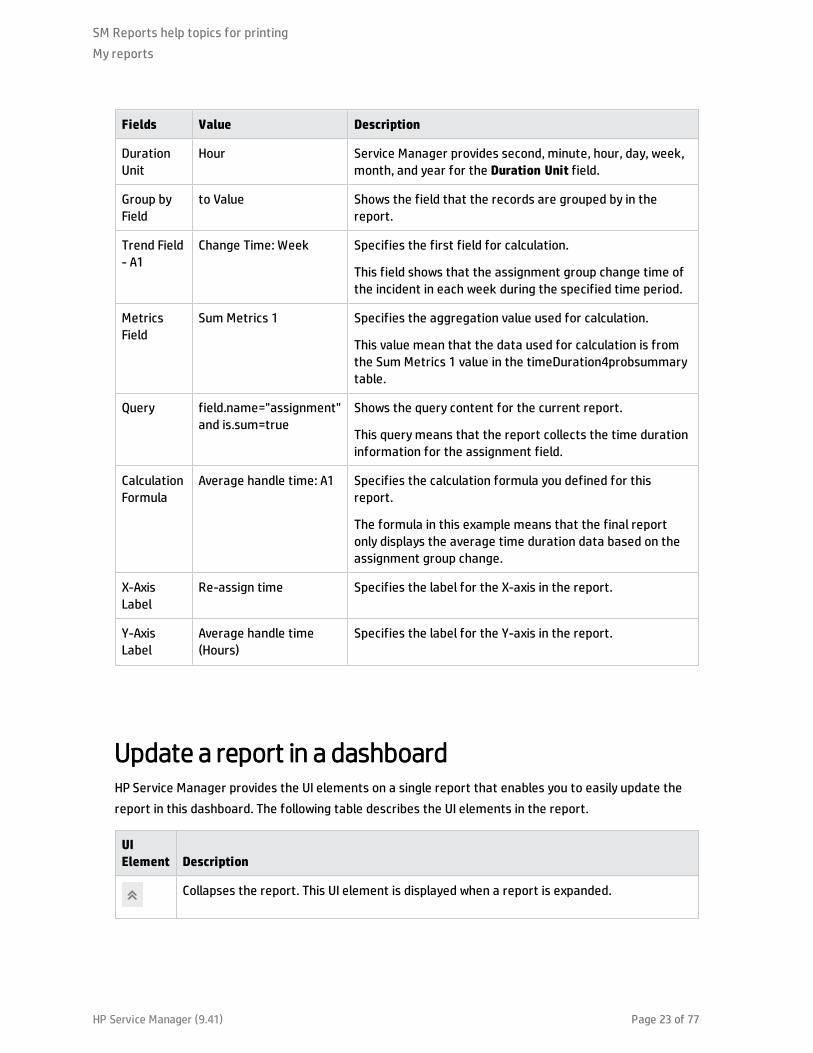
Duration Unit
Hour Service Manager provides second, minute, hour, day, week, month, and year for the Duration Unit field.
Group by Field
to Value Shows the field that the records are grouped by in the report.
Trend Field - A1
Change Time: Week Specifies the first field for calculation.
This field shows that the assignment group change time of the incident in each week during the specified time period.
Metrics Field
Sum Metrics 1 Specifies the aggregation value used for calculation.
This value mean that the data used for calculation is from the Sum Metrics 1 value in the timeDuration4probsummary table.
Query field.name="assignment" and is.sum=true
Shows the query content for the current report.
This query means that the report collects the time duration information for the assignment field.
Calculation Formula
Average handle time: A1 Specifies the calculation formula you defined for this report.
The formula in this example means that the final report only displays the average time duration data based on the assignment group change.
X-Axis Label
Re-assign time Specifies the label for the X-axis in the report.
Y-Axis Label
Average handle time (Hours)
Specifies the label for the Y-axis in the report.
Update a report in a dashboardHP Service Manager provides the UI elements on a single report that enables you to easily update the
report in this dashboard. The following table describes the UI elements in the report.
UI Element Description
Collapses the report. This UI element is displayed when a report is expanded.
SM Reports help topics for printing
My reports
HP Service Manager (9.41) Page 23 of 77
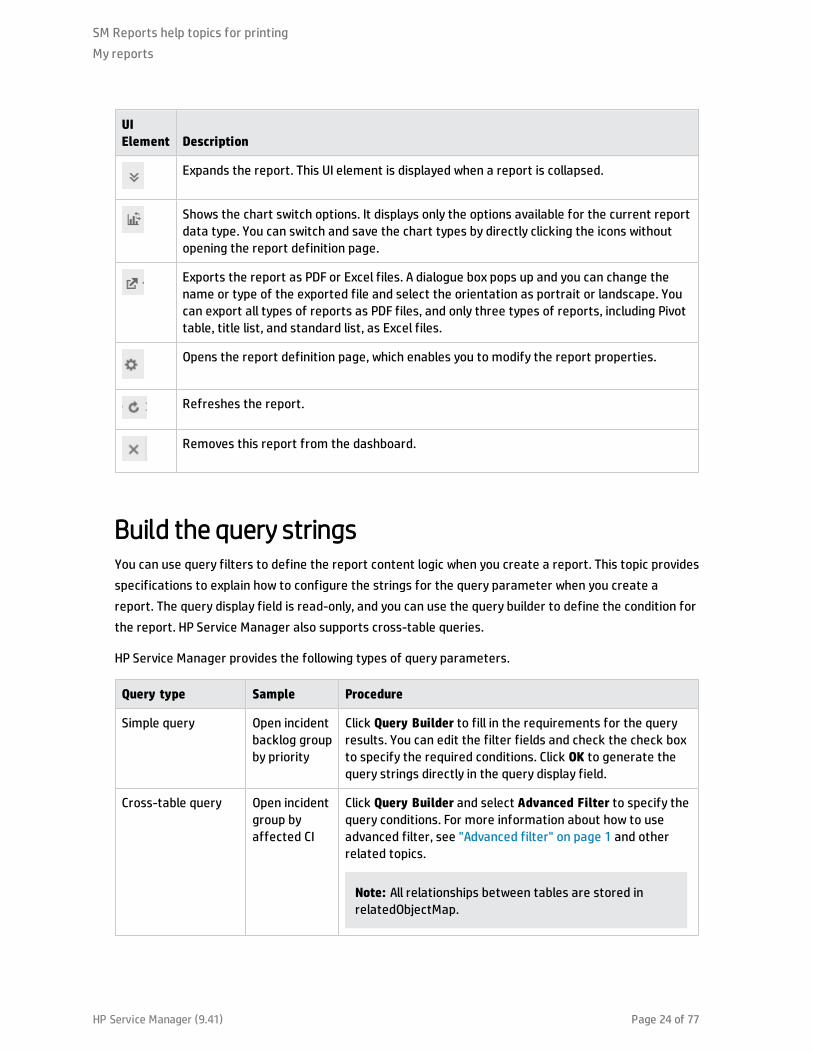
UI Element Description
Expands the report. This UI element is displayed when a report is collapsed.
Shows the chart switch options. It displays only the options available for the current report data type. You can switch and save the chart types by directly clicking the icons without opening the report definition page.
Exports the report as PDF or Excel files. A dialogue box pops up and you can change the name or type of the exported file and select the orientation as portrait or landscape. You can export all types of reports as PDF files, and only three types of reports, including Pivot table, title list, and standard list, as Excel files.
Opens the report definition page, which enables you to modify the report properties.
Refreshes the report.
Removes this report from the dashboard.
Build the query stringsYou can use query filters to define the report content logic when you create a report. This topic provides
specifications to explain how to configure the strings for the query parameter when you create a
report. The query display field is read-only, and you can use the query builder to define the condition for
the report. HP Service Manager also supports cross-table queries.
HP Service Manager provides the following types of query parameters.
Query type Sample Procedure
Simple query Open incident backlog group by priority
Click Query Builder to fill in the requirements for the query results. You can edit the filter fields and check the check box to specify the required conditions. Click OK to generate the query strings directly in the query display field.
Cross-table query Open incident group by affected CI
Click Query Builder and select Advanced Filter to specify the query conditions. For more information about how to use advanced filter, see "Advanced filter" on page 1 and other related topics.
Note: All relationships between tables are stored in relatedObjectMap.
SM Reports help topics for printing
My reports
HP Service Manager (9.41) Page 24 of 77
Query type Sample Procedure
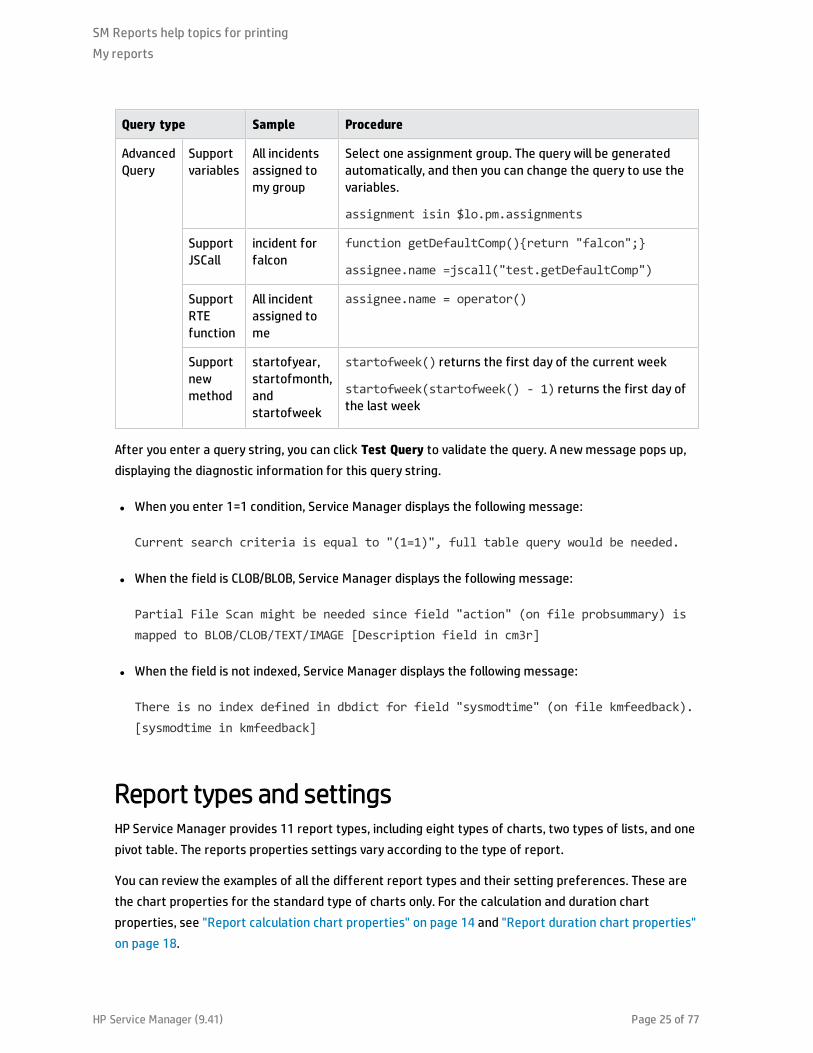
Advanced Query
Support variables
All incidents assigned to my group
Select one assignment group. The query will be generated automatically, and then you can change the query to use the variables.
assignment isin $lo.pm.assignments
Support JSCall
incident for falcon
function getDefaultComp(){return "falcon";}
assignee.name =jscall("test.getDefaultComp")
Support RTE function
All incident assigned to me
assignee.name = operator()
Support new method
startofyear, startofmonth, and startofweek
startofweek() returns the first day of the current week
startofweek(startofweek() - 1) returns the first day of the last week
After you enter a query string, you can click Test Query to validate the query. A new message pops up,
displaying the diagnostic information for this query string.
l When you enter 1=1 condition, Service Manager displays the following message:
Current search criteria is equal to "(1=1)", full table query would be needed.
l When the field is CLOB/BLOB, Service Manager displays the following message:
Partial File Scan might be needed since field "action" (on file probsummary) is mapped to BLOB/CLOB/TEXT/IMAGE [Description field in cm3r]
l When the field is not indexed, Service Manager displays the following message:
There is no index defined in dbdict for field "sysmodtime" (on file kmfeedback). [sysmodtime in kmfeedback]
Report types and settingsHP Service Manager provides 11 report types, including eight types of charts, two types of lists, and one
pivot table. The reports properties settings vary according to the type of report.
You can review the examples of all the different report types and their setting preferences. These are
the chart properties for the standard type of charts only. For the calculation and duration chart
properties, see "Report calculation chart properties" on page 14 and "Report duration chart properties"
on page 18.
SM Reports help topics for printing
My reports
HP Service Manager (9.41) Page 25 of 77

Chart types:
l "Chart > Pie" below
l "Chart > Horizontal bar" on page 28
l "Chart > Vertical bar" on page 30
l "Chart > Stacked Horizontal bar" on page 32
l "Chart > Stacked Vertical bar" on page 34
l "Chart > Number" on page 36
l "Chart > Line" on page 38
l "Chart > Area" on page 39
List types:
l "List > Standard list" on page 41
l "List > Title list" on page 41
"Pivot Table" on page 43
Chart > Pie
Here are the pie setting preferences and example for your reference.
Tab Fields Description
Chart Properties
Type of chart Shows the current chart type. You can change it by selecting the chart type from the drop-down list.
Chart by Shows the query type for the report. The default value is Aggregate query.
Group by field Shows the field that the records are grouped by in the report. For example, one report might show the number of Incidents by customer; another report might show the number of Incidents by priority.
You can select multiple level fields by clicking the Multi Level Field icon. If you choose a field of date or time, you need to choose a calculator.
SM Reports help topics for printing
My reports
HP Service Manager (9.41) Page 26 of 77
Tab Fields Description
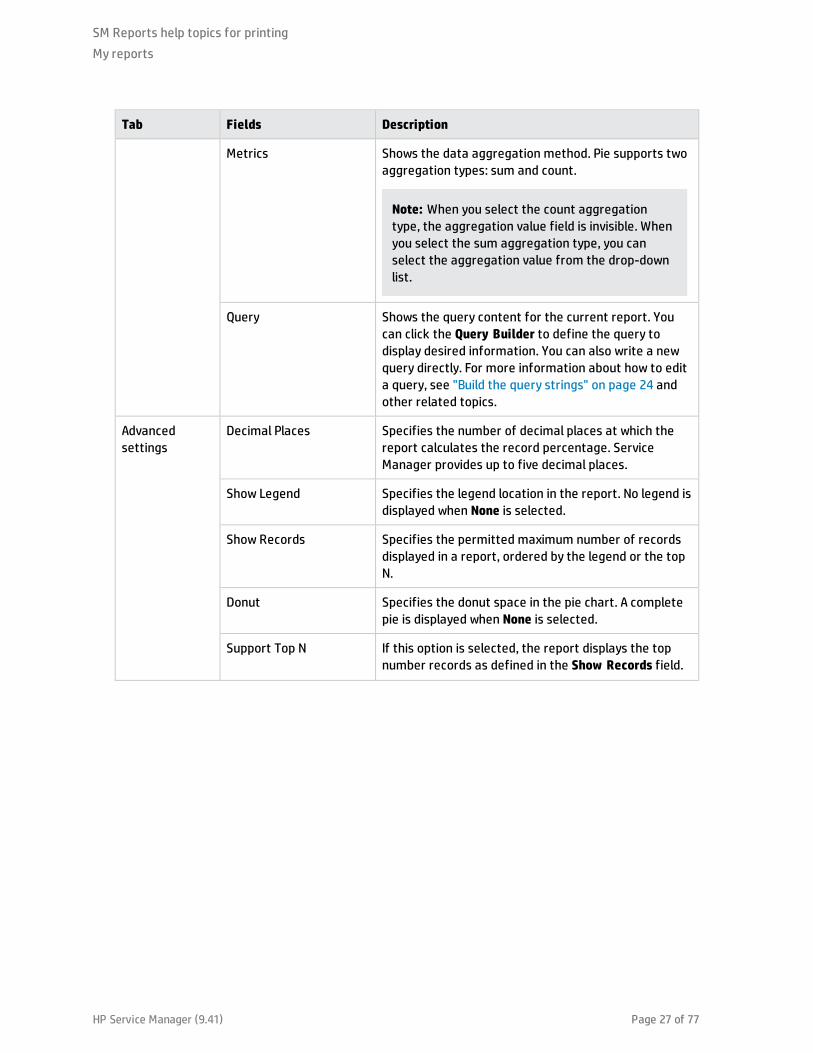
Metrics Shows the data aggregation method. Pie supports two aggregation types: sum and count.
Note: When you select the count aggregation type, the aggregation value field is invisible. When you select the sum aggregation type, you can select the aggregation value from the drop-down list.
Query Shows the query content for the current report. You can click the Query Builder to define the query to display desired information. You can also write a new query directly. For more information about how to edit a query, see "Build the query strings" on page 24 and other related topics.
Advanced settings
Decimal Places Specifies the number of decimal places at which the report calculates the record percentage. Service Manager provides up to five decimal places.
Show Legend Specifies the legend location in the report. No legend is displayed when None is selected.
Show Records Specifies the permitted maximum number of records displayed in a report, ordered by the legend or the top N.
Donut Specifies the donut space in the pie chart. A complete pie is displayed when None is selected.
Support Top N If this option is selected, the report displays the top number records as defined in the Show Records field.
SM Reports help topics for printing
My reports
HP Service Manager (9.41) Page 27 of 77
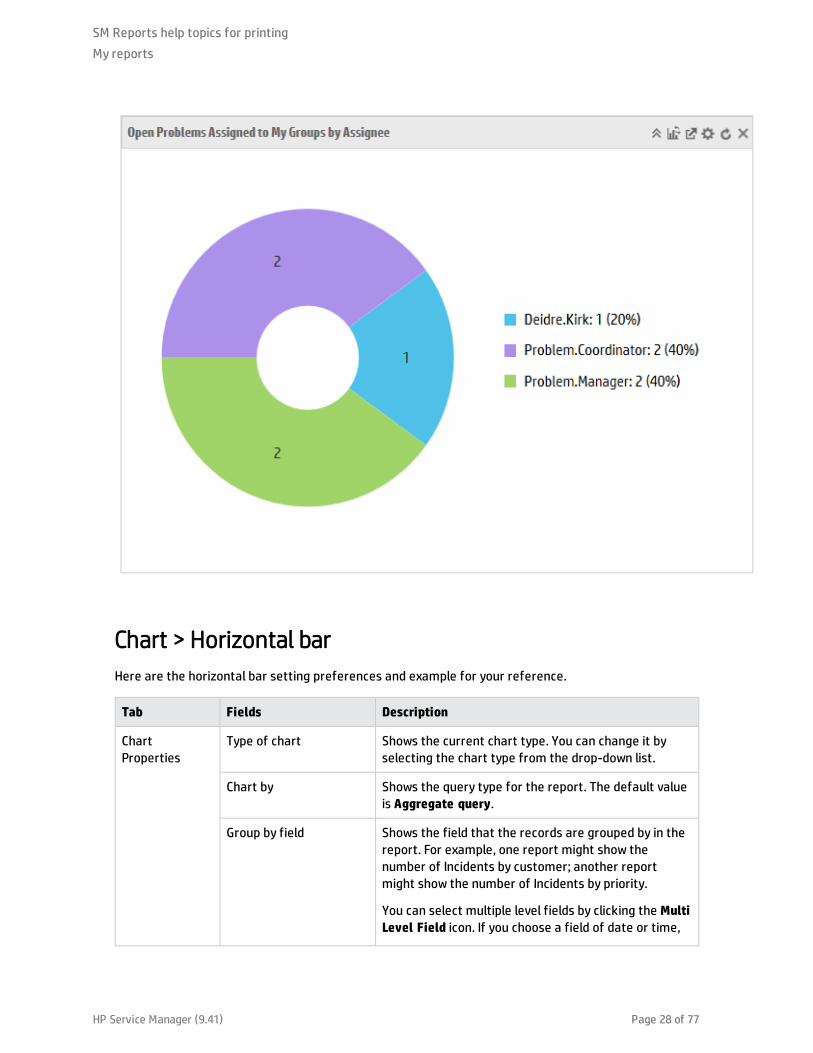
Chart > Horizontal bar
Here are the horizontal bar setting preferences and example for your reference.
Tab Fields Description
Chart Properties
Type of chart Shows the current chart type. You can change it by selecting the chart type from the drop-down list.
Chart by Shows the query type for the report. The default value is Aggregate query.
Group by field Shows the field that the records are grouped by in the report. For example, one report might show the number of Incidents by customer; another report might show the number of Incidents by priority.
You can select multiple level fields by clicking the Multi Level Field icon. If you choose a field of date or time,
SM Reports help topics for printing
My reports
HP Service Manager (9.41) Page 28 of 77
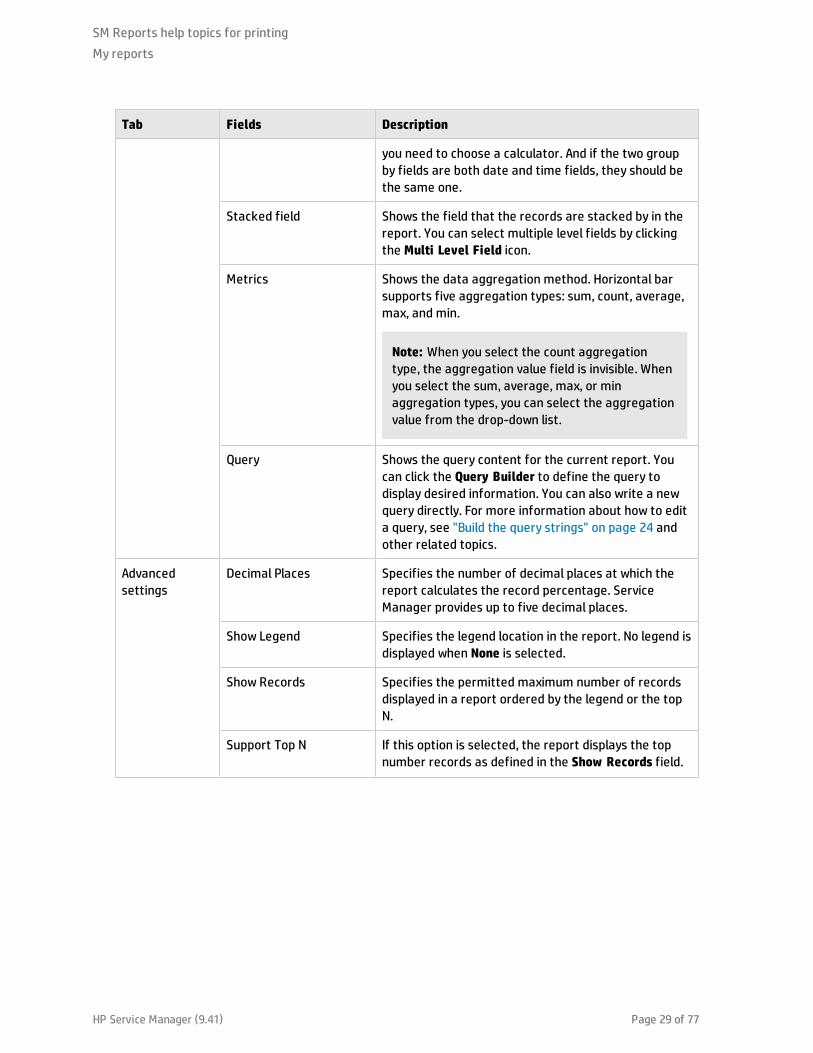
Tab Fields Description
you need to choose a calculator. And if the two group by fields are both date and time fields, they should be the same one.
Stacked field Shows the field that the records are stacked by in the report. You can select multiple level fields by clicking the Multi Level Field icon.
Metrics Shows the data aggregation method. Horizontal bar supports five aggregation types: sum, count, average, max, and min.
Note: When you select the count aggregation type, the aggregation value field is invisible. When you select the sum, average, max, or min aggregation types, you can select the aggregation value from the drop-down list.
Query Shows the query content for the current report. You can click the Query Builder to define the query to display desired information. You can also write a new query directly. For more information about how to edit a query, see "Build the query strings" on page 24 and other related topics.
Advanced settings
Decimal Places Specifies the number of decimal places at which the report calculates the record percentage. Service Manager provides up to five decimal places.
Show Legend Specifies the legend location in the report. No legend is displayed when None is selected.
Show Records Specifies the permitted maximum number of records displayed in a report ordered by the legend or the top N.
Support Top N If this option is selected, the report displays the top number records as defined in the Show Records field.
SM Reports help topics for printing
My reports
HP Service Manager (9.41) Page 29 of 77
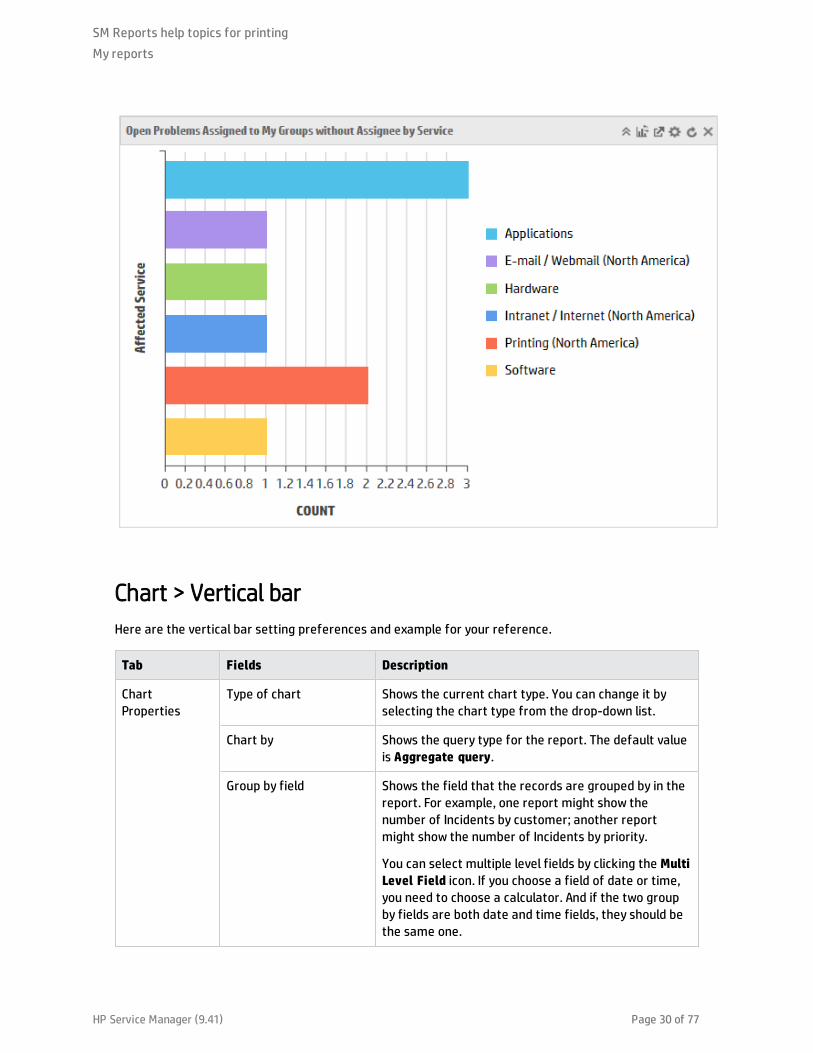
Chart > Vertical bar
Here are the vertical bar setting preferences and example for your reference.
Tab Fields Description
Chart Properties
Type of chart Shows the current chart type. You can change it by selecting the chart type from the drop-down list.
Chart by Shows the query type for the report. The default value is Aggregate query.
Group by field Shows the field that the records are grouped by in the report. For example, one report might show the number of Incidents by customer; another report might show the number of Incidents by priority.
You can select multiple level fields by clicking the Multi Level Field icon. If you choose a field of date or time, you need to choose a calculator. And if the two group by fields are both date and time fields, they should be the same one.
SM Reports help topics for printing
My reports
HP Service Manager (9.41) Page 30 of 77
Tab Fields Description
Stacked field Shows the field that the records are stacked by in the report. You can select multiple level fields by clicking the Multi Level Field icon.
Metrics Shows the data aggregation method. Vertical bar supports five aggregation types: sum, count, average, max, and min.
Note: When you select the count aggregation type, the aggregation value field is invisible. When you select the sum, average, max, or min aggregation types, you can select the aggregation value from the drop-down list.
Query Shows the query content for the current report. You can click the Query Builder to define the query to display desired information. You can also write a new query directly. For more information about how to edit a query, see "Build the query strings" on page 24 and other related topics.
Advanced settings
Decimal Places Specifies the number of decimal places at which the report calculates the record percentage. Service Manager provides up to five decimal places.
Show Legend Specifies the legend location in the report. No legend is displayed when None is selected.
Show Records Specifies the permitted maximum number of record displayed in a report ordered by the legend or the top N.
Support Top N If this option is selected, the report displays the top number records as defined in the Show Records field.
SM Reports help topics for printing
My reports
HP Service Manager (9.41) Page 31 of 77
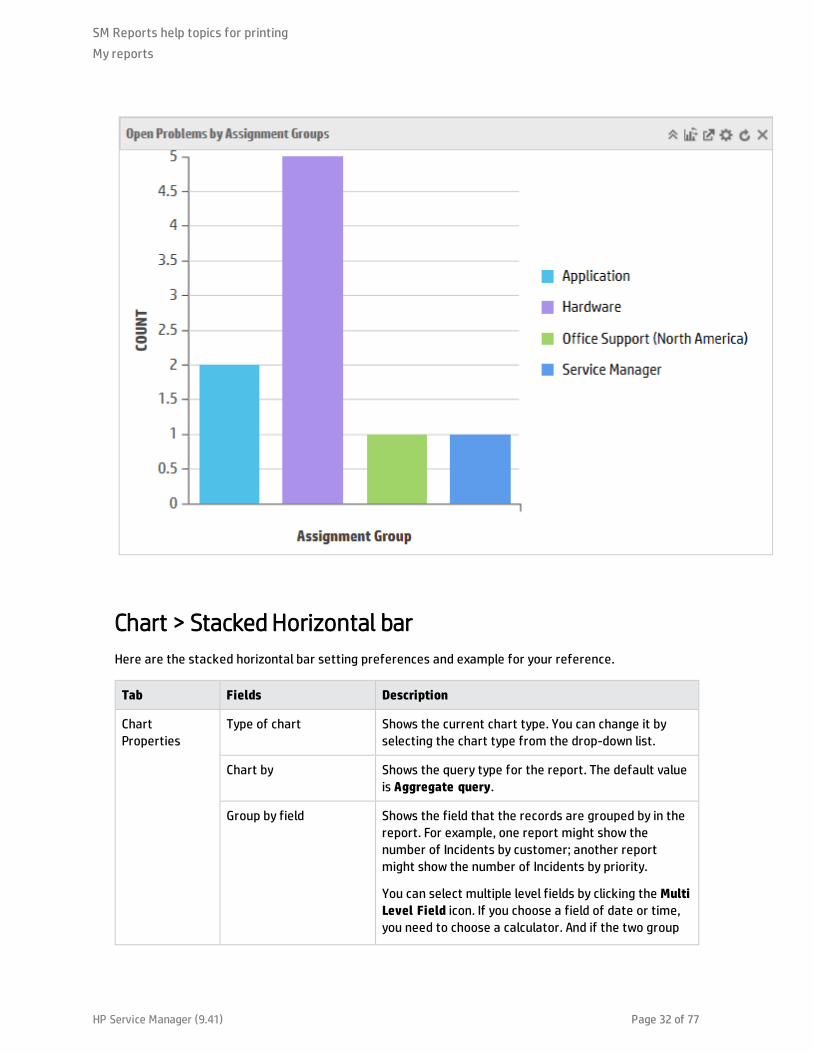
Chart > Stacked Horizontal bar
Here are the stacked horizontal bar setting preferences and example for your reference.
Tab Fields Description
Chart Properties
Type of chart Shows the current chart type. You can change it by selecting the chart type from the drop-down list.
Chart by Shows the query type for the report. The default value is Aggregate query.
Group by field Shows the field that the records are grouped by in the report. For example, one report might show the number of Incidents by customer; another report might show the number of Incidents by priority.
You can select multiple level fields by clicking the Multi Level Field icon. If you choose a field of date or time, you need to choose a calculator. And if the two group
SM Reports help topics for printing
My reports
HP Service Manager (9.41) Page 32 of 77
Tab Fields Description
by fields are both date and time fields, they should be the same one.
Stacked field Shows the field that the records are stacked by in the report. You can select multiple level fields by clicking the Multi Level Field icon.
Metrics Shows the data aggregation method. Stacked horizontal bar supports five aggregation types: sum, count, average, max, and min.
Note: When you select the count aggregation type, the aggregation value field is invisible. When you select the sum, average, max, or min aggregation types, you can select the aggregation value from the drop-down list.
Query Shows the query content for the current report. You can click the Query Builder to define the query to display desired information. You can also write a new query directly. For more information about how to edit a query, see "Build the query strings" on page 24 and other related topics.
Advanced settings
Decimal Places Specifies the number of decimal places at which the report is calculating the record percentage. Service Manager provides up to five decimal places.
Show Legend Specifies the legend location in the report. No legend is displayed when None is selected.
Show Records Specifies the permitted maximum number of record displayed in a report.
SM Reports help topics for printing
My reports
HP Service Manager (9.41) Page 33 of 77
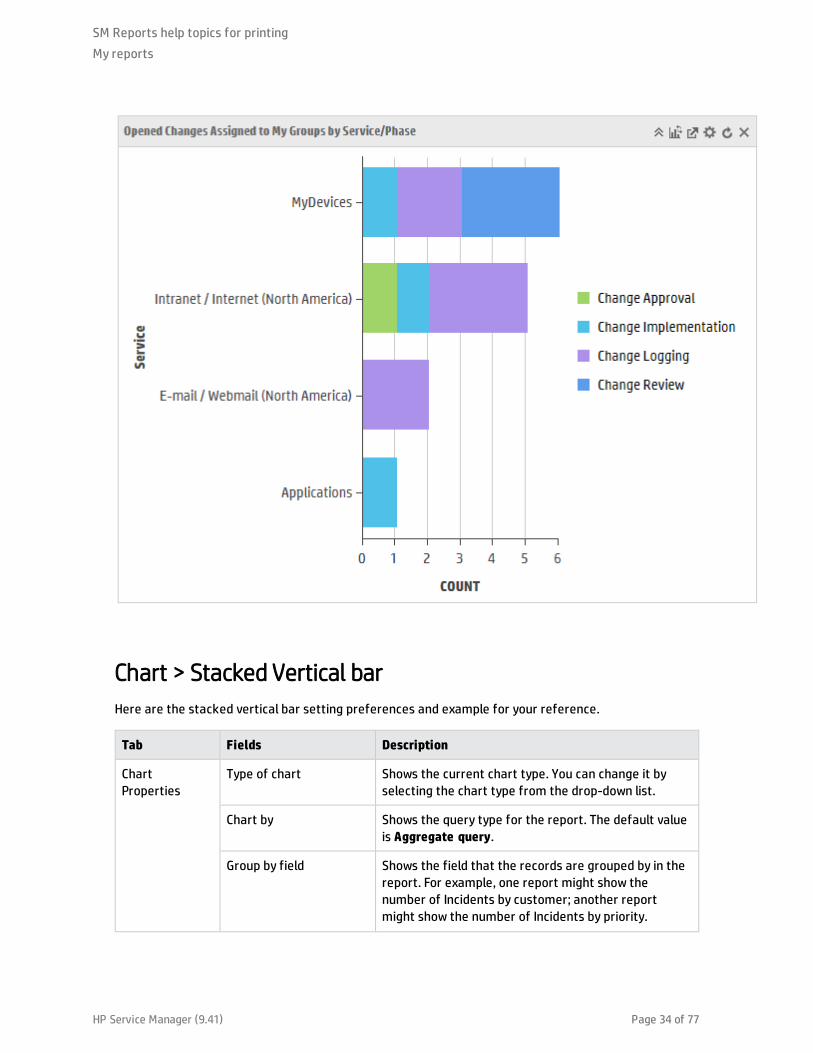
Chart > Stacked Vertical bar
Here are the stacked vertical bar setting preferences and example for your reference.
Tab Fields Description
Chart Properties
Type of chart Shows the current chart type. You can change it by selecting the chart type from the drop-down list.
Chart by Shows the query type for the report. The default value is Aggregate query.
Group by field Shows the field that the records are grouped by in the report. For example, one report might show the number of Incidents by customer; another report might show the number of Incidents by priority.
SM Reports help topics for printing
My reports
HP Service Manager (9.41) Page 34 of 77
Tab Fields Description
You can select multiple level fields by clicking the Multi Level Field icon. If you choose a field of date or time, you need to choose a calculator. And if the two group by fields are both date and time field, they should be the same one.
Stacked field Shows the field that the records are stacked by in the report. You can select multiple level fields by clicking the Multi Level Field icon.
Metrics Shows the data aggregation method. Stacked vertical bar supports five aggregation types: sum, count, average, max, and min.
Note: When you select the count aggregation type, the aggregation value field is invisible. When you select the sum, average, max, or min aggregation types, you can select the aggregation value from the drop-down list.
Query Shows the query content for the current report. You can click the Query Builder to define the query to display desired information. You can also write a new query directly. For more information about how to edit a query, see "Build the query strings" on page 24 and other related topics.
Advanced settings
Decimal Places Specifies the number of decimal places at which the report calculates the record percentage. Service Manager provides up to five decimal places.
Show Legend Specifies the legend location in the report. No legend is displayed when None is selected.
Show Records Specifies the permitted maximum number of records displayed in a report.
SM Reports help topics for printing
My reports
HP Service Manager (9.41) Page 35 of 77

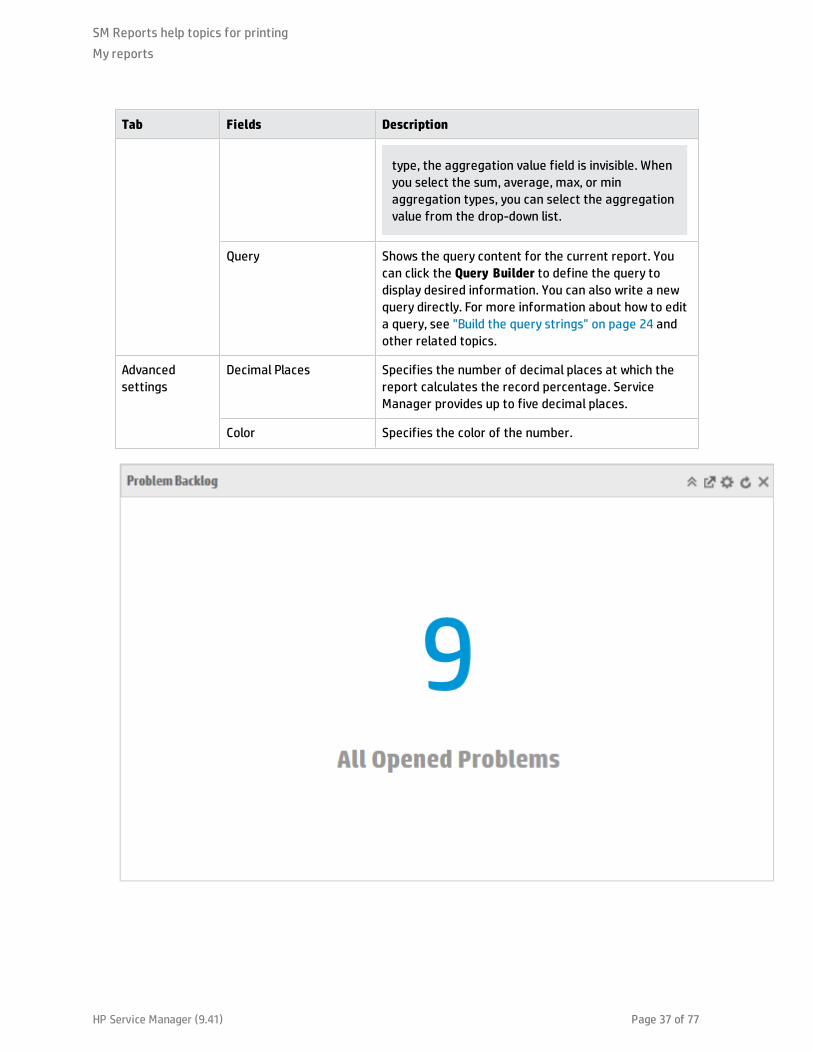
Chart > Number
Here are the number setting preferences and example for your reference.
Tab Fields Description
Chart Properties
Type of chart Shows the current chart type. You can change it by selecting the chart type from the drop-down list.
Chart by Shows the query type for the report. The default value is Aggregate query.
Label Specifies the label content to show under the number.
Metrics Shows the data aggregation method. Number supports five aggregation types: sum, count, average, max, and min.
Note: When you select the count aggregation
SM Reports help topics for printing
My reports
HP Service Manager (9.41) Page 36 of 77
Tab Fields Description
type, the aggregation value field is invisible. When you select the sum, average, max, or min aggregation types, you can select the aggregation value from the drop-down list.
Query Shows the query content for the current report. You can click the Query Builder to define the query to display desired information. You can also write a new query directly. For more information about how to edit a query, see "Build the query strings" on page 24 and other related topics.
Advanced settings
Decimal Places Specifies the number of decimal places at which the report calculates the record percentage. Service Manager provides up to five decimal places.
Color Specifies the color of the number.
SM Reports help topics for printing
My reports
HP Service Manager (9.41) Page 37 of 77
Chart > Line
Here are the line setting preferences and example for your reference.
Tab Fields Description
Chart Properties
Type of chart Shows the current chart type. You can change it by selecting the chart type from the drop-down list.
Chart by Shows the query type for the report. The default value is Aggregate query.
Trend field Shows the trend field for the report. It should be a date time type of field.
Group by field Shows the field that the records are grouped by in the report. For example, one report might show the number of Incidents by customer; another report might show the number of Incidents by priority. You can select multiple level fields by clicking the Multi Level Field icon.
Metrics Shows the data aggregation method. Line supports five aggregation types: sum, count, average, max, and min.
Note: When you select the count aggregation type, the aggregation value field is invisible. When you select the sum, average, max, or min aggregation types, you can select the aggregation value from the drop-down list.
Query Shows the query content for the current report. You can click the Query Builder to define the query to display desired information. You can also write a new query directly. For more information about how to edit a query, see "Build the query strings" on page 24 and other related topics.
Advanced settings
Decimal Places Specifies the number of decimal places at which the report calculates the record percentage. Service Manager provides up to five decimal places.
Show Records Specifies the permitted maximum number of records displayed in a report.
SM Reports help topics for printing
My reports
HP Service Manager (9.41) Page 38 of 77
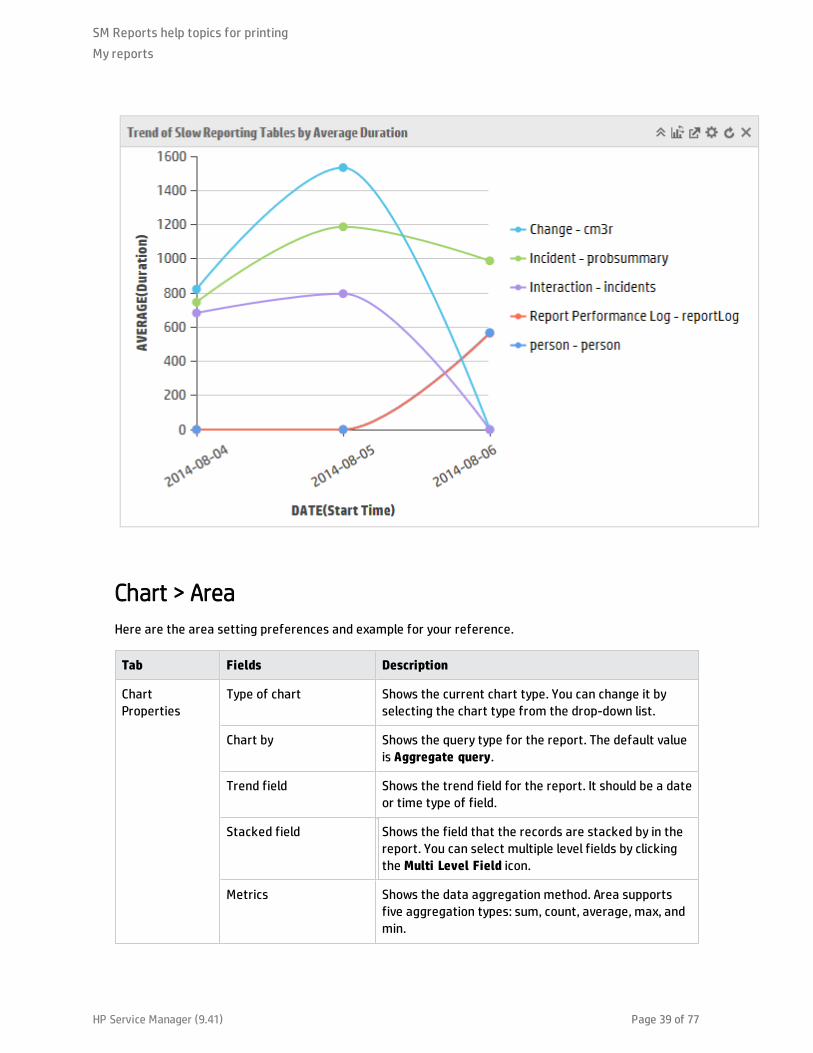
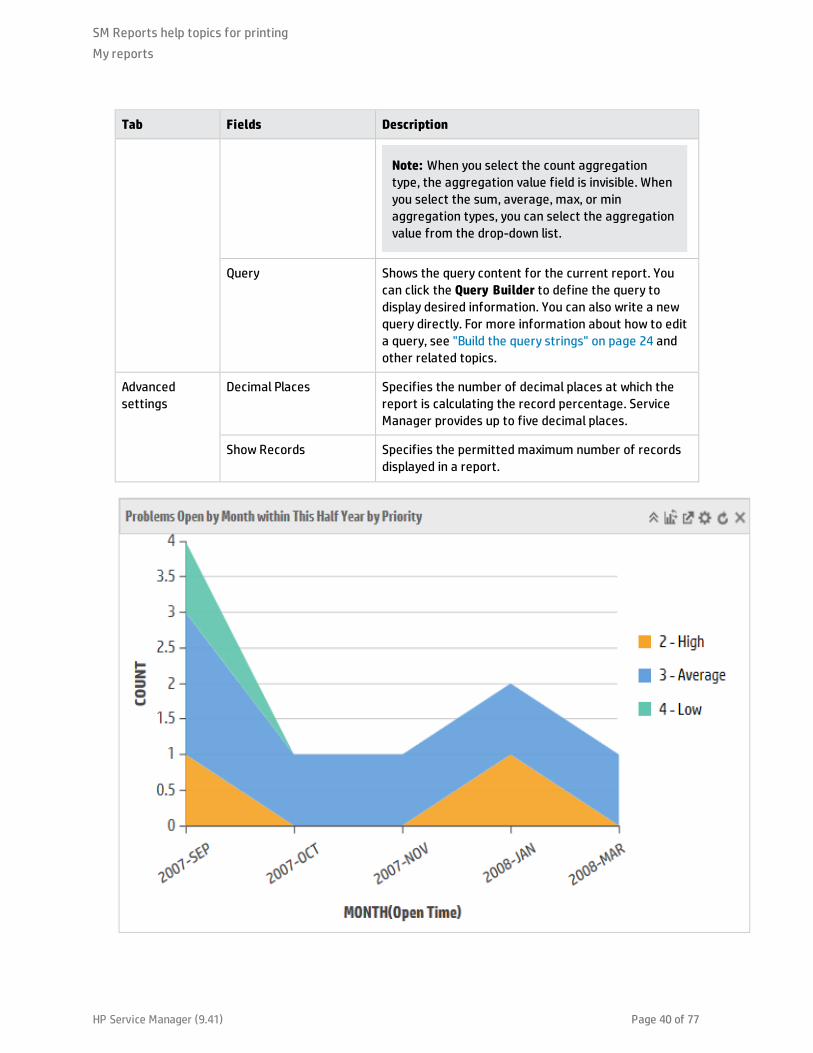
Chart > Area
Here are the area setting preferences and example for your reference.
Tab Fields Description
Chart Properties
Type of chart Shows the current chart type. You can change it by selecting the chart type from the drop-down list.
Chart by Shows the query type for the report. The default value is Aggregate query.
Trend field Shows the trend field for the report. It should be a date or time type of field.
Stacked field Shows the field that the records are stacked by in the report. You can select multiple level fields by clicking the Multi Level Field icon.
Metrics Shows the data aggregation method. Area supports five aggregation types: sum, count, average, max, and min.
SM Reports help topics for printing
My reports
HP Service Manager (9.41) Page 39 of 77
Tab Fields Description
Note: When you select the count aggregation type, the aggregation value field is invisible. When you select the sum, average, max, or min aggregation types, you can select the aggregation value from the drop-down list.
Query Shows the query content for the current report. You can click the Query Builder to define the query to display desired information. You can also write a new query directly. For more information about how to edit a query, see "Build the query strings" on page 24 and other related topics.
Advanced settings
Decimal Places Specifies the number of decimal places at which the report is calculating the record percentage. Service Manager provides up to five decimal places.
Show Records Specifies the permitted maximum number of records displayed in a report.
SM Reports help topics for printing
My reports
HP Service Manager (9.41) Page 40 of 77
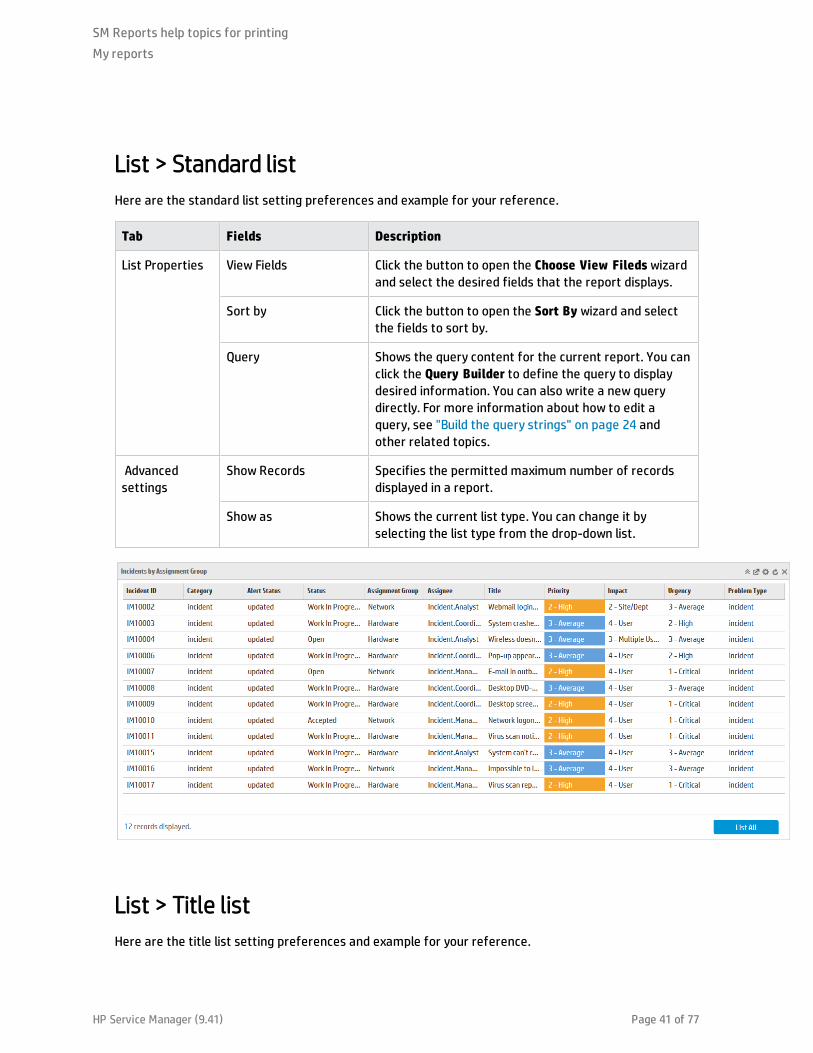
List > Standard list
Here are the standard list setting preferences and example for your reference.
Tab Fields Description
List Properties View Fields Click the button to open the Choose View Fileds wizard and select the desired fields that the report displays.
Sort by Click the button to open the Sort By wizard and select the fields to sort by.
Query Shows the query content for the current report. You can click the Query Builder to define the query to display desired information. You can also write a new query directly. For more information about how to edit a query, see "Build the query strings" on page 24 and other related topics.
Advanced settings
Show Records Specifies the permitted maximum number of records displayed in a report.
Show as Shows the current list type. You can change it by selecting the list type from the drop-down list.
List > Title list
Here are the title list setting preferences and example for your reference.
SM Reports help topics for printing
My reports
HP Service Manager (9.41) Page 41 of 77
Tab Fields Description
List Properties View Fields Click the button to open the Choose View Fileds wizard and select the desired fields that the report displays.
Sort by Click the button to open the Sort By wizard and select the fields to sort by.
Query Shows the query content for the current report. You can click the Query Builder to define the query to display desired information. You can also write a new query directly. For more information about how to edit a query, see "Build the query strings" on page 24 and other related topics.
Advanced settings
Show Records Specifies the permitted maximum number of records displayed in a report.
Show as Shows the current list type. You can change it by selecting the list type from the drop-down list.
Header Field Selects the header information of each title list item.
Flag Field Selects the flag information of each title list item on the right of the report. This field can be controlled by color indicator.
Summary Field Selects the summary information of each title list item under the header field.
Footer Field Selects the footer information of each title list item under the summary field.
SM Reports help topics for printing
My reports
HP Service Manager (9.41) Page 42 of 77
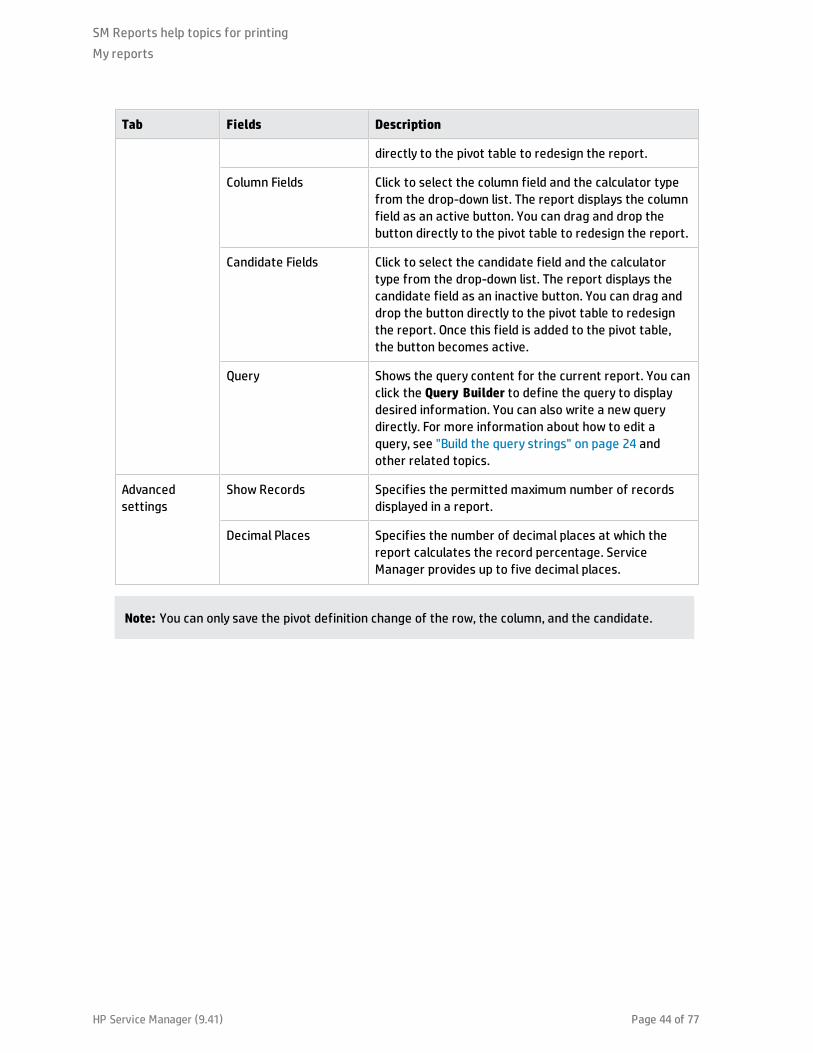
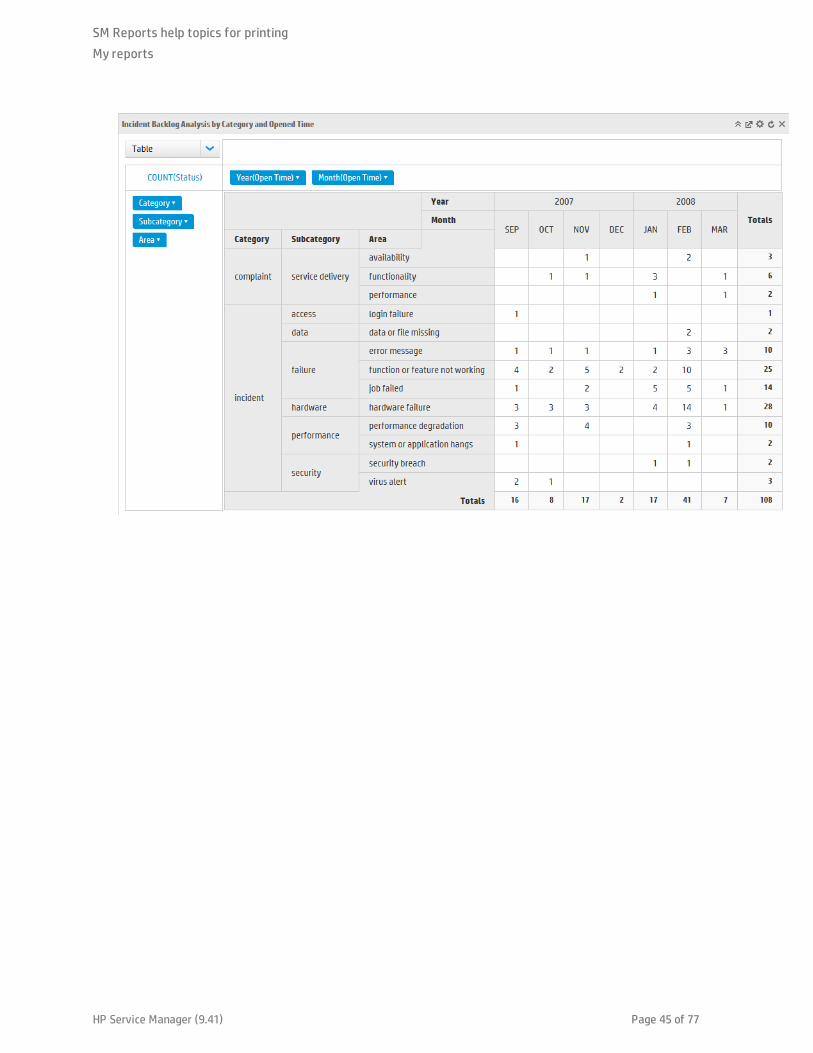
Pivot Table
Here are the pivot table setting preferences and example for your reference. HP Service Manager
supports five pivot display types: Table, Table BarChart, HeatMap, Row HeatMap, and Col HeatMap. You
can click the row, the column, or the candidate field to filter the data in the pivot.
Tab Fields Description
Pivot Table Properties
Aggregator Shows the data aggregation method. The pivot table supports five aggregation types: sum, count, average, max, and min.
Note: When you select the count aggregation type, the aggregation value field is invisible. When you select the sum, average, max, or min aggregation types, you can select the aggregation value from the drop-down list.
Row Fields Click to select the row field and the calculator type from the drop-down list. The report displays the row field as an active button. You can drag and drop the button
SM Reports help topics for printing
My reports
HP Service Manager (9.41) Page 43 of 77
Tab Fields Description
directly to the pivot table to redesign the report.
Column Fields Click to select the column field and the calculator type from the drop-down list. The report displays the column field as an active button. You can drag and drop the button directly to the pivot table to redesign the report.
Candidate Fields Click to select the candidate field and the calculator type from the drop-down list. The report displays the candidate field as an inactive button. You can drag and drop the button directly to the pivot table to redesign the report. Once this field is added to the pivot table, the button becomes active.
Query Shows the query content for the current report. You can click the Query Builder to define the query to display desired information. You can also write a new query directly. For more information about how to edit a query, see "Build the query strings" on page 24 and other related topics.
Advanced settings
Show Records Specifies the permitted maximum number of records displayed in a report.
Decimal Places Specifies the number of decimal places at which the report calculates the record percentage. Service Manager provides up to five decimal places.
Note: You can only save the pivot definition change of the row, the column, and the candidate.
SM Reports help topics for printing
My reports
HP Service Manager (9.41) Page 44 of 77
SM Reports help topics for printing
My reports
HP Service Manager (9.41) Page 45 of 77
My dashboardsHP Service Manager displays all reports as objects in the Dashboard view. You can group reports to
create a dashboard that offers a quick view of an entire system’s performance data.
Dashboards provide dynamic reports in the web client which enable you to perform the following
actions:
l Re-size, relocate, or remove the report
l Hover the mouse pointer to view data counts
Pause the mouse pointer on the area of interest in a chart. For example, you can pause the mouse
pointer on a pie chart to display a popup window that indicates the number of records that a slice of
the pie represents.
l Refresh the dashboard to get updated reports based on database changes
l Drill down to a subset of the records, in order to display those records in greater detail
Create a dashboardA dashboard enables you to view multiple reports about data in your system.
To create a dashboard, follow these steps:
1. In the System Navigator pane, select Reporting > Create New Dashboard.
The New Dashboard button is also available on the Search Dashboard page and any dashboard
view pages.
2. In the New Dashboard window, complete the necessary "Dashboard properties" on the next page.
3. Click Save. A unique dashboard ID is automatically assigned to this dashboard and displayed in the
Dashboard ID field.
4. (Optional) Click Dashboard Content below the dashboard ID to open the dashboard and manage the
dashboard contents. For more information about how to add reports to a dashboard, see "Add
reports to a dashboard" on the next page
HP Service Manager (9.41) Page 46 of 77
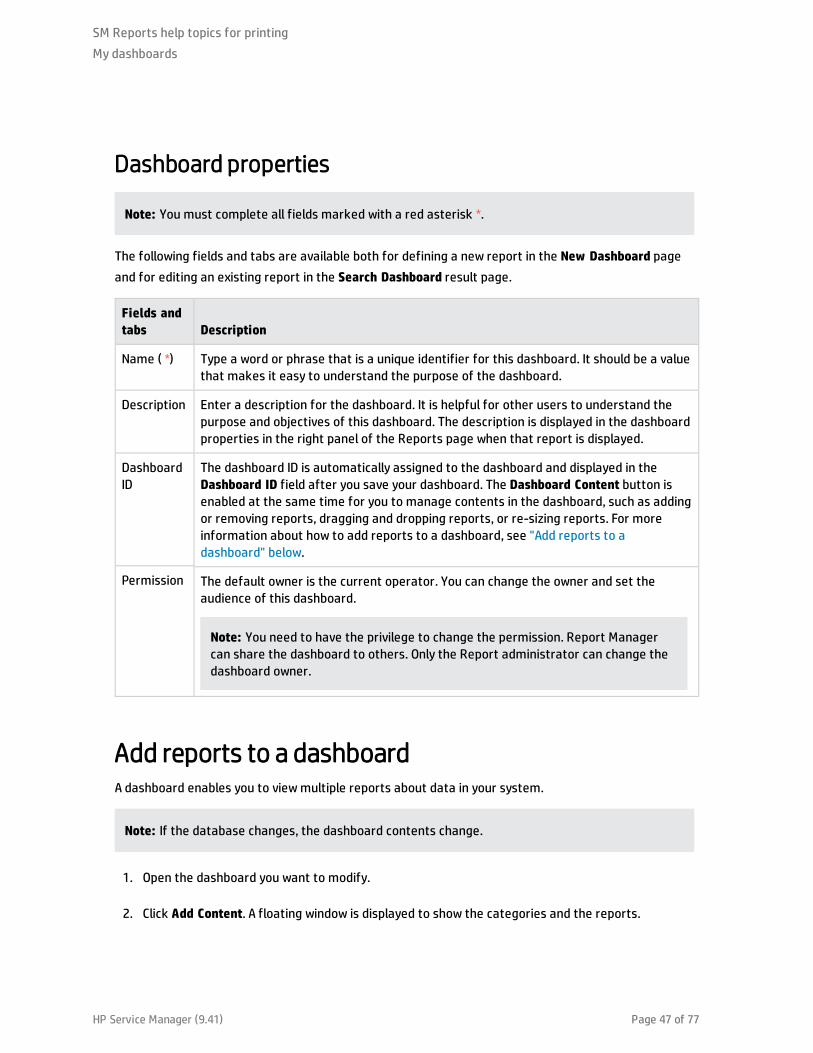
Dashboard properties
Note: You must complete all fields marked with a red asterisk *.
The following fields and tabs are available both for defining a new report in the New Dashboard page
and for editing an existing report in the Search Dashboard result page.
Fields and tabs Description
Name ( *) Type a word or phrase that is a unique identifier for this dashboard. It should be a value that makes it easy to understand the purpose of the dashboard.
Description Enter a description for the dashboard. It is helpful for other users to understand the purpose and objectives of this dashboard. The description is displayed in the dashboard properties in the right panel of the Reports page when that report is displayed.
Dashboard ID
The dashboard ID is automatically assigned to the dashboard and displayed in the Dashboard ID field after you save your dashboard. The Dashboard Content button is enabled at the same time for you to manage contents in the dashboard, such as adding or removing reports, dragging and dropping reports, or re-sizing reports. For more information about how to add reports to a dashboard, see "Add reports to a dashboard" below.
Permission The default owner is the current operator. You can change the owner and set the audience of this dashboard.
Note: You need to have the privilege to change the permission. Report Manager can share the dashboard to others. Only the Report administrator can change the dashboard owner.
Add reports to a dashboardA dashboard enables you to view multiple reports about data in your system.
Note: If the database changes, the dashboard contents change.
1. Open the dashboard you want to modify.
2. Click Add Content. A floating window is displayed to show the categories and the reports.
SM Reports help topics for printing
My dashboards
HP Service Manager (9.41) Page 47 of 77
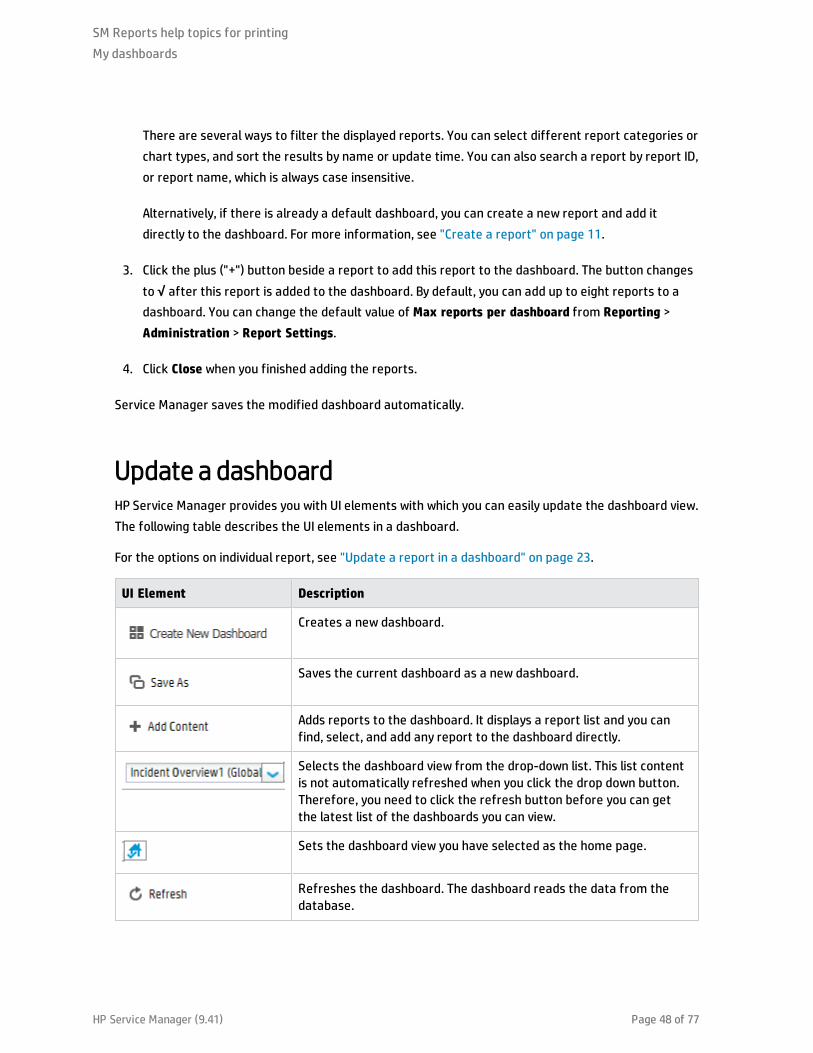
There are several ways to filter the displayed reports. You can select different report categories or
chart types, and sort the results by name or update time. You can also search a report by report ID,
or report name, which is always case insensitive.
Alternatively, if there is already a default dashboard, you can create a new report and add it
directly to the dashboard. For more information, see "Create a report" on page 11.
3. Click the plus ("+") button beside a report to add this report to the dashboard. The button changes
to √ after this report is added to the dashboard. By default, you can add up to eight reports to a
dashboard. You can change the default value of Max reports per dashboard from Reporting >
Administration > Report Settings.
4. Click Close when you finished adding the reports.
Service Manager saves the modified dashboard automatically.
Update a dashboardHP Service Manager provides you with UI elements with which you can easily update the dashboard view.
The following table describes the UI elements in a dashboard.
For the options on individual report, see "Update a report in a dashboard" on page 23.
UI Element Description
Creates a new dashboard.
Saves the current dashboard as a new dashboard.
Adds reports to the dashboard. It displays a report list and you can find, select, and add any report to the dashboard directly.
Selects the dashboard view from the drop-down list. This list content is not automatically refreshed when you click the drop down button. Therefore, you need to click the refresh button before you can get the latest list of the dashboards you can view.
Sets the dashboard view you have selected as the home page.
Refreshes the dashboard. The dashboard reads the data from the database.
SM Reports help topics for printing
My dashboards
HP Service Manager (9.41) Page 48 of 77
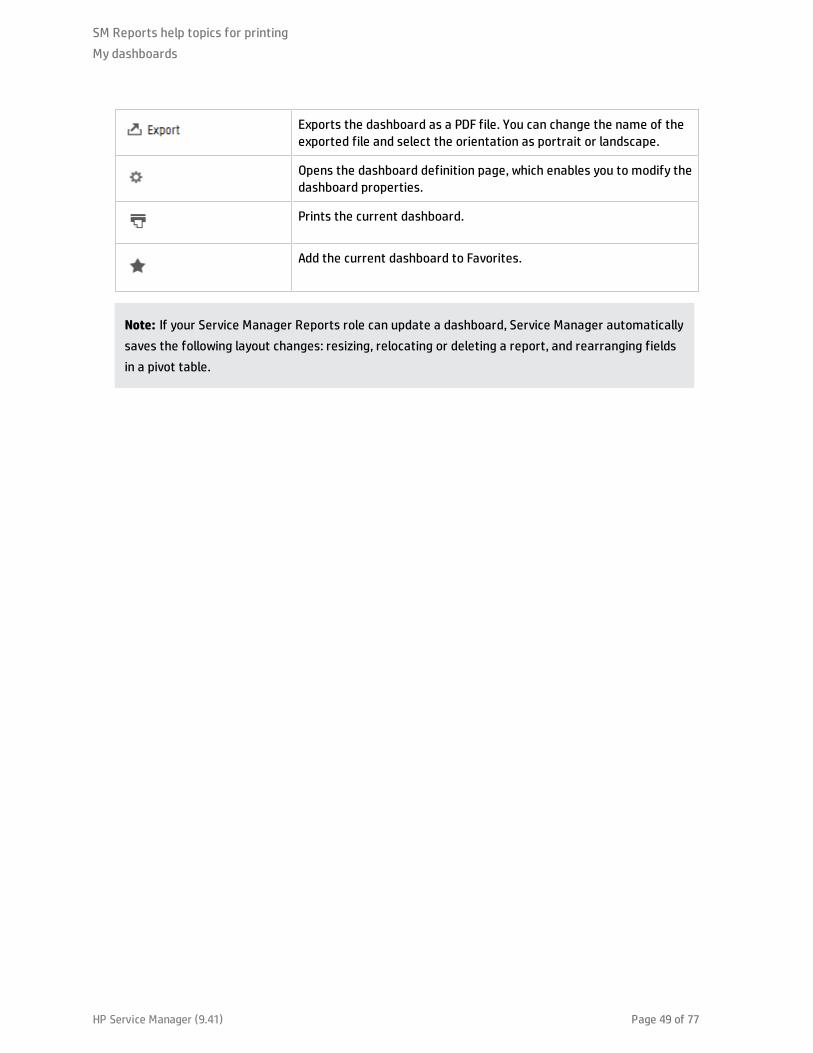
Exports the dashboard as a PDF file. You can change the name of the exported file and select the orientation as portrait or landscape.
Opens the dashboard definition page, which enables you to modify the dashboard properties.
Prints the current dashboard.
Add the current dashboard to Favorites.
Note: If your Service Manager Reports role can update a dashboard, Service Manager automatically
saves the following layout changes: resizing, relocating or deleting a report, and rearranging fields
in a pivot table.
SM Reports help topics for printing
My dashboards
HP Service Manager (9.41) Page 49 of 77
Report schedule and distributionReport schedules assist report managers or administrators to send the reports or the dashboards
information on scheduled intervals to the notified users or user groups.
A report schedule specifies who is to be notified, when, and the notification method. An administrator
must make sure that the report or dashboard has been created in HP Service Manager before Service
Manager can create an report schedule record.
Scheduled reports or dashboards enable users to view the updated content without logging in to Service
Manager. Service Manager Reports provide two ways to distribute the schedule reports or dashboards:
sending email notifications by attaching the generated PDF files, or using the file server to save the
generated files.
For example, if you want to embed the scheduled reports to your applications, you can follow these
steps:
1. Generate scheduled reports and specify a folder for these reports.
2. Set up an Apache instance to access the folder and provide static URLs for the reports.
3. Embed the Apache URLs in the products.
In this way, users can view the updated content from your applications timely and directly.
Create a report scheduleApplies to User Roles:
Report Manager
To create a new report schedule, follow these steps:
1. Click Reporting > Report Schedule > Create New Schedule.
2. Type the name of the new report schedule in the Name field.
3. Select the Owner for this report schedule. The owner is the operator by default. You can change
this value only if you are a Report Administrator.
4. Type the description of the new report schedule in the Description field.
HP Service Manager (9.41) Page 50 of 77
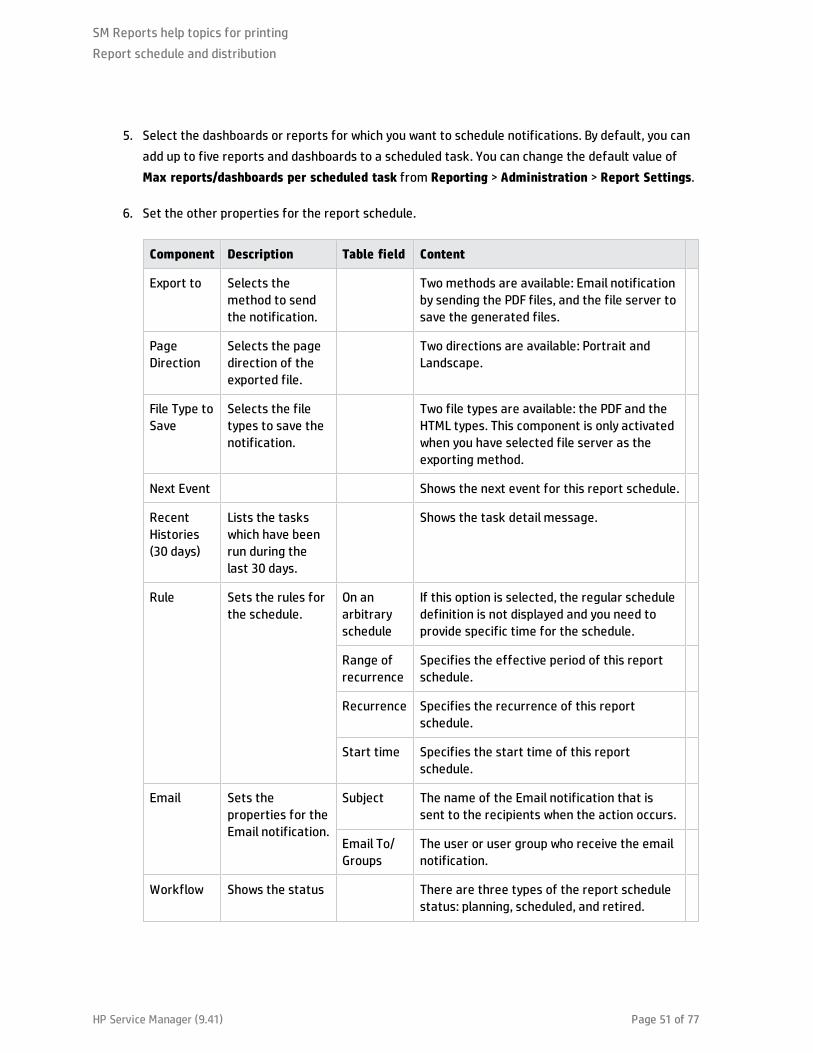
5. Select the dashboards or reports for which you want to schedule notifications. By default, you can
add up to five reports and dashboards to a scheduled task. You can change the default value of
Max reports/dashboards per scheduled task from Reporting > Administration > Report Settings.
6. Set the other properties for the report schedule.
Component Description Table field Content
Export to Selects the method to send the notification.
Two methods are available: Email notification by sending the PDF files, and the file server to save the generated files.
Page Direction
Selects the page direction of the exported file.
Two directions are available: Portrait and Landscape.
File Type to Save
Selects the file types to save the notification.
Two file types are available: the PDF and the HTML types. This component is only activated when you have selected file server as the exporting method.
Next Event Shows the next event for this report schedule.
Recent Histories (30 days)
Lists the tasks which have been run during the last 30 days.
Shows the task detail message.
Rule Sets the rules for the schedule.
On an arbitrary schedule
If this option is selected, the regular schedule definition is not displayed and you need to provide specific time for the schedule.
Range of recurrence
Specifies the effective period of this report schedule.
Recurrence Specifies the recurrence of this report schedule.
Start time Specifies the start time of this report schedule.
Email Sets the properties for the Email notification.
Subject The name of the Email notification that is sent to the recipients when the action occurs.
Email To/ Groups
The user or user group who receive the email notification.
Workflow Shows the status There are three types of the report schedule status: planning, scheduled, and retired.
SM Reports help topics for printing
Report schedule and distribution
HP Service Manager (9.41) Page 51 of 77
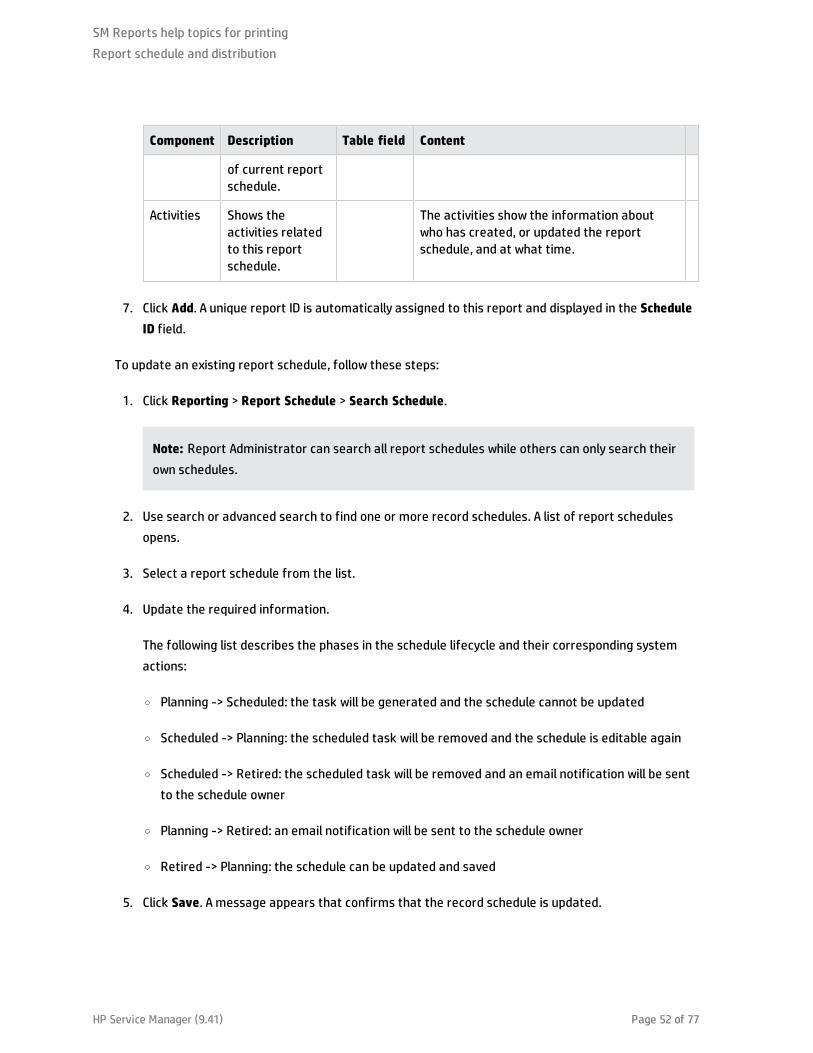
Component Description Table field Content
of current report schedule.
Activities Shows the activities related to this report schedule.
The activities show the information about who has created, or updated the report schedule, and at what time.
7. Click Add. A unique report ID is automatically assigned to this report and displayed in the Schedule
ID field.
To update an existing report schedule, follow these steps:
1. Click Reporting > Report Schedule > Search Schedule.
Note: Report Administrator can search all report schedules while others can only search their
own schedules.
2. Use search or advanced search to find one or more record schedules. A list of report schedules
opens.
3. Select a report schedule from the list.
4. Update the required information.
The following list describes the phases in the schedule lifecycle and their corresponding system
actions:
o Planning -> Scheduled: the task will be generated and the schedule cannot be updated
o Scheduled -> Planning: the scheduled task will be removed and the schedule is editable again
o Scheduled -> Retired: the scheduled task will be removed and an email notification will be sent
to the schedule owner
o Planning -> Retired: an email notification will be sent to the schedule owner
o Retired -> Planning: the schedule can be updated and saved
5. Click Save. A message appears that confirms that the record schedule is updated.
SM Reports help topics for printing
Report schedule and distribution
HP Service Manager (9.41) Page 52 of 77

Background schedule process
You can start a background schedule process by running the sm report.export command. Make sure
you have already specified the path to save the exported reports and dashboards by adding the
dashboard_export_path parameter to the sm.ini file.
Note: If you set too many threads for one process, you have to add the JVMOption parameter to
expand the memory capacity. For example, you can start the process by running the following
command:
sm -JVMOption0:-Xms1024m -JVMOption1:-Xmx1024m report.export
To check the running status of the background schedule process, click Miscellaneous > System Status.
There are six types of threads which will run:
l report.export.misc
o Cleans the report performance log
o Regenerates the schedule task in 30 days
o Moves the task from reportscheduletask to reportschedulehistory
l report.export.distribute
Distributes the reports or the dashboards by email or to the file server.
Note: The clean:1 parameter excludes a message from email notifications about exported
reports or dashboards. See "Startup parameter: clean" on page 1. By default, this message is
included.
l report.export.prepare
Prepares the data to generate the reports and dashboards.
l report.export
This schedule thread will synchronize the status of the other three types of schedule threads.
Restart the schedule thread if it stops responding. Make sure you set the correct maximum counts
SM Reports help topics for printing
Report schedule and distribution
HP Service Manager (9.41) Page 53 of 77
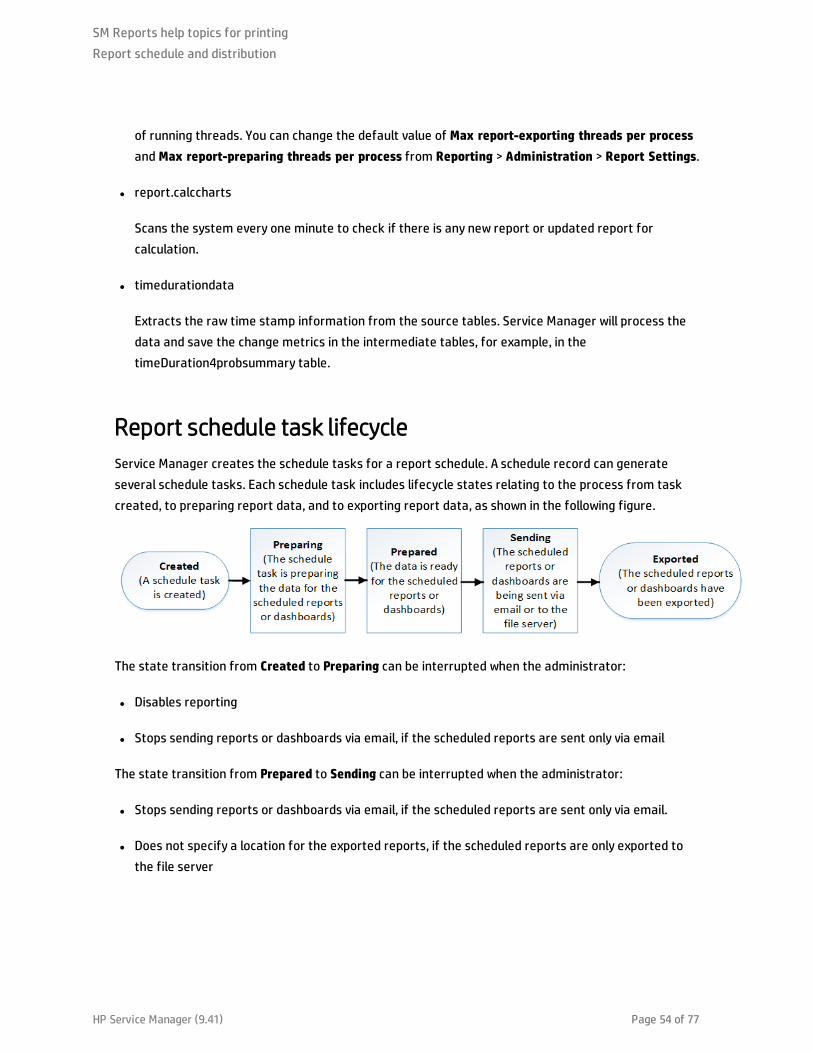
of running threads. You can change the default value of Max report-exporting threads per process
and Max report-preparing threads per process from Reporting > Administration > Report Settings.
l report.calccharts
Scans the system every one minute to check if there is any new report or updated report for
calculation.
l timedurationdata
Extracts the raw time stamp information from the source tables. Service Manager will process the
data and save the change metrics in the intermediate tables, for example, in the
timeDuration4probsummary table.
Report schedule task lifecycle
Service Manager creates the schedule tasks for a report schedule. A schedule record can generate
several schedule tasks. Each schedule task includes lifecycle states relating to the process from task
created, to preparing report data, and to exporting report data, as shown in the following figure.
The state transition from Created to Preparing can be interrupted when the administrator:
l Disables reporting
l Stops sending reports or dashboards via email, if the scheduled reports are sent only via email
The state transition from Prepared to Sending can be interrupted when the administrator:
l Stops sending reports or dashboards via email, if the scheduled reports are sent only via email.
l Does not specify a location for the exported reports, if the scheduled reports are only exported to
the file server
SM Reports help topics for printing
Report schedule and distribution
HP Service Manager (9.41) Page 54 of 77

l Service Manager cannot interrupt the state transition from Preparing to Prepared or the state
transition from Sending to Exported.
l If you disable reporting, it will prevent Service Manager from generating any more schedule
tasks.
Apply a template to complete a report scheduleTemplates enable users to quickly complete a report schedule by automatically populating fields with
the applicable information.
To apply a template to complete a report schedule, follow these steps:
1. Open a report schedule.
2. Click Apply Template. The Select Report Schedule Template wizard opens.
3. Double-click the template that you want to apply to the selected report schedule. You are returned
to the selected report schedule, and the fields are automatically filled in with the values set in the
template.
4. Complete the other fields, as needed.
5. Click Save & Exit.
Note: Users authorized to use this template can also modify the template to meet their needs.
SM Reports help topics for printing
Report schedule and distribution
HP Service Manager (9.41) Page 55 of 77
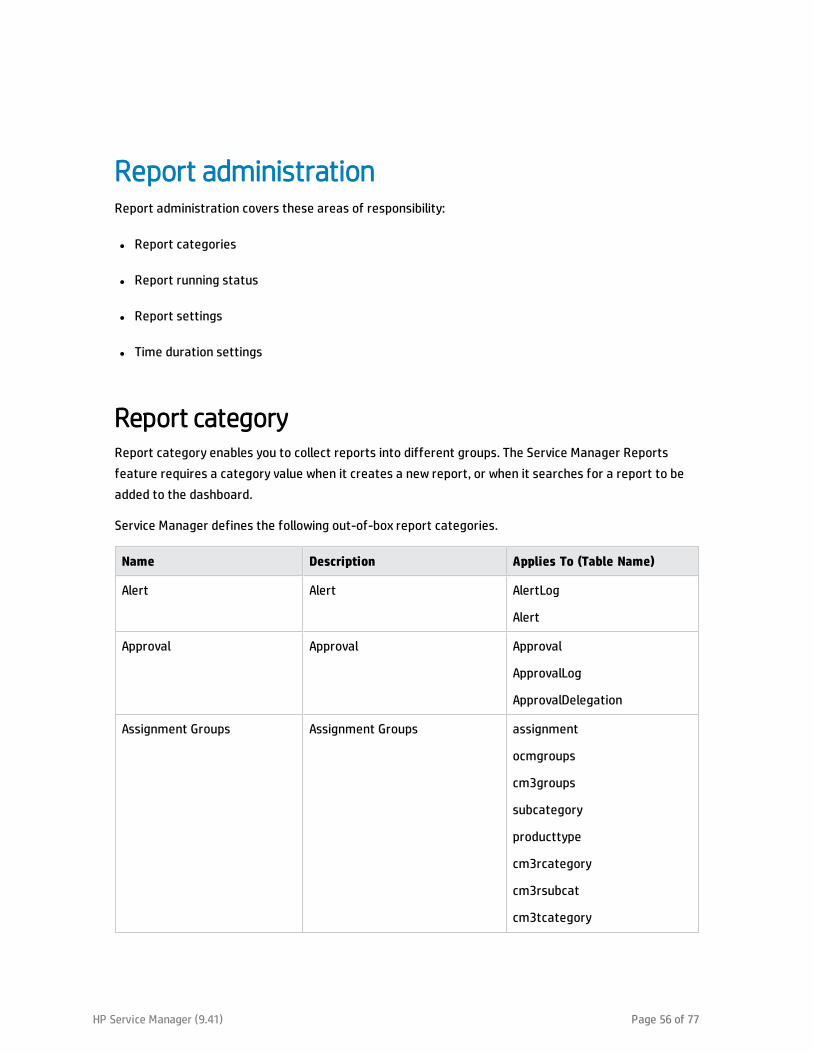
Report administrationReport administration covers these areas of responsibility:
l Report categories
l Report running status
l Report settings
l Time duration settings
Report categoryReport category enables you to collect reports into different groups. The Service Manager Reports
feature requires a category value when it creates a new report, or when it searches for a report to be
added to the dashboard.
Service Manager defines the following out-of-box report categories.
Name Description Applies To (Table Name)
Alert Alert AlertLog
Alert
Approval Approval Approval
ApprovalLog
ApprovalDelegation
Assignment Groups Assignment Groups assignment
ocmgroups
cm3groups
subcategory
producttype
cm3rcategory
cm3rsubcat
cm3tcategory
HP Service Manager (9.41) Page 56 of 77
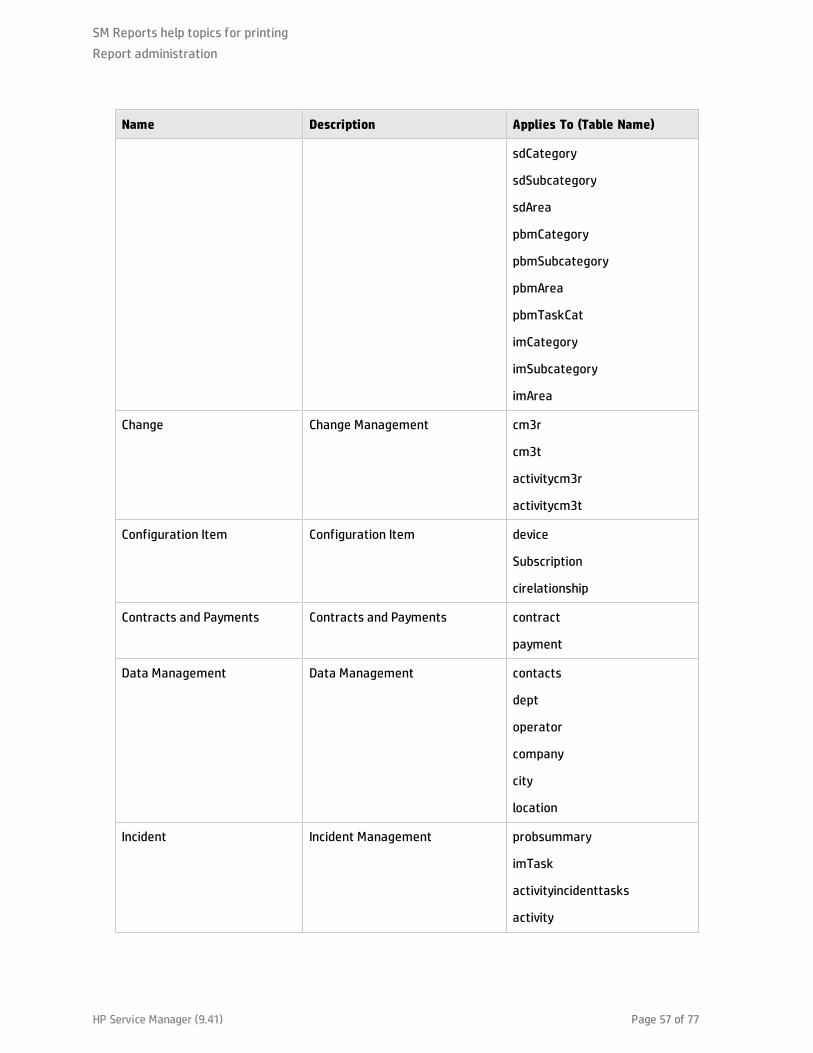
Name Description Applies To (Table Name)
sdCategory
sdSubcategory
sdArea
pbmCategory
pbmSubcategory
pbmArea
pbmTaskCat
imCategory
imSubcategory
imArea
Change Change Management cm3r
cm3t
activitycm3r
activitycm3t
Configuration Item Configuration Item device
Subscription
cirelationship
Contracts and Payments Contracts and Payments contract
payment
Data Management Data Management contacts
dept
operator
company
city
location
Incident Incident Management probsummary
imTask
activityincidenttasks
activity
SM Reports help topics for printing
Report administration
HP Service Manager (9.41) Page 57 of 77
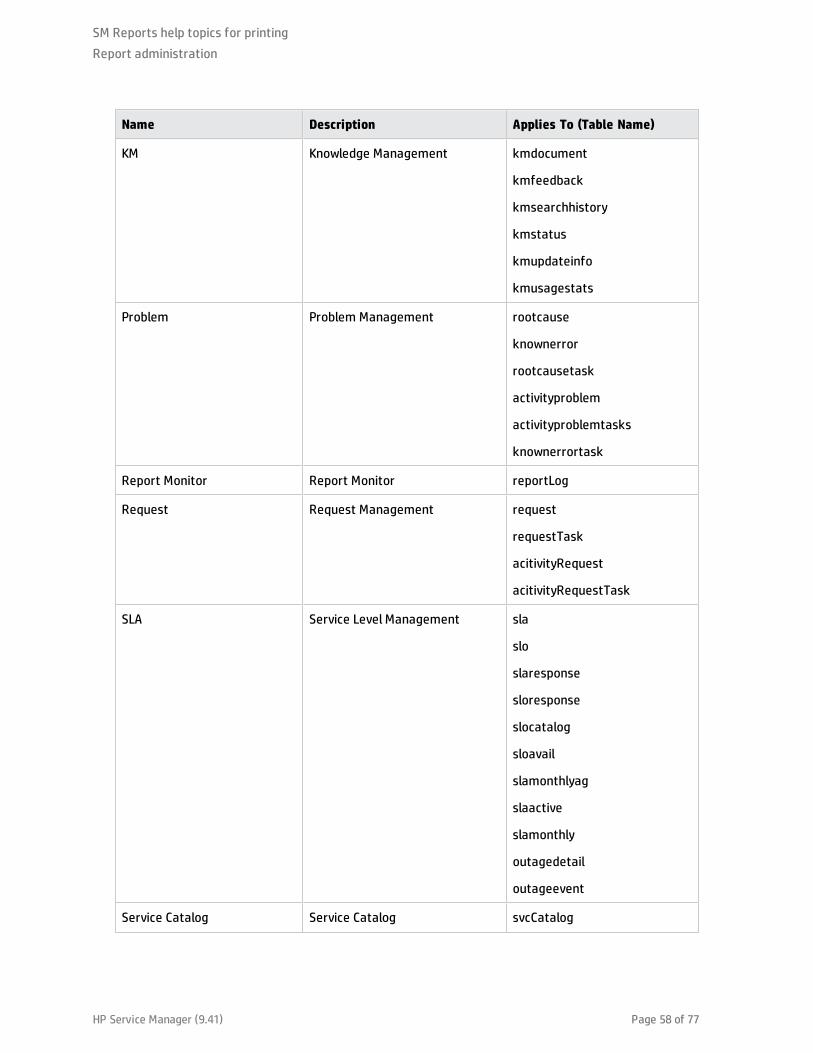
Name Description Applies To (Table Name)
KM Knowledge Management kmdocument
kmfeedback
kmsearchhistory
kmstatus
kmupdateinfo
kmusagestats
Problem Problem Management rootcause
knownerror
rootcausetask
activityproblem
activityproblemtasks
knownerrortask
Report Monitor Report Monitor reportLog
Request Request Management request
requestTask
acitivityRequest
acitivityRequestTask
SLA Service Level Management sla
slo
slaresponse
sloresponse
slocatalog
sloavail
slamonthlyag
slaactive
slamonthly
outagedetail
outageevent
Service Catalog Service Catalog svcCatalog
SM Reports help topics for printing
Report administration
HP Service Manager (9.41) Page 58 of 77
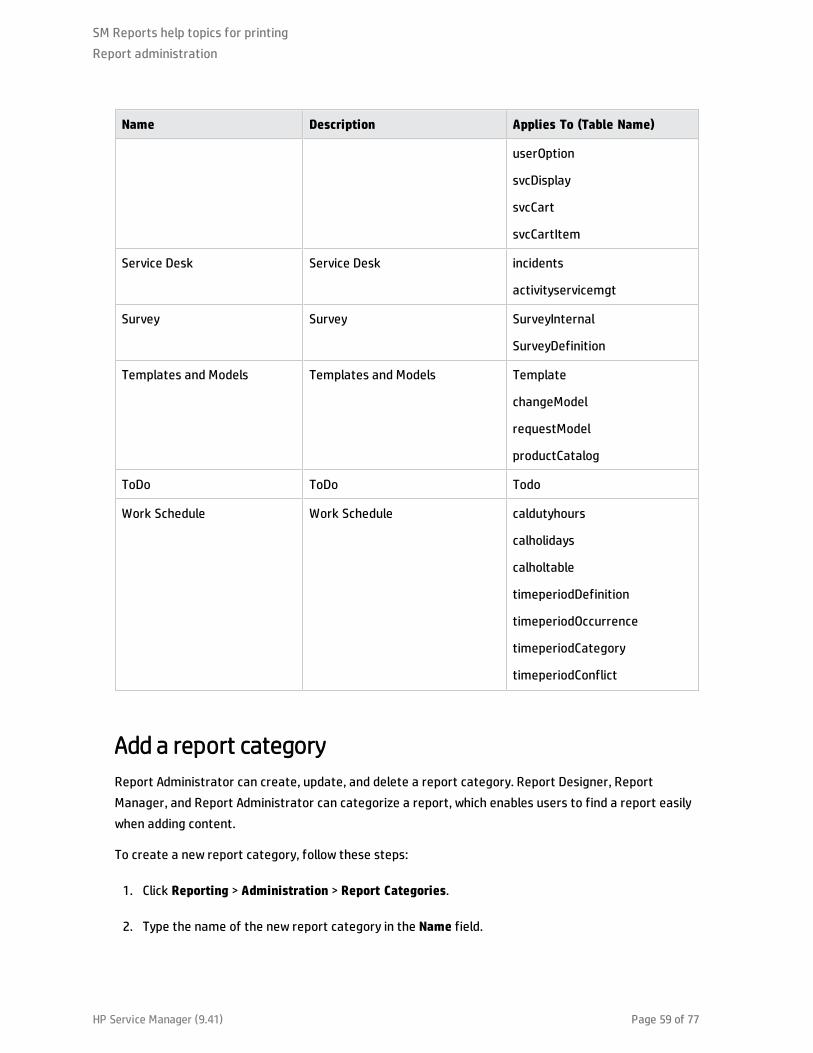
Name Description Applies To (Table Name)
userOption
svcDisplay
svcCart
svcCartItem
Service Desk Service Desk incidents
activityservicemgt
Survey Survey SurveyInternal
SurveyDefinition
Templates and Models Templates and Models Template
changeModel
requestModel
productCatalog
ToDo ToDo Todo
Work Schedule Work Schedule caldutyhours
calholidays
calholtable
timeperiodDefinition
timeperiodOccurrence
timeperiodCategory
timeperiodConflict
Add a report category
Report Administrator can create, update, and delete a report category. Report Designer, Report
Manager, and Report Administrator can categorize a report, which enables users to find a report easily
when adding content.
To create a new report category, follow these steps:
1. Click Reporting > Administration > Report Categories.
2. Type the name of the new report category in the Name field.
SM Reports help topics for printing
Report administration
HP Service Manager (9.41) Page 59 of 77
3. Type the description of the new report category in the Description field.
4. Select the table names to be grouped in this category from the drop-down list in the Applies To
field.
5. Click New.
6. Click Save. A message appears that confirms that the report category record is added.
To update an existing report category, follow these steps:
1. Click Reporting > Administration > Report Categories.
2. Use search or advanced search to find one or more records. A list of report categories opens.
3. Select a report category from the list.
4. Update the required information.
5. Click Save. A message appears that confirms that the report category record is updated.
Note: If you type a new report category when creating a report, this report category is only local
and you can see this category only when you are adding a report to a dashboard.
Report running status The Report Running Status dashboard helps you to identify whether Service Manager is working well
when the system is generating reports. This prevents the system from returning errors if the status is
showing that generating some reports has a significant impact on the system performance.
Service Manager monitors performance impact of reports and dashboards. Service Manager takes
some time to generate reports. If this time exceeds the time threshold that the administrator sets, the
report performance log collects the information and displays the slow reports information on the
Report Running Status dashboard. If Service Manager spends too much time loading one of the slow
reports, the loading of the dashboard that includes this report could be very slow.
You can click Disable this Report to disable the slow reports displayed on the Report Running Status
dashboard directly. Or, you can click Open Report to diagnose the reason, and then decide whether to
modify the report or to disable the report. For those reports that are diagnosed as the cause of the
problem, the administrator can take the following measures to eliminate the impact of this particular
report.
SM Reports help topics for printing
Report administration
HP Service Manager (9.41) Page 60 of 77
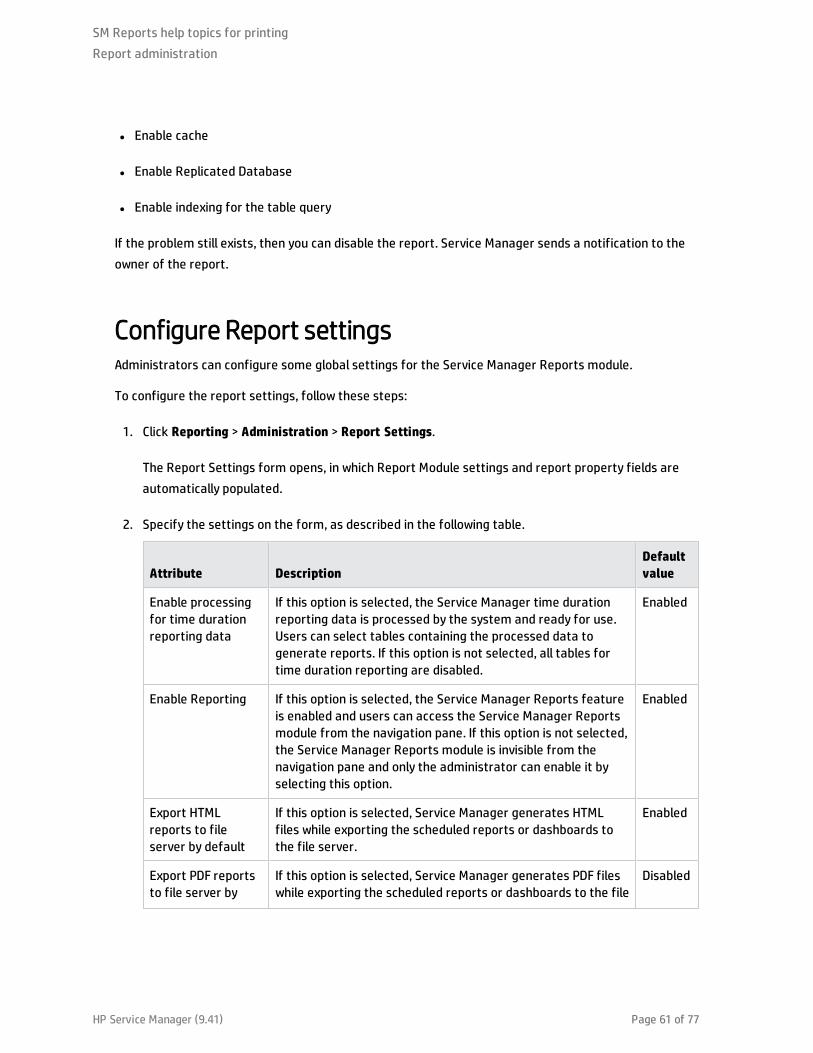
l Enable cache
l Enable Replicated Database
l Enable indexing for the table query
If the problem still exists, then you can disable the report. Service Manager sends a notification to the
owner of the report.
Configure Report settingsAdministrators can configure some global settings for the Service Manager Reports module.
To configure the report settings, follow these steps:
1. Click Reporting > Administration > Report Settings.
The Report Settings form opens, in which Report Module settings and report property fields are
automatically populated.
2. Specify the settings on the form, as described in the following table.
Attribute DescriptionDefault value
Enable processing for time duration reporting data
If this option is selected, the Service Manager time duration reporting data is processed by the system and ready for use. Users can select tables containing the processed data to generate reports. If this option is not selected, all tables for time duration reporting are disabled.
Enabled
Enable Reporting If this option is selected, the Service Manager Reports feature is enabled and users can access the Service Manager Reports module from the navigation pane. If this option is not selected, the Service Manager Reports module is invisible from the navigation pane and only the administrator can enable it by selecting this option.
Enabled
Export HTML reports to file server by default
If this option is selected, Service Manager generates HTML files while exporting the scheduled reports or dashboards to the file server.
Enabled
Export PDF reports to file server by
If this option is selected, Service Manager generates PDF files while exporting the scheduled reports or dashboards to the file
Disabled
SM Reports help topics for printing
Report administration
HP Service Manager (9.41) Page 61 of 77
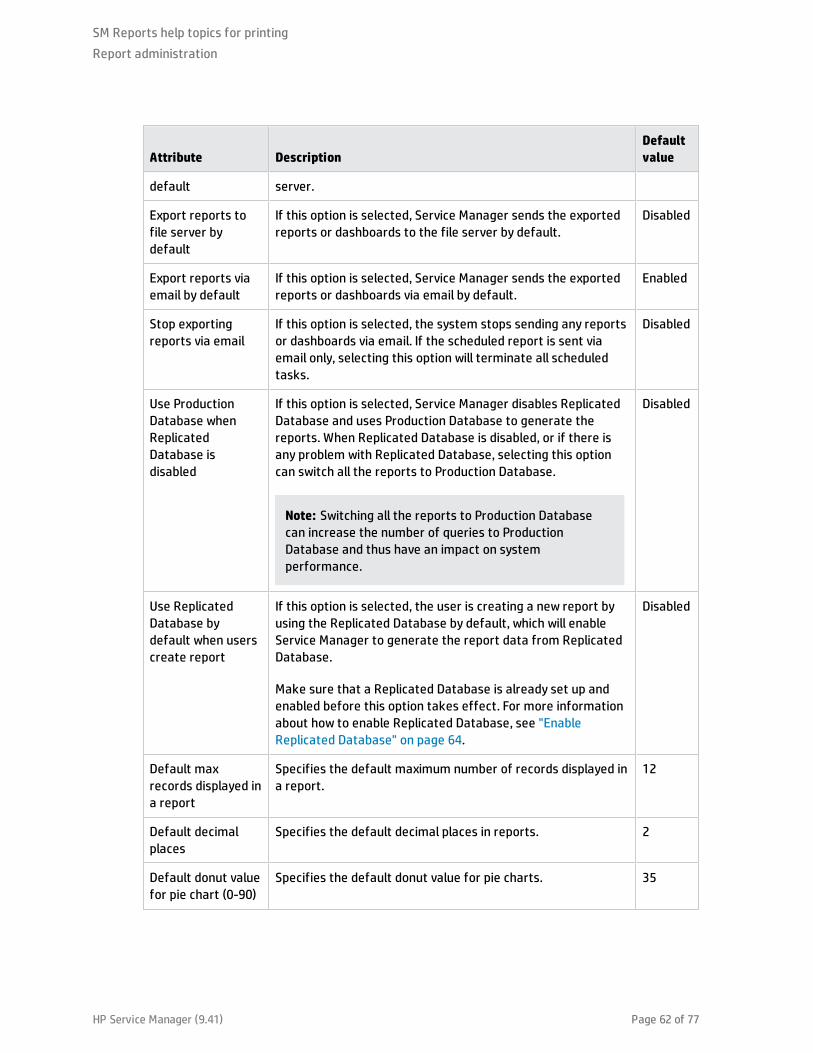
Attribute DescriptionDefault value
default server.
Export reports to file server by default
If this option is selected, Service Manager sends the exported reports or dashboards to the file server by default.
Disabled
Export reports via email by default
If this option is selected, Service Manager sends the exported reports or dashboards via email by default.
Enabled
Stop exporting reports via email
If this option is selected, the system stops sending any reports or dashboards via email. If the scheduled report is sent via email only, selecting this option will terminate all scheduled tasks.
Disabled
Use Production Database when Replicated Database is disabled
If this option is selected, Service Manager disables Replicated Database and uses Production Database to generate the reports. When Replicated Database is disabled, or if there is any problem with Replicated Database, selecting this option can switch all the reports to Production Database.
Note: Switching all the reports to Production Database can increase the number of queries to Production Database and thus have an impact on system performance.
Disabled
Use Replicated Database by default when users create report
If this option is selected, the user is creating a new report by using the Replicated Database by default, which will enable Service Manager to generate the report data from Replicated Database.
Make sure that a Replicated Database is already set up and enabled before this option takes effect. For more information about how to enable Replicated Database, see "Enable Replicated Database" on page 64.
Disabled
Default max records displayed in a report
Specifies the default maximum number of records displayed in a report.
12
Default decimal places
Specifies the default decimal places in reports. 2
Default donut value for pie chart (0-90)
Specifies the default donut value for pie charts. 35
SM Reports help topics for printing
Report administration
HP Service Manager (9.41) Page 62 of 77
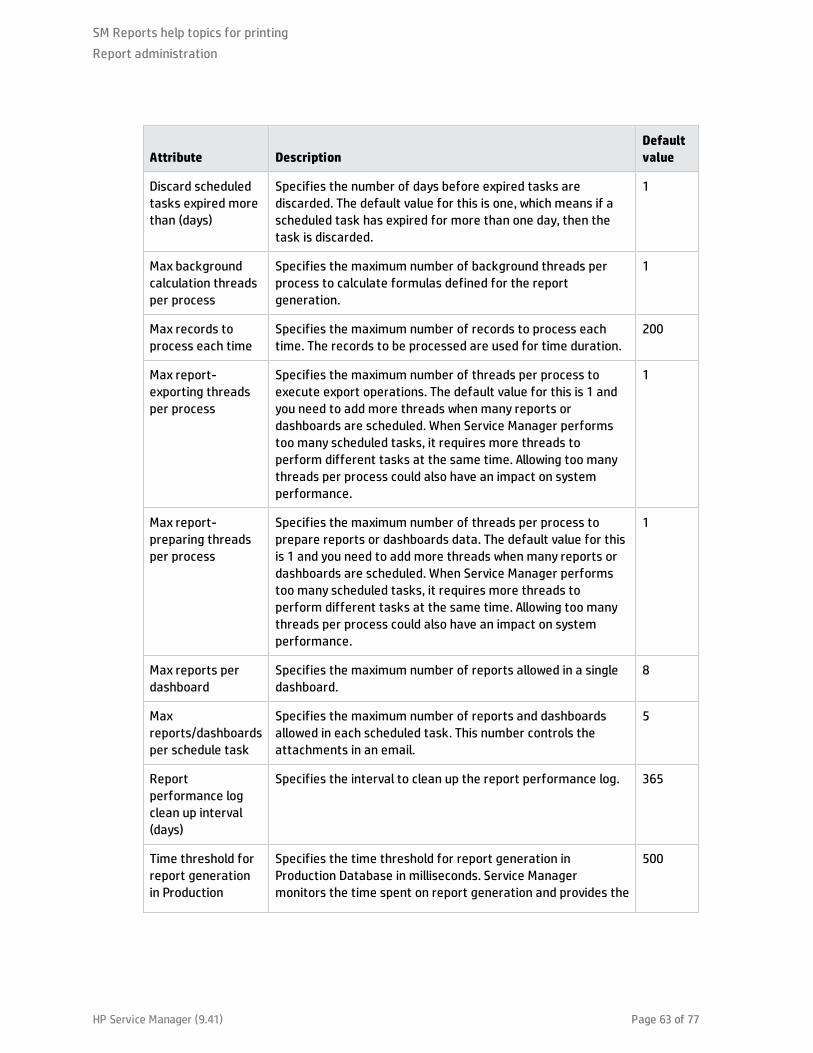
Attribute DescriptionDefault value
Discard scheduled tasks expired more than (days)
Specifies the number of days before expired tasks are discarded. The default value for this is one, which means if a scheduled task has expired for more than one day, then the task is discarded.
1
Max background calculation threads per process
Specifies the maximum number of background threads per process to calculate formulas defined for the report generation.
1
Max records to process each time
Specifies the maximum number of records to process each time. The records to be processed are used for time duration.
200
Max report-exporting threads per process
Specifies the maximum number of threads per process to execute export operations. The default value for this is 1 and you need to add more threads when many reports or dashboards are scheduled. When Service Manager performs too many scheduled tasks, it requires more threads to perform different tasks at the same time. Allowing too many threads per process could also have an impact on system performance.
1
Max report-preparing threads per process
Specifies the maximum number of threads per process to prepare reports or dashboards data. The default value for this is 1 and you need to add more threads when many reports or dashboards are scheduled. When Service Manager performs too many scheduled tasks, it requires more threads to perform different tasks at the same time. Allowing too many threads per process could also have an impact on system performance.
1
Max reports per dashboard
Specifies the maximum number of reports allowed in a single dashboard.
8
Max reports/dashboards per schedule task
Specifies the maximum number of reports and dashboards allowed in each scheduled task. This number controls the attachments in an email.
5
Report performance log clean up interval (days)
Specifies the interval to clean up the report performance log. 365
Time threshold for report generation in Production
Specifies the time threshold for report generation in Production Database in milliseconds. Service Manager monitors the time spent on report generation and provides the
500
SM Reports help topics for printing
Report administration
HP Service Manager (9.41) Page 63 of 77
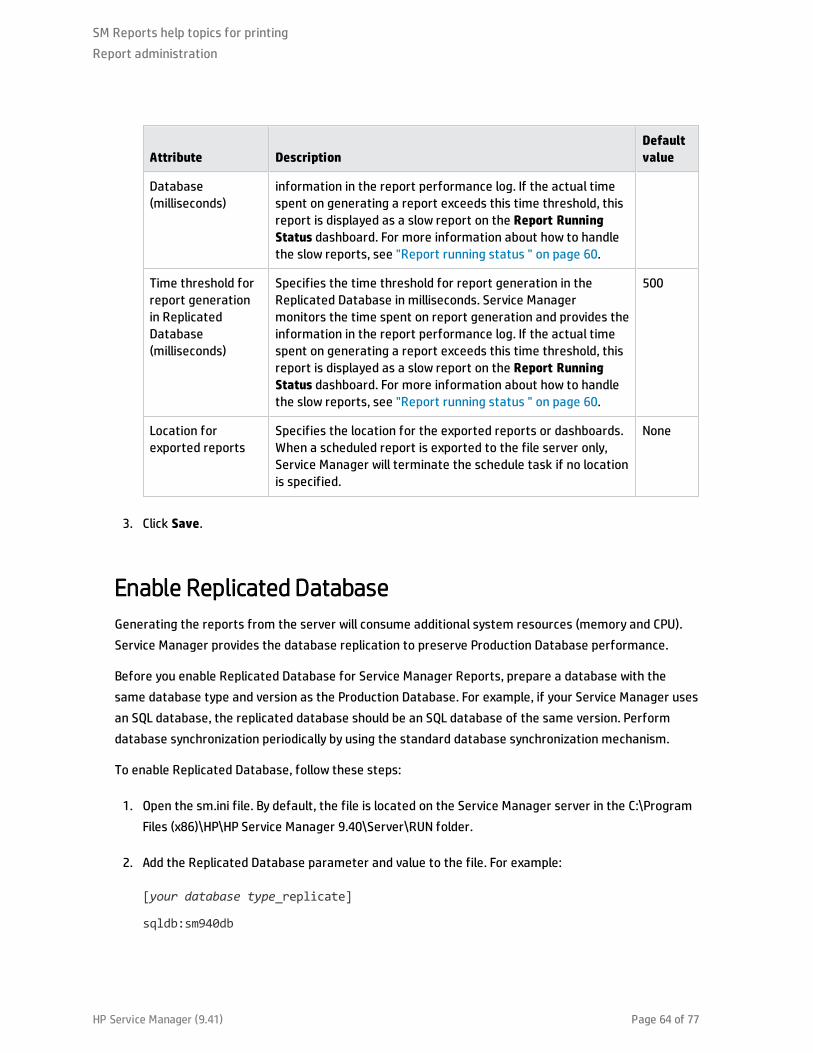
Attribute DescriptionDefault value
Database (milliseconds)
information in the report performance log. If the actual time spent on generating a report exceeds this time threshold, this report is displayed as a slow report on the Report Running Status dashboard. For more information about how to handle the slow reports, see "Report running status " on page 60.
Time threshold for report generation in Replicated Database (milliseconds)
Specifies the time threshold for report generation in the Replicated Database in milliseconds. Service Manager monitors the time spent on report generation and provides the information in the report performance log. If the actual time spent on generating a report exceeds this time threshold, this report is displayed as a slow report on the Report Running Status dashboard. For more information about how to handle the slow reports, see "Report running status " on page 60.
500
Location for exported reports
Specifies the location for the exported reports or dashboards. When a scheduled report is exported to the file server only, Service Manager will terminate the schedule task if no location is specified.
None
3. Click Save.
Enable Replicated Database
Generating the reports from the server will consume additional system resources (memory and CPU).
Service Manager provides the database replication to preserve Production Database performance.
Before you enable Replicated Database for Service Manager Reports, prepare a database with the
same database type and version as the Production Database. For example, if your Service Manager uses
an SQL database, the replicated database should be an SQL database of the same version. Perform
database synchronization periodically by using the standard database synchronization mechanism.
To enable Replicated Database, follow these steps:
1. Open the sm.ini file. By default, the file is located on the Service Manager server in the C:\Program
Files (x86)\HP\HP Service Manager 9.40\Server\RUN folder.
2. Add the Replicated Database parameter and value to the file. For example:
[your database type_replicate]
sqldb:sm940db
SM Reports help topics for printing
Report administration
HP Service Manager (9.41) Page 64 of 77
sqllogin:username/password
dashboardonreplicatedb
Note: The three parameter lines of Replicated Database should be in one block in the sm.ini
file.
3. Save the sm.ini file.
Enable query cache
For system performance consideration, Service Manager enables the query cache by default. When the
query cache is enabled, Service Manager creates a cache table in the Production Database to save
query results and the query SQL. Both the queries against the Production Database and Replicated
Database are all saved in the cache table
Note: When the query result is expired or you refresh the report or dashboard, Service Manager will
retrieve the data by executing the query from the Production Database or Replicated Database
again.
To enable the query cache, follow these steps:
1. Open the sm.ini file. By default, the file is located on the Service Manager server in the C:\Program
Files (x86)\HP\HP Service Manager 9.40\Server\RUN folder.
2. Enter the query cache parameters and values in the file. Service Manager enables query cache by
default and the default values for the parameters are shown as follows:
dashboardquerycache_enable:1
dashboardquerycache_dbtime:100
dashboardquerycache_expire:10
3. Save the sm.ini file.
SM Reports help topics for printing
Report administration
HP Service Manager (9.41) Page 65 of 77
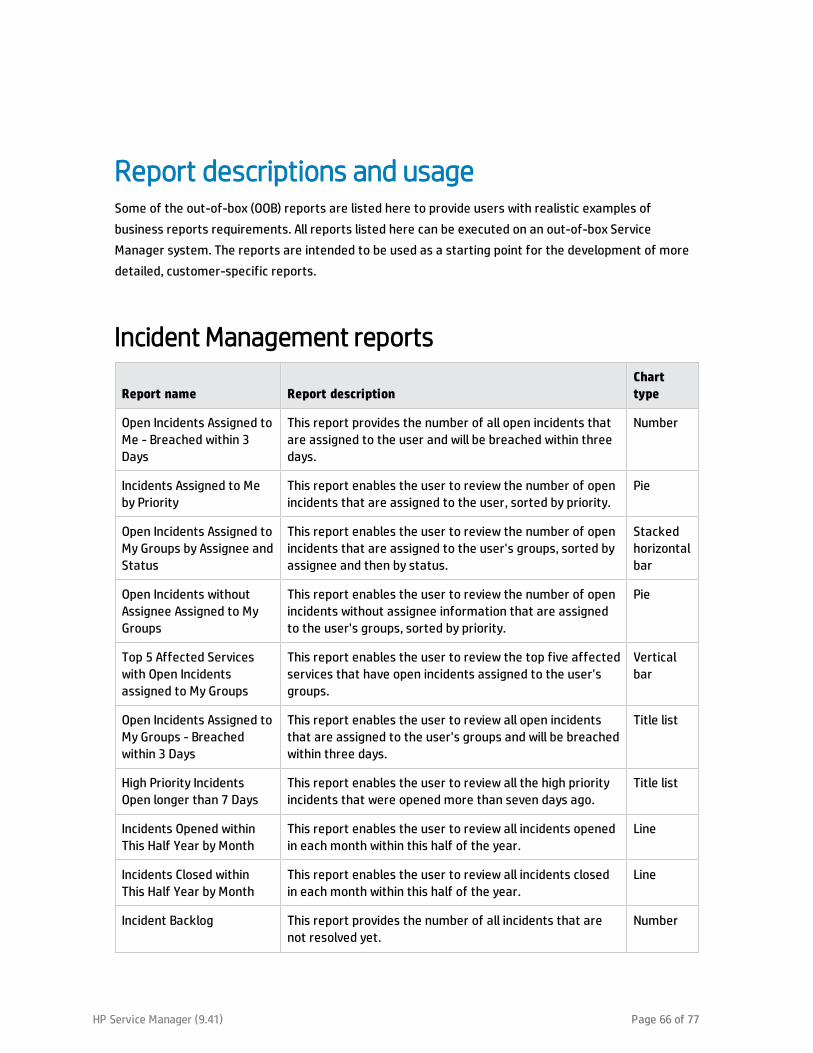
Report descriptions and usageSome of the out-of-box (OOB) reports are listed here to provide users with realistic examples of
business reports requirements. All reports listed here can be executed on an out-of-box Service
Manager system. The reports are intended to be used as a starting point for the development of more
detailed, customer-specific reports.
Incident Management reports
Report name Report descriptionChart type
Open Incidents Assigned to Me - Breached within 3 Days
This report provides the number of all open incidents that are assigned to the user and will be breached within three days.
Number
Incidents Assigned to Me by Priority
This report enables the user to review the number of open incidents that are assigned to the user, sorted by priority.
Pie
Open Incidents Assigned to My Groups by Assignee and Status
This report enables the user to review the number of open incidents that are assigned to the user's groups, sorted by assignee and then by status.
Stacked horizontal bar
Open Incidents without Assignee Assigned to My Groups
This report enables the user to review the number of open incidents without assignee information that are assigned to the user's groups, sorted by priority.
Pie
Top 5 Affected Services with Open Incidents assigned to My Groups
This report enables the user to review the top five affected services that have open incidents assigned to the user's groups.
Vertical bar
Open Incidents Assigned to My Groups - Breached within 3 Days
This report enables the user to review all open incidents that are assigned to the user's groups and will be breached within three days.
Title list
High Priority Incidents Open longer than 7 Days
This report enables the user to review all the high priority incidents that were opened more than seven days ago.
Title list
Incidents Opened within This Half Year by Month
This report enables the user to review all incidents opened in each month within this half of the year.
Line
Incidents Closed within This Half Year by Month
This report enables the user to review all incidents closed in each month within this half of the year.
Line
Incident Backlog This report provides the number of all incidents that are not resolved yet.
Number
HP Service Manager (9.41) Page 66 of 77
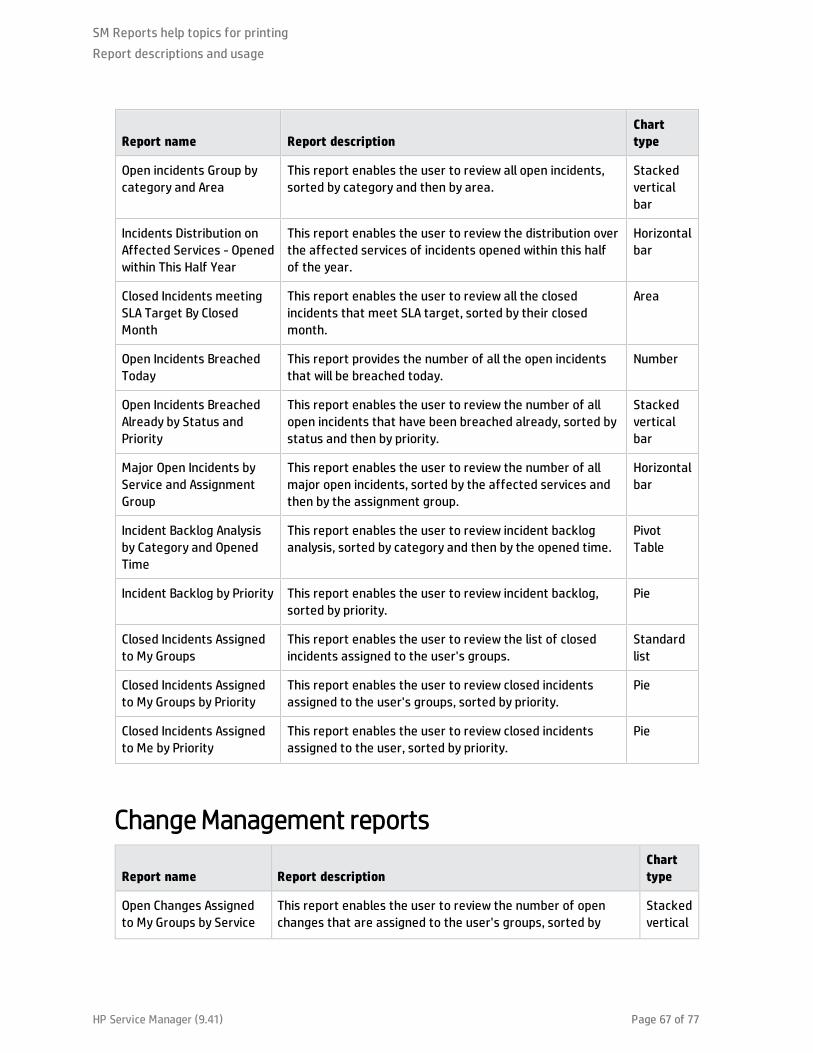
Report name Report descriptionChart type
Open incidents Group by category and Area
This report enables the user to review all open incidents, sorted by category and then by area.
Stacked vertical bar
Incidents Distribution on Affected Services - Opened within This Half Year
This report enables the user to review the distribution over the affected services of incidents opened within this half of the year.
Horizontal bar
Closed Incidents meeting SLA Target By Closed Month
This report enables the user to review all the closed incidents that meet SLA target, sorted by their closed month.
Area
Open Incidents Breached Today
This report provides the number of all the open incidents that will be breached today.
Number
Open Incidents Breached Already by Status and Priority
This report enables the user to review the number of all open incidents that have been breached already, sorted by status and then by priority.
Stacked vertical bar
Major Open Incidents by Service and Assignment Group
This report enables the user to review the number of all major open incidents, sorted by the affected services and then by the assignment group.
Horizontal bar
Incident Backlog Analysis by Category and Opened Time
This report enables the user to review incident backlog analysis, sorted by category and then by the opened time.
Pivot Table
Incident Backlog by Priority This report enables the user to review incident backlog, sorted by priority.
Pie
Closed Incidents Assigned to My Groups
This report enables the user to review the list of closed incidents assigned to the user's groups.
Standard list
Closed Incidents Assigned to My Groups by Priority
This report enables the user to review closed incidents assigned to the user's groups, sorted by priority.
Pie
Closed Incidents Assigned to Me by Priority
This report enables the user to review closed incidents assigned to the user, sorted by priority.
Pie
Change Management reports
Report name Report descriptionChart type
Open Changes Assigned to My Groups by Service
This report enables the user to review the number of open changes that are assigned to the user's groups, sorted by
Stacked vertical
SM Reports help topics for printing
Report descriptions and usage
HP Service Manager (9.41) Page 67 of 77
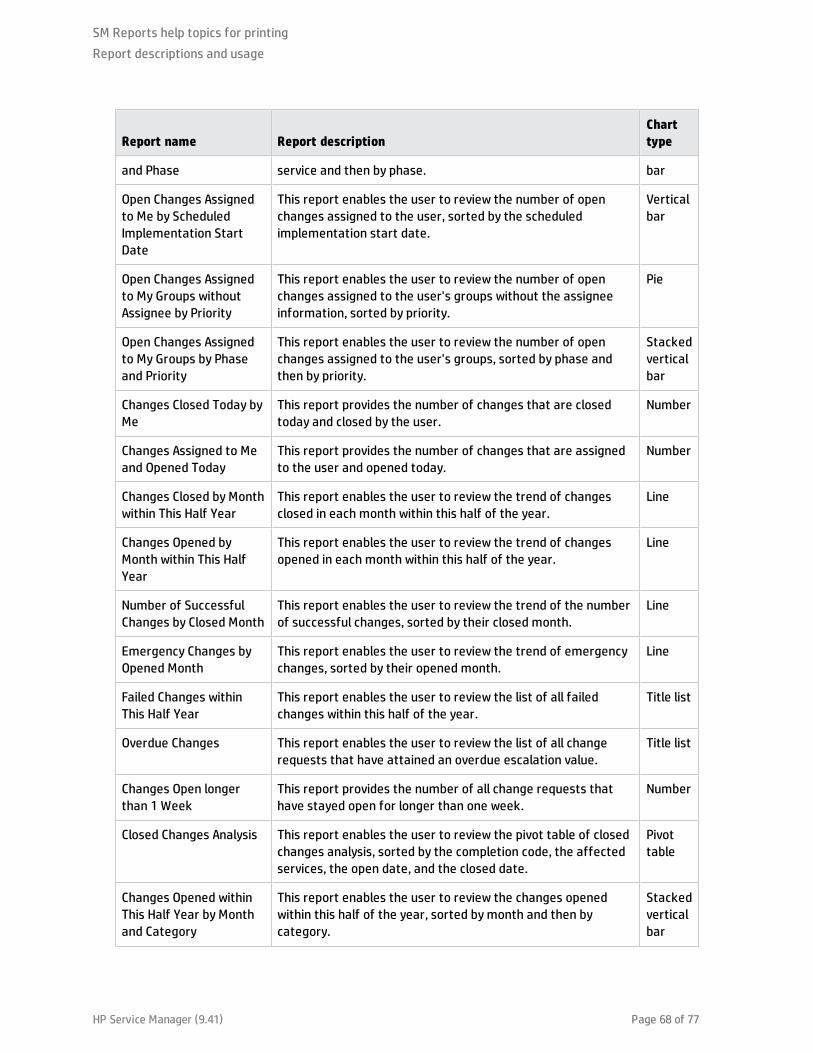
Report name Report descriptionChart type
and Phase service and then by phase. bar
Open Changes Assigned to Me by Scheduled Implementation Start Date
This report enables the user to review the number of open changes assigned to the user, sorted by the scheduled implementation start date.
Vertical bar
Open Changes Assigned to My Groups without Assignee by Priority
This report enables the user to review the number of open changes assigned to the user's groups without the assignee information, sorted by priority.
Pie
Open Changes Assigned to My Groups by Phase and Priority
This report enables the user to review the number of open changes assigned to the user's groups, sorted by phase and then by priority.
Stacked vertical bar
Changes Closed Today by Me
This report provides the number of changes that are closed today and closed by the user.
Number
Changes Assigned to Me and Opened Today
This report provides the number of changes that are assigned to the user and opened today.
Number
Changes Closed by Month within This Half Year
This report enables the user to review the trend of changes closed in each month within this half of the year.
Line
Changes Opened by Month within This Half Year
This report enables the user to review the trend of changes opened in each month within this half of the year.
Line
Number of Successful Changes by Closed Month
This report enables the user to review the trend of the number of successful changes, sorted by their closed month.
Line
Emergency Changes by Opened Month
This report enables the user to review the trend of emergency changes, sorted by their opened month.
Line
Failed Changes within This Half Year
This report enables the user to review the list of all failed changes within this half of the year.
Title list
Overdue Changes This report enables the user to review the list of all change requests that have attained an overdue escalation value.
Title list
Changes Open longer than 1 Week
This report provides the number of all change requests that have stayed open for longer than one week.
Number
Closed Changes Analysis This report enables the user to review the pivot table of closed changes analysis, sorted by the completion code, the affected services, the open date, and the closed date.
Pivot table
Changes Opened within This Half Year by Month and Category
This report enables the user to review the changes opened within this half of the year, sorted by month and then by category.
Stacked vertical bar
SM Reports help topics for printing
Report descriptions and usage
HP Service Manager (9.41) Page 68 of 77
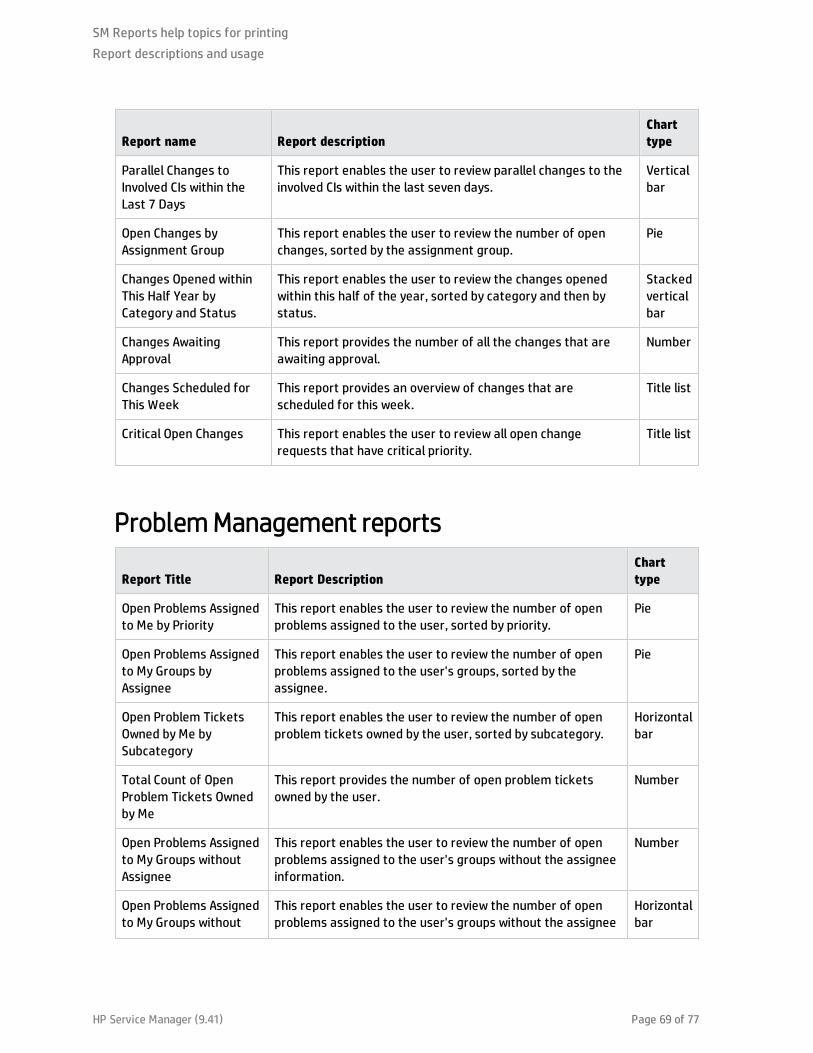
Report name Report descriptionChart type
Parallel Changes to Involved CIs within the Last 7 Days
This report enables the user to review parallel changes to the involved CIs within the last seven days.
Vertical bar
Open Changes by Assignment Group
This report enables the user to review the number of open changes, sorted by the assignment group.
Pie
Changes Opened within This Half Year by Category and Status
This report enables the user to review the changes opened within this half of the year, sorted by category and then by status.
Stacked vertical bar
Changes Awaiting Approval
This report provides the number of all the changes that are awaiting approval.
Number
Changes Scheduled for This Week
This report provides an overview of changes that are scheduled for this week.
Title list
Critical Open Changes This report enables the user to review all open change requests that have critical priority.
Title list
Problem Management reports
Report Title Report DescriptionChart type
Open Problems Assigned to Me by Priority
This report enables the user to review the number of open problems assigned to the user, sorted by priority.
Pie
Open Problems Assigned to My Groups by Assignee
This report enables the user to review the number of open problems assigned to the user's groups, sorted by the assignee.
Pie
Open Problem Tickets Owned by Me by Subcategory
This report enables the user to review the number of open problem tickets owned by the user, sorted by subcategory.
Horizontal bar
Total Count of Open Problem Tickets Owned by Me
This report provides the number of open problem tickets owned by the user.
Number
Open Problems Assigned to My Groups without Assignee
This report enables the user to review the number of open problems assigned to the user's groups without the assignee information.
Number
Open Problems Assigned to My Groups without
This report enables the user to review the number of open problems assigned to the user's groups without the assignee
Horizontal bar
SM Reports help topics for printing
Report descriptions and usage
HP Service Manager (9.41) Page 69 of 77
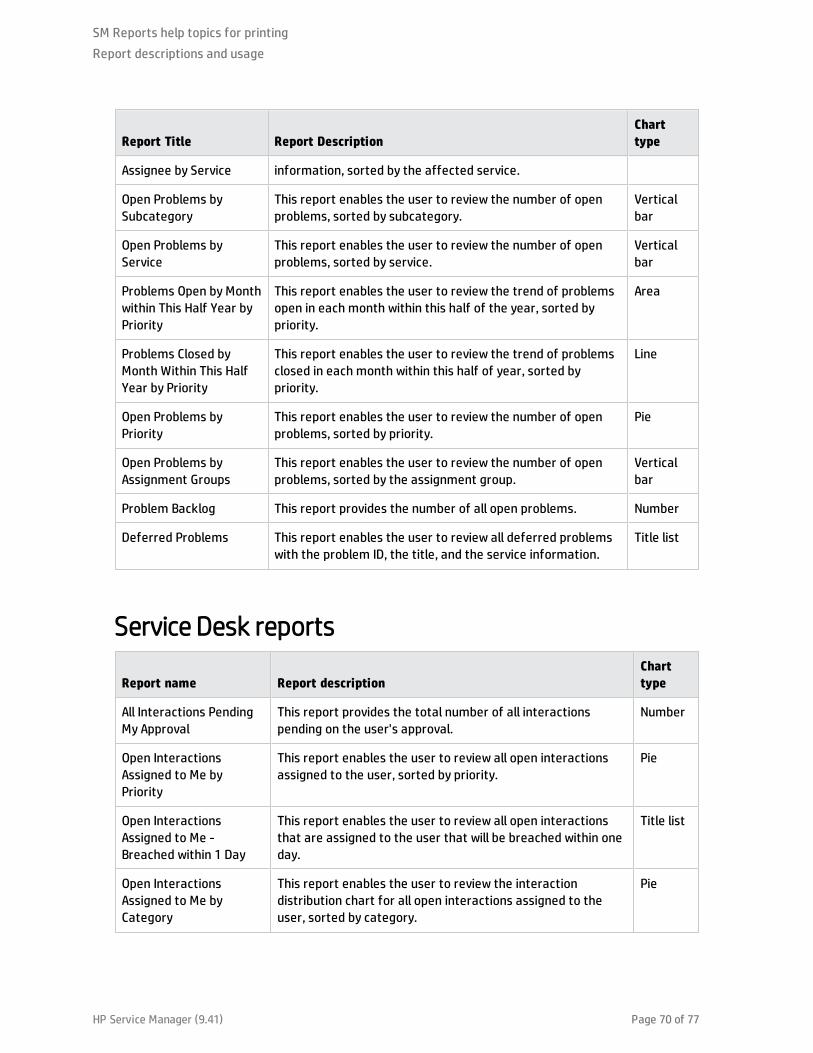
Report Title Report DescriptionChart type
Assignee by Service information, sorted by the affected service.
Open Problems by Subcategory
This report enables the user to review the number of open problems, sorted by subcategory.
Vertical bar
Open Problems by Service
This report enables the user to review the number of open problems, sorted by service.
Vertical bar
Problems Open by Month within This Half Year by Priority
This report enables the user to review the trend of problems open in each month within this half of the year, sorted by priority.
Area
Problems Closed by Month Within This Half Year by Priority
This report enables the user to review the trend of problems closed in each month within this half of year, sorted by priority.
Line
Open Problems by Priority
This report enables the user to review the number of open problems, sorted by priority.
Pie
Open Problems by Assignment Groups
This report enables the user to review the number of open problems, sorted by the assignment group.
Vertical bar
Problem Backlog This report provides the number of all open problems. Number
Deferred Problems This report enables the user to review all deferred problems with the problem ID, the title, and the service information.
Title list
Service Desk reports
Report name Report descriptionChart type
All Interactions Pending My Approval
This report provides the total number of all interactions pending on the user's approval.
Number
Open Interactions Assigned to Me by Priority
This report enables the user to review all open interactions assigned to the user, sorted by priority.
Pie
Open Interactions Assigned to Me - Breached within 1 Day
This report enables the user to review all open interactions that are assigned to the user that will be breached within one day.
Title list
Open Interactions Assigned to Me by Category
This report enables the user to review the interaction distribution chart for all open interactions assigned to the user, sorted by category.
Pie
SM Reports help topics for printing
Report descriptions and usage
HP Service Manager (9.41) Page 70 of 77
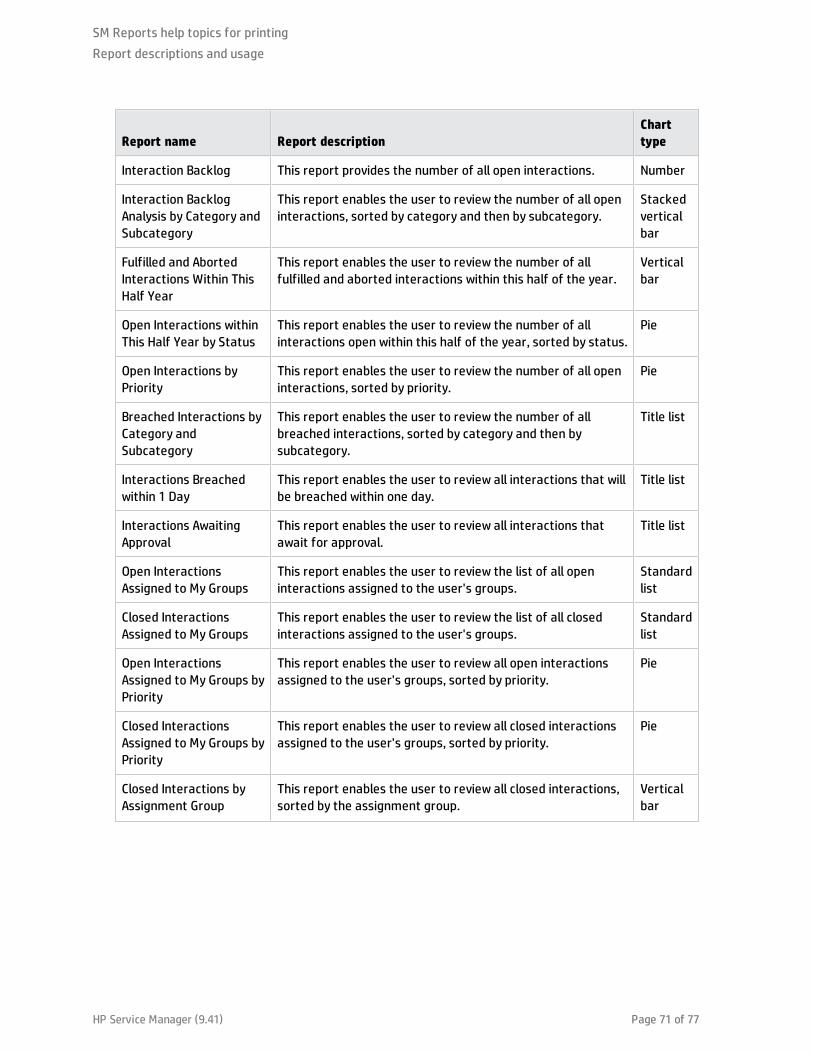
Report name Report descriptionChart type
Interaction Backlog This report provides the number of all open interactions. Number
Interaction Backlog Analysis by Category and Subcategory
This report enables the user to review the number of all open interactions, sorted by category and then by subcategory.
Stacked vertical bar
Fulfilled and Aborted Interactions Within This Half Year
This report enables the user to review the number of all fulfilled and aborted interactions within this half of the year.
Vertical bar
Open Interactions within This Half Year by Status
This report enables the user to review the number of all interactions open within this half of the year, sorted by status.
Pie
Open Interactions by Priority
This report enables the user to review the number of all open interactions, sorted by priority.
Pie
Breached Interactions by Category and Subcategory
This report enables the user to review the number of all breached interactions, sorted by category and then by subcategory.
Title list
Interactions Breached within 1 Day
This report enables the user to review all interactions that will be breached within one day.
Title list
Interactions Awaiting Approval
This report enables the user to review all interactions that await for approval.
Title list
Open Interactions Assigned to My Groups
This report enables the user to review the list of all open interactions assigned to the user's groups.
Standard list
Closed Interactions Assigned to My Groups
This report enables the user to review the list of all closed interactions assigned to the user's groups.
Standard list
Open Interactions Assigned to My Groups by Priority
This report enables the user to review all open interactions assigned to the user's groups, sorted by priority.
Pie
Closed Interactions Assigned to My Groups by Priority
This report enables the user to review all closed interactions assigned to the user's groups, sorted by priority.
Pie
Closed Interactions by Assignment Group
This report enables the user to review all closed interactions, sorted by the assignment group.
Vertical bar
SM Reports help topics for printing
Report descriptions and usage
HP Service Manager (9.41) Page 71 of 77
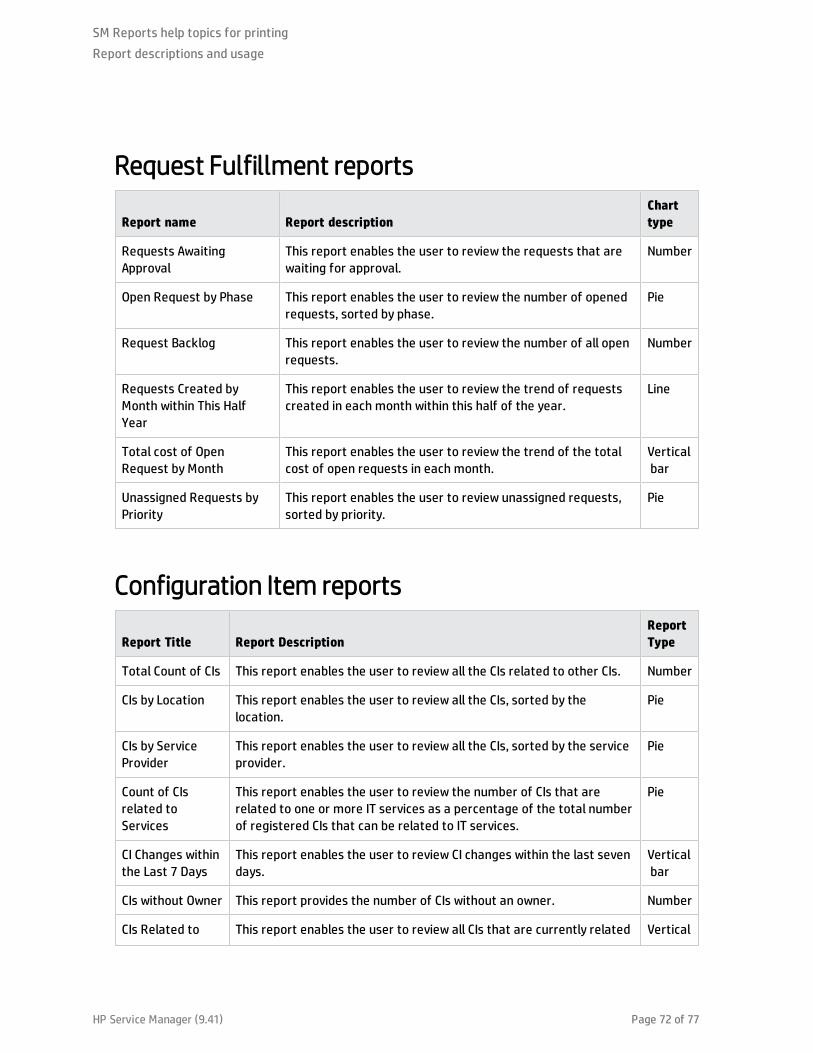
Request Fulfillment reports
Report name Report descriptionChart type
Requests Awaiting Approval
This report enables the user to review the requests that are waiting for approval.
Number
Open Request by Phase This report enables the user to review the number of opened requests, sorted by phase.
Pie
Request Backlog This report enables the user to review the number of all open requests.
Number
Requests Created by Month within This Half Year
This report enables the user to review the trend of requests created in each month within this half of the year.
Line
Total cost of Open Request by Month
This report enables the user to review the trend of the total cost of open requests in each month.
Vertical bar
Unassigned Requests by Priority
This report enables the user to review unassigned requests, sorted by priority.
Pie
Configuration Item reports
Report Title Report DescriptionReport Type
Total Count of CIs This report enables the user to review all the CIs related to other CIs. Number
CIs by Location This report enables the user to review all the CIs, sorted by the location.
Pie
CIs by Service Provider
This report enables the user to review all the CIs, sorted by the service provider.
Pie
Count of CIs related to Services
This report enables the user to review the number of CIs that are related to one or more IT services as a percentage of the total number of registered CIs that can be related to IT services.
Pie
CI Changes within the Last 7 Days
This report enables the user to review CI changes within the last seven days.
Vertical bar
CIs without Owner This report provides the number of CIs without an owner. Number
CIs Related to This report enables the user to review all CIs that are currently related Vertical
SM Reports help topics for printing
Report descriptions and usage
HP Service Manager (9.41) Page 72 of 77
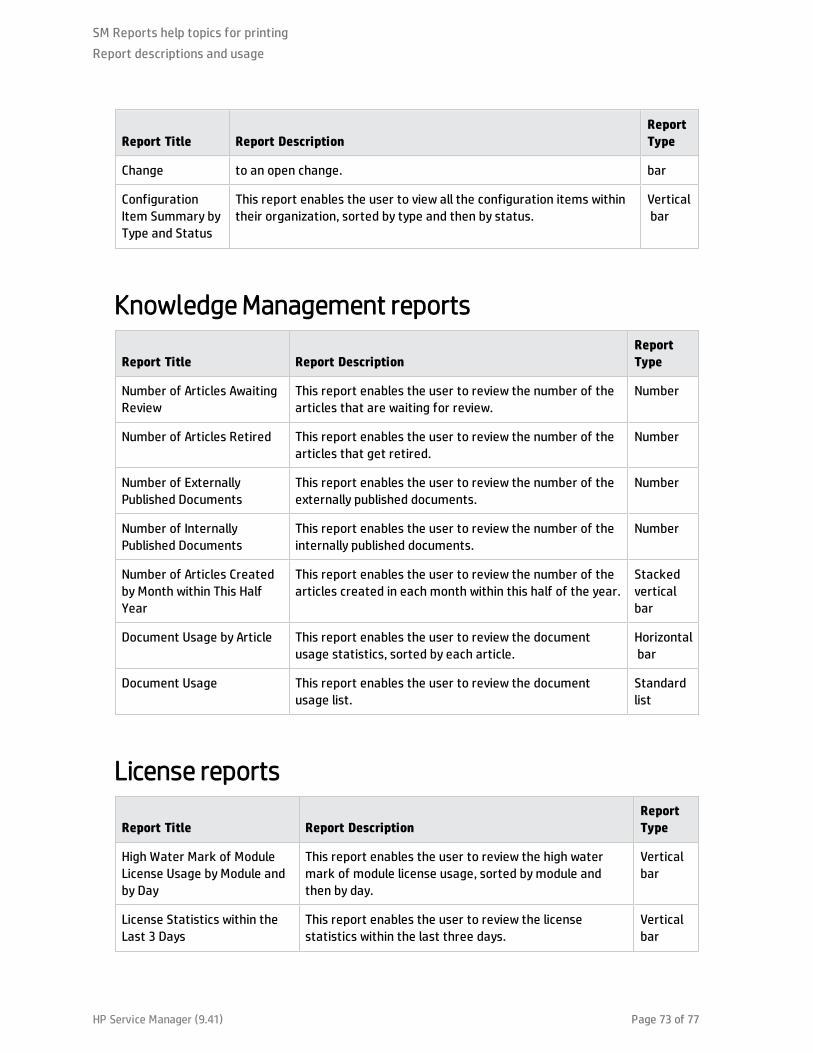
Report Title Report DescriptionReport Type
Change to an open change. bar
Configuration Item Summary by Type and Status
This report enables the user to view all the configuration items within their organization, sorted by type and then by status.
Vertical bar
Knowledge Management reports
Report Title Report DescriptionReport Type
Number of Articles Awaiting Review
This report enables the user to review the number of the articles that are waiting for review.
Number
Number of Articles Retired This report enables the user to review the number of the articles that get retired.
Number
Number of Externally Published Documents
This report enables the user to review the number of the externally published documents.
Number
Number of Internally Published Documents
This report enables the user to review the number of the internally published documents.
Number
Number of Articles Created by Month within This Half Year
This report enables the user to review the number of the articles created in each month within this half of the year.
Stacked vertical bar
Document Usage by Article This report enables the user to review the document usage statistics, sorted by each article.
Horizontal bar
Document Usage This report enables the user to review the document usage list.
Standard list
License reports
Report Title Report DescriptionReport Type
High Water Mark of Module License Usage by Module and by Day
This report enables the user to review the high water mark of module license usage, sorted by module and then by day.
Vertical bar
License Statistics within the Last 3 Days
This report enables the user to review the license statistics within the last three days.
Vertical bar
SM Reports help topics for printing
Report descriptions and usage
HP Service Manager (9.41) Page 73 of 77
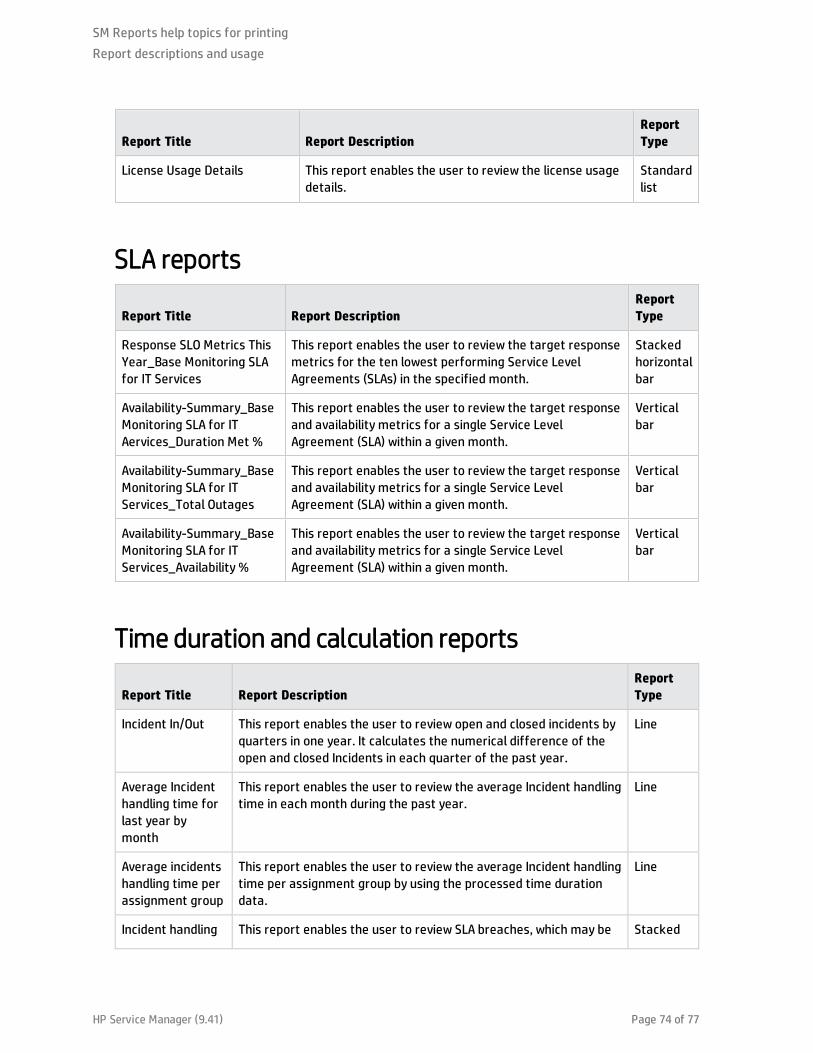
Report Title Report DescriptionReport Type
License Usage Details This report enables the user to review the license usage details.
Standard list
SLA reports
Report Title Report DescriptionReport Type
Response SLO Metrics This Year_Base Monitoring SLA for IT Services
This report enables the user to review the target response metrics for the ten lowest performing Service Level Agreements (SLAs) in the specified month.
Stacked horizontal bar
Availability-Summary_Base Monitoring SLA for IT Aervices_Duration Met %
This report enables the user to review the target response and availability metrics for a single Service Level Agreement (SLA) within a given month.
Vertical bar
Availability-Summary_Base Monitoring SLA for IT Services_Total Outages
This report enables the user to review the target response and availability metrics for a single Service Level Agreement (SLA) within a given month.
Vertical bar
Availability-Summary_Base Monitoring SLA for IT Services_Availability %
This report enables the user to review the target response and availability metrics for a single Service Level Agreement (SLA) within a given month.
Vertical bar
Time duration and calculation reports
Report Title Report DescriptionReport Type
Incident In/Out This report enables the user to review open and closed incidents by quarters in one year. It calculates the numerical difference of the open and closed Incidents in each quarter of the past year.
Line
Average Incident handling time for last year by month
This report enables the user to review the average Incident handling time in each month during the past year.
Line
Average incidents handling time per assignment group
This report enables the user to review the average Incident handling time per assignment group by using the processed time duration data.
Line
Incident handling This report enables the user to review SLA breaches, which may be Stacked
SM Reports help topics for printing
Report descriptions and usage
HP Service Manager (9.41) Page 74 of 77
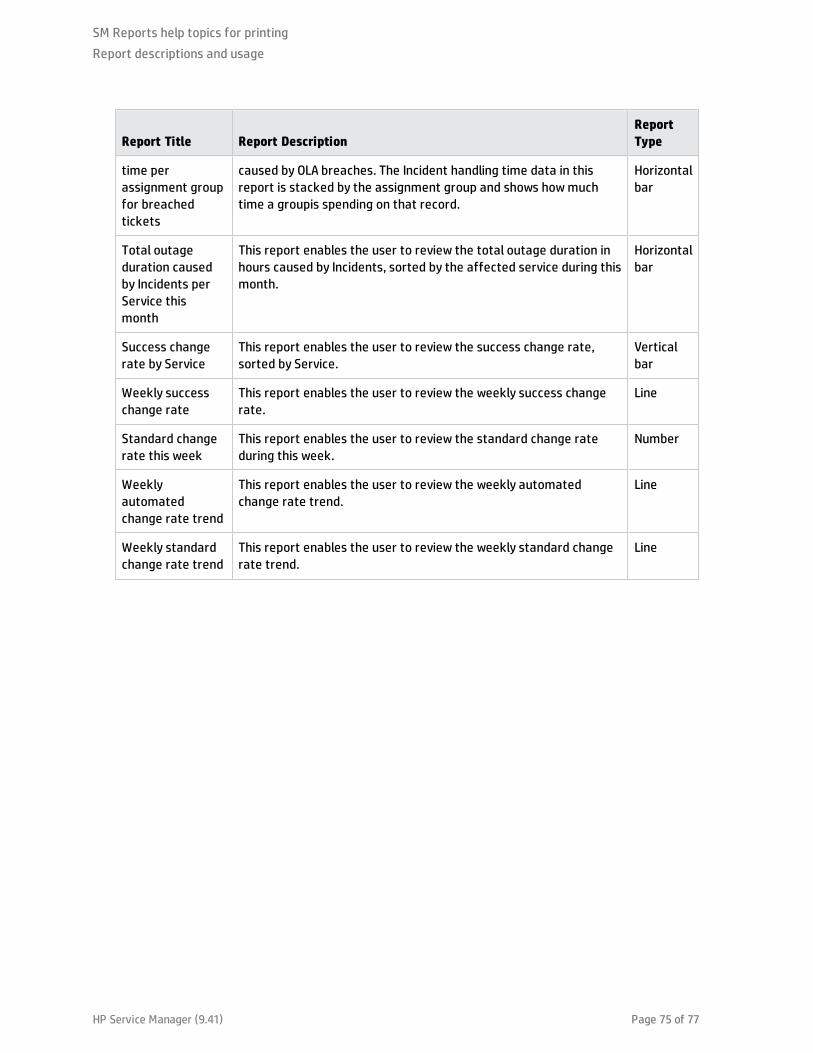
Report Title Report DescriptionReport Type
time per assignment group for breached tickets
caused by OLA breaches. The Incident handling time data in this report is stacked by the assignment group and shows how much time a groupis spending on that record.
Horizontal bar
Total outage duration caused by Incidents per Service this month
This report enables the user to review the total outage duration in hours caused by Incidents, sorted by the affected service during this month.
Horizontal bar
Success change rate by Service
This report enables the user to review the success change rate, sorted by Service.
Vertical bar
Weekly success change rate
This report enables the user to review the weekly success change rate.
Line
Standard change rate this week
This report enables the user to review the standard change rate during this week.
Number
Weekly automated change rate trend
This report enables the user to review the weekly automated change rate trend.
Line
Weekly standard change rate trend
This report enables the user to review the weekly standard change rate trend.
Line
SM Reports help topics for printing
Report descriptions and usage
HP Service Manager (9.41) Page 75 of 77
Send Documentation FeedbackIf you have comments about this document, you can contact the documentation team by email. If an
email client is configured on this system, click the link above and an email window opens with the
following information in the subject line:
Feedback on SM Reports help topics for printing (Service Manager 9.41)
Just add your feedback to the email and click send.
If no email client is available, copy the information above to a new message in a web mail client, and
send your feedback to [email protected].
We appreciate your feedback!
HP Service Manager (9.41) Page 76 of 77