
How Corning Kennebunk Uses PI System Tools to ... - · PDF file© 2014 Corning...
21
© 2014 Corning Incorporated. All Rights Reserved Presented by How Corning Kennebunk Uses PI System Tools to Make Better Use of Data Ryan Dube IT Analyst/PI Admin, Corning Life Sciences
Transcript of How Corning Kennebunk Uses PI System Tools to ... - · PDF file© 2014 Corning...
© 2014 Cor n i ng Inc o r po r a ted .
Al l R i gh t s Res e r ved
Presented by
How Corning Kennebunk
Uses PI System Tools to
Make Better Use of Data
Ryan Dube
IT Analyst/PI Admin, Corning Life Sciences
© 2014 Cor n i ng Inc o r po r a ted .
Al l R i gh t s Res e r ved 2
The Importance of Data
“It is a capital mistake to theorize before one has data.”
- Sherlock Holmes
• My Background
– 13 Years in machine automation
– Data visualization and HMI Displays (GE Proficy)
– Career Change and Corning’s Use of OSIsoft PI System
© 2014 Cor n i ng Inc o r po r a ted .
Al l R i gh t s Res e r ved 3
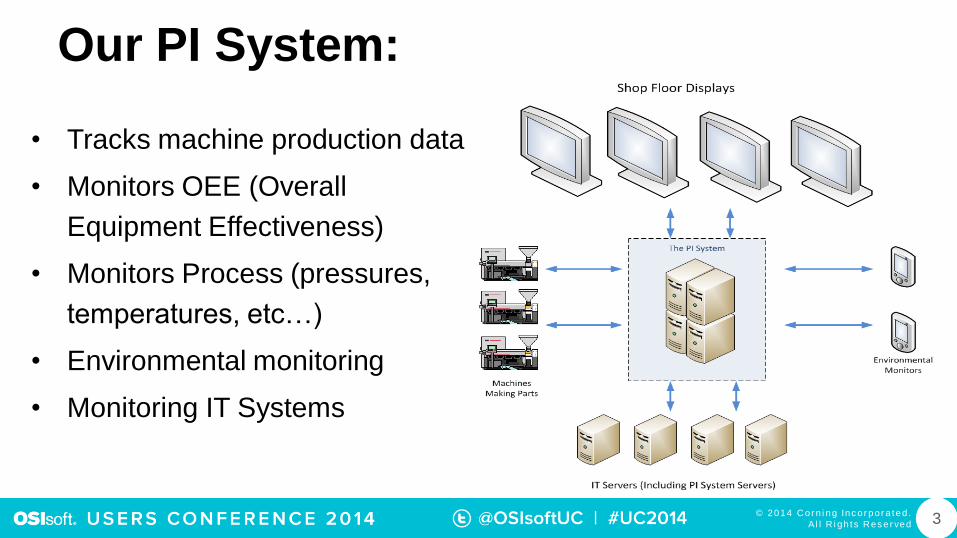
Our PI System:
• Tracks machine production data
• Monitors OEE (Overall
Equipment Effectiveness)
• Monitors Process (pressures,
temperatures, etc…)
• Environmental monitoring
• Monitoring IT Systems
© 2014 Cor n i ng Inc o r po r a ted .
Al l R i gh t s Res e r ved 4
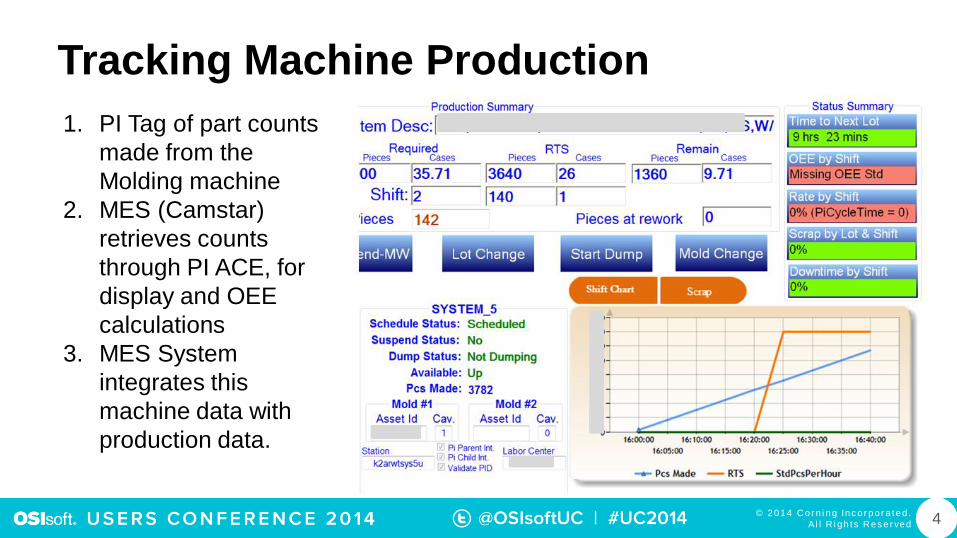
Tracking Machine Production
1. PI Tag of part counts
made from the
Molding machine
2. MES (Camstar)
retrieves counts
through PI ACE, for
display and OEE
calculations
3. MES System
integrates this
machine data with
production data.
© 2014 Cor n i ng Inc o r po r a ted .
Al l R i gh t s Res e r ved 5
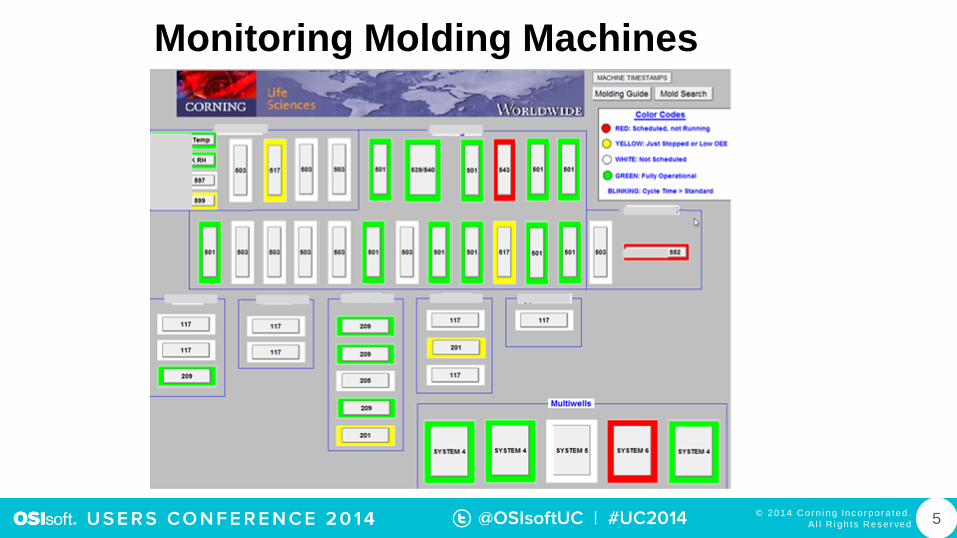
Monitoring Molding Machines
© 2014 Cor n i ng Inc o r po r a ted .
Al l R i gh t s Res e r ved 6
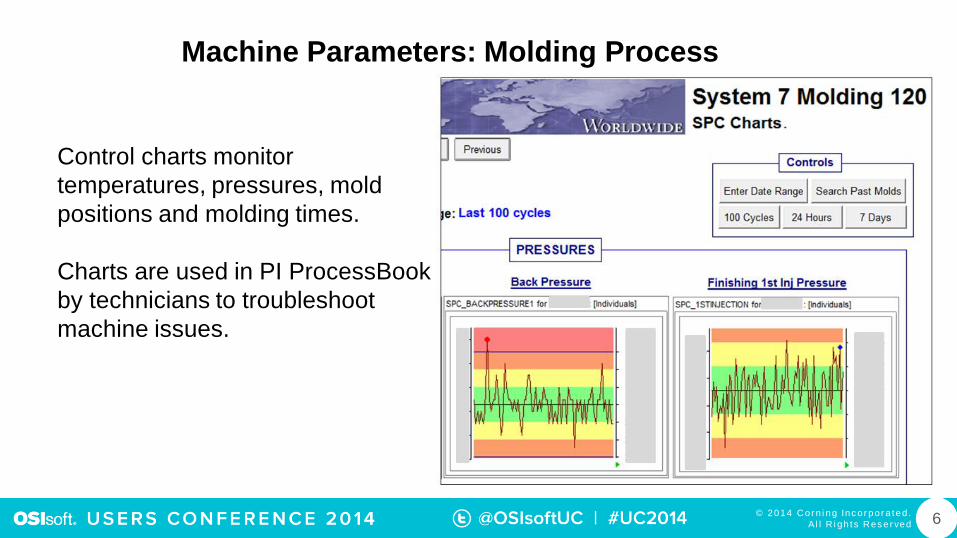
Machine Parameters: Molding Process
Control charts monitor
temperatures, pressures, mold
positions and molding times.
Charts are used in PI ProcessBook
by technicians to troubleshoot
machine issues.

© 2014 Cor n i ng Inc o r po r a ted .
Al l R i gh t s Res e r ved 7
Monitoring OEE – SQC Charts
We are starting to use
SQC Charts extensively at
Kennebunk.
PI SQC tools provide us:
• Real-time monitoring
• Alarm Displays
• Email Notifications
• Predictive Analysis

© 2014 Cor n i ng Inc o r po r a ted .
Al l R i gh t s Res e r ved 8
Monitoring OEE for Machines
© 2014 Cor n i ng Inc o r po r a ted .
Al l R i gh t s Res e r ved 9
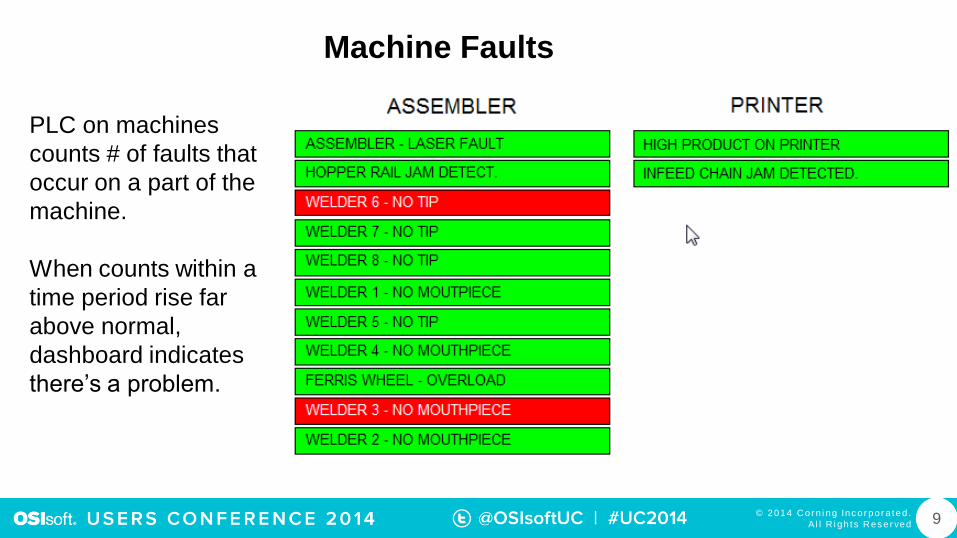
Machine Faults
PLC on machines
counts # of faults that
occur on a part of the
machine.
When counts within a
time period rise far
above normal,
dashboard indicates
there’s a problem.
© 2014 Cor n i ng Inc o r po r a ted .
Al l R i gh t s Res e r ved 10
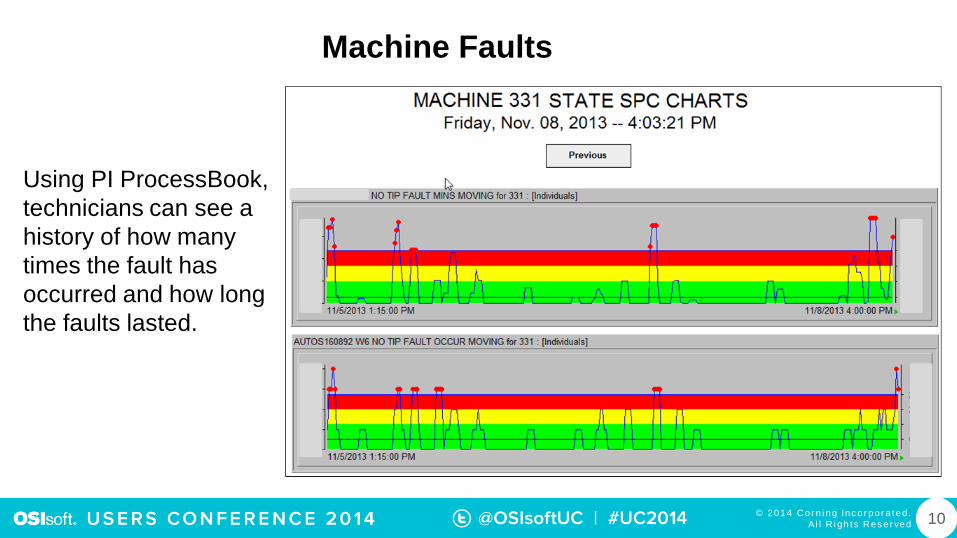
Machine Faults
Using PI ProcessBook,
technicians can see a
history of how many
times the fault has
occurred and how long
the faults lasted.

© 2014 Cor n i ng Inc o r po r a ted .
Al l R i gh t s Res e r ved 11
Monitoring OEE – SQC Charts
© 2014 Cor n i ng Inc o r po r a ted .
Al l R i gh t s Res e r ved 12
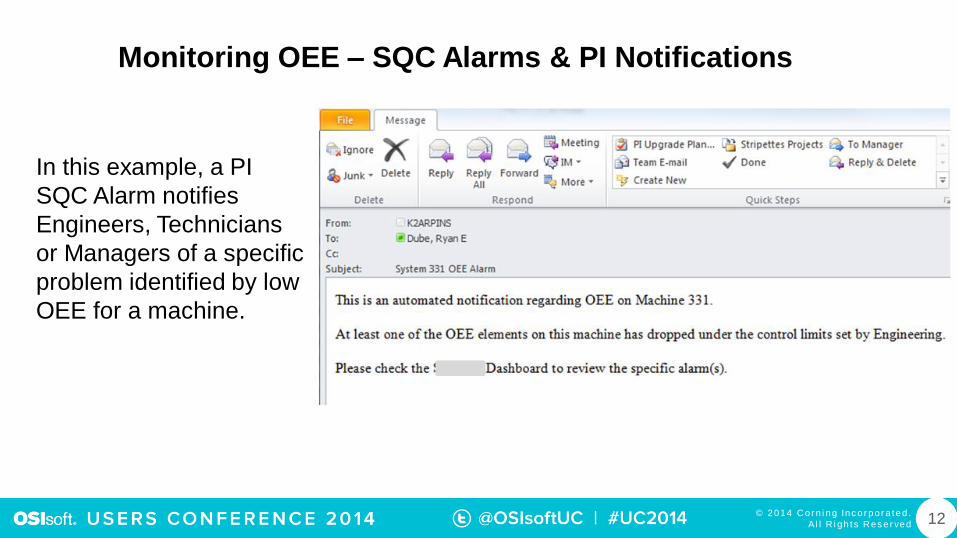
Monitoring OEE – SQC Alarms & PI Notifications
In this example, a PI
SQC Alarm notifies
Engineers, Technicians
or Managers of a specific
problem identified by low
OEE for a machine.
© 2014 Cor n i ng Inc o r po r a ted .
Al l R i gh t s Res e r ved 13
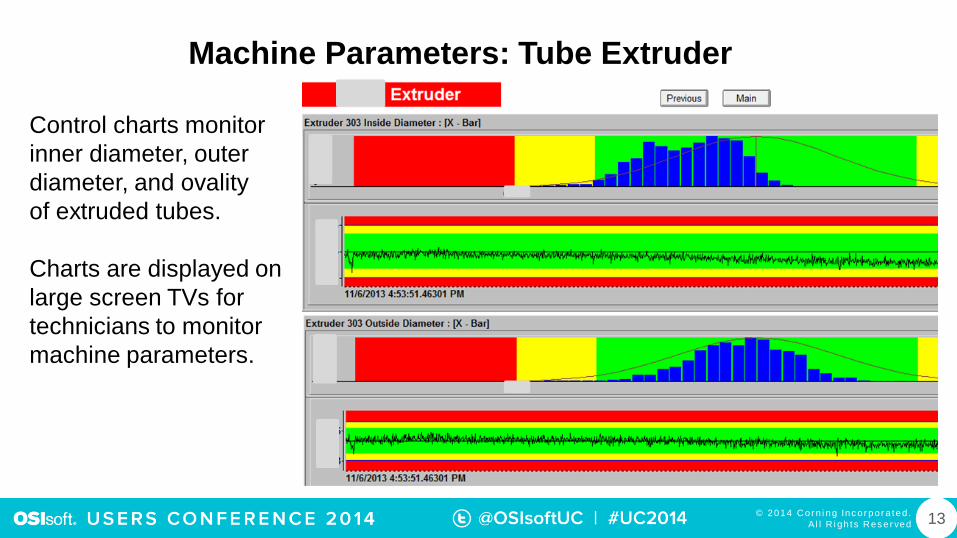
Machine Parameters: Tube Extruder
Control charts monitor
inner diameter, outer
diameter, and ovality
of extruded tubes.
Charts are displayed on
large screen TVs for
technicians to monitor
machine parameters.
© 2014 Cor n i ng Inc o r po r a ted .
Al l R i gh t s Res e r ved 14
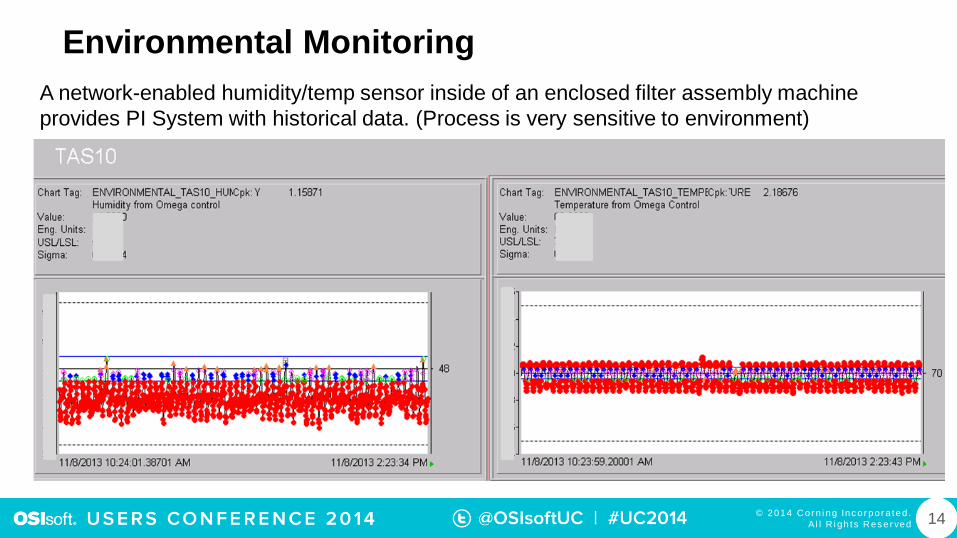
Environmental Monitoring
A network-enabled humidity/temp sensor inside of an enclosed filter assembly machine
provides PI System with historical data. (Process is very sensitive to environment)
© 2014 Cor n i ng Inc o r po r a ted .
Al l R i gh t s Res e r ved 15
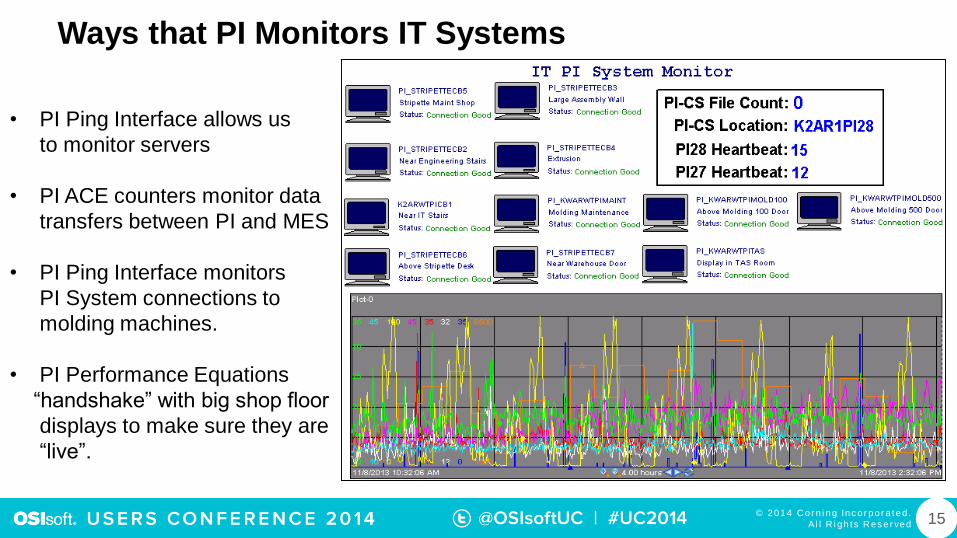
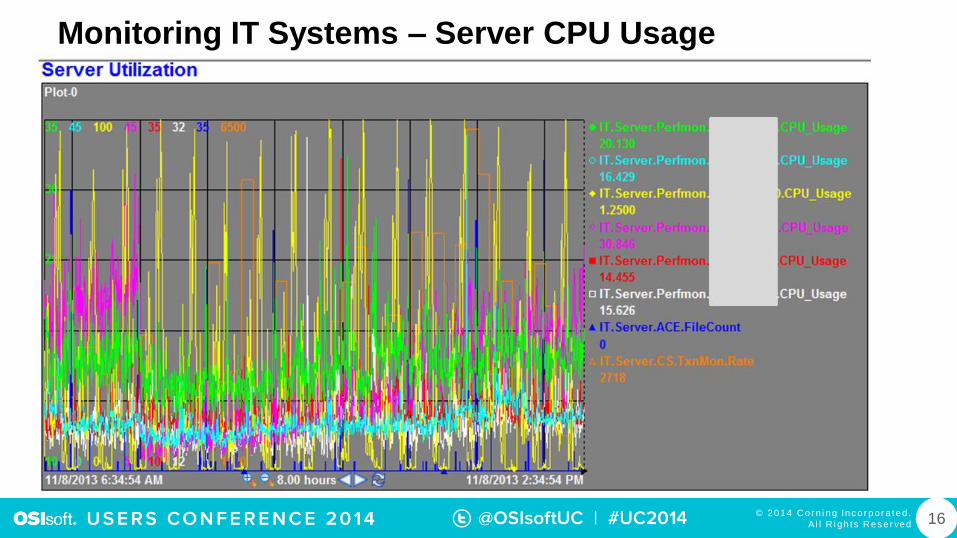
Ways that PI Monitors IT Systems
• PI Ping Interface allows us
to monitor servers
• PI ACE counters monitor data
transfers between PI and MES
• PI Ping Interface monitors
PI System connections to
molding machines.
• PI Performance Equations
“handshake” with big shop floor
displays to make sure they are
“live”.
© 2014 Cor n i ng Inc o r po r a ted .
Al l R i gh t s Res e r ved 16
Monitoring IT Systems – Server CPU Usage
© 2014 Cor n i ng Inc o r po r a ted .
Al l R i gh t s Res e r ved 17
Measurable Results From Using the PI System
• PI Notifications have allowed IT to respond faster to
potential problems, reducing (or avoiding) production
downtime.
• PI SQC Charts provide technicians with tools they
need to find and fix problems faster, improving
machine efficiency and reducing average machine
downtime for process related issues by 10%.
• PI ProcessBook display screens in the factory have
increased awareness of OEE, and made operators
and technicians feel more accountable for machine
performance – increasing in-process rejects by 5%
(operators are noticing more problems).

© 2014 Cor n i ng Inc o r po r a ted .
Al l R i gh t s Res e r ved 18
The Future at Corning - Kennebunk, Maine
• Use PI SQC Alarms to predict problems before they
occur.
• Use PI SQC and PI Notifications to deliver critical
production data to Engineers in ‘real-time’.
• Use PI Coresight to make data more accessible to
engineers and technicians.
• Use PI System to:
– Collect and analyze factory power consumption data.
– Better integrate Quality Controls with Production.
– Use PI System data to make better business decisions
based on production capacity history and predictions.
– Use PI System to identify and resolve production
bottlenecks.
We have very aggressive and bold goals to utilize the PI System in innovative ways.
© 2014 Cor n i ng Inc o r po r a ted .
Al l R i gh t s Res e r ved 19
Ryan Dube
• IT Analyst / PI System Admin
• Corning Life Sciences

© 2014 Cor n i ng Inc o r po r a ted .
Al l R i gh t s Res e r ved
Thank
You

© 2014 Cor n i ng Inc o r po r a ted .
Al l R i gh t s Res e r ved
Brought to you by