Owens Corning
31
CFA Institute Research Challenge Hosted by Local Challenge CFA Societies of Dayton, Cincinnati and Columbus The Ohio State University
-
Upload
john-stover -
Category
Documents
-
view
180 -
download
2
Transcript of Owens Corning

CFA Institute Research Challenge
Hosted by Local Challenge CFA Societies of Dayton, Cincinnati and Columbus
The Ohio State University
January 18, 2016 CFA Research Challenge
1 | P a g e
OWENS CORNING (NYSE: OC)
Essentials Positioned for Growth Through a Strong Strategic Global Presence
Restructuring and Cost Cutting are major keys to future success.
OC went through an organizational restructuring in 2015, separating its Building Materials segment into Roofing and Insulation, resulting in a 1.35% decrease in COGS. These savings are expected to be maintained going forward. The firm has also shuttered inefficient composites plants in Japan and China, lowering operating leverage and boosting profitability. EBIT margins grew 1.57% (7.9% to 9.5%) in the last twelve months and we forecast a peak at 11.7% in 2017.
Initiate OC with a BUY Rating and a Target Price of $50.48. Our target price is based off a five-year Sum of Parts (SOP) DCF, Pro-forma Financial Statement DCF, and Relative Valuation; because of OC’s diverse segments and areas of operations. Given the spread of its products and operations, we see OC well positioned to capitalize on its economies of scale with industry demand, and is currently undervalued by 18.61%.
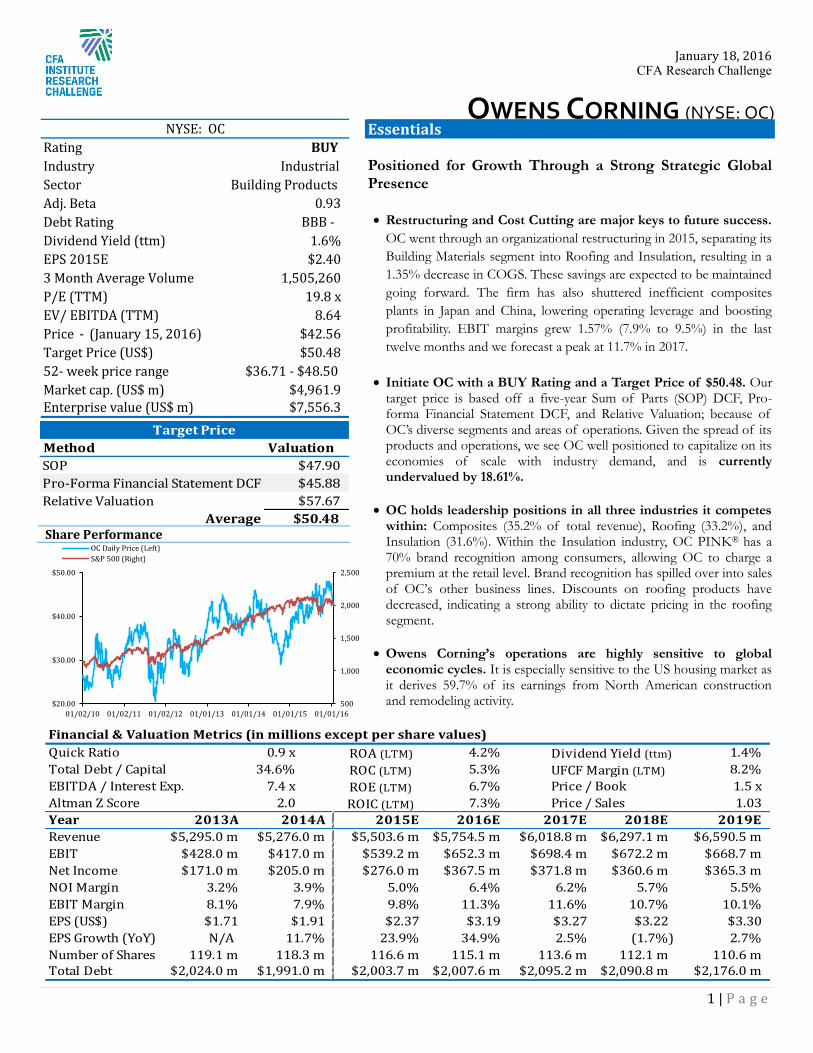
OC holds leadership positions in all three industries it competes within: Composites (35.2% of total revenue), Roofing (33.2%), and Insulation (31.6%). Within the Insulation industry, OC PINK® has a 70% brand recognition among consumers, allowing OC to charge a premium at the retail level. Brand recognition has spilled over into sales of OC’s other business lines. Discounts on roofing products have decreased, indicating a strong ability to dictate pricing in the roofing segment.
Owens Corning’s operations are highly sensitive to global economic cycles. It is especially sensitive to the US housing market as it derives 59.7% of its earnings from North American construction and remodeling activity.
Share Performance
500
1,000
1,500
2,000
2,500
$20.00
$30.00
$40.00
$50.00
01/02/10 01/02/11 01/02/12 01/01/13 01/01/14 01/01/15 01/01/16
OC Daily Price (Left)S&P 500 (Right)
Financial & Valuation Metrics (in millions except per share values)Quick Ratio 0.9 x ROA (LTM) 4.2% Dividend Yield (ttm) 1.4% Total Debt / Capital 34.6% ROC (LTM) 5.3% UFCF Margin (LTM) 8.2% EBITDA / Interest Exp. 7.4 x ROE (LTM) 6.7% Price / Book 1.5 xAltman Z Score 2.0 ROIC (LTM) 7.3% Price / Sales 1.03Year 2013A 2014A 2015E 2016E 2017E 2018E 2019ERevenue $5,295.0 m $5,276.0 m $5,503.6 m $5,754.5 m $6,018.8 m $6,297.1 m $6,590.5 mEBIT $428.0 m $417.0 m $539.2 m $652.3 m $698.4 m $672.2 m $668.7 mNet Income $171.0 m $205.0 m $276.0 m $367.5 m $371.8 m $360.6 m $365.3 mNOI Margin 3.2% 3.9% 5.0% 6.4% 6.2% 5.7% 5.5%EBIT Margin 8.1% 7.9% 9.8% 11.3% 11.6% 10.7% 10.1%EPS (US$) $1.71 $1.91 $2.37 $3.19 $3.27 $3.22 $3.30EPS Growth (YoY) N/A 11.7% 23.9% 34.9% 2.5% (1.7%) 2.7%Number of Shares 119.1 m 118.3 m 116.6 m 115.1 m 113.6 m 112.1 m 110.6 mTotal Debt $2,024.0 m $1,991.0 m $2,003.7 m $2,007.6 m $2,095.2 m $2,090.8 m $2,176.0 m
Rating BUYIndustrySectorAdj. Beta 0.93Debt Rating BBB -Dividend Yield (ttm) 1.6% EPS 2015E $2.403 Month Average VolumeP/E (TTM) 19.8 xEV/ EBITDA (TTM) 8.64Price - (January 15, 2016) $42.56Target Price (US$) $50.4852- week price rangeMarket cap. (US$ m) $4,961.9Enterprise value (US$ m) $7,556.3
Building Products
NYSE: OC
Industrial
1,505,260
$36.71 - $48.50
Method ValuationSOP $47.90Pro-Forma Financial Statement DCF $45.88Relative Valuation $57.67
Average $50.48
Target Price
January 18, 2016 CFA Research Challenge
2 | P a g e
BUSINESS SUMMARY
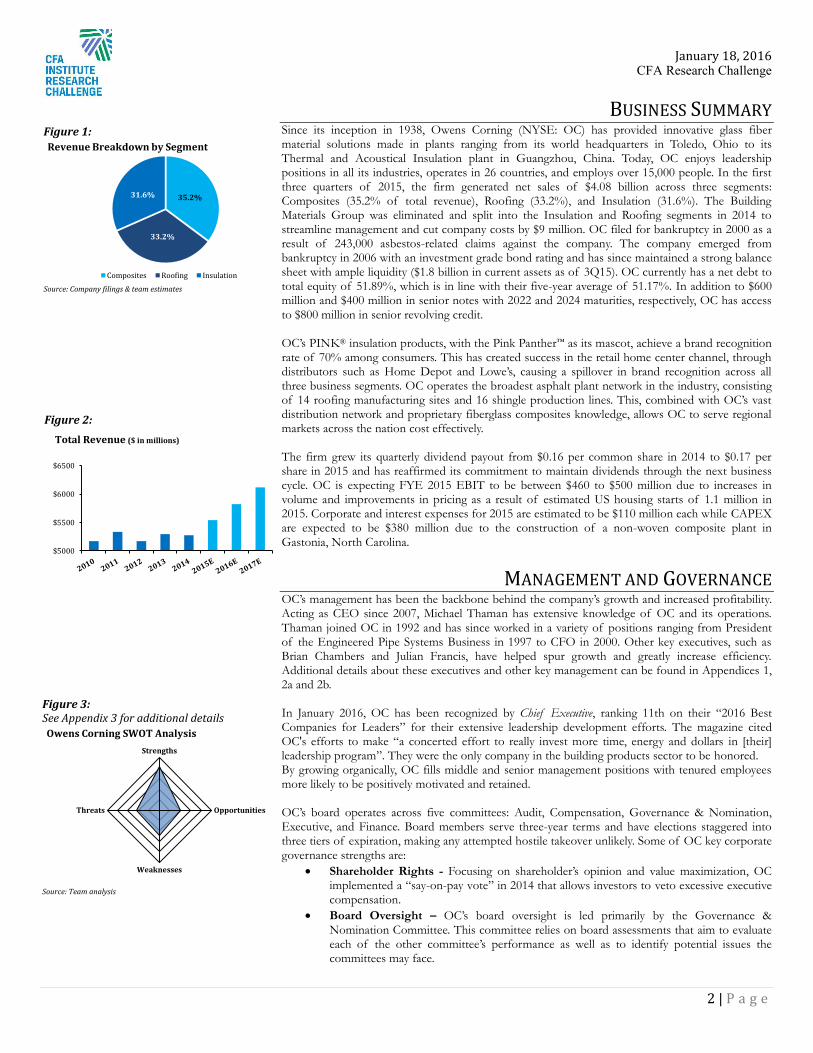
Since its inception in 1938, Owens Corning (NYSE: OC) has provided innovative glass fiber material solutions made in plants ranging from its world headquarters in Toledo, Ohio to its Thermal and Acoustical Insulation plant in Guangzhou, China. Today, OC enjoys leadership positions in all its industries, operates in 26 countries, and employs over 15,000 people. In the first three quarters of 2015, the firm generated net sales of $4.08 billion across three segments: Composites (35.2% of total revenue), Roofing (33.2%), and Insulation (31.6%). The Building Materials Group was eliminated and split into the Insulation and Roofing segments in 2014 to streamline management and cut company costs by $9 million. OC filed for bankruptcy in 2000 as a result of 243,000 asbestos-related claims against the company. The company emerged from bankruptcy in 2006 with an investment grade bond rating and has since maintained a strong balance sheet with ample liquidity ($1.8 billion in current assets as of 3Q15). OC currently has a net debt to total equity of 51.89%, which is in line with their five-year average of 51.17%. In addition to $600 million and $400 million in senior notes with 2022 and 2024 maturities, respectively, OC has access to $800 million in senior revolving credit. OC’s PINK® insulation products, with the Pink Panther™ as its mascot, achieve a brand recognition rate of 70% among consumers. This has created success in the retail home center channel, through distributors such as Home Depot and Lowe’s, causing a spillover in brand recognition across all three business segments. OC operates the broadest asphalt plant network in the industry, consisting of 14 roofing manufacturing sites and 16 shingle production lines. This, combined with OC’s vast distribution network and proprietary fiberglass composites knowledge, allows OC to serve regional markets across the nation cost effectively. The firm grew its quarterly dividend payout from $0.16 per common share in 2014 to $0.17 per share in 2015 and has reaffirmed its commitment to maintain dividends through the next business cycle. OC is expecting FYE 2015 EBIT to be between $460 to $500 million due to increases in volume and improvements in pricing as a result of estimated US housing starts of 1.1 million in 2015. Corporate and interest expenses for 2015 are estimated to be $110 million each while CAPEX are expected to be $380 million due to the construction of a non-woven composite plant in Gastonia, North Carolina.
MANAGEMENT AND GOVERNANCE OC’s management has been the backbone behind the company’s growth and increased profitability. Acting as CEO since 2007, Michael Thaman has extensive knowledge of OC and its operations. Thaman joined OC in 1992 and has since worked in a variety of positions ranging from President of the Engineered Pipe Systems Business in 1997 to CFO in 2000. Other key executives, such as Brian Chambers and Julian Francis, have helped spur growth and greatly increase efficiency. Additional details about these executives and other key management can be found in Appendices 1, 2a and 2b. In January 2016, OC has been recognized by Chief Executive, ranking 11th on their “2016 Best Companies for Leaders” for their extensive leadership development efforts. The magazine cited OC's efforts to make “a concerted effort to really invest more time, energy and dollars in [their] leadership program”. They were the only company in the building products sector to be honored. By growing organically, OC fills middle and senior management positions with tenured employees more likely to be positively motivated and retained. OC’s board operates across five committees: Audit, Compensation, Governance & Nomination, Executive, and Finance. Board members serve three-year terms and have elections staggered into three tiers of expiration, making any attempted hostile takeover unlikely. Some of OC key corporate governance strengths are:
Shareholder Rights - Focusing on shareholder’s opinion and value maximization, OC implemented a “say-on-pay vote” in 2014 that allows investors to veto excessive executive compensation.
Board Oversight – OC’s board oversight is led primarily by the Governance & Nomination Committee. This committee relies on board assessments that aim to evaluate each of the other committee’s performance as well as to identify potential issues the committees may face.
Figure 1:
Source: Company filings & team estimates
35.2%
33.2%
31.6%
Revenue Breakdown by Segment
Composites Roofing Insulation
Figure 2:
Source: Company filings & team estimates
$5000
$5500
$6000
$6500
Total Revenue ($ in millions)
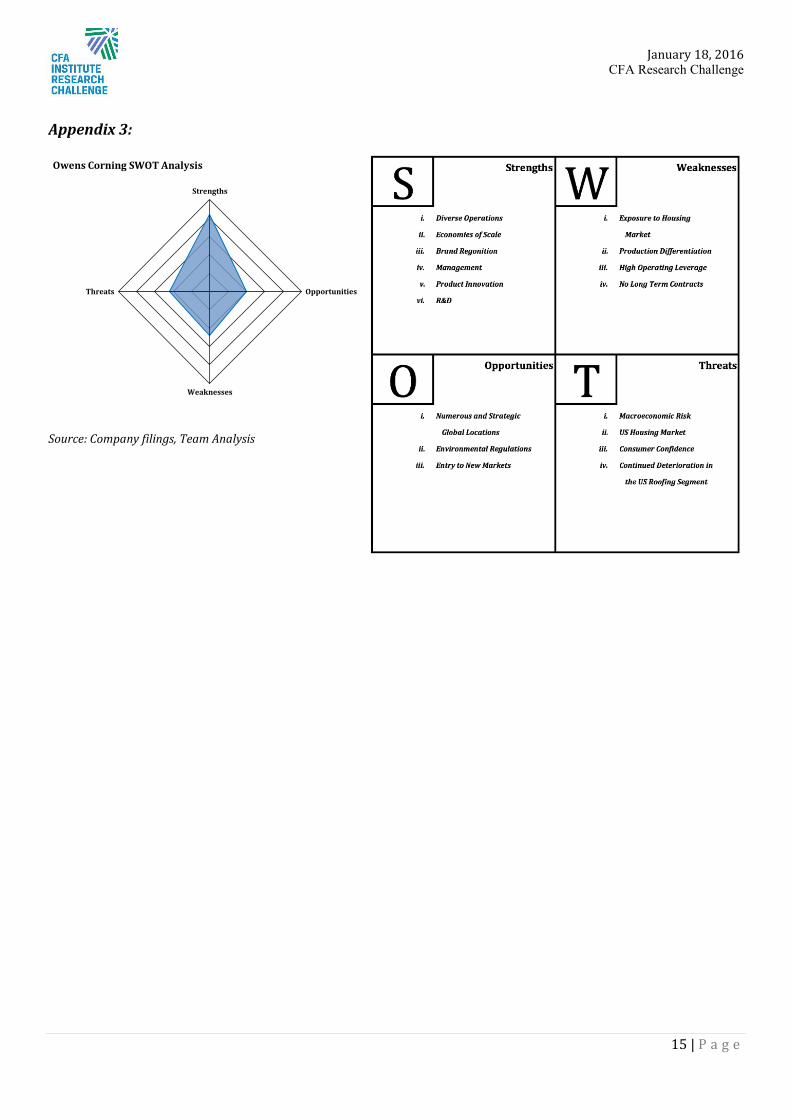
Figure 3: See Appendix 3 for additional details
Source: Team analysis
Strengths
Opportunities
Weaknesses
Threats
Owens Corning SWOT Analysis
January 18, 2016 CFA Research Challenge
3 | P a g e
Board Composition - According to EY, the average level of independence among mid-cap boards was 80%. This means the OC board, at 92%, is more independent than the average mid-cap board.
Executive Compensation - OC utilizes Meyer & Partners compensation consultants to assist in setting executive compensation. As a result, 84% of CEO and 73% of NEO compensation is linked to a performance target.
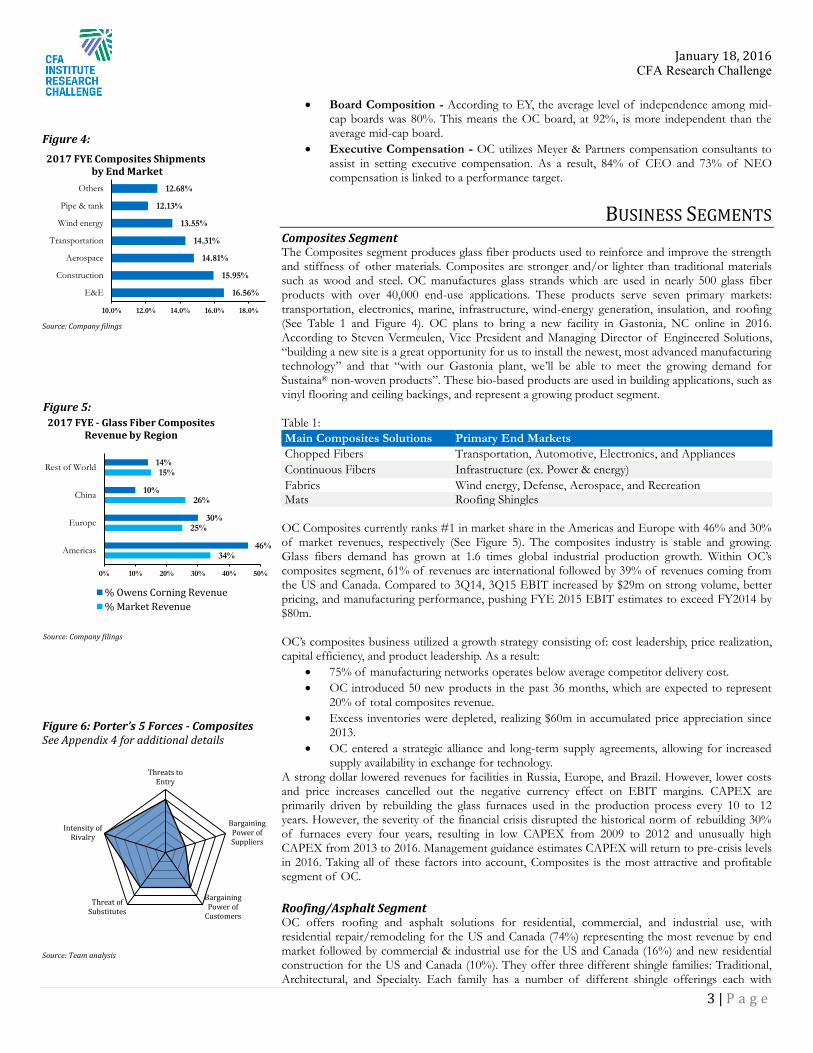
BUSINESS SEGMENTS Composites Segment The Composites segment produces glass fiber products used to reinforce and improve the strength and stiffness of other materials. Composites are stronger and/or lighter than traditional materials such as wood and steel. OC manufactures glass strands which are used in nearly 500 glass fiber products with over 40,000 end-use applications. These products serve seven primary markets: transportation, electronics, marine, infrastructure, wind-energy generation, insulation, and roofing (See Table 1 and Figure 4). OC plans to bring a new facility in Gastonia, NC online in 2016. According to Steven Vermeulen, Vice President and Managing Director of Engineered Solutions, “building a new site is a great opportunity for us to install the newest, most advanced manufacturing technology” and that “with our Gastonia plant, we’ll be able to meet the growing demand for Sustaina® non-woven products”. These bio-based products are used in building applications, such as vinyl flooring and ceiling backings, and represent a growing product segment. Table 1: Main Composites Solutions Primary End Markets Chopped Fibers Transportation, Automotive, Electronics, and Appliances Continuous Fibers Infrastructure (ex. Power & energy) Fabrics Wind energy, Defense, Aerospace, and Recreation Mats Roofing Shingles OC Composites currently ranks #1 in market share in the Americas and Europe with 46% and 30% of market revenues, respectively (See Figure 5). The composites industry is stable and growing. Glass fibers demand has grown at 1.6 times global industrial production growth. Within OC’s composites segment, 61% of revenues are international followed by 39% of revenues coming from the US and Canada. Compared to 3Q14, 3Q15 EBIT increased by $29m on strong volume, better pricing, and manufacturing performance, pushing FYE 2015 EBIT estimates to exceed FY2014 by $80m. OC’s composites business utilized a growth strategy consisting of: cost leadership, price realization, capital efficiency, and product leadership. As a result:
75% of manufacturing networks operates below average competitor delivery cost. OC introduced 50 new products in the past 36 months, which are expected to represent
20% of total composites revenue. Excess inventories were depleted, realizing $60m in accumulated price appreciation since
2013. OC entered a strategic alliance and long-term supply agreements, allowing for increased
supply availability in exchange for technology. A strong dollar lowered revenues for facilities in Russia, Europe, and Brazil. However, lower costs and price increases cancelled out the negative currency effect on EBIT margins. CAPEX are primarily driven by rebuilding the glass furnaces used in the production process every 10 to 12 years. However, the severity of the financial crisis disrupted the historical norm of rebuilding 30% of furnaces every four years, resulting in low CAPEX from 2009 to 2012 and unusually high CAPEX from 2013 to 2016. Management guidance estimates CAPEX will return to pre-crisis levels in 2016. Taking all of these factors into account, Composites is the most attractive and profitable segment of OC. Roofing/Asphalt Segment OC offers roofing and asphalt solutions for residential, commercial, and industrial use, with residential repair/remodeling for the US and Canada (74%) representing the most revenue by end market followed by commercial & industrial use for the US and Canada (16%) and new residential construction for the US and Canada (10%). They offer three different shingle families: Traditional, Architectural, and Specialty. Each family has a number of different shingle offerings each with
Figure 4:
Source: Company filings
16.56%
15.95%
14.81%
14.31%
13.55%
12.13%
12.68%
E&E
Construction
Aerospace
Transportation
Wind energy
Pipe & tank
Others
10.0% 12.0% 14.0% 16.0% 18.0%
2017 FYE Composites Shipments by End Market
Figure 5:
Source: Company filings
34%
25%
26%
15%
46%
30%
10%
14%
0% 10% 20% 30% 40% 50%
Americas
Europe
China
Rest of World
2017 FYE - Glass Fiber Composites Revenue by Region
% Owens Corning Revenue% Market Revenue
Figure 6: Porter’s 5 Forces - Composites See Appendix 4 for additional details
Source: Team analysis
Threats toEntry
BargainingPower ofSuppliers
BargainingPower of
Customers
Threat ofSubstitutes
Intensity ofRivalry
January 18, 2016 CFA Research Challenge
4 | P a g e
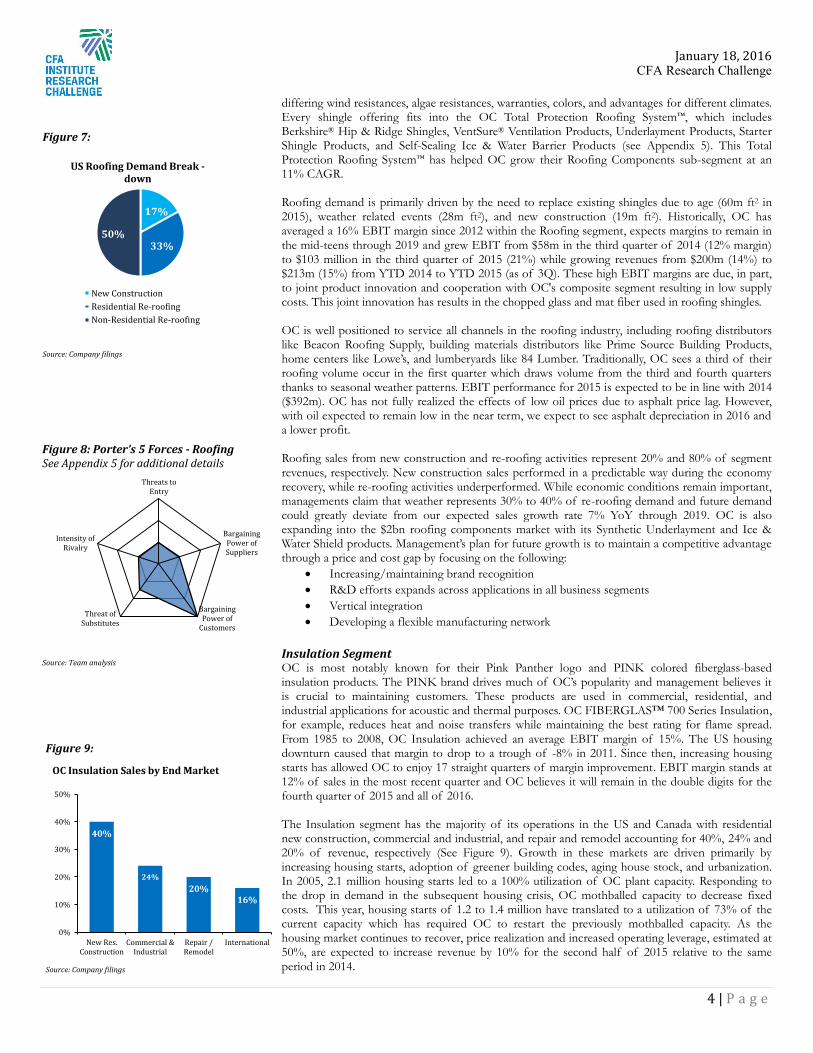
differing wind resistances, algae resistances, warranties, colors, and advantages for different climates. Every shingle offering fits into the OC Total Protection Roofing System™, which includes Berkshire® Hip & Ridge Shingles, VentSure® Ventilation Products, Underlayment Products, Starter Shingle Products, and Self-Sealing Ice & Water Barrier Products (see Appendix 5). This Total Protection Roofing System™ has helped OC grow their Roofing Components sub-segment at an 11% CAGR. Roofing demand is primarily driven by the need to replace existing shingles due to age (60m ft2 in 2015), weather related events (28m ft2), and new construction (19m ft2). Historically, OC has averaged a 16% EBIT margin since 2012 within the Roofing segment, expects margins to remain in the mid-teens through 2019 and grew EBIT from $58m in the third quarter of 2014 (12% margin) to $103 million in the third quarter of 2015 (21%) while growing revenues from $200m (14%) to $213m (15%) from YTD 2014 to YTD 2015 (as of 3Q). These high EBIT margins are due, in part, to joint product innovation and cooperation with OC's composite segment resulting in low supply costs. This joint innovation has results in the chopped glass and mat fiber used in roofing shingles. OC is well positioned to service all channels in the roofing industry, including roofing distributors like Beacon Roofing Supply, building materials distributors like Prime Source Building Products, home centers like Lowe’s, and lumberyards like 84 Lumber. Traditionally, OC sees a third of their roofing volume occur in the first quarter which draws volume from the third and fourth quarters thanks to seasonal weather patterns. EBIT performance for 2015 is expected to be in line with 2014 ($392m). OC has not fully realized the effects of low oil prices due to asphalt price lag. However, with oil expected to remain low in the near term, we expect to see asphalt depreciation in 2016 and a lower profit. Roofing sales from new construction and re-roofing activities represent 20% and 80% of segment revenues, respectively. New construction sales performed in a predictable way during the economy recovery, while re-roofing activities underperformed. While economic conditions remain important, managements claim that weather represents 30% to 40% of re-roofing demand and future demand could greatly deviate from our expected sales growth rate 7% YoY through 2019. OC is also expanding into the $2bn roofing components market with its Synthetic Underlayment and Ice & Water Shield products. Management’s plan for future growth is to maintain a competitive advantage through a price and cost gap by focusing on the following:
Increasing/maintaining brand recognition R&D efforts expands across applications in all business segments Vertical integration Developing a flexible manufacturing network
Insulation Segment OC is most notably known for their Pink Panther logo and PINK colored fiberglass-based insulation products. The PINK brand drives much of OC’s popularity and management believes it is crucial to maintaining customers. These products are used in commercial, residential, and industrial applications for acoustic and thermal purposes. OC FIBERGLAS™ 700 Series Insulation, for example, reduces heat and noise transfers while maintaining the best rating for flame spread. From 1985 to 2008, OC Insulation achieved an average EBIT margin of 15%. The US housing downturn caused that margin to drop to a trough of -8% in 2011. Since then, increasing housing starts has allowed OC to enjoy 17 straight quarters of margin improvement. EBIT margin stands at 12% of sales in the most recent quarter and OC believes it will remain in the double digits for the fourth quarter of 2015 and all of 2016. The Insulation segment has the majority of its operations in the US and Canada with residential new construction, commercial and industrial, and repair and remodel accounting for 40%, 24% and 20% of revenue, respectively (See Figure 9). Growth in these markets are driven primarily by increasing housing starts, adoption of greener building codes, aging house stock, and urbanization. In 2005, 2.1 million housing starts led to a 100% utilization of OC plant capacity. Responding to the drop in demand in the subsequent housing crisis, OC mothballed capacity to decrease fixed costs. This year, housing starts of 1.2 to 1.4 million have translated to a utilization of 73% of the current capacity which has required OC to restart the previously mothballed capacity. As the housing market continues to recover, price realization and increased operating leverage, estimated at 50%, are expected to increase revenue by 10% for the second half of 2015 relative to the same period in 2014.
Figure 7:
Source: Company filings
17%
33% 50%
US Roofing Demand Break -down
New ConstructionResidential Re-roofingNon-Residential Re-roofing
Figure 8: Porter’s 5 Forces - Roofing See Appendix 5 for additional details
Source: Team analysis
Threats toEntry
BargainingPower ofSuppliers
BargainingPower of
Customers
Threat ofSubstitutes
Intensity ofRivalry
Figure 9:
Source: Company filings
40%
24% 20%
16%
0%
10%
20%
30%
40%
50%
New Res.Construction
Commercial &Industrial
Repair /Remodel
International
OC Insulation Sales by End Market
January 18, 2016 CFA Research Challenge
5 | P a g e
INDUSTRY OVERVIEW & COMPETITIVE POSITIONING
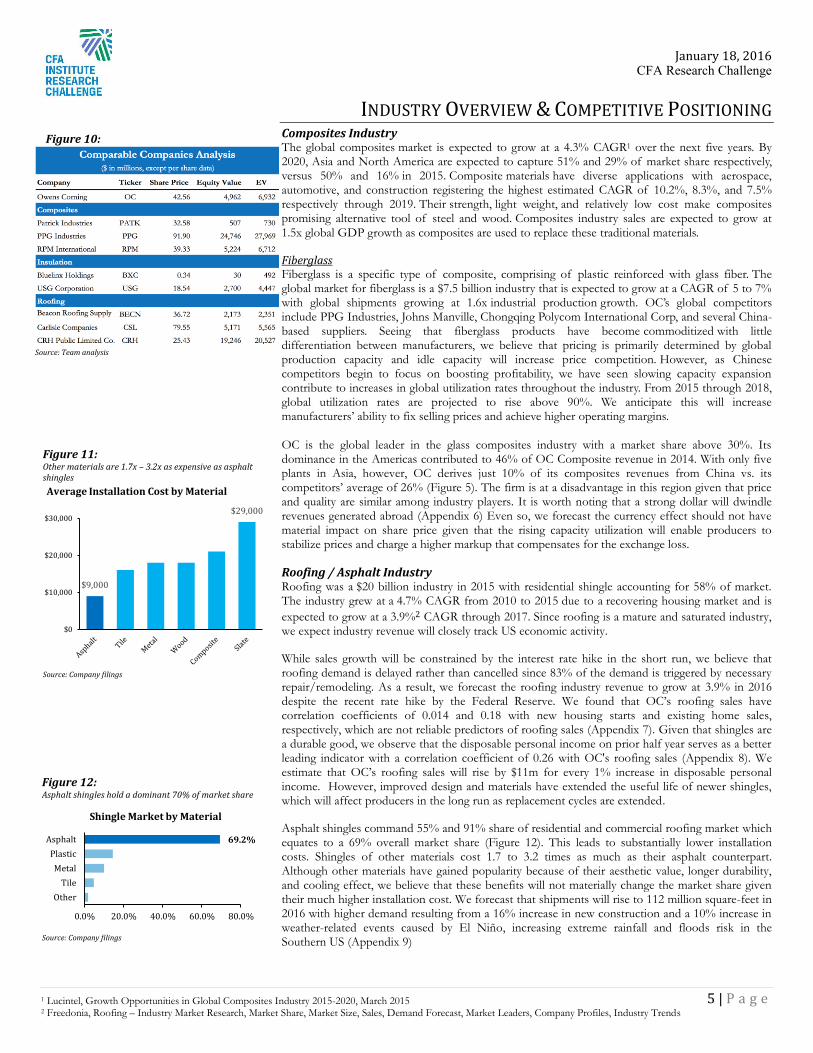
Composites Industry The global composites market is expected to grow at a 4.3% CAGR1 over the next five years. By 2020, Asia and North America are expected to capture 51% and 29% of market share respectively, versus 50% and 16% in 2015. Composite materials have diverse applications with aerospace, automotive, and construction registering the highest estimated CAGR of 10.2%, 8.3%, and 7.5% respectively through 2019. Their strength, light weight, and relatively low cost make composites promising alternative tool of steel and wood. Composites industry sales are expected to grow at 1.5x global GDP growth as composites are used to replace these traditional materials.
Fiberglass Fiberglass is a specific type of composite, comprising of plastic reinforced with glass fiber. The global market for fiberglass is a $7.5 billion industry that is expected to grow at a CAGR of 5 to 7% with global shipments growing at 1.6x industrial production growth. OC’s global competitors include PPG Industries, Johns Manville, Chongqing Polycom International Corp, and several China-based suppliers. Seeing that fiberglass products have become commoditized with little differentiation between manufacturers, we believe that pricing is primarily determined by global production capacity and idle capacity will increase price competition. However, as Chinese competitors begin to focus on boosting profitability, we have seen slowing capacity expansion contribute to increases in global utilization rates throughout the industry. From 2015 through 2018, global utilization rates are projected to rise above 90%. We anticipate this will increase manufacturers’ ability to fix selling prices and achieve higher operating margins. OC is the global leader in the glass composites industry with a market share above 30%. Its dominance in the Americas contributed to 46% of OC Composite revenue in 2014. With only five plants in Asia, however, OC derives just 10% of its composites revenues from China vs. its competitors’ average of 26% (Figure 5). The firm is at a disadvantage in this region given that price and quality are similar among industry players. It is worth noting that a strong dollar will dwindle revenues generated abroad (Appendix 6) Even so, we forecast the currency effect should not have material impact on share price given that the rising capacity utilization will enable producers to stabilize prices and charge a higher markup that compensates for the exchange loss.
Roofing / Asphalt Industry Roofing was a $20 billion industry in 2015 with residential shingle accounting for 58% of market. The industry grew at a 4.7% CAGR from 2010 to 2015 due to a recovering housing market and is expected to grow at a 3.9%2 CAGR through 2017. Since roofing is a mature and saturated industry, we expect industry revenue will closely track US economic activity.
While sales growth will be constrained by the interest rate hike in the short run, we believe that roofing demand is delayed rather than cancelled since 83% of the demand is triggered by necessary repair/remodeling. As a result, we forecast the roofing industry revenue to grow at 3.9% in 2016 despite the recent rate hike by the Federal Reserve. We found that OC’s roofing sales have correlation coefficients of 0.014 and 0.18 with new housing starts and existing home sales, respectively, which are not reliable predictors of roofing sales (Appendix 7). Given that shingles are a durable good, we observe that the disposable personal income on prior half year serves as a better leading indicator with a correlation coefficient of 0.26 with OC's roofing sales (Appendix 8). We estimate that OC’s roofing sales will rise by $11m for every 1% increase in disposable personal income. However, improved design and materials have extended the useful life of newer shingles, which will affect producers in the long run as replacement cycles are extended.
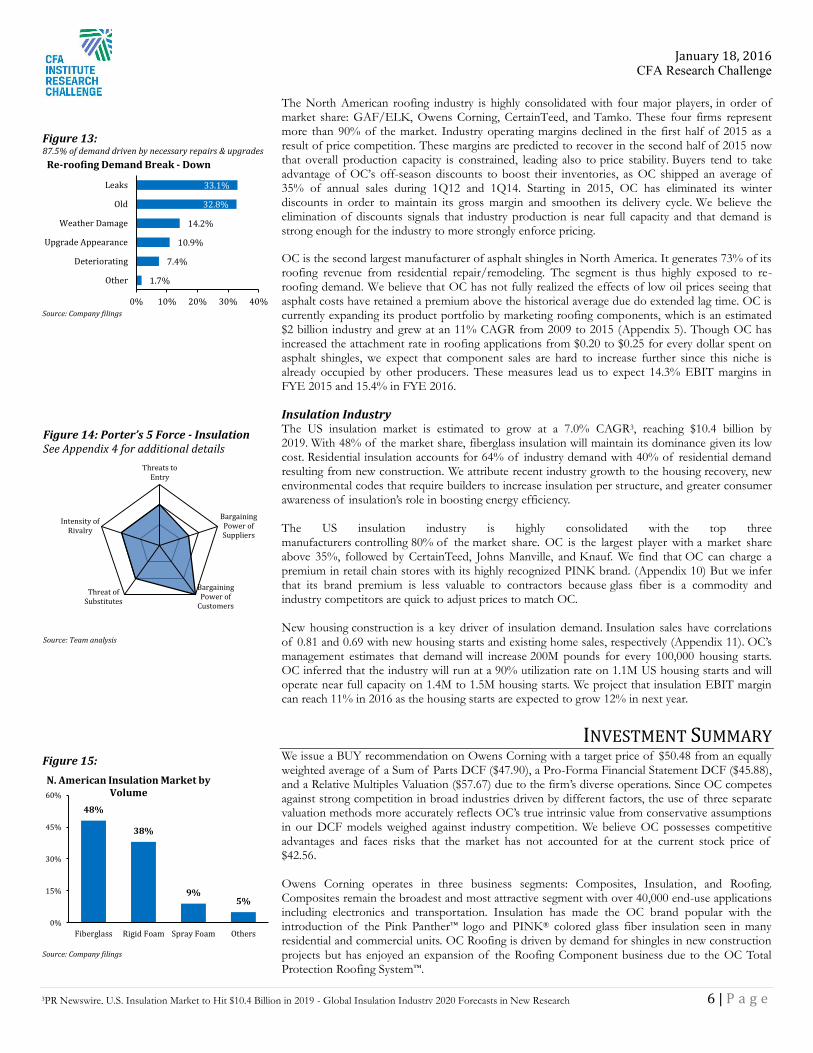
Asphalt shingles command 55% and 91% share of residential and commercial roofing market which equates to a 69% overall market share (Figure 12). This leads to substantially lower installation costs. Shingles of other materials cost 1.7 to 3.2 times as much as their asphalt counterpart. Although other materials have gained popularity because of their aesthetic value, longer durability, and cooling effect, we believe that these benefits will not materially change the market share given their much higher installation cost. We forecast that shipments will rise to 112 million square-feet in 2016 with higher demand resulting from a 16% increase in new construction and a 10% increase in weather-related events caused by El Niño, increasing extreme rainfall and floods risk in the Southern US (Appendix 9)
Figure 12: Asphalt shingles hold a dominant 70% of market share
Source: Company filings
69.2%
0.0% 20.0% 40.0% 60.0% 80.0%
OtherTile
MetalPlastic
Asphalt
Shingle Market by Material
Figure 11: Other materials are 1.7x – 3.2x as expensive as asphalt shingles
Source: Company filings
$9,000
$29,000
$0
$10,000
$20,000
$30,000
Average Installation Cost by Material
1 Lucintel, Growth Opportunities in Global Composites Industry 2015-2020, March 2015 2 Freedonia, Roofing – Industry Market Research, Market Share, Market Size, Sales, Demand Forecast, Market Leaders, Company Profiles, Industry Trends
Figure 10:
Source: Team analysis
January 18, 2016 CFA Research Challenge
6 | P a g e
The North American roofing industry is highly consolidated with four major players, in order of market share: GAF/ELK, Owens Corning, CertainTeed, and Tamko. These four firms represent more than 90% of the market. Industry operating margins declined in the first half of 2015 as a result of price competition. These margins are predicted to recover in the second half of 2015 now that overall production capacity is constrained, leading also to price stability. Buyers tend to take advantage of OC’s off-season discounts to boost their inventories, as OC shipped an average of 35% of annual sales during 1Q12 and 1Q14. Starting in 2015, OC has eliminated its winter discounts in order to maintain its gross margin and smoothen its delivery cycle. We believe the elimination of discounts signals that industry production is near full capacity and that demand is strong enough for the industry to more strongly enforce pricing.
OC is the second largest manufacturer of asphalt shingles in North America. It generates 73% of its roofing revenue from residential repair/remodeling. The segment is thus highly exposed to re-roofing demand. We believe that OC has not fully realized the effects of low oil prices seeing that asphalt costs have retained a premium above the historical average due do extended lag time. OC is currently expanding its product portfolio by marketing roofing components, which is an estimated $2 billion industry and grew at an 11% CAGR from 2009 to 2015 (Appendix 5). Though OC has increased the attachment rate in roofing applications from $0.20 to $0.25 for every dollar spent on asphalt shingles, we expect that component sales are hard to increase further since this niche is already occupied by other producers. These measures lead us to expect 14.3% EBIT margins in FYE 2015 and 15.4% in FYE 2016.
Insulation Industry
The US insulation market is estimated to grow at a 7.0% CAGR3, reaching $10.4 billion by 2019. With 48% of the market share, fiberglass insulation will maintain its dominance given its low cost. Residential insulation accounts for 64% of industry demand with 40% of residential demand resulting from new construction. We attribute recent industry growth to the housing recovery, new environmental codes that require builders to increase insulation per structure, and greater consumer awareness of insulation’s role in boosting energy efficiency. The US insulation industry is highly consolidated with the top three manufacturers controlling 80% of the market share. OC is the largest player with a market share above 35%, followed by CertainTeed, Johns Manville, and Knauf. We find that OC can charge a premium in retail chain stores with its highly recognized PINK brand. (Appendix 10) But we infer that its brand premium is less valuable to contractors because glass fiber is a commodity and industry competitors are quick to adjust prices to match OC. New housing construction is a key driver of insulation demand. Insulation sales have correlations of 0.81 and 0.69 with new housing starts and existing home sales, respectively (Appendix 11). OC’s management estimates that demand will increase 200M pounds for every 100,000 housing starts. OC inferred that the industry will run at a 90% utilization rate on 1.1M US housing starts and will operate near full capacity on 1.4M to 1.5M housing starts. We project that insulation EBIT margin can reach 11% in 2016 as the housing starts are expected to grow 12% in next year.
INVESTMENT SUMMARY We issue a BUY recommendation on Owens Corning with a target price of $50.48 from an equally weighted average of a Sum of Parts DCF ($47.90), a Pro-Forma Financial Statement DCF ($45.88), and a Relative Multiples Valuation ($57.67) due to the firm’s diverse operations. Since OC competes against strong competition in broad industries driven by different factors, the use of three separate valuation methods more accurately reflects OC’s true intrinsic value from conservative assumptions in our DCF models weighed against industry competition. We believe OC possesses competitive advantages and faces risks that the market has not accounted for at the current stock price of $42.56. Owens Corning operates in three business segments: Composites, Insulation, and Roofing. Composites remain the broadest and most attractive segment with over 40,000 end-use applications including electronics and transportation. Insulation has made the OC brand popular with the introduction of the Pink Panther™ logo and PINK® colored glass fiber insulation seen in many residential and commercial units. OC Roofing is driven by demand for shingles in new construction projects but has enjoyed an expansion of the Roofing Component business due to the OC Total Protection Roofing System™.
Figure 13: 87.5% of demand driven by necessary repairs & upgrades
Source: Company filings
33.1%
32.8%
14.2%
10.9%
7.4%
1.7%
Leaks
Old
Weather Damage
Upgrade Appearance
Deteriorating
Other
0% 10% 20% 30% 40%
Re-roofing Demand Break - Down
Figure 15:
Source: Company filings
48%
38%
9% 5%
0%
15%
30%
45%
60%
Fiberglass Rigid Foam Spray Foam Others
N. American Insulation Market by Volume
3PR Newswire, U.S. Insulation Market to Hit $10.4 Billion in 2019 - Global Insulation Industry 2020 Forecasts in New Research Reports
Figure 14: Porter’s 5 Force - Insulation See Appendix 4 for additional details
Source: Team analysis
Threats toEntry
BargainingPower ofSuppliers
BargainingPower of
Customers
Threat ofSubstitutes
Intensity ofRivalry
January 18, 2016 CFA Research Challenge
7 | P a g e
A key driver of growth for OC going into the future is their restructuring and cost cutting activities which have already led EBIT margins to increase from 7.9% to 9.5% (1.57% growth) over the last twelve months. We forecast this EBIT margin to peak in 2017 at 11.7% and step down to 10.2% in 2019. Based on our valuation, from 2015 to 2019, we forecast revenues to grow from $5,541m to $6,757m (22% growth), EBITDA (adj.) to grow from $830m to $1,032m (24.28% growth) and EPS to grow from $2.40 to $3.81 (59% growth). OC has beaten EPS estimates in each of the past four quarters (37% average beat) and has returned 36% year-to-date. In 1Q14, OC announced a quarterly dividend of $0.16 per share which, as of 1Q15, has been increased to $0.17 per share. OC has fully integrated their acquisition of Thermafiber and has announced the construction of a new facility in Joplin, Missouri to support growth in the insulation market. Further, OC will be opening a new facility in Gastonia, North Carolina in 2016 which will help meet growing demand for Sustaina® non-woven products. OC was recently ranked 11th on the “2016 Best Companies for Leaders” list, according to Chief Executive magazine. The list consists of 40 public companies and recognizes global leaders in leadership development.
VALUATION 3Q15 Results OC reported 3Q EPS of $0.96, beating consensus estimates of $0.68 by 41%, as well as beating analyst expectations by 37.07% over the last four quarters. Firm-wide LTM EBIT reached $506m and management guidance suggests that FYE 2015 EBIT will be in the range of $460m to $500m. Relative Valuation Our relative valuation of $57.67 is derived from the comparable companies median LTM EV/EBITDA multiple of 9.37x.
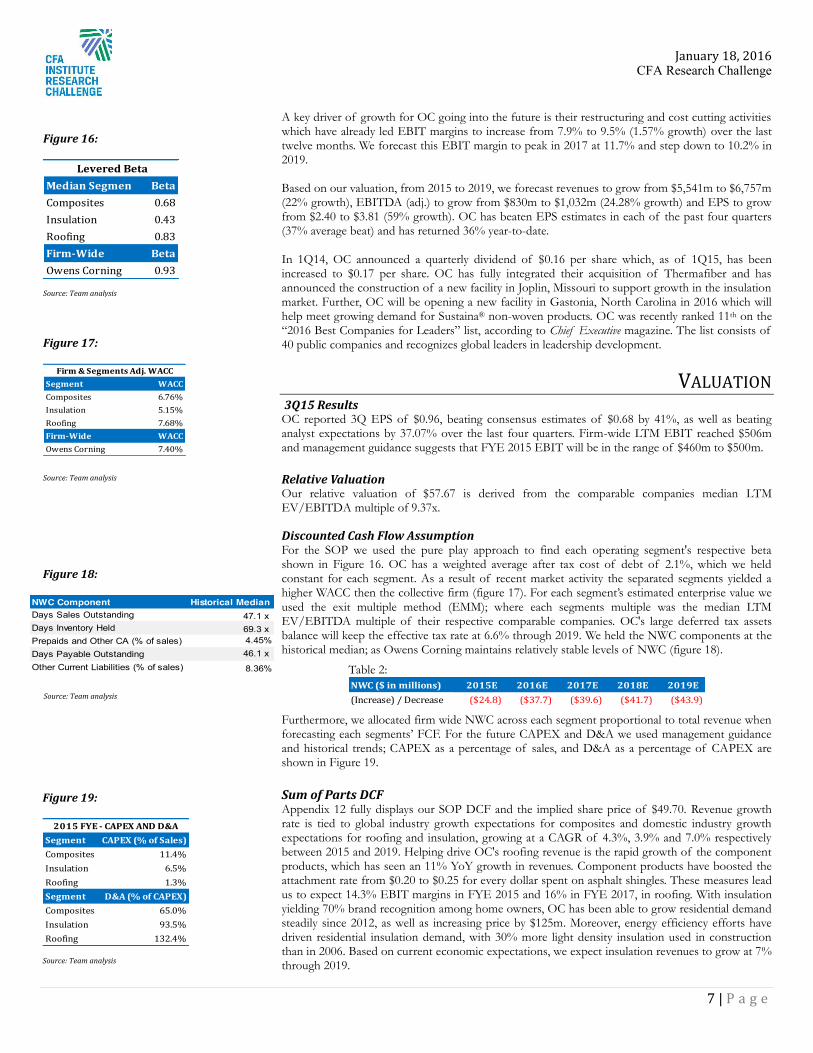
Discounted Cash Flow Assumption For the SOP we used the pure play approach to find each operating segment's respective beta shown in Figure 16. OC has a weighted average after tax cost of debt of 2.1%, which we held constant for each segment. As a result of recent market activity the separated segments yielded a higher WACC then the collective firm (figure 17). For each segment’s estimated enterprise value we used the exit multiple method (EMM); where each segments multiple was the median LTM EV/EBITDA multiple of their respective comparable companies. OC's large deferred tax assets balance will keep the effective tax rate at 6.6% through 2019. We held the NWC components at the historical median; as Owens Corning maintains relatively stable levels of NWC (figure 18).
Table 2: NWC ($ in millions) 2015E 2016E 2017E 2018E 2019E(Increase) / Decrease ($24.8) ($37.7) ($39.6) ($41.7) ($43.9)
Furthermore, we allocated firm wide NWC across each segment proportional to total revenue when forecasting each segments’ FCF. For the future CAPEX and D&A we used management guidance and historical trends; CAPEX as a percentage of sales, and D&A as a percentage of CAPEX are shown in Figure 19. Sum of Parts DCF Appendix 12 fully displays our SOP DCF and the implied share price of $49.70. Revenue growth rate is tied to global industry growth expectations for composites and domestic industry growth expectations for roofing and insulation, growing at a CAGR of 4.3%, 3.9% and 7.0% respectively between 2015 and 2019. Helping drive OC's roofing revenue is the rapid growth of the component products, which has seen an 11% YoY growth in revenues. Component products have boosted the attachment rate from $0.20 to $0.25 for every dollar spent on asphalt shingles. These measures lead us to expect 14.3% EBIT margins in FYE 2015 and 16% in FYE 2017, in roofing. With insulation yielding 70% brand recognition among home owners, OC has been able to grow residential demand steadily since 2012, as well as increasing price by $125m. Moreover, energy efficiency efforts have driven residential insulation demand, with 30% more light density insulation used in construction than in 2006. Based on current economic expectations, we expect insulation revenues to grow at 7% through 2019.
Figure 16:
Source: Team analysis
Median Segment BetaComposites 0.68Insulation 0.43Roofing 0.83Firm-Wide BetaOwens Corning 0.93
Levered Beta
Figure 17:
Segment WACCComposites 6.76%Insulation 5.15%Roofing 7.68%Firm-Wide WACCOwens Corning 7.40%
Firm & Segments Adj. WACC
Source: Team analysis
Figure 19:
Source: Team analysis
Segment CAPEX (% of Sales)Composites 11.4%Insulation 6.5%Roofing 1.3%Segment D&A (% of CAPEX)Composites 65.0%Insulation 93.5%Roofing 132.4%
2015 FYE - CAPEX AND D&A
Figure 18: NWC Component Historical MedianDays Sales Outstanding 47.1 xDays Inventory Held 69.3 xPrepaids and Other CA (% of sales) 4.45% Days Payable Outstanding 46.1 xOther Current Liabilities (% of sales) 8.36% Source: Team analysis
January 18, 2016 CFA Research Challenge
8 | P a g e
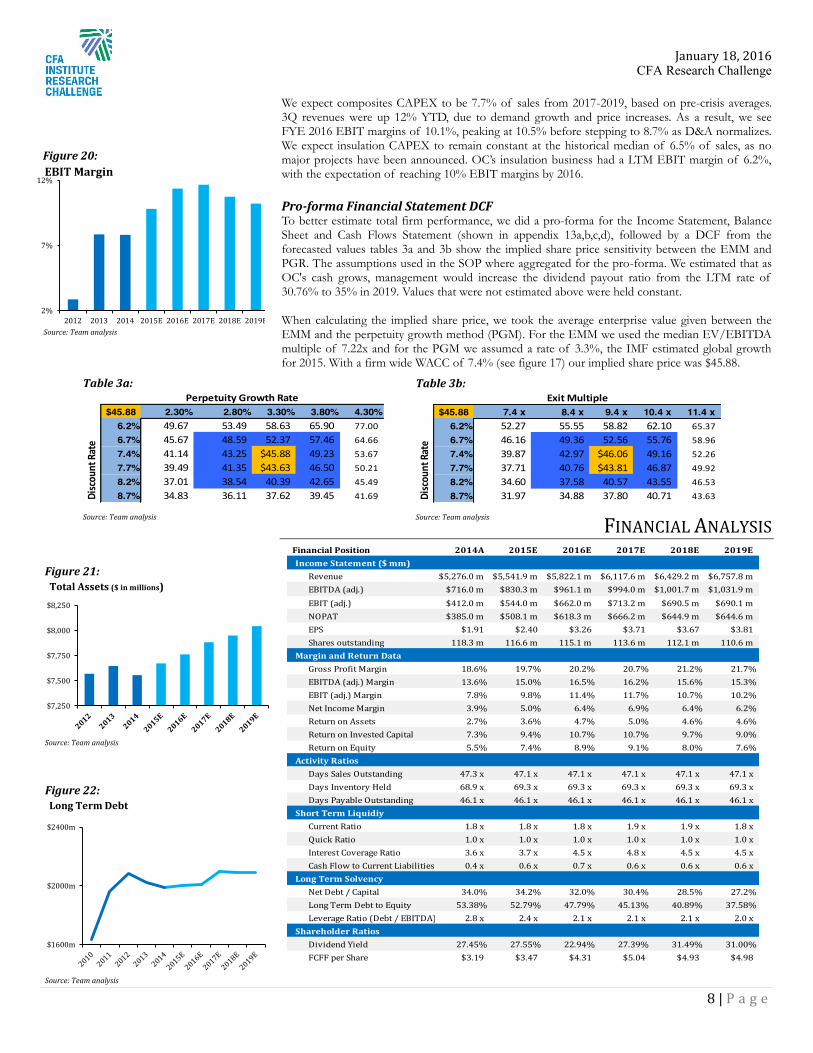
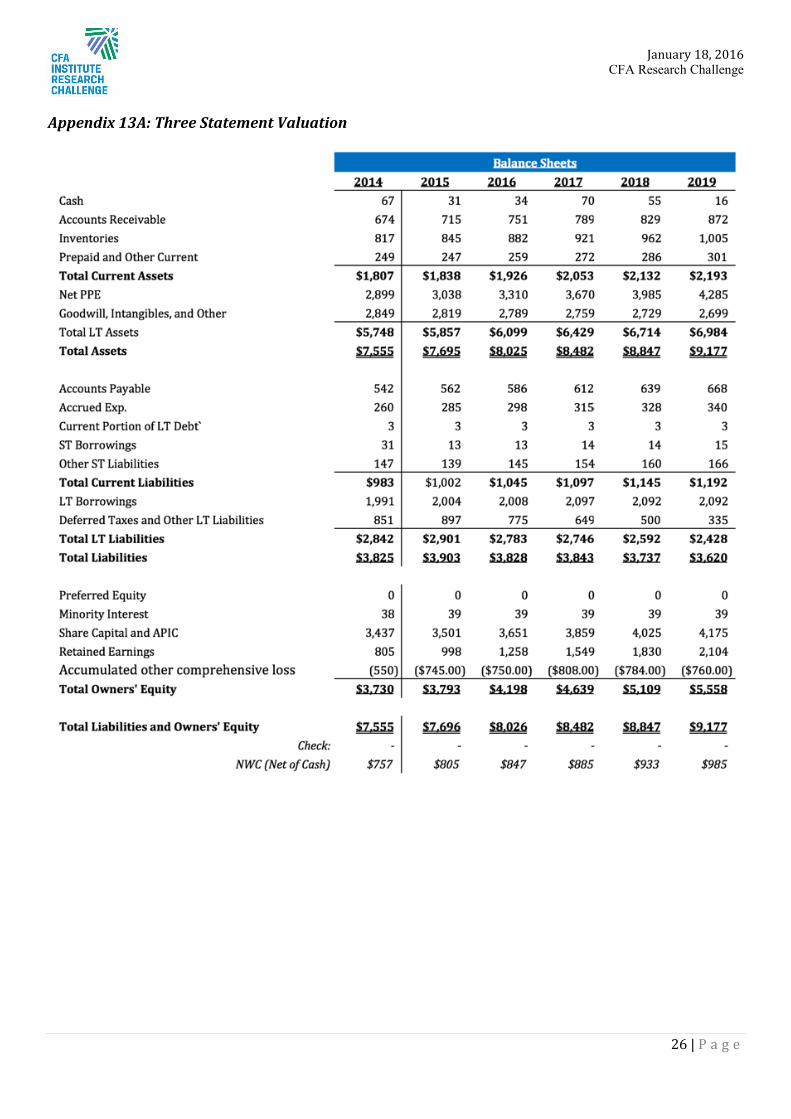
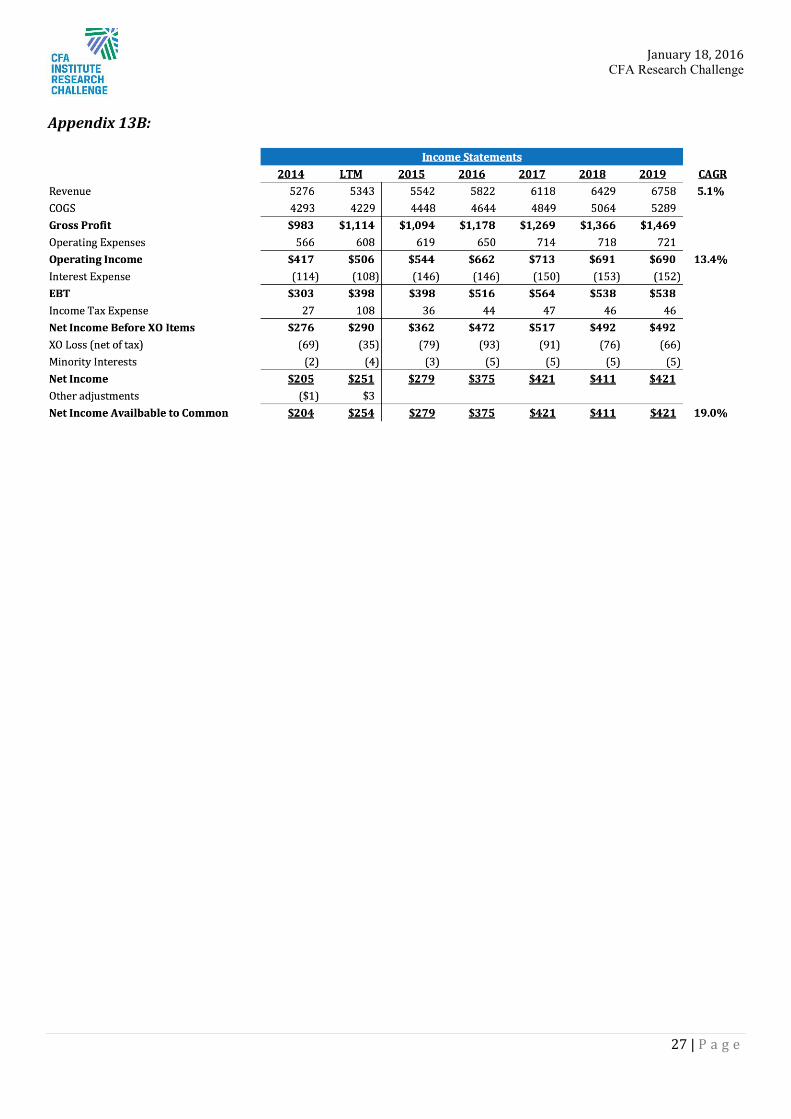
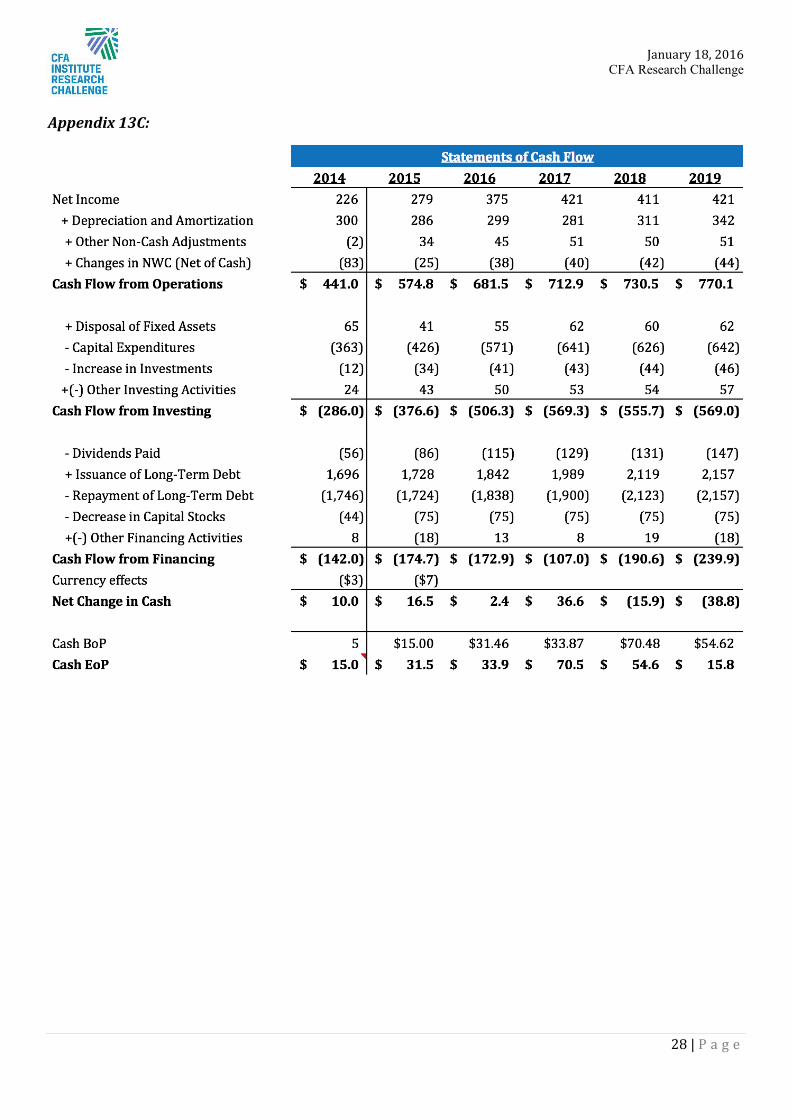
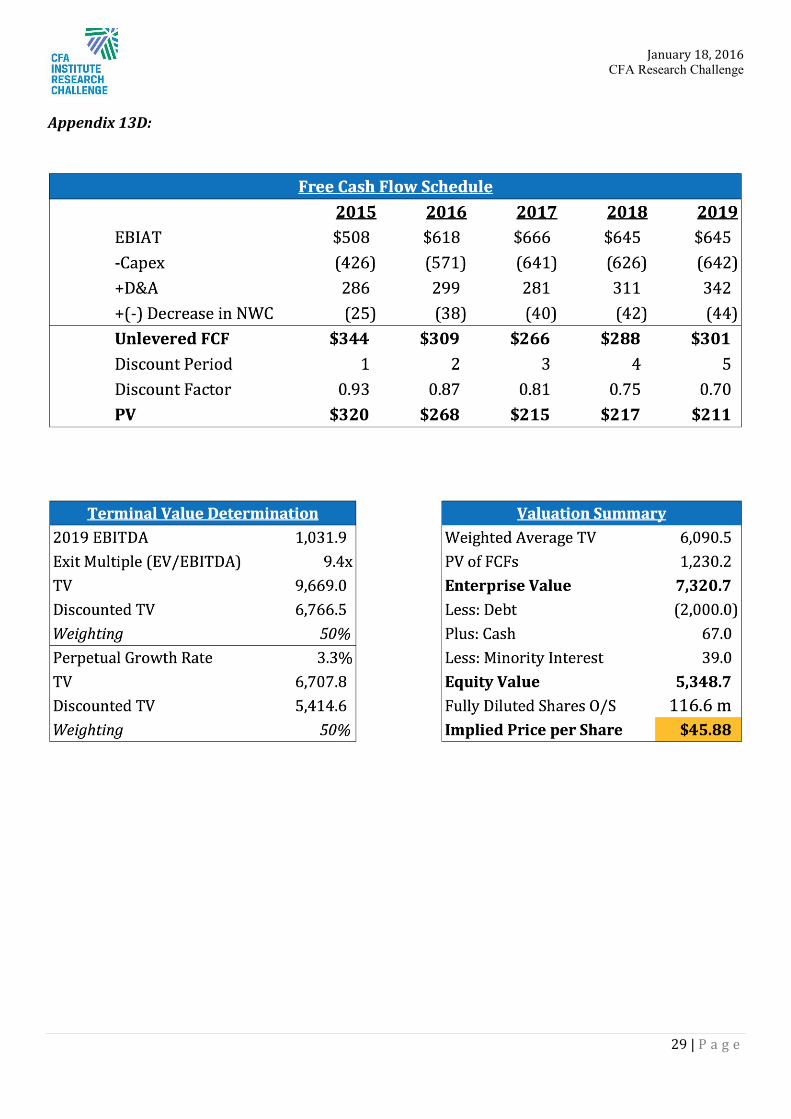
We expect composites CAPEX to be 7.7% of sales from 2017-2019, based on pre-crisis averages. 3Q revenues were up 12% YTD, due to demand growth and price increases. As a result, we see FYE 2016 EBIT margins of 10.1%, peaking at 10.5% before stepping to 8.7% as D&A normalizes. We expect insulation CAPEX to remain constant at the historical median of 6.5% of sales, as no major projects have been announced. OC’s insulation business had a LTM EBIT margin of 6.2%, with the expectation of reaching 10% EBIT margins by 2016. Pro-forma Financial Statement DCF To better estimate total firm performance, we did a pro-forma for the Income Statement, Balance Sheet and Cash Flows Statement (shown in appendix 13a,b,c,d), followed by a DCF from the forecasted values tables 3a and 3b show the implied share price sensitivity between the EMM and PGR. The assumptions used in the SOP where aggregated for the pro-forma. We estimated that as OC's cash grows, management would increase the dividend payout ratio from the LTM rate of 30.76% to 35% in 2019. Values that were not estimated above were held constant. When calculating the implied share price, we took the average enterprise value given between the EMM and the perpetuity growth method (PGM). For the EMM we used the median EV/EBITDA multiple of 7.22x and for the PGM we assumed a rate of 3.3%, the IMF estimated global growth for 2015. With a firm wide WACC of 7.4% (see figure 17) our implied share price was $45.88.
FINANCIAL ANALYSIS
2014A 2015E 2016E 2017E 2018E 2019E
$5,276.0 m $5,541.9 m $5,822.1 m $6,117.6 m $6,429.2 m $6,757.8 m$716.0 m $830.3 m $961.1 m $994.0 m $1,001.7 m $1,031.9 m$412.0 m $544.0 m $662.0 m $713.2 m $690.5 m $690.1 m$385.0 m $508.1 m $618.3 m $666.2 m $644.9 m $644.6 m
$1.91 $2.40 $3.26 $3.71 $3.67 $3.81118.3 m 116.6 m 115.1 m 113.6 m 112.1 m 110.6 m
18.6% 19.7% 20.2% 20.7% 21.2% 21.7%13.6% 15.0% 16.5% 16.2% 15.6% 15.3%
7.8% 9.8% 11.4% 11.7% 10.7% 10.2%3.9% 5.0% 6.4% 6.9% 6.4% 6.2%2.7% 3.6% 4.7% 5.0% 4.6% 4.6%7.3% 9.4% 10.7% 10.7% 9.7% 9.0%5.5% 7.4% 8.9% 9.1% 8.0% 7.6%
47.3 x 47.1 x 47.1 x 47.1 x 47.1 x 47.1 x68.9 x 69.3 x 69.3 x 69.3 x 69.3 x 69.3 x46.1 x 46.1 x 46.1 x 46.1 x 46.1 x 46.1 x
Short Term Liquidiy1.8 x 1.8 x 1.8 x 1.9 x 1.9 x 1.8 x1.0 x 1.0 x 1.0 x 1.0 x 1.0 x 1.0 x3.6 x 3.7 x 4.5 x 4.8 x 4.5 x 4.5 x0.4 x 0.6 x 0.7 x 0.6 x 0.6 x 0.6 x
Long Term Solvency34.0% 34.2% 32.0% 30.4% 28.5% 27.2%
53.38% 52.79% 47.79% 45.13% 40.89% 37.58%2.8 x 2.4 x 2.1 x 2.1 x 2.1 x 2.0 x
Shareholder Ratios27.45% 27.55% 22.94% 27.39% 31.49% 31.00%
$3.19 $3.47 $4.31 $5.04 $4.93 $4.98
EBIT (adj.) Margin
Financial PositionIncome Statement ($ mm)
Revenue EBITDA (adj.)EBIT (adj.)NOPATEPS Shares outstanding
Margin and Return DataGross Profit MarginEBITDA (adj.) Margin
Cash Flow to Current Liabilities
Net Income MarginReturn on AssetsReturn on Invested CapitalReturn on Equity
Activity RatiosDays Sales OutstandingDays Inventory HeldDays Payable Outstanding
Current RatioQuick RatioInterest Coverage Ratio
Net Debt / Capital Long Term Debt to EquityLeverage Ratio (Debt / EBITDA)
Dividend YieldFCFF per Share
Figure 21:
Source: Team analysis
$7,250
$7,500
$7,750
$8,000
$8,250
Total Assets ($ in millions)
Figure 22:
Source: Team analysis
$1600m
$2000m
$2400m
Long Term Debt
Figure 20:
Source: Team analysis
2%
7%
12%
2012 2013 2014 2015E 2016E 2017E 2018E 2019E
EBIT Margin
Table 3b:
$45.88 7.4 x 8.4 x 9.4 x 10.4 x 11.4 x6.2% 52.27 55.55 58.82 62.10 65.37
6.7% 46.16 49.36 52.56 55.76 58.96
7.4% 39.87 42.97 $46.06 49.16 52.26
7.7% 37.71 40.76 $43.81 46.87 49.92
8.2% 34.60 37.58 40.57 43.55 46.53
8.7% 31.97 34.88 37.80 40.71 43.63
Exit Multiple
Disc
ount
Rat
e
Source: Team analysis
Table 3a:
$45.88 2.30% 2.80% 3.30% 3.80% 4.30% 6.2% 49.67 53.49 58.63 65.90 77.00
6.7% 45.67 48.59 52.37 57.46 64.66
7.4% 41.14 43.25 $45.88 49.23 53.67
7.7% 39.49 41.35 $43.63 46.50 50.21
8.2% 37.01 38.54 40.39 42.65 45.49
8.7% 34.83 36.11 37.62 39.45 41.69
Perpetuity Growth Rate
Disc
ount
Rat
e
Source: Team analysis
January 18, 2016 CFA Research Challenge
9 | P a g e
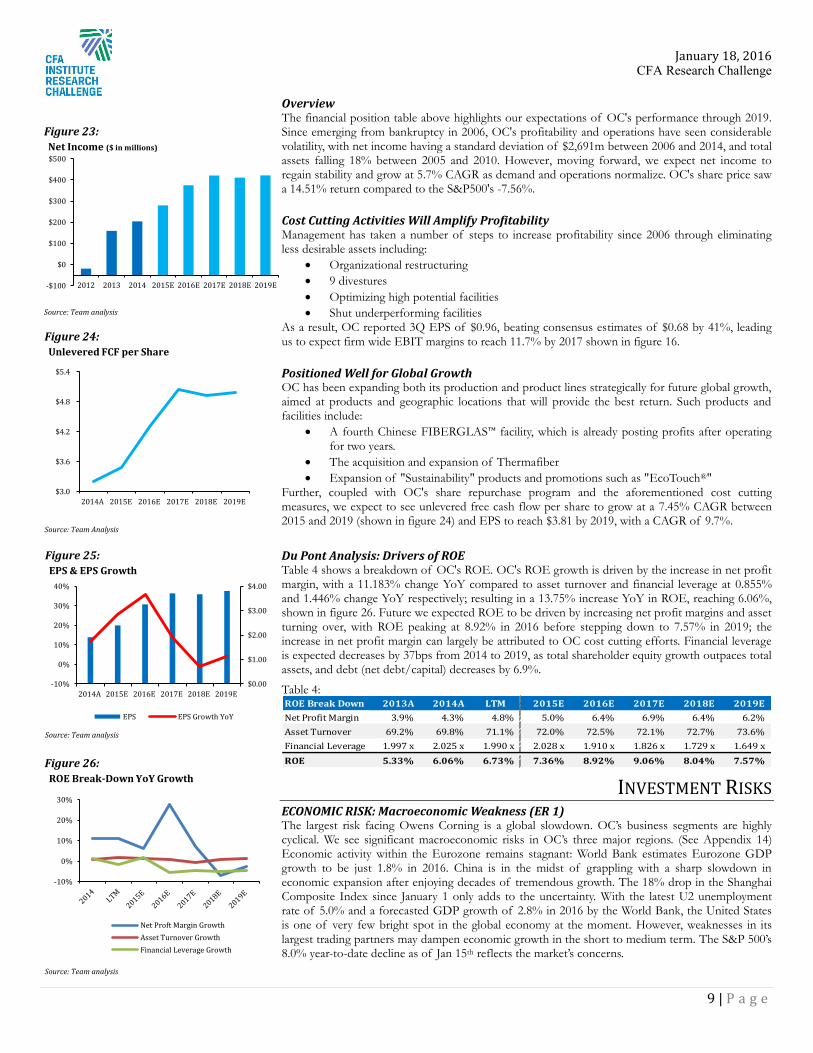
Overview The financial position table above highlights our expectations of OC's performance through 2019. Since emerging from bankruptcy in 2006, OC's profitability and operations have seen considerable volatility, with net income having a standard deviation of $2,691m between 2006 and 2014, and total assets falling 18% between 2005 and 2010. However, moving forward, we expect net income to regain stability and grow at 5.7% CAGR as demand and operations normalize. OC's share price saw a 14.51% return compared to the S&P500's -7.56%. Cost Cutting Activities Will Amplify Profitability Management has taken a number of steps to increase profitability since 2006 through eliminating less desirable assets including:
Organizational restructuring 9 divestures Optimizing high potential facilities Shut underperforming facilities
As a result, OC reported 3Q EPS of $0.96, beating consensus estimates of $0.68 by 41%, leading us to expect firm wide EBIT margins to reach 11.7% by 2017 shown in figure 16. Positioned Well for Global Growth OC has been expanding both its production and product lines strategically for future global growth, aimed at products and geographic locations that will provide the best return. Such products and facilities include:
A fourth Chinese FIBERGLAS™ facility, which is already posting profits after operating for two years.
The acquisition and expansion of Thermafiber Expansion of "Sustainability" products and promotions such as "EcoTouch®"
Further, coupled with OC's share repurchase program and the aforementioned cost cutting measures, we expect to see unlevered free cash flow per share to grow at a 7.45% CAGR between 2015 and 2019 (shown in figure 24) and EPS to reach $3.81 by 2019, with a CAGR of 9.7%. Du Pont Analysis: Drivers of ROE Table 4 shows a breakdown of OC's ROE. OC's ROE growth is driven by the increase in net profit margin, with a 11.183% change YoY compared to asset turnover and financial leverage at 0.855% and 1.446% change YoY respectively; resulting in a 13.75% increase YoY in ROE, reaching 6.06%, shown in figure 26. Future we expected ROE to be driven by increasing net profit margins and asset turning over, with ROE peaking at 8.92% in 2016 before stepping down to 7.57% in 2019; the increase in net profit margin can largely be attributed to OC cost cutting efforts. Financial leverage is expected decreases by 37bps from 2014 to 2019, as total shareholder equity growth outpaces total assets, and debt (net debt/capital) decreases by 6.9%.
Table 4:
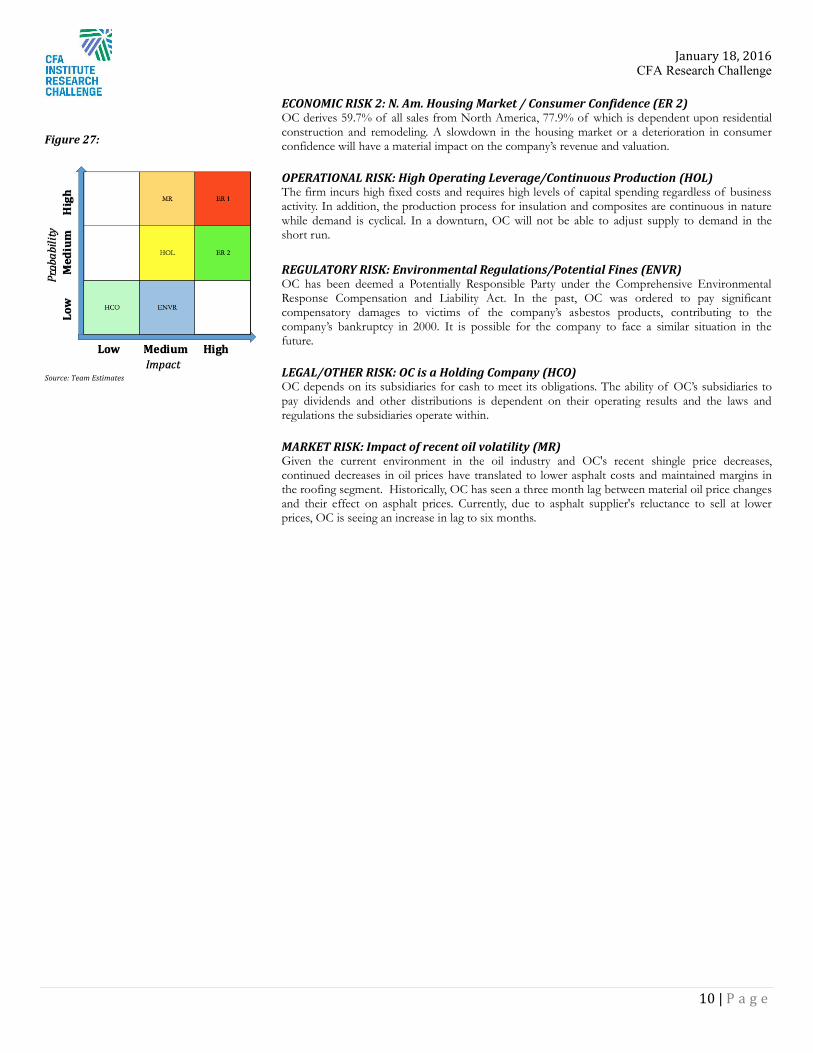
INVESTMENT RISKS ECONOMIC RISK: Macroeconomic Weakness (ER 1) The largest risk facing Owens Corning is a global slowdown. OC’s business segments are highly cyclical. We see significant macroeconomic risks in OC’s three major regions. (See Appendix 14) Economic activity within the Eurozone remains stagnant: World Bank estimates Eurozone GDP growth to be just 1.8% in 2016. China is in the midst of grappling with a sharp slowdown in economic expansion after enjoying decades of tremendous growth. The 18% drop in the Shanghai Composite Index since January 1 only adds to the uncertainty. With the latest U2 unemployment rate of 5.0% and a forecasted GDP growth of 2.8% in 2016 by the World Bank, the United States is one of very few bright spot in the global economy at the moment. However, weaknesses in its largest trading partners may dampen economic growth in the short to medium term. The S&P 500’s 8.0% year-to-date decline as of Jan 15th reflects the market’s concerns.
ROE Break Down 2013A 2014A LTM 2015E 2016E 2017E 2018E 2019ENet Profit Margin 3.9% 4.3% 4.8% 5.0% 6.4% 6.9% 6.4% 6.2% Asset Turnover 69.2% 69.8% 71.1% 72.0% 72.5% 72.1% 72.7% 73.6% Financial Leverage 1.997 x 2.025 x 1.990 x 2.028 x 1.910 x 1.826 x 1.729 x 1.649 xROE 5.33% 6.06% 6.73% 7.36% 8.92% 9.06% 8.04% 7.57%
Figure 23:
Source: Team analysis
-$100
$0
$100
$200
$300
$400
$500
2012 2013 2014 2015E 2016E 2017E 2018E 2019E
Net Income ($ in millions)
Figure 24:
Source: Team Analysis
$3.0
$3.6
$4.2
$4.8
$5.4
2014A 2015E 2016E 2017E 2018E 2019E
Unlevered FCF per Share
Figure 25:
Source: Team analysis
$0.00
$1.00
$2.00
$3.00
$4.00
-10%
0%
10%
20%
30%
40%
2014A 2015E 2016E 2017E 2018E 2019E
EPS & EPS Growth
EPS EPS Growth YoY
Figure 26:
Source: Team analysis
-10%
0%
10%
20%
30%
ROE Break-Down YoY Growth
Net Proft Margin GrowthAsset Turnover GrowthFinancial Leverage Growth
January 18, 2016 CFA Research Challenge
10 | P a g e
ECONOMIC RISK 2: N. Am. Housing Market / Consumer Confidence (ER 2) OC derives 59.7% of all sales from North America, 77.9% of which is dependent upon residential construction and remodeling. A slowdown in the housing market or a deterioration in consumer confidence will have a material impact on the company’s revenue and valuation. OPERATIONAL RISK: High Operating Leverage/Continuous Production (HOL) The firm incurs high fixed costs and requires high levels of capital spending regardless of business activity. In addition, the production process for insulation and composites are continuous in nature while demand is cyclical. In a downturn, OC will not be able to adjust supply to demand in the short run. REGULATORY RISK: Environmental Regulations/Potential Fines (ENVR) OC has been deemed a Potentially Responsible Party under the Comprehensive Environmental Response Compensation and Liability Act. In the past, OC was ordered to pay significant compensatory damages to victims of the company’s asbestos products, contributing to the company’s bankruptcy in 2000. It is possible for the company to face a similar situation in the future. LEGAL/OTHER RISK: OC is a Holding Company (HCO) OC depends on its subsidiaries for cash to meet its obligations. The ability of OC’s subsidiaries to pay dividends and other distributions is dependent on their operating results and the laws and regulations the subsidiaries operate within. MARKET RISK: Impact of recent oil volatility (MR) Given the current environment in the oil industry and OC's recent shingle price decreases, continued decreases in oil prices have translated to lower asphalt costs and maintained margins in the roofing segment. Historically, OC has seen a three month lag between material oil price changes and their effect on asphalt prices. Currently, due to asphalt supplier's reluctance to sell at lower prices, OC is seeing an increase in lag to six months.
Figure 27:
Source: Team Estimates
January 18, 2016 CFA Research Challenge
11 | P a g e
Disclosures: Ownership and material conflicts of interest: The author(s), or a member of their household, of this report does not hold a financial interest in the securities of this company.
The author(s), or a member of their household, of this report does not know of the existence of any conflicts of interest that might bias the
content or publication of this report.
Receipt of compensation: Compensation of the author(s) of this report is not based on investment banking revenue.
Position as an officer or director: The author(s), or a member of their household, does not serve as an officer, director or advisory board member of the subject company.
Market making: The author(s) does not act as a market maker in the subject company’s securities.
Disclaimer: The information set forth herein has been obtained or derived from sources generally available to the public and believed by the author(s) to be
reliable, but the author(s) does not make any representation or warranty, express or implied, as to its accuracy or completeness. The information
is not intended to be used as the basis of any investment decisions by any person or entity. This information does not constitute investment
advice, nor is it an offer or a solicitation of an offer to buy or sell any security. This report should not be considered to be a recommendation by
any individual affiliated with CFA societies of Dayton, Cincinnati or Columbus, CFA Institute or the CFA Institute Research Challenge with regard to
this company’s stock.
CFA Institute Research Challenge
January 18, 2016 CFA Research Challenge
12 | P a g e
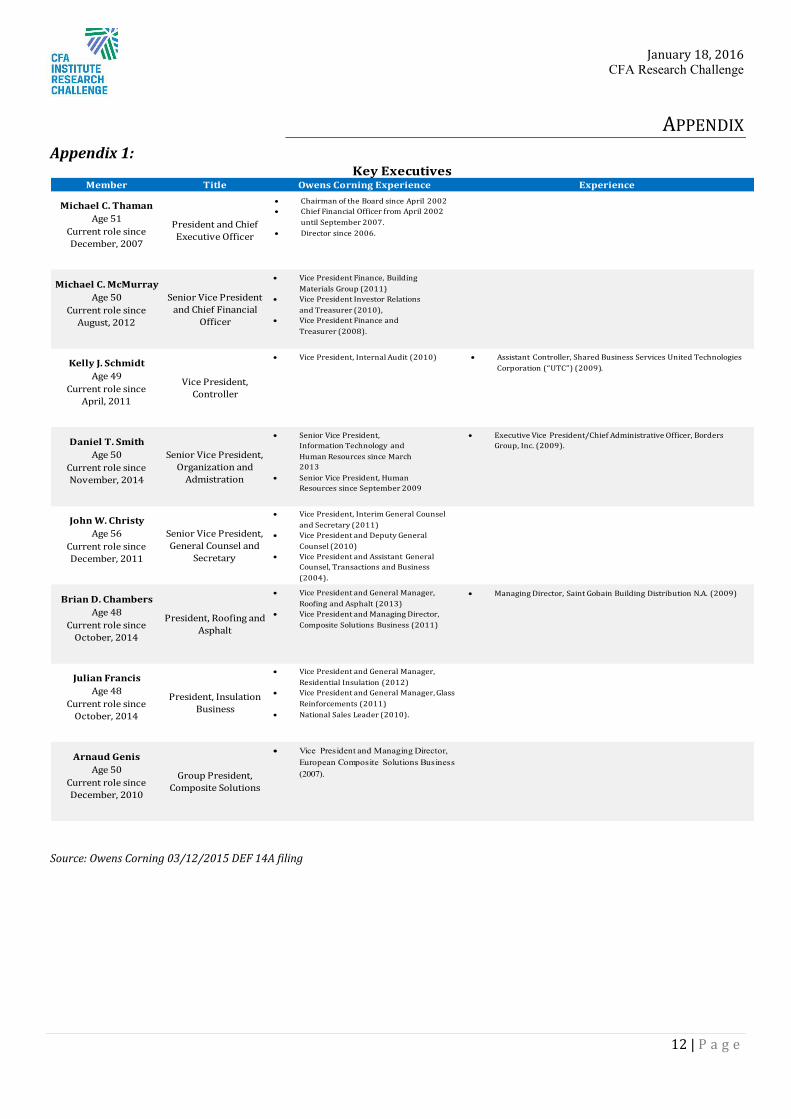
APPENDIX Appendix 1:
Source: Owens Corning 03/12/2015 DEF 14A filing
Member Title Owens Corning Experience Experience
Michael C. ThamanAge 51
Current role since December, 2007
Michael C. McMurrayAge 50
Current role since August, 2012
Kelly J. SchmidtAge 49
Current role since April, 2011
Daniel T. SmithAge 50
Current role since November, 2014
John W. ChristyAge 56
Current role since December, 2011
Brian D. ChambersAge 48
Current role since October, 2014
Julian FrancisAge 48
Current role since October, 2014
Arnaud GenisAge 50
Current role since December, 2010
Key Executives
President and Chief Executive Officer
Senior Vice President and Chief Financial
Officer
Vice President, Controller
Senior Vice President, Organization and
Admistration
Senior Vice President, General Counsel and
Secretary
President, Roofing and Asphalt
President, Insulation Business
Group President, Composite Solutions
Chairman of the Board since April 2002 Chief Financial Officer from April 2002
until September 2007. Director since 2006.
Vice President Finance, Building Materials Group (2011)
Vice President Investor Relations and Treasurer (2010),
Vice President Finance and Treasurer (2008).
Vice President, Internal Audit (2010) Assistant Controller, Shared Business Services United Technologies Corporation (“UTC”) (2009).
Senior Vice President, Information Technology and Human Resources since March 2013
Senior Vice President, Human Resources since September 2009
Executive Vice President/Chief Administrative Officer, Borders Group, Inc. (2009).
Vice President, Interim General Counsel and Secretary (2011)
Vice President and Deputy General Counsel (2010)
Vice President and Assistant General Counsel, Transactions and Business (2004).
Vice President and General Manager, Roofing and Asphalt (2013)
Vice President and Managing Director, Composite Solutions Business (2011)
Managing Director, Saint Gobain Building Distribution N.A. (2009)
Vice President and General Manager, Residential Insulation (2012)
Vice President and General Manager, Glass Reinforcements (2011)
National Sales Leader (2010).
Vice President and Managing Director, European Composite Solutions Business (2007).
January 18, 2016 CFA Research Challenge
13 | P a g e
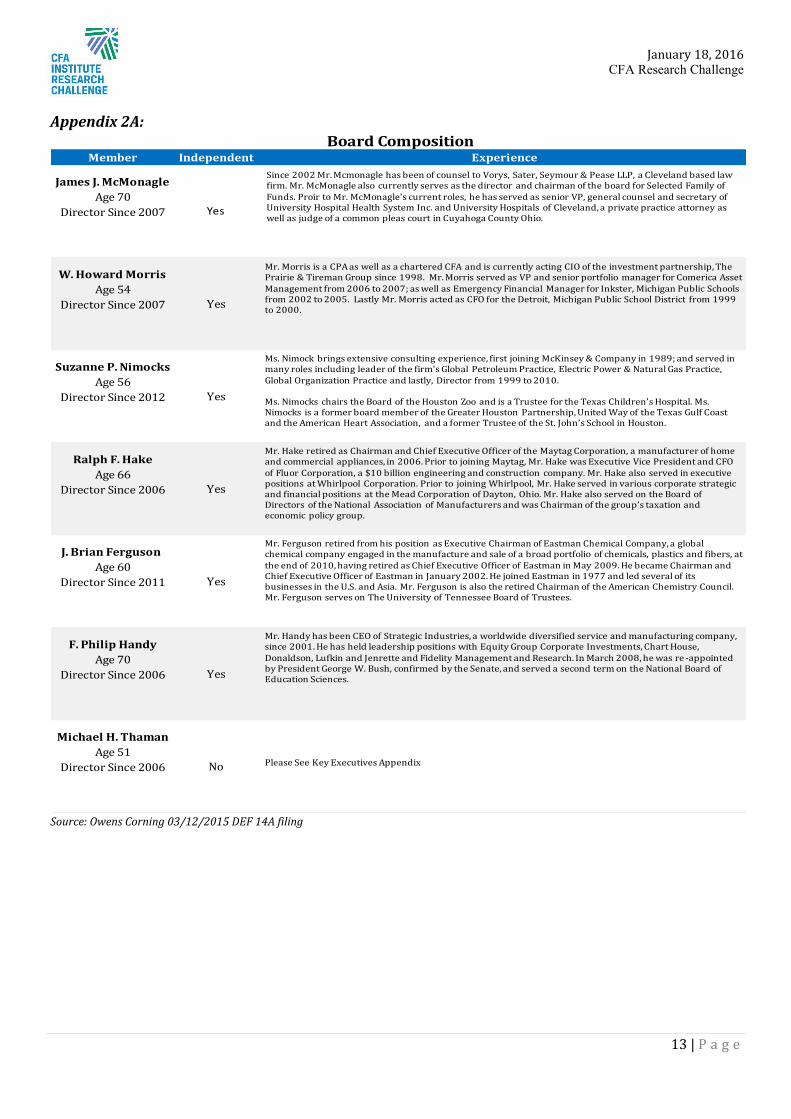
Appendix 2A:
Source: Owens Corning 03/12/2015 DEF 14A filing
Member Independent Experience
James J. McMonagleAge 70
Director Since 2007
W. Howard MorrisAge 54
Director Since 2007
Suzanne P. NimocksAge 56
Director Since 2012
Ralph F. HakeAge 66
Director Since 2006
J. Brian Ferguson Age 60
Director Since 2011
F. Philip HandyAge 70
Director Since 2006
Michael H. ThamanAge 51
Director Since 2006
Yes
Yes
Board Composition
Yes
Yes
Yes
Yes
No
Since 2002 Mr. Mcmonagle has been of counsel to Vorys, Sater, Seymour & Pease LLP, a Cleveland based law firm. Mr. McMonagle also currently serves as the director and chairman of the board for Selected Family of Funds. Proir to Mr. McMonagle's current roles, he has served as senior VP, general counsel and secretary of University Hospital Health System Inc. and University Hospitals of Cleveland, a private practice attorney as well as judge of a common pleas court in Cuyahoga County Ohio.
Mr. Morris is a CPA as well as a chartered CFA and is currently acting CIO of the investment partnership, The Prairie & Tireman Group since 1998. Mr. Morris served as VP and senior portfolio manager for Comerica Asset Management from 2006 to 2007; as well as Emergency Financial Manager for Inkster, Michigan Public Schools from 2002 to 2005. Lastly Mr. Morris acted as CFO for the Detroit, Michigan Public School District from 1999 to 2000.
Ms. Nimock brings extensive consulting experience, first joining McKinsey & Company in 1989; and served in many roles including leader of the firm's Global Petroleum Practice, Electric Power & Natural Gas Practice, Global Organization Practice and lastly, Director from 1999 to 2010.
Ms. Nimocks chairs the Board of the Houston Zoo and is a Trustee for the Texas Children’s Hospital. Ms. Nimocks is a former board member of the Greater Houston Partnership, United Way of the Texas Gulf Coast and the American Heart Association, and a former Trustee of the St. John’s School in Houston.
Mr. Hake retired as Chairman and Chief Executive Officer of the Maytag Corporation, a manufacturer of home and commercial appliances, in 2006. Prior to joining Maytag, Mr. Hake was Executive Vice President and CFO of Fluor Corporation, a $10 billion engineering and construction company. Mr. Hake also served in executive positions at Whirlpool Corporation. Prior to joining Whirlpool, Mr. Hake served in various corporate strategic and financial positions at the Mead Corporation of Dayton, Ohio. Mr. Hake also served on the Board of Directors of the National Association of Manufacturers and was Chairman of the group’s taxation and economic policy group.
Please See Key Executives Appendix
Mr. Ferguson retired from his position as Executive Chairman of Eastman Chemical Company, a global chemical company engaged in the manufacture and sale of a broad portfolio of chemicals, plastics and fibers, at the end of 2010, having retired as Chief Executive Officer of Eastman in May 2009. He became Chairman and Chief Executive Officer of Eastman in January 2002. He joined Eastman in 1977 and led several of its businesses in the U.S. and Asia. Mr. Ferguson is also the retired Chairman of the American Chemistry Council. Mr. Ferguson serves on The University of Tennessee Board of Trustees.
Mr. Handy has been CEO of Strategic Industries, a worldwide diversified service and manufacturing company, since 2001. He has held leadership positions with Equity Group Corporate Investments, Chart House, Donaldson, Lufkin and Jenrette and Fidelity Management and Research. In March 2008, he was re -appointed by President George W. Bush, confirmed by the Senate, and served a second term on the National Board of Education Sciences.

January 18, 2016 CFA Research Challenge
14 | P a g e
Appendix 2B:
Source: Owens Corning 03/12/2015 DEF 14A filing
Member Independent Experience
Cesar CondeAge 41
Director Since 2014
Ann IversonAge 71
Director Since 2006
Edward F. LonerganAge 55
Director Since 2013
Maryann T. SeamanAge 71
Director Since 2014
Norman P. Blake, Jr.Age 73
Director Since 2006
John D. WilliamsAge 60
Director Since 2011
Yes
Yes
Yes
Yes
Board Composition
Yes
Yes
Mr. Conde is Executive Vice President at NBCUniversal, where he oversees NBCUniversal International, which includes film and television distribution, cable channels, film and television production, theme parks, and news. Mr. Conde joined NBCUniversal in October 2013 from Univision, a leading American media company with a portfolio of Spanish language television networks, radio stations and websites, where he served as President since 2009. Mr. Conde, who joined Univision in 2003, served in a variety of senior executive capacities and is credited with transforming it into a leading global, multi-platform media brand. Prior to Univision, Conde served as the White House Fellow for Secretary of State Colin L. Powell from 2002 -2003.
Ms. Iverson has provided international consulting services in Carefree, Arizona, since 1998. Prior to that, Ms. Iverson served as Chief Executive Officer of Laura Ashley Holdings plc, Mothercare plc and Kay-Bee Toy Stores, chairperson of Brooks Sports, Inc. and Chairman of the Board of Trustees of Thunderbird—The School of Global Management. She has held executive positions with Bloomingdales and Federated Department Stores, Inc. She also has been awarded the Ellis Island Medal of Honor.
Mr. Lonergan retired as Director, President and Chief Executive Officer of Chiquita Brands International, Inc., a leading international marketer and distributor of food products, upon the sale of the company in January 2015. He had served in this role since October 2012. Prior to joining Chiquita, Mr. Lonergan served as Director, President and CEO of Diversey, Inc., a leading global provider of sustainable cleaning, sanitation and hygiene solutions, from February 2006 through October 2011. Prior to joining Diversey, Mr. Lonergan served as President of the European region for The Gillette Company from May 2002 until January 2006 and was
Ms. Seaman has served as Executive Vice President and Chief Financial Officer of FMC Technologies, Inc., a leading global provider of technology solutions for the energy industry, since March 2014. As CFO, Ms. Seaman is responsible for overall financial management of FMC Technologies, its financial reporting and transparency, and for multiple corporate functions. Before being appointed to her current role, she served as Senior Vice President and CFO from 2011 to early 2014. Prior to that, she was Treasurer, and Vice President and Deputy Chief Financial Officer. Before joining FMC Technologies in 1986, Ms. Seaman served as Finance Manager for
Mr. Williams has served as President and Chief Executive Officer, and a director of Domtar Corporation, a leading designer, manufacturer and marketer of fiber-based products including communication papers, specialty and packaging papers and absorbent hygiene products, since joining the company in 2009. From 2000 to 2008, Mr. Williams served in senior executive positions with SCA Packaging Ltd. and SCA Packaging Europe, among Europe’s largest producers of containerboard paper used for the manufacturing of corrugated box products. During this period, he served as President of SCA Packaging Europe, from 2005 to 2008, and as regional managing director for the company’s U.K. and Ireland operations from 2000 to 2005. Prior to joining SCA Packaging, Mr. Williams held a number of increasingly senior positions in sales, marketing, management and operations with Rexam PLC; Packaging Resources, Inc.; Huhtamaki; Alberto Culver (U.K.) Ltd.; and MARS Group.
Mr. Blake retired in 2002 as Chairman, President, and Chief Executive Officer of Comdisco, Inc. Previously he held the same position with Promus Hotel Corporation, USF&G Corporation, Heller International Corporation as well as Chief Executive Officer and General Secretary of the United States Olympic Committee. Also, he had previously been Executive Vice President—Financing Operations of the General Electric Credit Corporation, General Electric Company. He is the recipient of the degree of Economics honoris causa from Purdue University as well as Masters and Bachelor degrees. He has also been awarded the Ellis Island Medal of Honor.
January 18, 2016 CFA Research Challenge
15 | P a g e
Appendix 3:
Source: Company filings, Team Analysis
Strengths
Opportunities
Weaknesses
Threats
Owens Corning SWOT Analysis
January 18, 2016 CFA Research Challenge
16 | P a g e
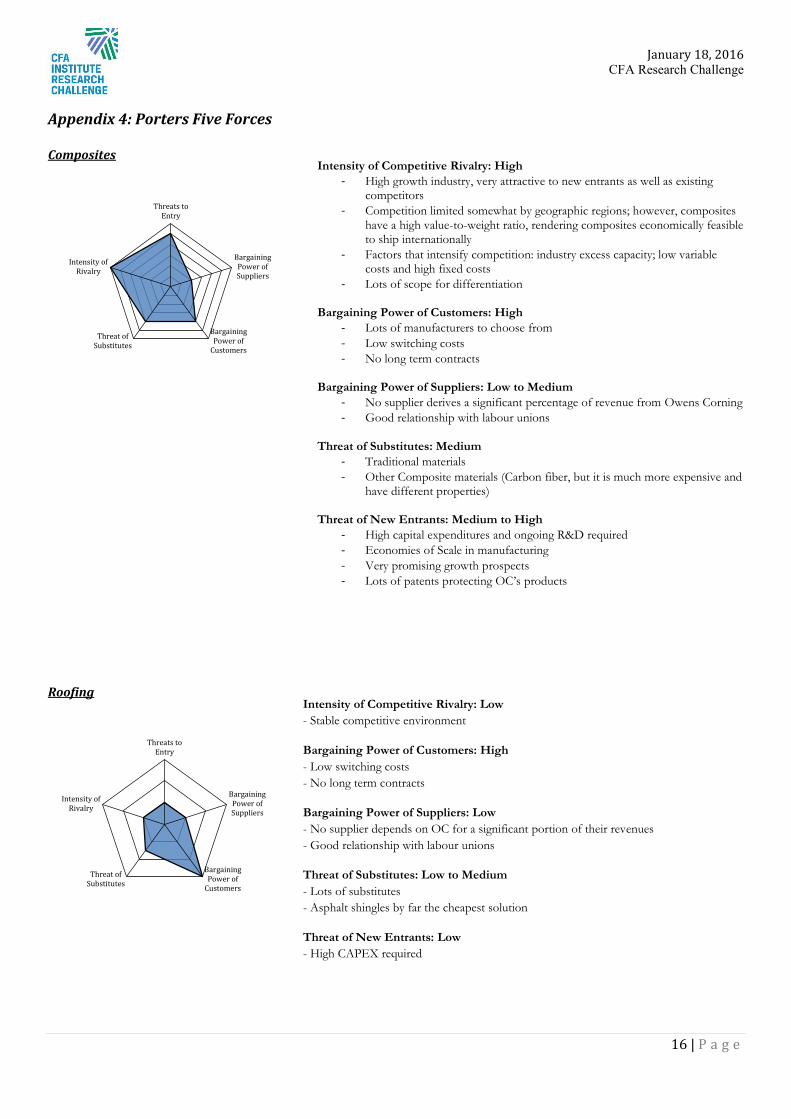
Appendix 4: Porters Five Forces Composites
Roofing
Threats toEntry
BargainingPower ofSuppliers
BargainingPower of
Customers
Threat ofSubstitutes
Intensity ofRivalry
Threats toEntry
BargainingPower ofSuppliers
BargainingPower of
Customers
Threat ofSubstitutes
Intensity ofRivalry
Intensity of Competitive Rivalry: Low - Stable competitive environment
Bargaining Power of Customers: High - Low switching costs - No long term contracts
Bargaining Power of Suppliers: Low - No supplier depends on OC for a significant portion of their revenues - Good relationship with labour unions
Threat of Substitutes: Low to Medium - Lots of substitutes - Asphalt shingles by far the cheapest solution
Threat of New Entrants: Low - High CAPEX required
Intensity of Competitive Rivalry: High - High growth industry, very attractive to new entrants as well as existing
competitors - Competition limited somewhat by geographic regions; however, composites
have a high value-to-weight ratio, rendering composites economically feasible to ship internationally
- Factors that intensify competition: industry excess capacity; low variable costs and high fixed costs
- Lots of scope for differentiation Bargaining Power of Customers: High
- Lots of manufacturers to choose from - Low switching costs - No long term contracts
Bargaining Power of Suppliers: Low to Medium
- No supplier derives a significant percentage of revenue from Owens Corning - Good relationship with labour unions
Threat of Substitutes: Medium
- Traditional materials - Other Composite materials (Carbon fiber, but it is much more expensive and
have different properties) Threat of New Entrants: Medium to High
- High capital expenditures and ongoing R&D required - Economies of Scale in manufacturing - Very promising growth prospects - Lots of patents protecting OC’s products
January 18, 2016 CFA Research Challenge
17 | P a g e
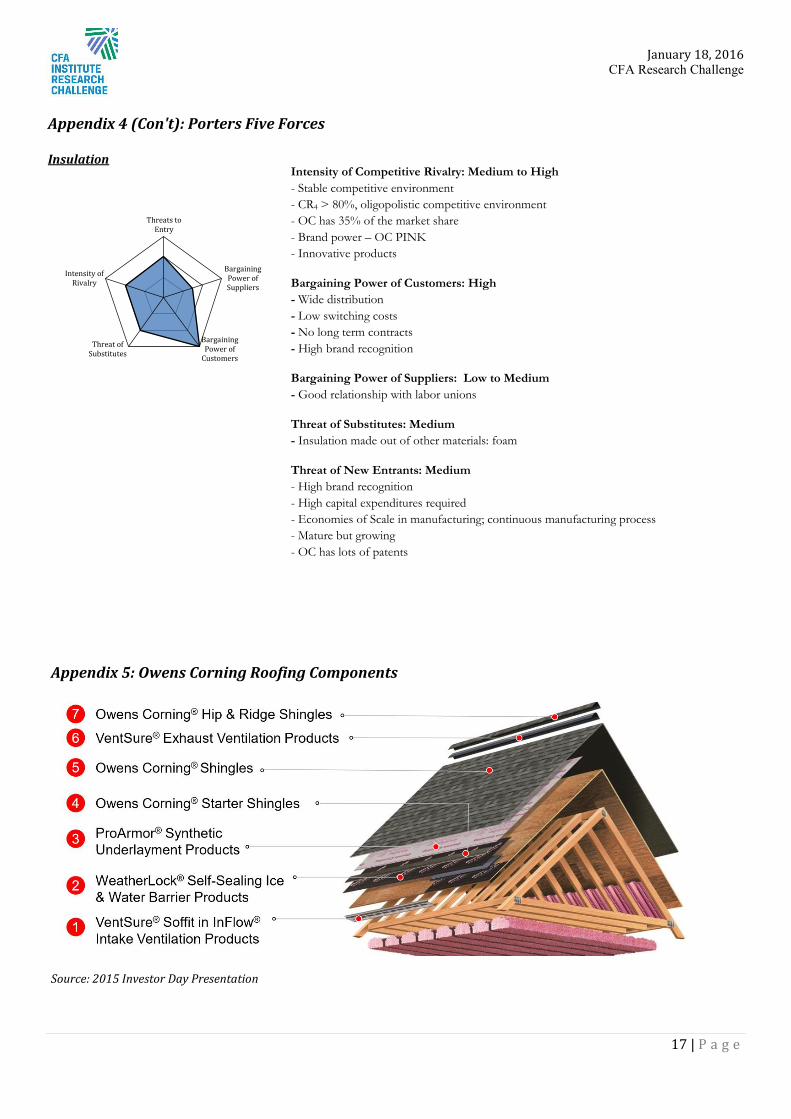
Appendix 4 (Con't): Porters Five Forces Insulation
Intensity of Competitive Rivalry: Medium to High - Stable competitive environment - CR4 > 80%, oligopolistic competitive environment - OC has 35% of the market share - Brand power – OC PINK - Innovative products
Bargaining Power of Customers: High - Wide distribution - Low switching costs - No long term contracts - High brand recognition
Bargaining Power of Suppliers: Low to Medium - Good relationship with labor unions
Threat of Substitutes: Medium - Insulation made out of other materials: foam
Threat of New Entrants: Medium - High brand recognition - High capital expenditures required - Economies of Scale in manufacturing; continuous manufacturing process - Mature but growing - OC has lots of patents
Threats toEntry
BargainingPower ofSuppliers
BargainingPower of
Customers
Threat ofSubstitutes
Intensity ofRivalry
Appendix 5: Owens Corning Roofing Components
Source: 2015 Investor Day Presentation
January 18, 2016 CFA Research Challenge
18 | P a g e
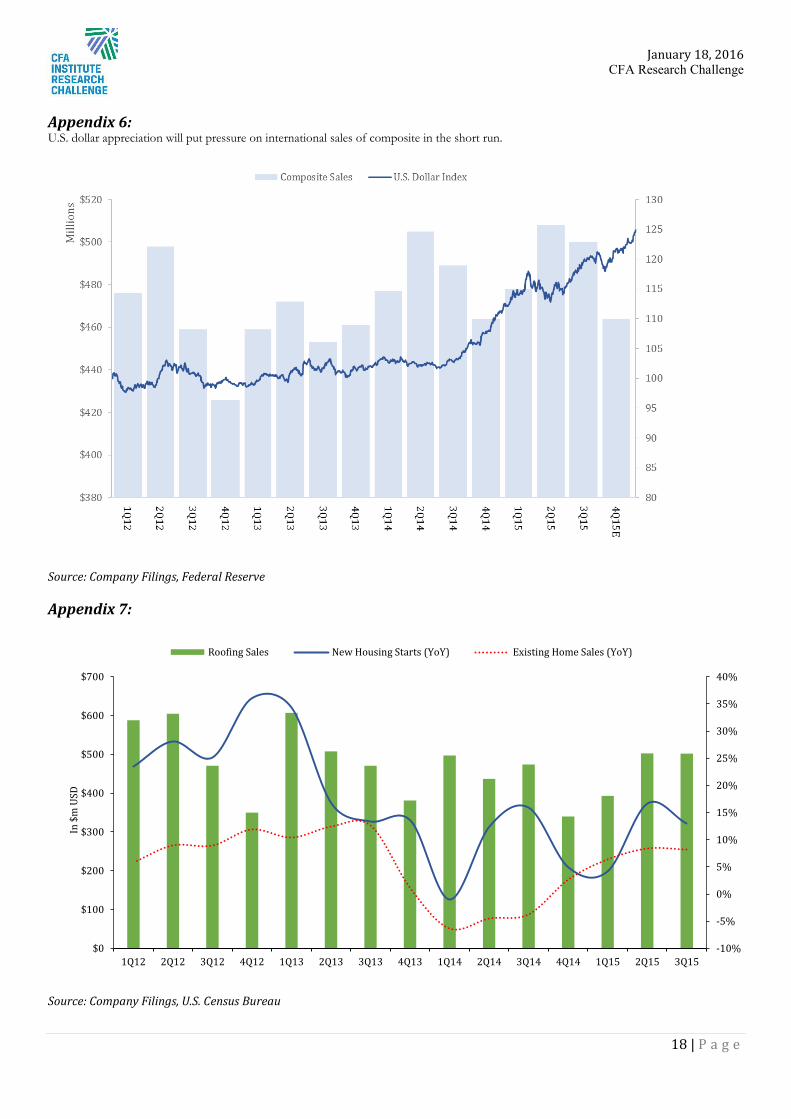
Appendix 6: U.S. dollar appreciation will put pressure on international sales of composite in the short run.
Source: Company Filings, Federal Reserve
Appendix 7:
Source: Company Filings, U.S. Census Bureau
-10%
-5%
0%
5%
10%
15%
20%
25%
30%
35%
40%
$0
$100
$200
$300
$400
$500
$600
$700
1Q12 2Q12 3Q12 4Q12 1Q13 2Q13 3Q13 4Q13 1Q14 2Q14 3Q14 4Q14 1Q15 2Q15 3Q15
In $
m U
SD
Roofing Sales New Housing Starts (YoY) Existing Home Sales (YoY)
January 18, 2016 CFA Research Challenge
19 | P a g e
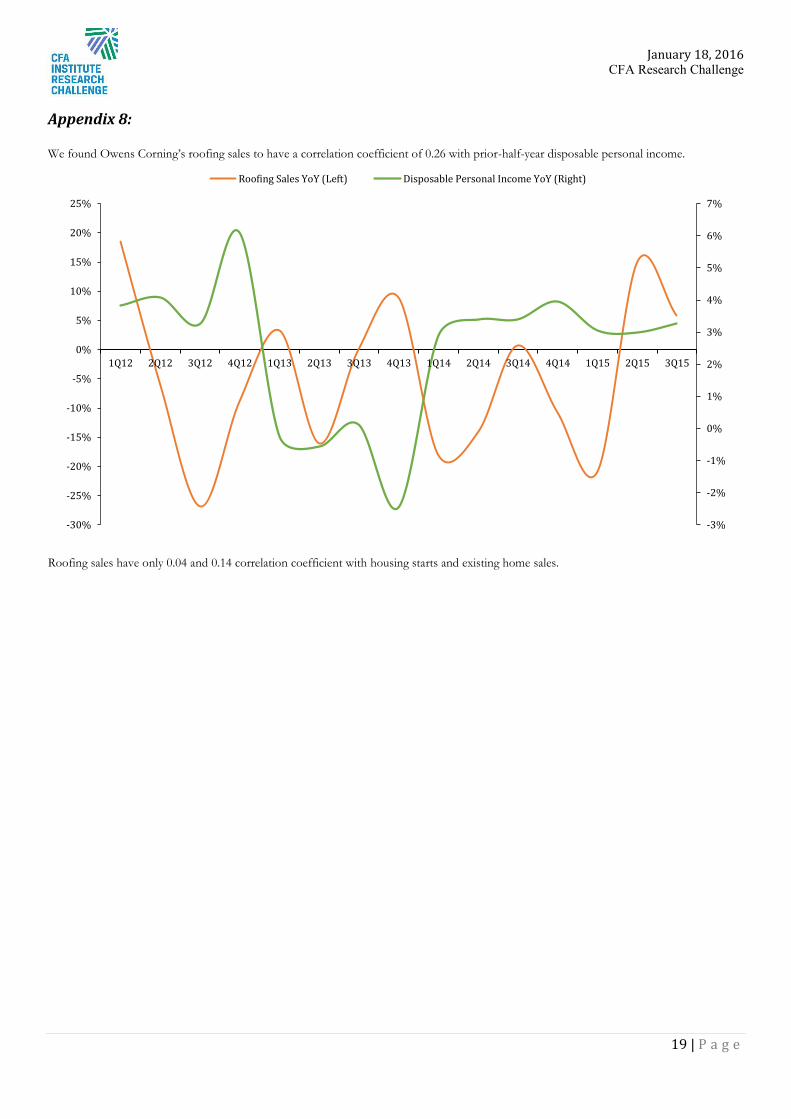
Appendix 8: We found Owens Corning’s roofing sales to have a correlation coefficient of 0.26 with prior-half-year disposable personal income.
Roofing sales have only 0.04 and 0.14 correlation coefficient with housing starts and existing home sales.
-3%
-2%
-1%
0%
1%
2%
3%
4%
5%
6%
7%
-30%
-25%
-20%
-15%
-10%
-5%
0%
5%
10%
15%
20%
25%
1Q12 2Q12 3Q12 4Q12 1Q13 2Q13 3Q13 4Q13 1Q14 2Q14 3Q14 4Q14 1Q15 2Q15 3Q15
Roofing Sales YoY (Left) Disposable Personal Income YoY (Right)
January 18, 2016 CFA Research Challenge
20 | P a g e
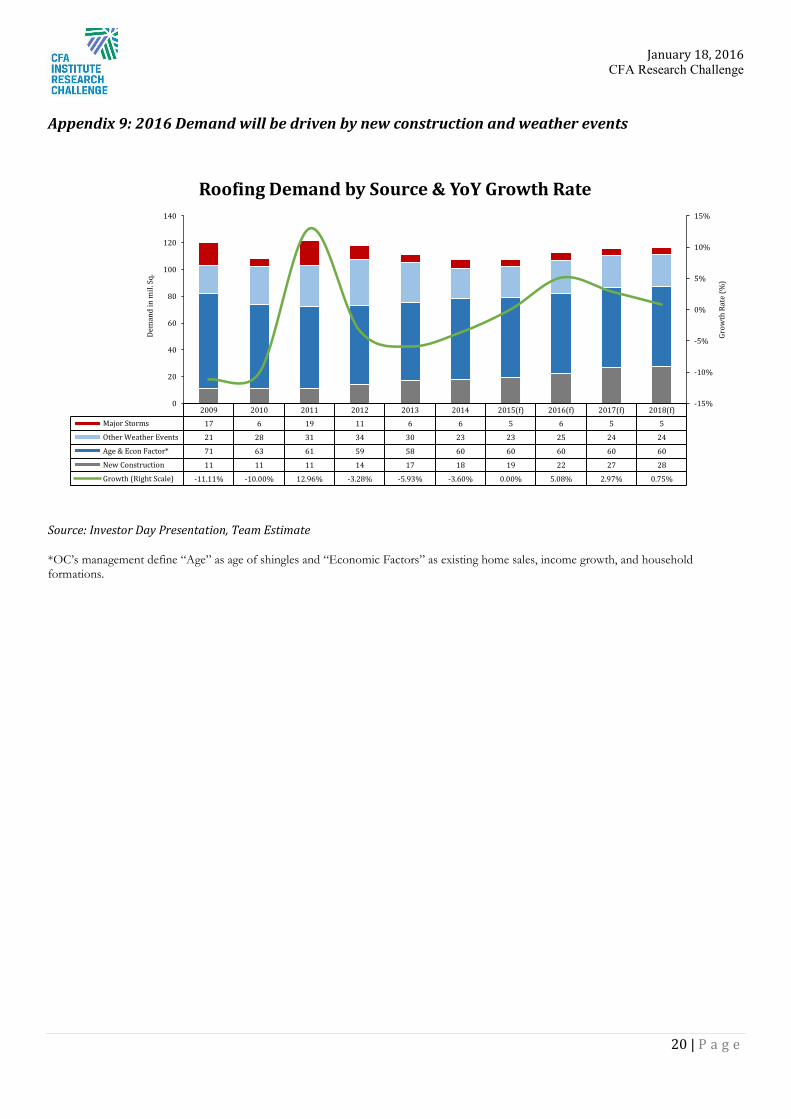
Appendix 9: 2016 Demand will be driven by new construction and weather events
Source: Investor Day Presentation, Team Estimate
*OC’s management define “Age” as age of shingles and “Economic Factors” as existing home sales, income growth, and household formations.
2009 2010 2011 2012 2013 2014 2015(f) 2016(f) 2017(f) 2018(f)Major Storms 17 6 19 11 6 6 5 6 5 5
Other Weather Events 21 28 31 34 30 23 23 25 24 24
Age & Econ Factor* 71 63 61 59 58 60 60 60 60 60
New Construction 11 11 11 14 17 18 19 22 27 28
Growth (Right Scale) -11.11% -10.00% 12.96% -3.28% -5.93% -3.60% 0.00% 5.08% 2.97% 0.75%
-15%
-10%
-5%
0%
5%
10%
15%
0
20
40
60
80
100
120
140
Grow
th R
ate
(%)
Dem
and
in m
il. S
q.
Roofing Demand by Source & YoY Growth Rate
January 18, 2016 CFA Research Challenge
21 | P a g e
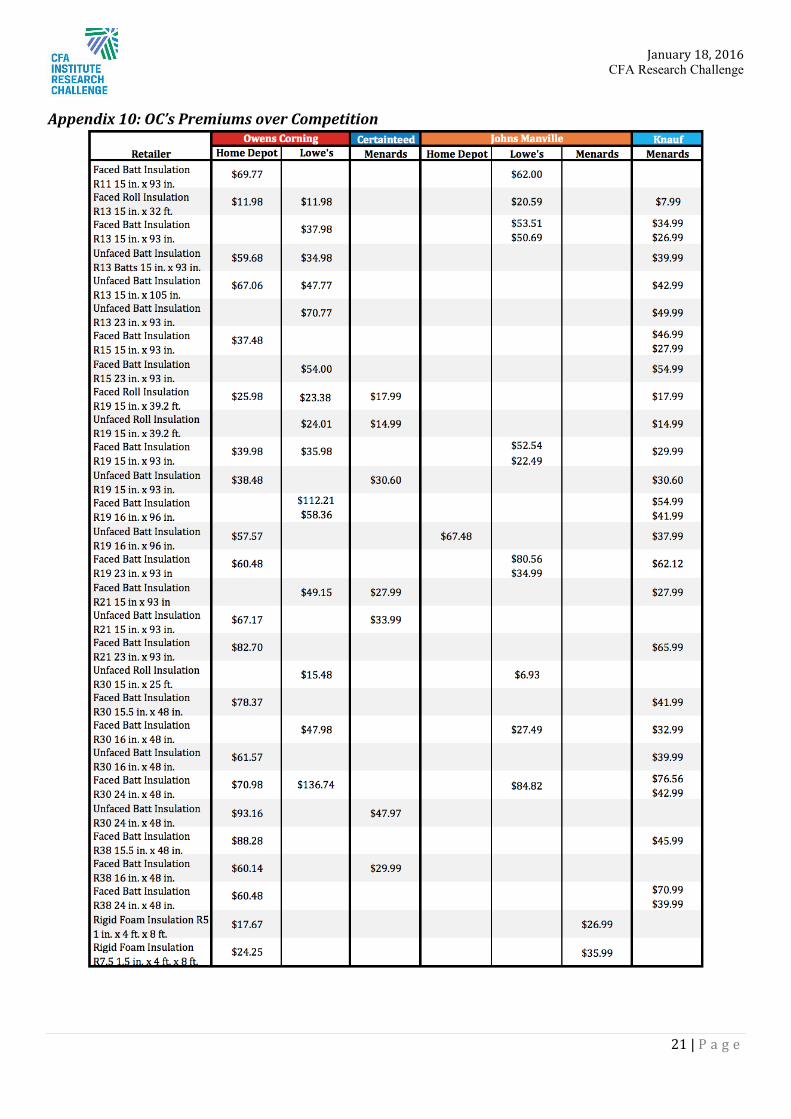
Appendix 10: OC’s Premiums over Competition

January 18, 2016 CFA Research Challenge
22 | P a g e
Appendix 10 (Con’t):

January 18, 2016 CFA Research Challenge
23 | P a g e
$250
$300
$350
$400
$450
$500
$550
10 11 12 13 14 15 16 17
Mill
ions
Unit in Millions
Existing Home Sales versus Owens Corning Insulation Sales
$250
$300
$350
$400
$450
$500
$550
100 150 200 250 300 350
Mill
ions
Unit in Thousands
New Housing Started versus Owens Corning Insulation Sales
Appendix 11: Owens Corning’s insulation sales have 0.81 correlation with housing starts and 0.69 with existing home sales.
Housing starts and existing home sales function as good coincident indicators of insulation sales.
Source: Company Filings, U.S. Census Bureau, Federal Reserve
$331 $340
$384 $413
$330
$415 $431
$466
$355
$447 $454
$490
$379
$451
$502
-10%
-5%
0%
5%
10%
15%
20%
25%
30%
35%
40%
$0
$100
$200
$300
$400
$500
$600
1Q12 2Q12 3Q12 4Q12 1Q13 2Q13 3Q13 4Q13 1Q14 2Q14 3Q14 4Q14 1Q15 2Q15 3Q15
Mill
ions
Insulation Sales New Housing Starts (YoY) Existing Home Sales (YoY)
January 18, 2016 CFA Research Challenge
24 | P a g e
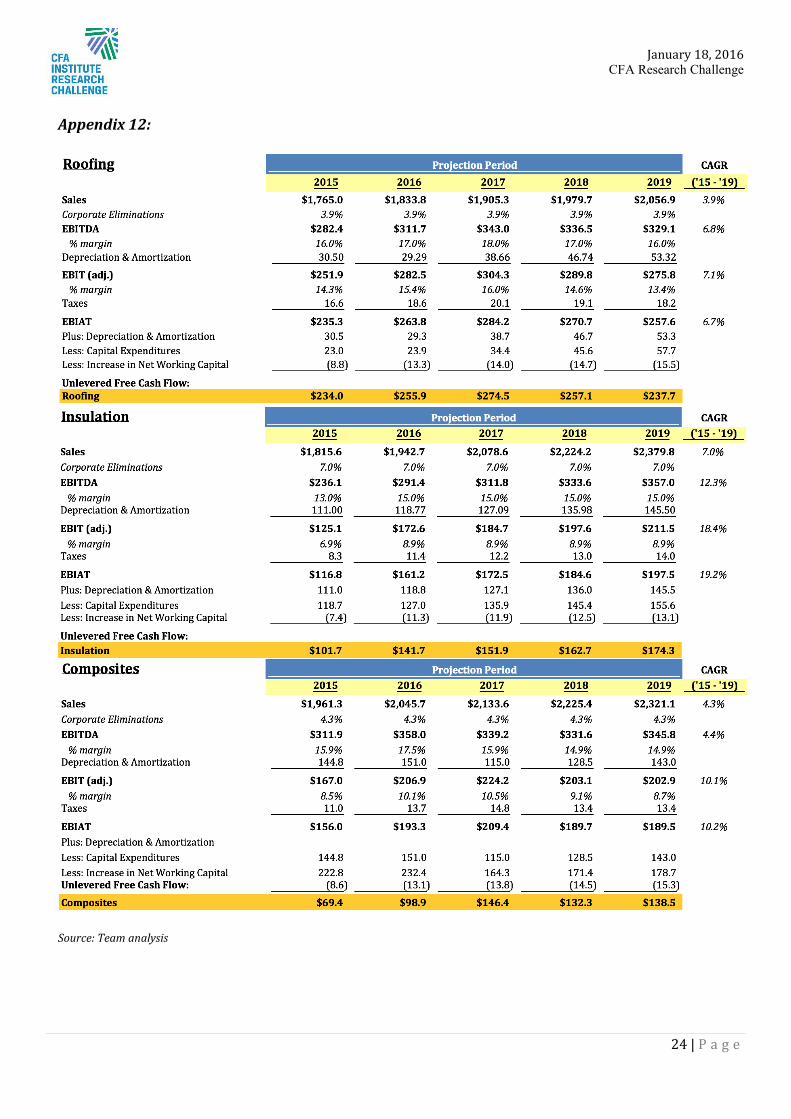
Appendix 12:
Source: Team analysis
January 18, 2016 CFA Research Challenge
25 | P a g e
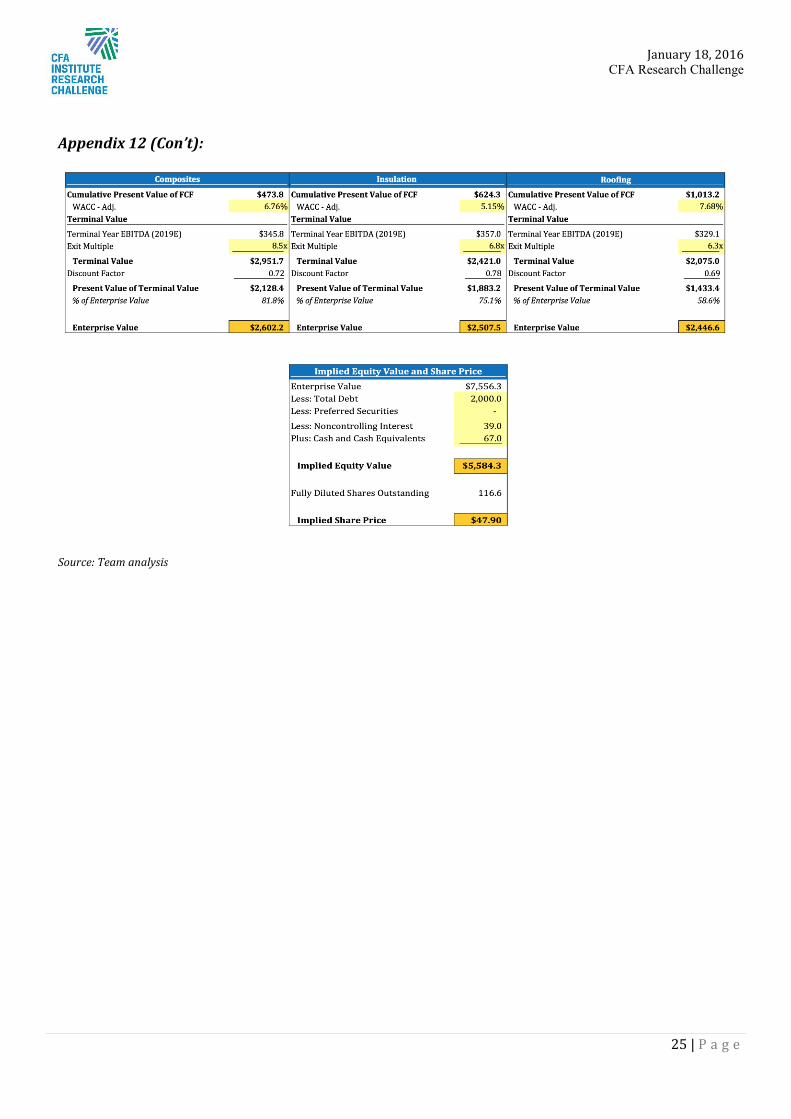
Appendix 12 (Con’t):
Source: Team analysis
January 18, 2016 CFA Research Challenge
26 | P a g e
Appendix 13A: Three Statement Valuation
January 18, 2016 CFA Research Challenge
27 | P a g e
Appendix 13B:
January 18, 2016 CFA Research Challenge
28 | P a g e
Appendix 13C:
January 18, 2016 CFA Research Challenge
29 | P a g e
Appendix 13D:
January 18, 2016 CFA Research Challenge
30 | P a g e
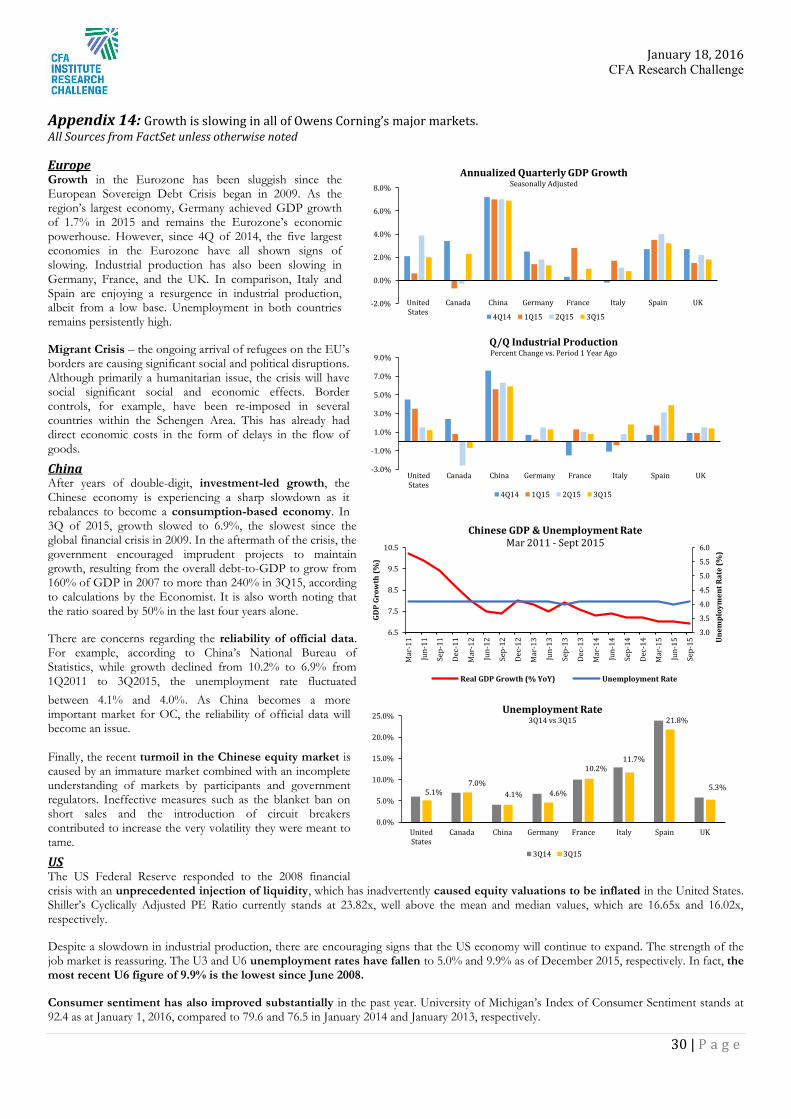
Appendix 14: Growth is slowing in all of Owens Corning’s major markets. All Sources from FactSet unless otherwise noted
Europe Growth in the Eurozone has been sluggish since the European Sovereign Debt Crisis began in 2009. As the region’s largest economy, Germany achieved GDP growth of 1.7% in 2015 and remains the Eurozone’s economic powerhouse. However, since 4Q of 2014, the five largest economies in the Eurozone have all shown signs of slowing. Industrial production has also been slowing in Germany, France, and the UK. In comparison, Italy and Spain are enjoying a resurgence in industrial production, albeit from a low base. Unemployment in both countries remains persistently high.
Migrant Crisis – the ongoing arrival of refugees on the EU’s borders are causing significant social and political disruptions. Although primarily a humanitarian issue, the crisis will have social significant social and economic effects. Border controls, for example, have been re-imposed in several countries within the Schengen Area. This has already had direct economic costs in the form of delays in the flow of goods.
China After years of double-digit, investment-led growth, the Chinese economy is experiencing a sharp slowdown as it rebalances to become a consumption-based economy. In 3Q of 2015, growth slowed to 6.9%, the slowest since the global financial crisis in 2009. In the aftermath of the crisis, the government encouraged imprudent projects to maintain growth, resulting from the overall debt-to-GDP to grow from 160% of GDP in 2007 to more than 240% in 3Q15, according to calculations by the Economist. It is also worth noting that the ratio soared by 50% in the last four years alone.
There are concerns regarding the reliability of official data. For example, according to China’s National Bureau of Statistics, while growth declined from 10.2% to 6.9% from 1Q2011 to 3Q2015, the unemployment rate fluctuated between 4.1% and 4.0%. As China becomes a more important market for OC, the reliability of official data will become an issue. Finally, the recent turmoil in the Chinese equity market is caused by an immature market combined with an incomplete understanding of markets by participants and government regulators. Ineffective measures such as the blanket ban on short sales and the introduction of circuit breakers contributed to increase the very volatility they were meant to tame.
US The US Federal Reserve responded to the 2008 financial crisis with an unprecedented injection of liquidity, which has inadvertently caused equity valuations to be inflated in the United States. Shiller’s Cyclically Adjusted PE Ratio currently stands at 23.82x, well above the mean and median values, which are 16.65x and 16.02x, respectively.
Despite a slowdown in industrial production, there are encouraging signs that the US economy will continue to expand. The strength of the job market is reassuring. The U3 and U6 unemployment rates have fallen to 5.0% and 9.9% as of December 2015, respectively. In fact, the most recent U6 figure of 9.9% is the lowest since June 2008.
Consumer sentiment has also improved substantially in the past year. University of Michigan’s Index of Consumer Sentiment stands at 92.4 as at January 1, 2016, compared to 79.6 and 76.5 in January 2014 and January 2013, respectively.
3.0
3.5
4.0
4.5
5.0
5.5
6.0
6.5
7.5
8.5
9.5
10.5
Mar
-11
Jun-
11
Sep-
11
Dec-
11
Mar
-12
Jun-
12
Sep-
12
Dec-
12
Mar
-13
Jun-
13
Sep-
13
Dec-
13
Mar
-14
Jun-
14
Sep-
14
Dec-
14
Mar
-15
Jun-
15
Sep-
15 Une
mpl
oym
ent R
ate
(%)
GDP
Grow
th (%
)
Chinese GDP & Unemployment Rate Mar 2011 - Sept 2015
Real GDP Growth (% YoY) Unemployment Rate
-3.0%
-1.0%
1.0%
3.0%
5.0%
7.0%
9.0%
UnitedStates
Canada China Germany France Italy Spain UK
Q/Q Industrial Production Percent Change vs. Period 1 Year Ago
4Q14 1Q15 2Q15 3Q15
-2.0%
0.0%
2.0%
4.0%
6.0%
8.0%
UnitedStates
Canada China Germany France Italy Spain UK
Annualized Quarterly GDP Growth Seasonally Adjusted
4Q14 1Q15 2Q15 3Q15
5.1% 7.0%
4.1% 4.6%
10.2% 11.7%
21.8%
5.3%
0.0%
5.0%
10.0%
15.0%
20.0%
25.0%
UnitedStates
Canada China Germany France Italy Spain UK
Unemployment Rate 3Q14 vs 3Q15
3Q14 3Q15