Hartlepool Borough and NRF Survey 2006 Bobby Duffy, Deputy Managing Director Leon Page, Senior...
73
Hartlepool Borough and NRF Survey 2006 Bobby Duffy, Deputy Managing Director Leon Page, Senior Research Executive Ipsos MORI Social Research Institute
-
Upload
ellie-haws -
Category
Documents
-
view
217 -
download
0
Transcript of Hartlepool Borough and NRF Survey 2006 Bobby Duffy, Deputy Managing Director Leon Page, Senior...

Hartlepool Borough and NRF Survey 2006
Bobby Duffy,Deputy Managing DirectorLeon Page,Senior Research ExecutiveIpsos MORI Social Research Institute

2
Introductions
Ipsos MORI – formerly MORI – UK’s second largest research company work across all social policy areas, as well as private sector research political polling less than 2% of our work Regeneration and Planning 3rd/4th largest area
Regeneration Research Unit – range of research: national evaluations of government programmes (eg NDC, Neighbourhood
Wardens, SRB, City Challenge etc) local area work for individual regeneration partnerships (over 100), including
previous work for Hartlepool NDC and 2004 survey across Hartlepool Borough and NRF
planning work and consulting residents stakeholder surveys

3
Bobby Duffy – Head of Ipsos MORI Regeneration Research Unit for 8 years overseeing just about all national evaluations and local area work
Leon Page – Senior Research Executive, overseeing NDC National Evaluation Household Survey, as well as work for individual partnerships
Introductions

4
Why Survey Research?
Focusing on survey research today - which has range of uses…
WHY
identify local priorities
indication of views on performance
customer/service user satisfaction
evaluation/monitoring
WHEN
before formulating policy - helps with development stage
during and after to monitor/evaluate

5
Advantages of survey research “Hard” data Statistically reliable Easier to justify decisions with hard data? Easily reproducible - can measure changes over
time Residents want it … but only if acted upon…
Why Survey Research?

6
32%
39%
40%
41%
52%
55%
62%
81%
-33%
-33%
-27%
-26%
-19%
-24%
-11%
-6%
Base: All respondents (1545)
Opinion surveys
% Support
Local referendum
Residents groups
Neighbourhood Forums
% Oppose
Ward Advisor Board
Elections for Mayor
Council meeting
Ward committee
People do want to be consulted

7
0%
29%
21%
23%
11%
69%
38%
37%
29%
Base: 1016 Dover residents
Keep you informed
Q Which are the most important for local District Councillors to do?
Support the local community
Deal with complaints
Listen to the views of local people
Attend local Council meetings
Represent local Council meetings
Attend open meetings with local residents
Hold surgeries for people with problems
Don’t know
…because they see it as way to be listened to

8
But need to see action…
Consultation fatigue a real problem, particularly in regeneration areas – seen in NDC study
Show us something, do something about it, not just consultation
Don’t just listen to us and that’s the end of the story, but take all the information and actually do something about it so we see what’s happening and we know we’ve been heard – don’t keep it all behind closed doors

9
Survey Design
Hartlepool survey combines Total sample of c1,250 interviews in Hartlepool – large, reliable sample NRF sample c900, including 400 in the NDC c350 interviews in wider Hartlepool to make up total and for comparison allows us to look at various sub-areas
Interviews conducted face-to-face in-home with residents 16+ between May and November 2006, strictly randomly selected
20 minute interview, drawing on NDC main questionnaire and other national studies
… and questionnaire from similar study in 2004
Will highlight “statistically significant” differences and change – but careful with interpretation of findings from sub-areas

10
Wider comparisons
Three types of other information used to provide context to study… NDC Comparator Survey: 3 x 39 wards in same
districts as NDCs, with similar deprivation scores but not bordering. Very useful comparison for NRF areas too?
National Benchmarks from our own and national government surveys
Local government normative database (on service satisfaction)

11
Some of the main messages we’ll see…
NRF area residents have relatively low qualifications, are less likely to be in work and have low incomesSatisfaction with accommodation and area relatively high in Hartlepool overallBut particular problems with drugs, litter, dogs, teenagers hanging around…but significant progress on rundown properties, car crime, burglary, vandalism, drugs (although still way to go)Feelings of influence and involvement relatively lowBut feelings of safety have increased more in NRF area than Hartlepool as a whole Improvements in community/youth facilities?Health a particular challenge in NRF area, particularly smoking levels

12
Malcolm Walker on NDC

13
Main findings from NRF and Hartlepool Borough
survey

14
Contents
1. Who lives in the area?
2. Satisfaction with homes and the area, including key problems
3. Community and involvement
4. Crime and safety
5. Local services
6. Health

15
1. Who lives in the area?

16
10%
21%
15%
25%
28%
9%
28%
21%
27%
14%
11%
23%
17%
27%
21%
15%
24%
18%
14%
27%
Significantly lower levels of qualifications in NRF area
NRF Aggregate ComparatorHartlepool Borough
Level 1 or below
Level 4+
National
Highest Qualifications – NVQ Level Equivalents – Working Age
Level 2
Level 3
No quals
Base: c1,250 adults in Hartlepool, May-November 2006

17
10%
21%
15%
25%
28%
9%
28%
21%
27%
14%
11%
23%
17%
27%
21%
15%
24%
18%
14%
27%
NRF Aggregate ComparatorHartlepool Borough
Level 1 or below
Level 4+
National
Highest Qualifications – NVQ Level Equivalents – Working Age
Level 2
Level 3
No quals
Base: c1,250 adults in Hartlepool, May-November 2006
Significantly lower levels of qualifications in NRF area

18
49%
7%
7%
20%
11%
6%
48%
5%
9%
23%
10%
5%
39%
8%
13%
24%
12%
4%
NRF residents less likely to be in work and more likely to be sick or disabled
NRF Aggregate ComparatorHartlepool Borough
In paid work
Unemployed
Sick or disabled
Retired
QW01 Which of the statements on this card apply to you?
At home/not seeking work
Full-time education
Base: c1,250 adults in Hartlepool, May-November 2006

19
70%
19%
12%
53%
33%
12%
44%
39%
15%
Base: c1,250 adults in Hartlepool, May-November 2006
NRF area has fewer home-owners…
NRF AggregateHartlepool Borough
Owner occupier
Social renter
Private renter
National
Burbank 70% Social rented
20
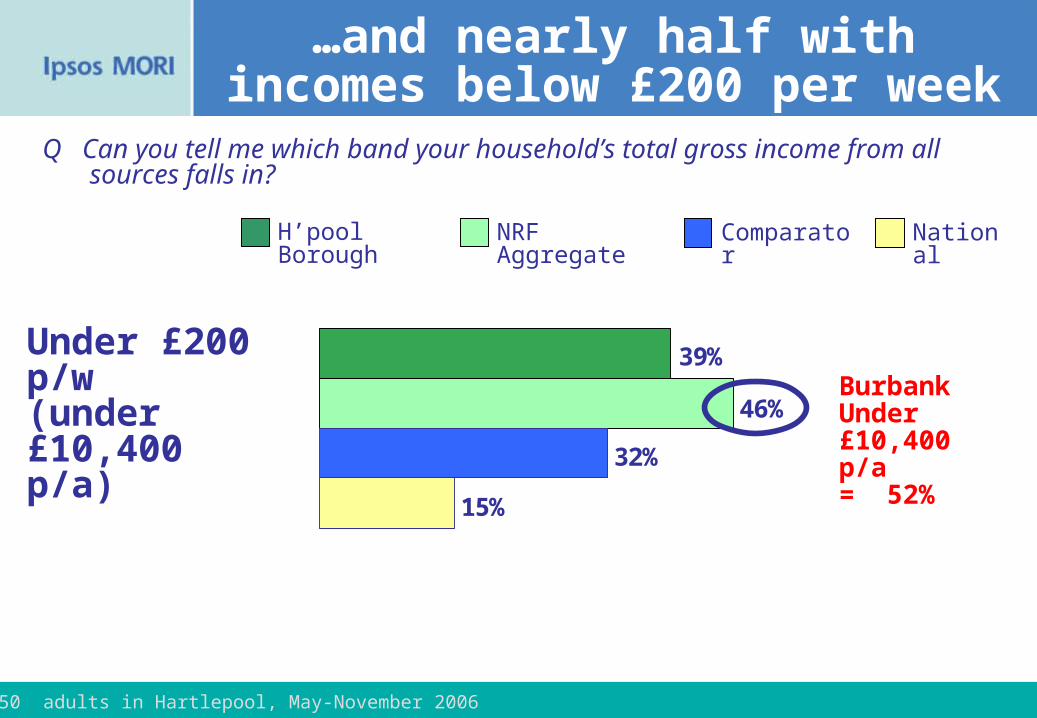
…and nearly half with incomes below £200 per week
Under £200 p/w (under £10,400 p/a) 32%
15%
39%
46%
Q Can you tell me which band your household’s total gross income from all sources falls in?
BurbankUnder £10,400 p/a = 52%
ComparatorNRF Aggregate NationalH’pool Borough
Base: c1,250 adults in Hartlepool, May-November 2006

21
2. Satisfaction with Home and Area

22
% Verysatisfied
% Slightly dissatisfied
% Very dissatisfied
% Fairlysatisfied
Very high levels of satisfaction with accommodation…
68
58
50
58
25
32
39
33
3
4
3
3
4
5
4
2
3
3
2
2
QHO3 Taking everything into account, how satisfied are you with your accommodation?
Comparator
NRF Aggregate
Hartlepool Borough
National
% Neither/nor
Dyke House/JacksonVery Satisfied 49%
Base: c1,250 adults in Hartlepool, May-November 2006

23
% Verysatisfied
% Slightly dissatisfied
% Very dissatisfied
% Fairlysatisfied
…which have not really changed
68
68
57
58
50
50
27
25
34
32
38
39
2
3
3
4
3
3
5
4
5
5
1
2
2
3
4
3
2
1
QHO3 Taking everything into account, how satisfied are you with your accommodation?
Comparator
NRF Aggregate
Hartlepool Borough
2004
2006
2004
2006
2006
% Net change
-3
-1
% Neither/nor
2004
Base: c1,250 adults in Hartlepool, May-November 2006
+2

24
% Verysatisfied
% Slightly dissatisfied
% Very dissatisfied
% Fairlysatisfied
Satisfaction with area not quite as high overall, but similar to other areas…
43
32
27
48
40
46
46
39
7
5
7
9
10
6
5
7
8
3
8
5
QQL1 Taking everything into account, how satisfied are you with this area as a place to live?
Comparator
NRF Aggregate
Hartlepool Borough
National
% Neither/ nor
Very satisfiedDyke House/Jackson 21%
NDC 21%
Base: c1,250 adults in Hartlepool, May-November 2006

25
% Verysatisfied
% Slightly dissatisfied
% Very dissatisfied
% Fairlysatisfied
…and some positive change in NRF area
42
43
29
32
26
27
41
40
46
46
45
46
5
9
8
7
7
10
9
13
10
5
5
8
7
7
8
7
5
7
QQL1 Taking everything into account, how satisfied are you with this area as a place to live?
Comparator
NRF Aggregate
Hartlepool Borough
2004
2006
2004
2006
2004
2006
% change
0
+6
% Neither/ nor
Base: c1,250 adults in Hartlepool, May-November 2006
+2

26
Also looked at range of possible problems in
area…

27
11%
20%
6%
8%
14%
5%
16%
17%
4%
17%
23%
6%
Dogs, litter and neighbours…
NRF Aggregate ComparatorHartlepool Borough
Dogs causing nuisance or mess
Litter and rubbish in the streets
Problems with neighbours
National
QQL3 I would like you to tell me whether each of the following is a problem in this area?
% SERIOUS problem
A
B
C
Base: c1,250 adults in Hartlepool, May-November 2006
NDC 11%
Owton 10%
NDC 37%
Owton 37%
Rossmere 8%
NDC 25%

28
11%
20%
6%
8%
14%
5%
16%
17%
4%
17%
23%
6%
Dogs, litter and neighbours…
NRF Aggregate ComparatorHartlepool Borough
Dogs causing nuisance or mess
Litter and rubbish in the streets
Problems with neighbours
National
QQL3 I would like you to tell me whether each of the following is a problem in this area?
% serious problemChange
%
+3-1-1
n/a
-2-4-8
n/a
-2-2-1
n/a
A
B
C
Base: c1,250 adults in Hartlepool, May-November 2006

29
4%
19%
13%
20%
6%
19%
9%
10%
22%
15%
NRF Aggregate ComparatorHartlepool Borough
Run down properties
Speed/volume of traffic
Poor quality/lack of parks and open spaces
National
QQL3 I would like you to tell me whether each of the following is a problem in this area?
% serious problem
D
F
G
Run-down properties, traffic and parks
Base: c1,250 adults in Hartlepool, May-November 2006
LOTS of variation eg…Rift House/Burn Valley
Rossmere positiveDyke House/Jackson
negative
Burbank 4%
NDC 34%
Dyke House/Jackson 22%
NDC 29%

30
4%
19%
13%
20%
6%
19%
9%
10%
22%
15%
NRF Aggregate ComparatorHartlepool Borough
Run down properties
Speed/volume of traffic
Poor quality/lack of parks and open spaces
National
QQL3 I would like you to tell me whether each of the following is a problem in this area?
% serious problemChange
%
-4-8-3
-2-2-7
n/a
-4
-3
D
F
G
Run-down properties, traffic and parks
Base: c1,250 adults in Hartlepool, May-November 2006
-6

31
5%
13%
9%
10%
7%
9%
5%
7%
13%
7%
NRF Aggregate ComparatorHartlepool Borough
Poor public transport
Vandalism, graffiti and other deliberate damage to property
Household burglary
National
QQL3 I would like you to tell me whether each of the following is a problem in this area?
% serious problem
Burbank 16%
North H’pool 14%
Public transport, vandalism and burglary
H
I
L
Base: c1,250 adults in Hartlepool, May-November 2006
Dyke House/Jackson 12%
NDC 18%
North H’pool 18%
Owton 19%

32
5%
13%
9%
10%
7%
9%
5%
7%
13%
7%
NRF Aggregate ComparatorHartlepool Borough
Poor public transport
Vandalism, graffiti and other deliberate damage to property
Household burglary
National
QQL3 I would like you to tell me whether each of the following is a problem in this area?
% serious problem2004
%
+2+3-3
-4-7-6
-6-9-6
Public transport, vandalism and burglary
H
I
L
Base: c1,250 adults in Hartlepool, May-November 2006
n/a

33
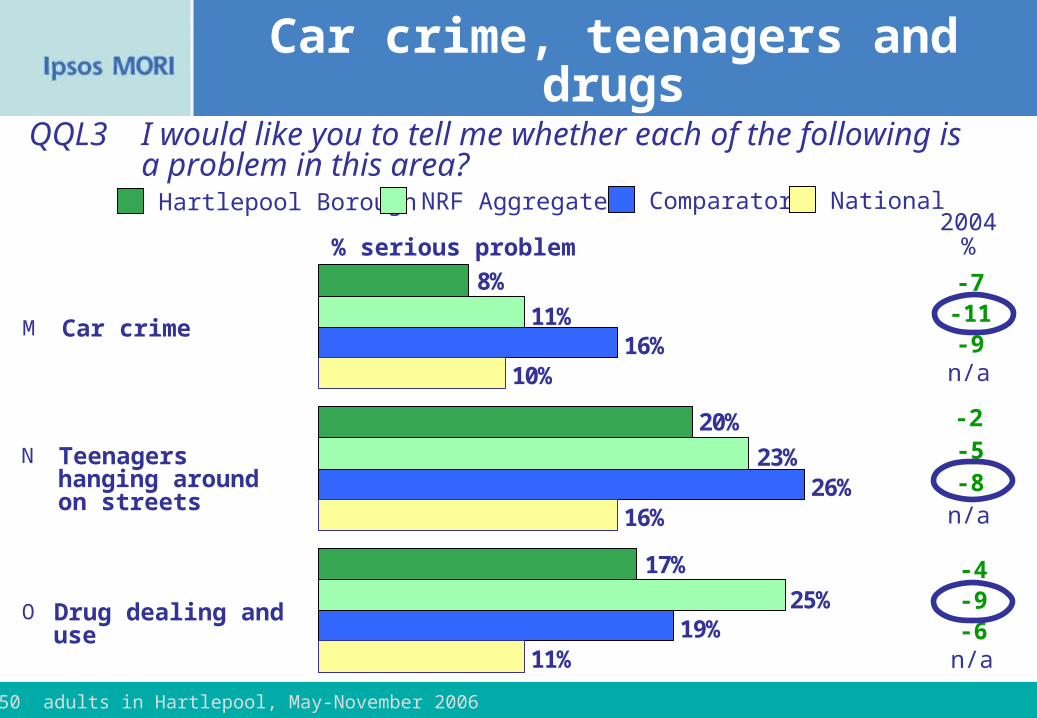
16%
26%
19%
10%
16%
11%
8%
20%
17%
11%
23%
25%
NRF Aggregate ComparatorHartlepool Borough
Car crime
Teenagers hanging around on streets
Drug dealing and use
National
QQL3 I would like you to tell me whether each of the following is a problem in this area?
% serious problem
Owton 23%
Car crime, teenagers and drugs
M
N
O
Base: c1,250 adults in Hartlepool, May-November 2006
NDC 40%
Owton 42%
Owton 40%
34
16%
26%
19%
10%
16%
11%
8%
20%
17%
11%
23%
25%
NRF Aggregate ComparatorHartlepool Borough
Car crime
Teenagers hanging around on streets
Drug dealing and use
National
QQL3 I would like you to tell me whether each of the following is a problem in this area?
% serious problem2004
%
-7-11-9
-2-5-8
-4-9-6
Car crime, teenagers and drugs
M
N
O
Base: c1,250 adults in Hartlepool, May-November 2006
n/a
n/a
n/a

35
3. Community and involvement

36
Half feel part of the local community, slightly lower in NRF…
Great deal/fair amount 45%
54%
54%
45%
Q Overall, to what extent do you feel part of the local community?
Rossmere 57%
ComparatorNRF Aggregate NationalH’pool Borough
Base: c1,250 adults in Hartlepool, May-November 2006
Similar to 2004

37
Feelings of influence also slightly lower in NRF area…
Yes25%
34%
28%
23%
Q And do you feel you can influence decisions that affect your area?
ComparatorNRF Aggregate NationalH’pool Borough
Owton 15%
Rossmere 16%
Base: c1,250 adults in Hartlepool, May-November 2006
Also similar to 2004

38
…and active involvement lower in Hartlepool than nationally…
Yes12%
23%
14%
13%
Q Have you been involved in any local organisation on a voluntary basis over the last three years (i.e. work for which you are not paid, except for expenses)?
North H’pool 21%
ComparatorNRF Aggregate NationalH’pool Borough
Base: c1,250 adults in Hartlepool, May-November 2006
Again, same as 2004

39
But does involvement matter…?

40
Aston
Finsbury
Preston Road
Kensington
Kings Norton
Radford
ABCD
R2 = 0.0038
0
10
20
30
40
45 50 55 60 65 70 75 80 85
Satisfaction with area 2004 (%)
Levels of involvement 2004 (%)
Base: All NDC areas Source: Ipsos MORI
Involvement vs satisfaction with area in NDC areas in 2004
Hartlepool

41
Aston
Finsbury
Preston Road
Kensington
Kings Norton
Radford
ABCD
R2 = 0.0038
0
10
20
30
40
45 50 55 60 65 70 75 80 85
Satisfaction with area 2004 (%)
Levels of involvement 2004 (%)
Base: All NDC areas Source: Ipsos MORI
Involvement vs satisfaction with area in NDC areas in 2004
Hartlepool NDC

42
…but influence does?

43
Marsh Farm Seven Sisters
Devonport
Thornhill
Burngreave
R2 = 0.2584
-10
0
10
-5 0 5 10 15
Change in perceived quality of life 2002-2004 (%)
Base: All NDC areas
Change in influence vs change in perceived quality of life 2002-2004
Change in influence 2002-2004 (%)
Source: Ipsos MORI
Hartlepool NDC

44
4. Crime and safety

45
Feeling safe in the area…
Unsafe41%
30%
34%
38%
Q How safe do you feel walking alone in or around this area after dark? Would you say you feel…?
ComparatorNRF Aggregate NationalH’pool Borough
Owton 48%
NDC 47%
Dyke House/Jackson 47%
Base: c1,250 adults in Hartlepool, May-November 2006
Feelings of safety similar to 2004

46
BUT most positive change in NRF area…
More safe14%
23%
Q Would you say this area is more or less safe, or about as safe as three years ago?
Burbank 40%
NRF AggregateH’pool Borough
Base: c1,250 adults in Hartlepool, May-November 2006

47
Police rated slightly below national average, particularly in NRF...
Satisfied
62%
13%
55%
21%
48%
18%
Q And how satisfied are you with the quality of the service provided by the police?
Burbank73% Satisfied
Dissatisfied
NationalNRF AggregateH’pool Borough
Base: c1,250 adults in Hartlepool, May-November 2006
No change in satisfaction, BUT dissatisfaction gone down, particularly in NRF (from 29%)

48
5. Local services

49
Satisfaction with sports clubs/facilities similar in NRF, but higher than national
Satisfied74%
16%
76%
14%
Q Using this card, I would like you to tell me how satisfied or dissatisfied you are with the quality of each in this area… Sports clubs/facilities
Burbank 33% dissatisfiedDissatisfied
NRF AggregateH’pool Borough
Base: c1,250 adults in Hartlepool, May-November 2006
Ipsos MORI Normative database – average satisfaction score = 64%

50
Youth and community centres also similar across area, but much higher than national
Satisfied74%
18%
74%
16%
Q Using this card, I would like you to tell me how satisfied or dissatisfied you are with the quality of each in this area… Youth and community centres
Dissatisfied
NRF AggregateH’pool Borough
Base: c1,250 adults in Hartlepool, May-November 2006
Base sizes too small for reliable trends, but suggestion improved?
Ipsos MORI Normative database – average satisfaction score = 39%

51
Public parks/open spaces on par with national, but large variations by area
Satisfied73%
22%
68%
28%
Q Using this card, I would like you to tell me how satisfied or dissatisfied you are with the quality of each in this area… Public parks/open spaces
Dyke House/Jackson47% dissatisfied
Dissatisfied
NRF AggregateH’pool Borough
Rossmere85% satisfied
Rift House/ Burn Valley94% satisfied
Base: c1,250 adults in Hartlepool, May-November 2006
Ipsos MORI Normative database – average satisfaction score = 76%

52
Children’s play areas less well rated, but similar to national
Satisfied57%
36%
51%
44%
Q Using this card, I would like you to tell me how satisfied or dissatisfied you are with the quality of each in this area… Children’s play areas
Dyke House/Jackson59% dissatisfied
Dissatisfied
NRF AggregateH’pool Borough
Base: c1,250 adults in Hartlepool, May-November 2006
Ipsos MORI Normative database – average satisfaction score = 60%

53
6. Health

54
Overall rating of health slightly lower in NRF…
Good48%
60%
50%
43%
Q Over the last 12 months, would you say that your health has on the whole been good, fairly good, or not good?
ComparatorNRF Aggregate NationalH’pool Borough
No change over time – and fairly consistent by area
Base: c1,250 adults in Hartlepool, May-November 2006

55
…and long-term limiting illness higher…
23%
18%
25%
31%
Base: x,xxx British adults, fieldwork dates
Q All with long term illness which limits their activities
ComparatorNRF Aggregate NationalH’pool Borough
Yes
No real change across areas

56
19%
12%
28%
25%
16%
22%
11%
27%
24%
16%
23%
13%
26%
21%
16%
…even though age profile similar to national (even slightly younger)
NRF Aggregate NationalHartlepool Borough
Under 16
16 - 24
25 - 44
45 - 64
65+
Base: c1,250 adults in Hartlepool, May-November 2006

57
Healthy eating low in NRF area…
Never15%
22%
Q Can you tell me how often, on average, you eat five portions of fruit or vegetables in a day?
ComparatorNRF AggregateH’pool Borough
Base: c1,250 adults in Hartlepool, May-November 2006
Small decreases in never – from 25% in NRF and 19% in Hartlepool
14%

58
…and smoking a major issue
Yes31%
25%
31%
42%
Q Do you smoke cigarettes at all nowadays?
ComparatorNRF Aggregate NationalH’pool Borough
Owton 50%
Burbank 49%
Base: c1,250 adults in Hartlepool, May-November 2006
No real headway since 2004 – Hartlepool down from 34% and NRF down from 44%

59
Summary

60
SummaryNRF area residents have relatively low qualifications, are less likely to be in work and have low incomesSatisfaction with accommodation and area relatively high in Hartlepool overallBut particular problems with drugs, litter, dogs, teenagers hanging around…but significant progress on rundown properties, car crime, burglary, vandalism, drugs (although still way to go)Feelings of influence and involvement relatively lowBut feelings of safety have increased more in NRF area than Hartlepool as a whole Improvements in community/youth facilities?Health a particular challenge in NRF area, particularly smoking levels

62
Why Research
People want to be consulted!
People want range of methods – surveys, focus groups, workshops, juries, video projects etc
But mostly people want someone to come to them:
“It would be good to go round to each individual home and ask people what improvements they would like to make”
“If only they didn’t bombard us with so much paper and actually sent people out to talk to us”

63
Qualitative Research
Quantitative is who, when and where etc.
Qualitative is what, where, when, who, why, how - NOT HOW MANY
Concerned with understanding rather than measuring Depth Detail Context Creative Attitudes and beliefs
Consider conducting after quantitative study …

64
Health Issues
Anxiety/problems with nerves/depression/ stress 0%
18%
21%
Q And finally, does any member of your household have any of these health problems on this card? Just read out the letters that apply
RossmereAnxiety, etc22%
ComparatorNRF Aggregate NationalH’pool Borough
NDCAnxiety, etc23%
OwtonAnxiety, etc29%
Base: c1,250 adults in Hartlepool, May-November 2006

65
Income
State benefits or allowances (incl. all benefits, tax credits and state pensions) 0%
0%
48%
62%
Base: x,xxx British adults, fieldwork dates
QFI1 Do you personally receive income from any of the following? Just read out the letters that apply
ComparatorNRF Aggregate NationalH’pool Borough

66
Quality of life
90%
87%
82%
90%
86%
85%
83%
2006
2004% Good
QQL2 If we were to define “quality of life” as how you feel overall about your life, including your standard of living, your surroundings, friendships and how you feel day-to-day, how would you rate your quality of life?
Comparator
NRF Aggregate
Hartlepool Borough
National
Very goodNDC 22%
Base: c1,250 adults in Hartlepool, May-November 2006

67
14%
9%
11%
NRF Aggregate ComparatorHartlepool Borough
Disturbance from crowds and gangs or hooliganism
National
QQL3 I would like you to tell me whether each of the following is a problem in this area?
% serious problem2004
%
101516
Serious problem
Dyke House/Jackson 17%Owton 20%
Problems ?
Q
Base: c1,250 adults in Hartlepool, May-November 2006

68
Bar chart – version 2
Agree
80%
20%
61%
11%
60%
15%
QNEW HAR1 Do you agree or disagree that this local area (within 15/20 minutes walking distance) is a place where people from different backgrounds get on well together?
Dyke House/JacksonDisagree22%
Disagree
NationalNRF AggregateH’pool Borough
NDCDisagree26%
Base: c1,250 adults in Hartlepool, May-November 2006

69
Bar chart – version 2
In paid work0%
0%
48%
52%
39%
61%
QW01 Which of the statements on this card apply to each person aged 16 years and over in the household? Please select as many as apply and just read out the letters.
OwtonFull-time education10%
Unemployed, disabled/long term sick, retired, full time education
ComparatorNRF Aggregate NationalH’pool Borough
RossmereRetired38%
Base: c1,250 adults in Hartlepool, May-November 2006

70
12%
25%
38%
26%
9%
26%
39%
25%
12%
26%
38%
24%
Base: x,xxx British adults, fieldwork dates
QHO6 When did you personally move to this address?
Less than 1 year
1 yr/less than 5 yrs
5 yrs/less than 20 yrs
20 yrs or more
NRF Aggregate ComparatorHartlepool Borough
Very similar length of residence at address to comparator areas…
Overall, no major change from 2004

71
8%
13%
34%
45%
6%
16%
31%
48%
8%
15%
31%
47%
Base: x,xxx British adults, fieldwork dates
…and same with area
NRF Aggregate ComparatorHartlepool Borough
Less than 1 year
1 yr/less than 5 yrs
5 yrs/less than 20 yrs
20 yrs or more
Q And when did you move to this address?
Rossmere 62% 20 yrs+
Again, overall, no major change from 2004

72
19%
12%
28%
25%
16%
22%
11%
27%
24%
16%
23%
13%
26%
21%
16%
Age profile similar to national
NRF Aggregate NationalHartlepool Borough
Under 16
16 - 24
25 - 44
45 - 64
65+
Base: c1,250 adults in Hartlepool, May-November 2006

73
19%
12%
28%
25%
16%
22%
11%
27%
24%
16%
23%
13%
26%
21%
16%
Age profile similar to national
NRF Aggregate NationalHartlepool Borough
Under 16
16 - 24
25 - 44
45 - 64
65+
Base: c1,250 adults in Hartlepool, May-November 2006
Rossmere 28% 65+