
H1490
54
Complex Service Delivery Processes
description
H1490
Transcript of H1490

Complex Service Delivery Processes
H1490_Harvey.indd 1 7/9/15 8:35 AM

Also available from ASQ Quality Press:
Outcomes, Performance, Structure: Three Keys to Organizational ExcellenceMichael E. Gallery and Stephen C. Carey
Process Improvement Simplified: A How-to Book for Success in any OrganizationJames B. King, Francis G. King, and Michael W. R. Davis
Business Process Improvement Toolbox, Second EditionBjørn Andersen
Continuous Permanent ImprovementArun Hariharan
The Quality Toolbox, Second EditionNancy R. Tague
Root Cause Analysis: Simplified Tools and Techniques, Second EditionBjørn Andersen and Tom Fagerhaug
The Certified Six Sigma Green Belt Handbook, Second EditionRoderick A. Munro, Govindarajan Ramu, and Daniel J. Zrymiak
The Certified Manager of Quality/Organizational Excellence Handbook, Fourth EditionRussell T. Westcott, editor
The Certified Six Sigma Black Belt Handbook, Second EditionT.M. Kubiak and Donald W. Benbow
The ASQ Auditing Handbook, Fourth EditionJ.P. Russell, editor
The ASQ Quality Improvement Pocket Guide: Basic History, Concepts, Tools, and RelationshipsGrace L. Duffy, editor
The ASQ Supply Chain Management PrimerASQ’s Customer-Supplier Division and J.P. Russell, editor
To request a complimentary catalog of ASQ Quality Press publications, call 800-248-1946, or visit our website at http://www.asq.org/quality-press.
H1490_Harvey.indd 2 7/15/15 10:22 AM

Complex Service Delivery Processes
Strategy to Operations
Third Edition
Jean Harvey, PhD
ASQ Quality PressMilwaukee, Wisconsin
H1490_Harvey.indd 3 7/9/15 8:35 AM

American Society for Quality, Quality Press, Milwaukee 53203© 2015 by ASQAll rights reserved. Printed in the United States of America20 19 18 17 16 15 5 4 3 2 1
Library of Congress Cataloging-in-Publication DataHarvey, Jean, 1950– Complex service delivery processes : strategy to operations / Jean Harvey. — Third edition. pages cm Includes bibliographical references and index. ISBN 978-0-87389-916-1 (alk. paper) I. Service industries—Management. 2. Organizational effectiveness. 3. Industrial efficiency. 4. Business planning. I. Title. HD9980.5.H375 2015 658—dc23 2015020874
No part of this book may be reproduced in any form or by any means, electronic, mechanical, photocopying, recording, or otherwise, without the prior written permission of the publisher.
Publisher: Lynelle KorteAcquisitions Editor: Matt MeinholzManaging Editor: Paul Daniel O’MaraProduction Administrator: Randall Benson
ASQ Mission: The American Society for Quality advances individual, organizational, and community excellence worldwide through learning, quality improvement, and knowledge exchange.
Attention Bookstores, Wholesalers, Schools, and Corporations: ASQ Quality Press books, video, audio, and software are available at quantity discounts with bulk purchases for business, educational, or instructional use. For information, please contact ASQ Quality Press at 800-248-1946, or write to ASQ Quality Press, P.O. Box 3005, Milwaukee, WI 53201–3005.
To place orders or to request a free copy of the ASQ Quality Press Publications Catalog, visit our website at http://www.asq.org/quality-press.
Printed on acid-free paper
H1490_Harvey.indd 4 7/9/15 8:35 AM

To my wife and lifetime companion Carole, to my daughters Eve Julie and Marie-Claude, and to my grandchildren Charlotte, Malcom, Arthur, Nellie, Rosie, and Sofia,
listed here in their order of appearance in my life, which they have incrementally transformed from a black-and-white feature into a multicolored, high-definition,
4-D, emotionally rich, and deeply satisfying one.
H1490_Harvey.indd 5 7/9/15 8:35 AM

H1490_Harvey.indd 6 7/9/15 8:35 AM

vii
Table of Contents
List of Figures and Tables . . . . . . . . . . . . . . . . . . . . . . . . . . . . . . . . . . . . . . . . . . . . . . . . . xiList of Videos . . . . . . . . . . . . . . . . . . . . . . . . . . . . . . . . . . . . . . . . . . . . . . . . . . . . . . . . . . . xixMajor Abbreviations . . . . . . . . . . . . . . . . . . . . . . . . . . . . . . . . . . . . . . . . . . . . . . . . . . . . . xxiForeword . . . . . . . . . . . . . . . . . . . . . . . . . . . . . . . . . . . . . . . . . . . . . . . . . . . . . . . . . . . . . . xxiiiPreface to the Third Edition . . . . . . . . . . . . . . . . . . . . . . . . . . . . . . . . . . . . . . . . . . . . . . . xxvPreface to the First Edition . . . . . . . . . . . . . . . . . . . . . . . . . . . . . . . . . . . . . . . . . . . . . . . . xxviiAcknowledgments . . . . . . . . . . . . . . . . . . . . . . . . . . . . . . . . . . . . . . . . . . . . . . . . . . . . . . . xxxiii
Part I The Conceptual Framework Linking Strategy and Operations . . . . . . . . . . . . . . . . . . . . . . . . . . . . . . . . . . . . . . . . . . . . . . . . . . . . . . . . . 1
Chapter 1 Toward Value and Strategic Advantage through Rigorous Execution . . . . . . . . . . . . . . . . . . . . . . . . . . . . . . . . . . . . . . . . . . . . . . . . . . . . . . . . . . 31.1 The Execution Challenge and the Need for Rigor . . . . . . . . . . . . . . . . . . . 31.2 Whether You Are Rolling, Flying, or Sailing, Good Processes Are
Required for a Smooth Ride . . . . . . . . . . . . . . . . . . . . . . . . . . . . . . . . . . . . . . 51.3 The Dimensions of the Learning Organization . . . . . . . . . . . . . . . . . . . . . . 101.4 Managing Processes in Complex Services . . . . . . . . . . . . . . . . . . . . . . . . . . 211.5 Structure of the Book . . . . . . . . . . . . . . . . . . . . . . . . . . . . . . . . . . . . . . . . . . . . 231.6 How to Use the Book . . . . . . . . . . . . . . . . . . . . . . . . . . . . . . . . . . . . . . . . . . . . 251.7 Summary . . . . . . . . . . . . . . . . . . . . . . . . . . . . . . . . . . . . . . . . . . . . . . . . . . . . . . 28Exercises . . . . . . . . . . . . . . . . . . . . . . . . . . . . . . . . . . . . . . . . . . . . . . . . . . . . . . . . . . 28Notes . . . . . . . . . . . . . . . . . . . . . . . . . . . . . . . . . . . . . . . . . . . . . . . . . . . . . . . . . . . . . 30
Chapter 2 The Nature of Value . . . . . . . . . . . . . . . . . . . . . . . . . . . . . . . . . . . . . . . . 312.1 Quality of Service . . . . . . . . . . . . . . . . . . . . . . . . . . . . . . . . . . . . . . . . . . . . . . . 322.2 The Customer Value Equation . . . . . . . . . . . . . . . . . . . . . . . . . . . . . . . . . . . . 412.3 Positioning in Professional Services . . . . . . . . . . . . . . . . . . . . . . . . . . . . . . . 452.4 Positioning in the Labor Market . . . . . . . . . . . . . . . . . . . . . . . . . . . . . . . . . . 562.5 Managing the Shareholder Value Equation—EVA . . . . . . . . . . . . . . . . . . . 622.6 Summary . . . . . . . . . . . . . . . . . . . . . . . . . . . . . . . . . . . . . . . . . . . . . . . . . . . . . . 63Exercises . . . . . . . . . . . . . . . . . . . . . . . . . . . . . . . . . . . . . . . . . . . . . . . . . . . . . . . . . . 63Notes . . . . . . . . . . . . . . . . . . . . . . . . . . . . . . . . . . . . . . . . . . . . . . . . . . . . . . . . . . . . . 67
Chapter 3 The Nature of Processes . . . . . . . . . . . . . . . . . . . . . . . . . . . . . . . . . . . . . 693.1 What Is a Process? . . . . . . . . . . . . . . . . . . . . . . . . . . . . . . . . . . . . . . . . . . . . . . 693.2 Exploring the Process Space . . . . . . . . . . . . . . . . . . . . . . . . . . . . . . . . . . . . . . 903.3 Chain of Commitment . . . . . . . . . . . . . . . . . . . . . . . . . . . . . . . . . . . . . . . . . . . 97
H1490_Harvey.indd 7 7/9/15 8:35 AM

viii Table of Contents
3.4 Processes: At the Heart of Value Creation and Learning . . . . . . . . . . . . . . 1033.5 Summary . . . . . . . . . . . . . . . . . . . . . . . . . . . . . . . . . . . . . . . . . . . . . . . . . . . . . . 108Exercises . . . . . . . . . . . . . . . . . . . . . . . . . . . . . . . . . . . . . . . . . . . . . . . . . . . . . . . . . . 108Notes . . . . . . . . . . . . . . . . . . . . . . . . . . . . . . . . . . . . . . . . . . . . . . . . . . . . . . . . . . . . . 110
Chapter 4 Think Globally, Act Locally . . . . . . . . . . . . . . . . . . . . . . . . . . . . . . . . . 1114.1 Business Model and Strategy in Professional Services . . . . . . . . . . . . . . . . 1114.2 Service Strategy: The Process Connection . . . . . . . . . . . . . . . . . . . . . . . . . . 1194.3 Better Understanding Processes to Ensure Strategic Fit . . . . . . . . . . . . . . . 1284.4 The Learning Organization . . . . . . . . . . . . . . . . . . . . . . . . . . . . . . . . . . . . . . . 1374.5 Summary . . . . . . . . . . . . . . . . . . . . . . . . . . . . . . . . . . . . . . . . . . . . . . . . . . . . . . 139Exercises . . . . . . . . . . . . . . . . . . . . . . . . . . . . . . . . . . . . . . . . . . . . . . . . . . . . . . . . . . 140Notes . . . . . . . . . . . . . . . . . . . . . . . . . . . . . . . . . . . . . . . . . . . . . . . . . . . . . . . . . . . . . 144
Chapter 5 Professional Service Delivery Processes . . . . . . . . . . . . . . . . . . . . . . 1455.1 Classifying Professional Services . . . . . . . . . . . . . . . . . . . . . . . . . . . . . . . . . . 1455.2 The Professional Service Experience . . . . . . . . . . . . . . . . . . . . . . . . . . . . . . . 1485.3 Leadership and Respect at the Moment of Truth . . . . . . . . . . . . . . . . . . . . 1515.4 Delivering the Professional Service Experience . . . . . . . . . . . . . . . . . . . . . 1535.5 Three Short Cases . . . . . . . . . . . . . . . . . . . . . . . . . . . . . . . . . . . . . . . . . . . . . . . 1625.6 Summary . . . . . . . . . . . . . . . . . . . . . . . . . . . . . . . . . . . . . . . . . . . . . . . . . . . . . . 172Exercises . . . . . . . . . . . . . . . . . . . . . . . . . . . . . . . . . . . . . . . . . . . . . . . . . . . . . . . . . . 172
Part II Methodologies and Techniques to Achieve Operational Excellence . . . . . . . . . . . . . . . . . . . . . . . . . . . . . . . . . . . . . . . . . . . . 173
Chapter 6 Managing a Process . . . . . . . . . . . . . . . . . . . . . . . . . . . . . . . . . . . . . . . . . 1756.1 Variation and Process Control . . . . . . . . . . . . . . . . . . . . . . . . . . . . . . . . . . . . 1756.2 Process Control—A Systems View . . . . . . . . . . . . . . . . . . . . . . . . . . . . . . . . . 1846.3 Process Control in Professional Services . . . . . . . . . . . . . . . . . . . . . . . . . . . . 1886.4 Summary . . . . . . . . . . . . . . . . . . . . . . . . . . . . . . . . . . . . . . . . . . . . . . . . . . . . . . 205Exercises . . . . . . . . . . . . . . . . . . . . . . . . . . . . . . . . . . . . . . . . . . . . . . . . . . . . . . . . . . 206Note . . . . . . . . . . . . . . . . . . . . . . . . . . . . . . . . . . . . . . . . . . . . . . . . . . . . . . . . . . . . . . 208
Chapter 7 Connecting Value to Processes: The Techniques . . . . . . . . . . . . . . . 2097.1 Selecting the Right Process . . . . . . . . . . . . . . . . . . . . . . . . . . . . . . . . . . . . . . . 2107.2 Identify Processes and Evaluate Their Impact on Key Metrics . . . . . . . . . 2117.3 Select Processes on the Basis of Salience and Performance . . . . . . . . . . . . 2147.4 Process Mission: A Hinge between Strategy and Operation . . . . . . . . . . . 2207.5 Scoping a Process for Improvement or Design . . . . . . . . . . . . . . . . . . . . . . 2227.6 Summary . . . . . . . . . . . . . . . . . . . . . . . . . . . . . . . . . . . . . . . . . . . . . . . . . . . . . . 238Exercises . . . . . . . . . . . . . . . . . . . . . . . . . . . . . . . . . . . . . . . . . . . . . . . . . . . . . . . . . . 239Notes . . . . . . . . . . . . . . . . . . . . . . . . . . . . . . . . . . . . . . . . . . . . . . . . . . . . . . . . . . . . . 240
Chapter 8 The Learning Cycle and the Kaizen Event . . . . . . . . . . . . . . . . . . . . . 2418.1 The Learning Cycle: “Moving” Processes . . . . . . . . . . . . . . . . . . . . . . . . . . 2418.2 Process Problems . . . . . . . . . . . . . . . . . . . . . . . . . . . . . . . . . . . . . . . . . . . . . . . 2438.3 Change Vehicles . . . . . . . . . . . . . . . . . . . . . . . . . . . . . . . . . . . . . . . . . . . . . . . . 2478.4 The Kaizen Event . . . . . . . . . . . . . . . . . . . . . . . . . . . . . . . . . . . . . . . . . . . . . . . 2498.5 The Match . . . . . . . . . . . . . . . . . . . . . . . . . . . . . . . . . . . . . . . . . . . . . . . . . . . . . 260
H1490_Harvey.indd 8 7/9/15 8:35 AM

Table of ConTenTs ix
8.6 Conclusion . . . . . . . . . . . . . . . . . . . . . . . . . . . . . . . . . . . . . . . . . . . . . . . . . . . . 261Exercises . . . . . . . . . . . . . . . . . . . . . . . . . . . . . . . . . . . . . . . . . . . . . . . . . . . . . . . . . . 262Notes . . . . . . . . . . . . . . . . . . . . . . . . . . . . . . . . . . . . . . . . . . . . . . . . . . . . . . . . . . . . . 262
Chapter 9 Doing Things Better: Improving an Existing Process . . . . . . . . . . . 2639.1 High- Level View of the Improvement Methodology . . . . . . . . . . . . . . . . . 2639.2 Background . . . . . . . . . . . . . . . . . . . . . . . . . . . . . . . . . . . . . . . . . . . . . . . . . . . . 2679.3 Define . . . . . . . . . . . . . . . . . . . . . . . . . . . . . . . . . . . . . . . . . . . . . . . . . . . . . . . . . 2679.4 Measure . . . . . . . . . . . . . . . . . . . . . . . . . . . . . . . . . . . . . . . . . . . . . . . . . . . . . . . 2729.5 Analyze . . . . . . . . . . . . . . . . . . . . . . . . . . . . . . . . . . . . . . . . . . . . . . . . . . . . . . . 2769.6 Improve . . . . . . . . . . . . . . . . . . . . . . . . . . . . . . . . . . . . . . . . . . . . . . . . . . . . . . . 2959.7 Control . . . . . . . . . . . . . . . . . . . . . . . . . . . . . . . . . . . . . . . . . . . . . . . . . . . . . . . . 3029.8 Understanding the DMAIC Methodology . . . . . . . . . . . . . . . . . . . . . . . . . . 3039.9 Summary . . . . . . . . . . . . . . . . . . . . . . . . . . . . . . . . . . . . . . . . . . . . . . . . . . . . . . 304Exercise . . . . . . . . . . . . . . . . . . . . . . . . . . . . . . . . . . . . . . . . . . . . . . . . . . . . . . . . . . . 305Note . . . . . . . . . . . . . . . . . . . . . . . . . . . . . . . . . . . . . . . . . . . . . . . . . . . . . . . . . . . . . . 305
Chapter 10 Doing Things Right the First Time: Designing a Process That Works . . . . . . . . . . . . . . . . . . . . . . . . . . . . . . . . . . . . . . . . . . . . . . . . . . . . . . . . 30710.1 High- Level View of the Design Methodology and Project Setup . . . . . . 30710.2 Define . . . . . . . . . . . . . . . . . . . . . . . . . . . . . . . . . . . . . . . . . . . . . . . . . . . . . . . . 31210.3 Characterize . . . . . . . . . . . . . . . . . . . . . . . . . . . . . . . . . . . . . . . . . . . . . . . . . . 31410.4 Design . . . . . . . . . . . . . . . . . . . . . . . . . . . . . . . . . . . . . . . . . . . . . . . . . . . . . . . 32310.5 Verify . . . . . . . . . . . . . . . . . . . . . . . . . . . . . . . . . . . . . . . . . . . . . . . . . . . . . . . . 34010.6 Understanding the Design Methodology . . . . . . . . . . . . . . . . . . . . . . . . . . 34110.7 Comparing DCDV and DMAIC . . . . . . . . . . . . . . . . . . . . . . . . . . . . . . . . . . 34410.8 Summary . . . . . . . . . . . . . . . . . . . . . . . . . . . . . . . . . . . . . . . . . . . . . . . . . . . . . 345Exercise . . . . . . . . . . . . . . . . . . . . . . . . . . . . . . . . . . . . . . . . . . . . . . . . . . . . . . . . . . . 345Notes . . . . . . . . . . . . . . . . . . . . . . . . . . . . . . . . . . . . . . . . . . . . . . . . . . . . . . . . . . . . . 346
Part III Ingredients and Recipes for Corporate and Personal Change Initiatives . . . . . . . . . . . . . . . . . . . . . . . . . . . . . . . . . . . . . . . 347
Chapter 11 The Approaches to and Practice of Continuous Improvement . . . . . . . . . . . . . . . . . . . . . . . . . . . . . . . . . . . . . . . . . . . . . . . . . . . . . . . 34911.1 The Practice of Continuous Improvement . . . . . . . . . . . . . . . . . . . . . . . . . 34911.2 Approaches to Continuous Improvement . . . . . . . . . . . . . . . . . . . . . . . . . 35111.3 What to Do about These Initiatives . . . . . . . . . . . . . . . . . . . . . . . . . . . . . . . 36011.4 Emerging Paradigm—The Learning Organization . . . . . . . . . . . . . . . . . . 36111.5 Charting a Course toward Becoming a Learning Organization . . . . . . . 37111.6 Summary . . . . . . . . . . . . . . . . . . . . . . . . . . . . . . . . . . . . . . . . . . . . . . . . . . . . . 374Exercise . . . . . . . . . . . . . . . . . . . . . . . . . . . . . . . . . . . . . . . . . . . . . . . . . . . . . . . . . . . 374Note . . . . . . . . . . . . . . . . . . . . . . . . . . . . . . . . . . . . . . . . . . . . . . . . . . . . . . . . . . . . . . 374
Chapter 12 Personal Processes: Wellness and the One- Person Business . . . . 37512.1 The One- Person Business . . . . . . . . . . . . . . . . . . . . . . . . . . . . . . . . . . . . . . . 37712.2 Wellness . . . . . . . . . . . . . . . . . . . . . . . . . . . . . . . . . . . . . . . . . . . . . . . . . . . . . . 38012.3 Changing Other Personal Processes . . . . . . . . . . . . . . . . . . . . . . . . . . . . . . 38912.4 Conclusion . . . . . . . . . . . . . . . . . . . . . . . . . . . . . . . . . . . . . . . . . . . . . . . . . . . 391Exercise . . . . . . . . . . . . . . . . . . . . . . . . . . . . . . . . . . . . . . . . . . . . . . . . . . . . . . . . . . . 394Notes . . . . . . . . . . . . . . . . . . . . . . . . . . . . . . . . . . . . . . . . . . . . . . . . . . . . . . . . . . . . . 394
H1490_Harvey.indd 9 7/9/15 8:35 AM

x Table of Contents
Appendix A Preparing an “I” Chart . . . . . . . . . . . . . . . . . . . . . . . . . . . . . . . . . . . . 395
Appendix B Specifying the Effect of Each Offering on the Client: The Kano Model . . . . . . . . . . . . . . . . . . . . . . . . . . . . . . . . . . . . . . . . . . . . . . . . . . . . 397
References . . . . . . . . . . . . . . . . . . . . . . . . . . . . . . . . . . . . . . . . . . . . . . . . . . . . . . . . . . . . . 401Index . . . . . . . . . . . . . . . . . . . . . . . . . . . . . . . . . . . . . . . . . . . . . . . . . . . . . . . . . . . . . . . . . 407
H1490_Harvey.indd 10 7/9/15 8:35 AM

xi
List of Figures and Tables
Part IFigure 1.1 Videos associated with Chapter 1 . . . . . . . . . . . . . . . . . . . . . . . . . . . . . . . . . . . 24
Figure 1.2 Structure of the book as it relates to the learning organization . . . . . . . . . . . 26
Figure 1.3 Logical flow and precedence relationship between some of the end-of-chapter exercises . . . . . . . . . . . . . . . . . . . . . . . . . . . . . . . . . . . . . . . . . . . 27
Figure 2.1 Value creation: the mirror image . . . . . . . . . . . . . . . . . . . . . . . . . . . . . . . . . . . . 32
Table 2.1 Key concepts discussed in this chapter . . . . . . . . . . . . . . . . . . . . . . . . . . . . . . . 33
Figure 2.2 Video associated with Chapter 2 . . . . . . . . . . . . . . . . . . . . . . . . . . . . . . . . . . . . 34
Table 2.2 Components of value—two examples . . . . . . . . . . . . . . . . . . . . . . . . . . . . . . . 37
Figure 2.3 Customer satisfaction and technical quality . . . . . . . . . . . . . . . . . . . . . . . . . . . 39
Figure 2.4 Time evolution of the relationship between expected quality, perceived quality, and technical quality in professional services . . . . . . . . . . . . . . . . . . 41
Figure 2.5 The value equations . . . . . . . . . . . . . . . . . . . . . . . . . . . . . . . . . . . . . . . . . . . . . . . 42
Table 2.3 Customers’ reactions to various satisfaction conditions . . . . . . . . . . . . . . . . 44
Figure 2.6 Jack and Linda’s activity cycle . . . . . . . . . . . . . . . . . . . . . . . . . . . . . . . . . . . . . . 46
Figure 2.7 Zoom in: sell the house . . . . . . . . . . . . . . . . . . . . . . . . . . . . . . . . . . . . . . . . . . . . 47
Table 2.4 Comparing needs of two couples selling their houses . . . . . . . . . . . . . . . . . . 47
Figure 2.8 Selling the house: FAST diagram . . . . . . . . . . . . . . . . . . . . . . . . . . . . . . . . . . . . 48
Figure 2.9 Selling the house: high-level customer process . . . . . . . . . . . . . . . . . . . . . . . . 49
Figure 2.10 Service concept: full-service real estate agency . . . . . . . . . . . . . . . . . . . . . . . . 53
Figure 2.11 Service concept: discount real estate agency . . . . . . . . . . . . . . . . . . . . . . . . . . 55
Figure 2.12 Positioning: illustration of segmenting and targeting . . . . . . . . . . . . . . . . . . 55
Figure 2.13 Positioning: formulating a superior value proposition . . . . . . . . . . . . . . . . . 56
Figure 2.14 The personal value equations . . . . . . . . . . . . . . . . . . . . . . . . . . . . . . . . . . . . . . . 57
Figure 2.15 Positioning in the labor market: giving more value than the competition does to employees of choice . . . . . . . . . . . . . . . . . . . . . . . . . . . . . . . . . . . . . . . . 60
Figure 2.16 Dual positioning in the market and in the labor market . . . . . . . . . . . . . . . . 61
Figure 2.17 Customer activity cycle and needs (exercise 2.1) . . . . . . . . . . . . . . . . . . . . . . . 64
Figure 2.18 Affinity diagram of customer needs (exercise 2.2). . . . . . . . . . . . . . . . . . . . . . 65
Figure 2.19 Weighted customer needs (exercise 2.3) . . . . . . . . . . . . . . . . . . . . . . . . . . . . . . 66
Table 3.1 Key concepts discussed in Chapter 3 . . . . . . . . . . . . . . . . . . . . . . . . . . . . . . . . 70
Figure 3.1 Videos associated with Chapter 3 . . . . . . . . . . . . . . . . . . . . . . . . . . . . . . . . . . . 71
H1490_Harvey.indd 11 7/9/15 8:35 AM

xii List of Figures and Tables
Figure 3.2 Functional analysis system technique (FAST) diagram for the process of making a cup of coffee—selective drill-down to level 5 . . . . . . . . . . . . . . . . . 76
Figure 3.3 APQC’s processes classification framework (level 1 processes) . . . . . . . . . . 78
Figure 3.4 Breakdown of APQC’s generic process #4 into subprocesses using a FAST diagram (level 2 and 3 processes) . . . . . . . . . . . . . . . . . . . . . . . . . . . . . . 79
Figure 3.5 Viewing an organization as a system of processes—selected generic processes organized in a flow (input–output) pattern . . . . . . . . . . . . . . . . . . 80
Figure 3.6 Circumscribing a (level 3) process: 4.4.3 “Provide the service to specific customers” . . . . . . . . . . . . . . . . . . . . . . . . . . . . . . . . . . . . . . . . . . . . . . . . . . . . . . . 81
Figure 3.7 Exploding “provide the service to specific customers” (4.4.3) in a process flow diagram at Medsol Clinic (identifying level 4 processes) . . . . . . . . . . . 82
Figure 3.8 Circumscribing a (level 4) process: “Conduct initial service encounter” . . . 83
Figure 3.9 Process flow diagram for “provide the service to specific customers” (4.4.3) for a real estate agency . . . . . . . . . . . . . . . . . . . . . . . . . . . . 84
Table 3.2 Description of major process representation tools, with their purpose and use . . . . . . . . . . . . . . . . . . . . . . . . . . . . . . . . . . . . . . . . . . . . . . . . . . . . . . . . . . 85
Figure 3.10 Process mapping: filling a new prescription for an existing customer at Golden Years Drugstore . . . . . . . . . . . . . . . . . . . . . . . . . . . . . . . . . . . . . . . . . . . 87
Figure 3.11 Process mapping symbols used in this book . . . . . . . . . . . . . . . . . . . . . . . . . . 88
Table 3.3 Evaluation of various situations with respect to the existence of a process . . . . . . . . . . . . . . . . . . . . . . . . . . . . . . . . . . . . . . . . . . . . . . . . . . . . . . . . . . 89
Figure 3.12 Various ways to classify processes . . . . . . . . . . . . . . . . . . . . . . . . . . . . . . . . . . . 90
Table 3.4 Illustration of personal processes, their major challenge, approximate cycle times, and lifetime frequencies . . . . . . . . . . . . . . . . . . . . . . . . . . . . . . . . . 94
Figure 3.13 Connections between selected processes of a real estate broker, the features of the service, and the benefits they create for the customer . . . . . 104
Table 3.5 Illustration of classification for personal, family, business, and societal processes . . . . . . . . . . . . . . . . . . . . . . . . . . . . . . . . . . . . . . . . . . . . . . . . . . . . . . . . 106
Figure 3.14 The SITOC form used to circumscribe a process (exercise 3.1) . . . . . . . . . . . 109
Table 4.1 Major concepts discussed in Chapters 4 and 5 . . . . . . . . . . . . . . . . . . . . . . . . . 112
Figure 4.1 Videos associated with Chapter 4 . . . . . . . . . . . . . . . . . . . . . . . . . . . . . . . . . . . 113
Figure 4.2 Body and Mind Inc.: illustration of the links between the target segment, service concept, and selected processes . . . . . . . . . . . . . . . . . . . . . . 117
Figure 4.3 The service concept and standards as the linchpin between strategy and operations . . . . . . . . . . . . . . . . . . . . . . . . . . . . . . . . . . . . . . . . . . . . . . . . . . . . . . . 121
Figure 4.4 The three-way fit between operations strategy, positioning, and coherence (“value-to-process” or V2P model) . . . . . . . . . . . . . . . . . . . . . . . . . 123
Figure 4.5 Develop and manage human capital: process list (down to level 3, based on APQC) . . . . . . . . . . . . . . . . . . . . . . . . . . . . . . . . . . . . . . . . . . . . . . . . . . 124
Figure 4.6 Four generic ways for one to prepare a will . . . . . . . . . . . . . . . . . . . . . . . . . . 126
Table 4.2 Major families of processes and their characteristics . . . . . . . . . . . . . . . . . . . 133
Table 4.3 Potential process dysfunctions at BMI, explanation, and stakeholders affected . . . . . . . . . . . . . . . . . . . . . . . . . . . . . . . . . . . . . . . . . . . . . . . . . . . . . . . . . . 137
Figure 4.7 The learning organization: doing the right thing (picking the right process) right (designing or improving that process) as a key organizational routine . . . . . . . . . . . . . . . . . . . . . . . . . . . . . . . . . . . . . . . . . . . . . 138
H1490_Harvey.indd 12 7/9/15 8:35 AM

lisT of figures and Tables xiii
Figure 4.8 V2P overview . . . . . . . . . . . . . . . . . . . . . . . . . . . . . . . . . . . . . . . . . . . . . . . . . . . . 142
Figure 4.9 V2P clarifications . . . . . . . . . . . . . . . . . . . . . . . . . . . . . . . . . . . . . . . . . . . . . . . . . 143
Figure 5.1 Videos associated with Chapter 5 . . . . . . . . . . . . . . . . . . . . . . . . . . . . . . . . . . . 146
Figure 5.2 Macro-mapping of the “sell services” process at Quality Knowledge Management . . . . . . . . . . . . . . . . . . . . . . . . . . . . . . . . . . . . . . . . . . . . . . . . . . . . . 149
Figure 5.3 A dynamic model of professional–client relation . . . . . . . . . . . . . . . . . . . . . . 150
Figure 5.4 Generic illustration of complex dispatch processes to match customers and professionals . . . . . . . . . . . . . . . . . . . . . . . . . . . . . . . . . . . . . . . . . . . . . . . . . 157
Figure 5.5 The professional core and peripheral processes: cancer service episode in a hospital . . . . . . . . . . . . . . . . . . . . . . . . . . . . . . . . . . . . . . . . . . . . . . . . . . . . . . 158
Figure 5.6 Different cost structures associated with different operations strategies . . . 161
Table 5.1 Weighted clients’ needs for target market segment . . . . . . . . . . . . . . . . . . . . 169
Figure 5.7 Most important service features for the client: weighted using focus groups . . . . . . . . . . . . . . . . . . . . . . . . . . . . . . . . . . . . . . . . . . . . . . . . . . . . . . . . . . . 170
Figure 5.8 Most important metrics for the client, assessed through brainstorming based on their correlation with the various service features . . . . . . . . . . . . . 171
Part IIFigure 6.1 Videos associated with Chapter 6 . . . . . . . . . . . . . . . . . . . . . . . . . . . . . . . . . . . 176
Table 6.1 Short definitions of major concepts discussed in this chapter . . . . . . . . . . . . 177
Table 6.2 Temperature and humidity data for 30 days in Judy’s home, compared with comfort levels . . . . . . . . . . . . . . . . . . . . . . . . . . . . . . . . . . . . . . . . . . . . . . . . 179
Figure 6.2 Temperature and humidity in Judy’s house: plot of the voice of the process against the voice of the customer . . . . . . . . . . . . . . . . . . . . . . . . . . . . . 180
Figure 6.3 Temperature and humidity in Judy’s house: histogram with basic statistics, 30-day sample . . . . . . . . . . . . . . . . . . . . . . . . . . . . . . . . . . . . . . . . . . . 181
Table 6.3 Areas under the standard normal curve for various values of x, the number of standard deviations away from the mean (prob [X > μ + xσ]) . . . 182
Figure 6.4 Temperature and humidity in Judy’s house: histogram with basic statistics, 500-day sample . . . . . . . . . . . . . . . . . . . . . . . . . . . . . . . . . . . . . . . . . . 183
Figure 6.5 Areas under the normal curve . . . . . . . . . . . . . . . . . . . . . . . . . . . . . . . . . . . . . . 183
Figure 6.6 A systems view of Judy’s process control problem . . . . . . . . . . . . . . . . . . . . . 184
Table 6.4 Illustration of control loops, process shift, and process drift in three personal processes . . . . . . . . . . . . . . . . . . . . . . . . . . . . . . . . . . . . . . . . . . . . . . . . . 186
Figure 6.7 The three-way fit (V2P model) between the service concept, the job concept, and processes at GYD . . . . . . . . . . . . . . . . . . . . . . . . . . . . . . . . . . . . . . 190
Figure 6.8 A systems view of professional and service delivery processes at GYD . . . . 191
Figure 6.9 Process control at GYD: filling a prescription . . . . . . . . . . . . . . . . . . . . . . . . . 192
Figure 6.10 Hierarchical process control at GYD: filling a prescription . . . . . . . . . . . . . . 196
Figure 6.11 Simplified view of intake process (dispatch process) at Midtown CPS . . . . 199
Figure 6.12 Statistical process control chart for response time at Midtown CPS . . . . . . 202
Figure 6.13 Statistical process control chart at QKM: time required to prepare a proposal . . . . . . . . . . . . . . . . . . . . . . . . . . . . . . . . . . . . . . . . . . . . . . . . . . . . . . . . . 207
Figure 6.14 Illustration of the use of an SPC chart to decide on the presence of “special causes”: four decision rules . . . . . . . . . . . . . . . . . . . . . . . . . . . . . . . . . 208
H1490_Harvey.indd 13 7/9/15 8:35 AM

xiv List of Figures and Tables
Figure 7.1 Video associated with Chapter 7 . . . . . . . . . . . . . . . . . . . . . . . . . . . . . . . . . . . . 210
Figure 7.2 Partial FAST diagram for FPA . . . . . . . . . . . . . . . . . . . . . . . . . . . . . . . . . . . . . . 212
Figure 7.3 Modified QFD: illustrative rating of the importance of selected processes . . . . . . . . . . . . . . . . . . . . . . . . . . . . . . . . . . . . . . . . . . . . . . . . . . . . . . . . 213
Figure 7.4 Most important processes in sample (from Figure 7.3, last row) . . . . . . . . . 214
Table 7.1 Prioritization of processes based on salience and performance . . . . . . . . . . 216
Figure 7.5 Salience diagram: importance of selected processes for the customer and for strategy . . . . . . . . . . . . . . . . . . . . . . . . . . . . . . . . . . . . . . . . . . . . . . . . . . . 217
Figure 7.6 Evaluating the performance (efficiency and effectiveness) of selected processes . . . . . . . . . . . . . . . . . . . . . . . . . . . . . . . . . . . . . . . . . . . . . . . . . . . . . . . . 218
Figure 7.7 Salience and importance diagram: prioritizing processes for improvement or redesign . . . . . . . . . . . . . . . . . . . . . . . . . . . . . . . . . . . . . . . . . . 219
Figure 7.8 Prioritizing processes for improvement: bird’s-eye view of the methodology . . . . . . . . . . . . . . . . . . . . . . . . . . . . . . . . . . . . . . . . . . . . . . . . . . . . . 220
Table 7.2 Overview of the methodology . . . . . . . . . . . . . . . . . . . . . . . . . . . . . . . . . . . . . . 223
Figure 7.9 SMART problem statement: the big Y at CPS . . . . . . . . . . . . . . . . . . . . . . . . . 224
Figure 7.10 Step 2: Identify related metrics and their interrelationship—CPS . . . . . . . . 225
Figure 7.11 Step 2: Identify related metrics and their interrelationship—software developer . . . . . . . . . . . . . . . . . . . . . . . . . . . . . . . . . . . . . . . . . . . . . . . . . . . . . . . . 226
Figure 7.12 Step 2: Identify related metrics and their interrelationship—accounting firm . . . . . . . . . . . . . . . . . . . . . . . . . . . . . . . . . . . . . . . . . . . . . . . . . . . . . . . . . . . . . 227
Figure 7.13 Step 3: Identify relevant processes and their functional linkages—CPS . . . 228
Figure 7.14 Step 3: Identify relevant processes and their functional linkages— software developer . . . . . . . . . . . . . . . . . . . . . . . . . . . . . . . . . . . . . . . . . . . . . . . . 229
Figure 7.15 Step 3: Identify relevant processes and their functional linkages— accounting firm . . . . . . . . . . . . . . . . . . . . . . . . . . . . . . . . . . . . . . . . . . . . . . . . . . . 229
Figure 7.16 Step 4: Identify the impact of each process on each metric—CPS . . . . . . . . . 230
Figure 7.17 Step 4: Identify the impact of each process on each metric— software developer . . . . . . . . . . . . . . . . . . . . . . . . . . . . . . . . . . . . . . . . . . . . . . . . 231
Figure 7.18 Step 4: Identify the impact of each process on each metric— accounting firm . . . . . . . . . . . . . . . . . . . . . . . . . . . . . . . . . . . . . . . . . . . . . . . . . . . 232
Figure 7.19 Step 5: Assessment of current process performance at CPS . . . . . . . . . . . . . 233
Figure 7.20 Step 6: Cause-and-effect (or Ishikawa) diagram at CPS . . . . . . . . . . . . . . . . . 234
Figure 7.21 SMART problem statement: the small y at CPS . . . . . . . . . . . . . . . . . . . . . . . 235
Figure 7.22 The SITOC form used to circumscribe the process at CPS . . . . . . . . . . . . . . . 236
Figure 7.23 Step 9: Functional analysis (FAST diagram) to identify subprocesses at CPS . . . . . . . . . . . . . . . . . . . . . . . . . . . . . . . . . . . . . . . . . . . . . . . . . . . . . . . . . . . 237
Figure 7.24 Step 10: Assessment of current performance of subprocesses at CPS . . . . . 238
Figure 8.1 Video associated with Chapter 8 . . . . . . . . . . . . . . . . . . . . . . . . . . . . . . . . . . . . 242
Figure 8.2 The four steps in planning process improvement . . . . . . . . . . . . . . . . . . . . . . 243
Figure 8.3 Typology of process problems . . . . . . . . . . . . . . . . . . . . . . . . . . . . . . . . . . . . . . 244
Table 8.1 Short definitions or illustrations of problems and change vehicles . . . . . . . 245
Figure 8.4 Typology of process change vehicles . . . . . . . . . . . . . . . . . . . . . . . . . . . . . . . . 248
Figure 8.5 Overview of kaizen event and moments of truth . . . . . . . . . . . . . . . . . . . . . . 252
H1490_Harvey.indd 14 7/15/15 10:30 AM

lisT of figures and Tables xv
Figure 8.6 Simplified process mapping of a kaizen event . . . . . . . . . . . . . . . . . . . . . . . . 254
Figure 8.7 Ten moments of truth of the kaizen event . . . . . . . . . . . . . . . . . . . . . . . . . . . . 255
Table 8.2 Three-way match between process problems, methodologies, and change vehicles . . . . . . . . . . . . . . . . . . . . . . . . . . . . . . . . . . . . . . . . . . . . . . . . . . . 260
Figure 9.1 Videos associated with Chapter 9 . . . . . . . . . . . . . . . . . . . . . . . . . . . . . . . . . . . 264
Figure 9.2 The DMAIC improvement methodology: phases, inputs, outputs, and partial toolkits . . . . . . . . . . . . . . . . . . . . . . . . . . . . . . . . . . . . . . . . . . . . . . . . 265
Figure 9.3 Macro map of the PAC at QKM . . . . . . . . . . . . . . . . . . . . . . . . . . . . . . . . . . . . . 269
Figure 9.4 FAST diagram of the PAC, with details of the setup phase . . . . . . . . . . . . . . 270
Figure 9.5 Project scope: SMART problem statement, SITOC, boundaries, and comments . . . . . . . . . . . . . . . . . . . . . . . . . . . . . . . . . . . . . . . . . . . . . . . . . . . . . . . . 270
Figure 9.6 Project scope: customer needs, technical characteristics, and process mission . . . . . . . . . . . . . . . . . . . . . . . . . . . . . . . . . . . . . . . . . . . . . . . . . . . . . . . . . . 271
Figure 9.7 Process mapping: pre-course segment . . . . . . . . . . . . . . . . . . . . . . . . . . . . . . . 273
Table 9.1 The analyze toolkit: description, purpose, indication, limitations, and challenges involved with each tool . . . . . . . . . . . . . . . . . . . . . . . . . . . . . . . . . . 277
Table 9.2 Critical activities, CTP variables, current and alternate controls on activities . . . . . . . . . . . . . . . . . . . . . . . . . . . . . . . . . . . . . . . . . . . . . . . . . . . . . . . . . . 278
Table 9.3 ICUKU classification of causes according to impact, controllability, and experience . . . . . . . . . . . . . . . . . . . . . . . . . . . . . . . . . . . . . . . . . . . . . . . . . . . . . . . 281
Figure 9.8 Root cause analysis (five whys) for a “major impact—controllable— unknown” cause from the ICUKU diagram . . . . . . . . . . . . . . . . . . . . . . . . . . 283
Figure 9.9 Non-value-added activities, CTPs, and critical path . . . . . . . . . . . . . . . . . . . 286
Figure 9.10 Precedence diagram for the six functions, respective value-added ratios, and critical path . . . . . . . . . . . . . . . . . . . . . . . . . . . . . . . . . . . . . . . . . . . . . . . . . . 287
Figure 9.11 Value added: overall and by function . . . . . . . . . . . . . . . . . . . . . . . . . . . . . . . . 288
Table 9.4 Partial failure mode and effects analysis (FMEA) . . . . . . . . . . . . . . . . . . . . . . 290
Figure 9.12 Collating and analyzing partial conclusions from eight techniques: synthesizing a diagnosis . . . . . . . . . . . . . . . . . . . . . . . . . . . . . . . . . . . . . . . . . . . 292
Figure 9.13 Diagnostic worksheet . . . . . . . . . . . . . . . . . . . . . . . . . . . . . . . . . . . . . . . . . . . . . 293
Figure 9.14 Process diagnosis . . . . . . . . . . . . . . . . . . . . . . . . . . . . . . . . . . . . . . . . . . . . . . . . . 294
Figure 9.15 Idea evaluation card . . . . . . . . . . . . . . . . . . . . . . . . . . . . . . . . . . . . . . . . . . . . . . . 297
Figure 9.16 Prescription: high-level description of the solution and explanation of its major elements . . . . . . . . . . . . . . . . . . . . . . . . . . . . . . . . . . . . . . . . . . . . . . 298
Figure 9.17 Blueprint of new process . . . . . . . . . . . . . . . . . . . . . . . . . . . . . . . . . . . . . . . . . . . 299
Figure 9.18 Elements of the new process: choices already made and decisions to be taken (partial) . . . . . . . . . . . . . . . . . . . . . . . . . . . . . . . . . . . . . . . . . . . . . . . . . . . . 300
Figure 9.19 Control plan . . . . . . . . . . . . . . . . . . . . . . . . . . . . . . . . . . . . . . . . . . . . . . . . . . . . . . 302
Figure 10.1 Videos associated with Chapter 10 . . . . . . . . . . . . . . . . . . . . . . . . . . . . . . . . . . 308
Figure 10.2 The DCDV design methodology: phases, inputs, outputs, and partial toolkits . . . . . . . . . . . . . . . . . . . . . . . . . . . . . . . . . . . . . . . . . . . . . . . . . . . . . . . . . . 308
Table 10.1 The DCDV design methodology: questions addressed and design principles at each step . . . . . . . . . . . . . . . . . . . . . . . . . . . . . . . . . . . . . . . . . . . . . 309
Table 10.2 The DCDV design methodology: toolbox . . . . . . . . . . . . . . . . . . . . . . . . . . . . . 310
H1490_Harvey.indd 15 7/9/15 8:35 AM

xvi List of Figures and Tables
Figure 10.3 Project scope: SMART problem statement, SITOC, boundaries, and comments . . . . . . . . . . . . . . . . . . . . . . . . . . . . . . . . . . . . . . . . . . . . . . . . . . . . . . . . 313
Figure 10.4 Flow of the characterization phase . . . . . . . . . . . . . . . . . . . . . . . . . . . . . . . . . . 316
Table 10.3 Weighted client needs, with the potential they hold for various categories of service features (Kano model) . . . . . . . . . . . . . . . . . . . . . . . . . . . 317
Table 10.4 Generating technical characteristics (metrics) . . . . . . . . . . . . . . . . . . . . . . . . . 318
Figure 10.5 Train/educate the client: house 1 . . . . . . . . . . . . . . . . . . . . . . . . . . . . . . . . . . . . 319
Figure 10.6 Train/educate the client: FAST diagram . . . . . . . . . . . . . . . . . . . . . . . . . . . . . . 320
Figure 10.7 Train/educate the client: house 2 . . . . . . . . . . . . . . . . . . . . . . . . . . . . . . . . . . . . 321
Figure 10.8 The mission of the most important functions identified in house 2 . . . . . . . 322
Figure 10.9 Initial generation of ideas for key functions, and combination into process concepts . . . . . . . . . . . . . . . . . . . . . . . . . . . . . . . . . . . . . . . . . . . . . . . . . . 324
Figure 10.10 General description (vision) of each initial process concept . . . . . . . . . . . . . 326
Figure 10.11 Relationship between service concept and process concept: division and sharing of the service space between the three stakeholders . . . . . . . . . 327
Figure 10.12 Completed descriptions for four of the five initial process concepts . . . . . . 328
Figure 10.13 Comparison of the four initial process concepts using the Pugh design matrix . . . . . . . . . . . . . . . . . . . . . . . . . . . . . . . . . . . . . . . . . . . . . . . . . . . . . . . . . . . 330
Figure 10.14 Variation on a theme: generating variants of the best concept (“Club Med”) selected in the first iteration . . . . . . . . . . . . . . . . . . . . . . . . . . . 334
Figure 10.15 Second iteration: comparing the four new concepts using the Pugh design matrix . . . . . . . . . . . . . . . . . . . . . . . . . . . . . . . . . . . . . . . . . . . . . . . 335
Figure 10.16 Illustration of the optimization algorithm behind the Pugh matrix . . . . . . . 336
Figure 10.17 Elements of the new training process to be designed (partial) . . . . . . . . . . . 337
Figure 10.18 Augmented visual macro-blueprint . . . . . . . . . . . . . . . . . . . . . . . . . . . . . . . . . . 339
Figure 10.19 An underlying principle of the design methodology: from quantity to quality . . . . . . . . . . . . . . . . . . . . . . . . . . . . . . . . . . . . . . . . . . . . . . . . . . . . . . . . . . . 341
Figure 10.20 The design methodology: a series of generators and filters . . . . . . . . . . . . . . 342
Figure 10.21 An alternate view of the flow of the design methodology . . . . . . . . . . . . . . . 343
Figure 10.22 Voice of the customer for key metrics and validation of the measurement system . . . . . . . . . . . . . . . . . . . . . . . . . . . . . . . . . . . . . . . . . . . . . . 346
Figure 10.23 Key functions, metrics impacted, and priorities to consider in design . . . . 346
Part IIIFigure 11.1 Video associated with Chapter 11 . . . . . . . . . . . . . . . . . . . . . . . . . . . . . . . . . . . 350
Figure 11.2 Baldrige Criteria for Performance Excellence framework: a systems perspective . . . . . . . . . . . . . . . . . . . . . . . . . . . . . . . . . . . . . . . . . . . . . . . . . . . . . . . 353
Figure 11.3 The 15 dimensions of the learning organization . . . . . . . . . . . . . . . . . . . . . . . 361
Table 11.1 Defining the dimensions of the learning organization . . . . . . . . . . . . . . . . . . 362
Figure 11.4 Mapping the dimensions of the learning organization by affinity . . . . . . . . 363
Figure 11.5 Five levels of learning maturity . . . . . . . . . . . . . . . . . . . . . . . . . . . . . . . . . . . . . 364
Figure 11.6 Mapping operational improvement initiatives on the dimensions of the learning organization . . . . . . . . . . . . . . . . . . . . . . . . . . . . . . . . . . . . . . . . . . . . . . 373
Figure 12.1 Video associated with Chapter 12 . . . . . . . . . . . . . . . . . . . . . . . . . . . . . . . . . . . 376
H1490_Harvey.indd 16 7/9/15 8:35 AM

lisT of figures and Tables xvii
Figure 12.2 Order-to-delivery process macro map for Sandra . . . . . . . . . . . . . . . . . . . . . . 379
Figure 12.3 Simplified systemic vision of personal processes . . . . . . . . . . . . . . . . . . . . . . 381
Figure 12.4 Weekly weight over a 10-year period (I chart), with a zoomed-in view of the last year . . . . . . . . . . . . . . . . . . . . . . . . . . . . . . . . . . . . . . . . . . . . . . . . . . . . . . 384
Figure 12.5 Process capability for weight: one year’s data . . . . . . . . . . . . . . . . . . . . . . . . . 385
Figure 12.6 Weekly number of hours of aerobic training and changes over a 10-year period (I-MR chart) . . . . . . . . . . . . . . . . . . . . . . . . . . . . . . . . . . . . . . . . 386
Figure 12.7 Comparing trends: fitted regression line for aerobics and weight over time . . . . . . . . . . . . . . . . . . . . . . . . . . . . . . . . . . . . . . . . . . . . . . . . . . . . . . . . . . . . . 387
Figure 12.8 Example health process control dashboard . . . . . . . . . . . . . . . . . . . . . . . . . . . 387
Table B.1 Reactions of two market segments to various elements of the service package in a seminar on derivatives . . . . . . . . . . . . . . . . . . . . . . . . . . . . . . . . . 398
Figure B.1 Classification of some elements of FPA’s service package based on their effect on the customer (modified Kano model) . . . . . . . . . . . . . . . . . . . . . . . . 400
H1490_Harvey.indd 17 7/9/15 8:35 AM

H1490_Harvey.indd 18 7/9/15 8:35 AM
xix
List of Videos*
1.1 Deploying complex services for maximum value creation . . . . . . . . . . . . . . . . . . . 24
1.2 How to use the book and website . . . . . . . . . . . . . . . . . . . . . . . . . . . . . . . . . . . . . . . . 24
2.1 Value and dual positioning . . . . . . . . . . . . . . . . . . . . . . . . . . . . . . . . . . . . . . . . . . . . . . 34
3.1 An introduction to complex service delivery processes—the airport experience . . . . . . . . . . . . . . . . . . . . . . . . . . . . . . . . . . . . . . . . . . . . . . . . . . . . . . . . . . . . 71
3.2 The process view . . . . . . . . . . . . . . . . . . . . . . . . . . . . . . . . . . . . . . . . . . . . . . . . . . . . . . 71
3.3 Processes and projects . . . . . . . . . . . . . . . . . . . . . . . . . . . . . . . . . . . . . . . . . . . . . . . . . . 71
3.4 The nature of technology . . . . . . . . . . . . . . . . . . . . . . . . . . . . . . . . . . . . . . . . . . . . . . . 71
4.1 So you have a good strategy, but you have not won yet . . . . . . . . . . . . . . . . . . . . . 113
4.2 V2P model—A technical note . . . . . . . . . . . . . . . . . . . . . . . . . . . . . . . . . . . . . . . . . . . . 113
4.3 Business process outsourcing (BPO)—The evolving challenges and opportunities. . . . . . . . . . . . . . . . . . . . . . . . . . . . . . . . . . . . . . . . . . . . . . . . . . . . . . . . . . 113
5.1 The power of complex services: foster, use, and abuse . . . . . . . . . . . . . . . . . . . . . . 146
6.1 Understanding and managing processes . . . . . . . . . . . . . . . . . . . . . . . . . . . . . . . . . . 176
6.2 Measuring and learning . . . . . . . . . . . . . . . . . . . . . . . . . . . . . . . . . . . . . . . . . . . . . . . . 176
6.3 Supply chain—Complex service version . . . . . . . . . . . . . . . . . . . . . . . . . . . . . . . . . . 176
7.1 Scoping process improvement in complex services . . . . . . . . . . . . . . . . . . . . . . . . . 210
8.1 Social and human dynamics . . . . . . . . . . . . . . . . . . . . . . . . . . . . . . . . . . . . . . . . . . . . . 242
9.1 The DMAIC methodology . . . . . . . . . . . . . . . . . . . . . . . . . . . . . . . . . . . . . . . . . . . . . . 264
10.1 High-level overview of the DCDV design methodology . . . . . . . . . . . . . . . . . . . . . 308
10.2 DCDV—Characterize and design: A technical note . . . . . . . . . . . . . . . . . . . . . . . . . 308
11.1 Toward operational excellence . . . . . . . . . . . . . . . . . . . . . . . . . . . . . . . . . . . . . . . . . . . 350
12.1 The pursuit of operational excellence is personal . . . . . . . . . . . . . . . . . . . . . . . . . . . 376
*All videos available for free viewing at http://videos.asq.org/complex-service-delivery-processes.
H1490_Harvey.indd 19 7/9/15 4:05 PM

H1490_Harvey.indd 20 7/9/15 8:35 AM

xxi
CTC Critical to cost
CTD Critical to delivery
CTP Critical to process
CTQ Critical to quality
CTS Critical to satisfaction
DCDV Define, characterize, design, and verify
DMAIC Define, measure, analyze, improve, and control
FAST Functional analysis system technique
FMEA Failure mode and effects analysis
IT Information technology
PFD Process flow diagram
PSDP Professional service delivery process
PSO Professional service organization
QFD Quality function deployment
SDP Service delivery process
SITOC Supplier, input, transformation, output, customer
SMART Specific, measurable, achievable, relevant, and time-bound
VAA Value-added analysis
V2P Value to processes. Refers to the model shown in Figures 4.8 and 4.9.
Major Abbreviations
H1490_Harvey.indd 21 7/9/15 8:35 AM

H1490_Harvey.indd 22 7/9/15 8:35 AM

xxiii
The release of the third edition of Complex Service Delivery Processes: Strategy to Operations is great to see. With the development of the Internet of Things, big data, cloud computing,
and mobile internet, the whole world is moving toward intellectualization and a globalized network. In this new environment, the requirement for services is increasing, and people and organizations need more and more assistance and ser-vices, especially complex services. Many people and organizations lack the knowl-edge or skills that will lead them to reach their goals/targets; lack the proper tools, instruments, or facilities; or cannot get the proper network. Complex services offer the kinds of services that provide the proper methods to help them reach their goals/targets. This can be achieved through providing information and sugges-tions, developing activities, or providing the matching operation solutions.
Professor Jean Harvey’s book is well known in this industry and is used as a reference book in many business schools and MBA or EMBA programs. Its second edition was published in Chinese in 2013, translated by the Shanghai Association for Quality and Shanghai Academy of Quality Management. In the meantime, Professor Harvey was invited to the Shanghai International Quality Services Forum and conducted a seminar for his book in Shanghai. His presentation was welcomed and received many positive comments from the enterprises and the quality management field.
The third edition includes videos on operational strategies that address case studies and technical analysis that meets the requirements of today’s challenges. A major change of the third edition involves the direct link between the book and these videos. The whole series is 12 hours in duration and includes many case analyses, graphs (diagrams), and explanations of technology. These videos aid the reader in understanding the content of the book and serve as practical references, allowing for a larger readership and making the book suitable for online study. This is a fantastic book and is highly recommended regarding complex service and quality management.
I believe that the third edition of Complex Service Delivery Processes: Strategy to Operations will benefit all readers. Thanks, Professor Harvey, for sharing this great theory and practical approach to complex services.
Tang XiaoFenPresident of Shanghai Association for Quality
Foreword
H1490_Harvey.indd 23 7/9/15 8:35 AM

H1490_Harvey.indd 24 7/9/15 8:35 AM

xxv
Preface to the Third Edition
Reading is one way to get exposed to new ideas and engage the mind. When the goal is change, however, it is not enough. Face- to-face interaction with a coach or teacher is clearly a great complement to a book, but it is not always
possible. Failing that, a video presentation is the next best thing. Soon after the sec-ond edition of the book came out, I started experimenting with video presentations to address questions and requests for clarifications that were often raised by read-ers. I got some professional help in setting up a small studio and getting started in the producing, editing, and uploading of video clips. Being self- sufficient, from ideation to distribution, is the only way to go nowadays, unless you dispose of a vast budget. Even if you do, it can be argued that eliminating intermediaries, with the unavoidable dilution, biases, and delays that they introduce, is a superior process, just as typing your own messages became best practice 25 years ago. The results, of course, lack the refinements and finishing touch that only experts can produce. Users gain much in the trade- offs, however, as they are exposed to the unadulterated message and spontaneity of the author.
This edition thus comes with an augmented value proposition: as you read and try to understand and experiment with the material, you are invited at vari-ous points to view video clips, lasting between 15 and 25 minutes, that will clarify, complement, illustrate, or go further than what you are reading. Experience has shown that this method works very well indeed. There is an additional benefit: if you come across an explanation that enlightens you on an issue that your orga-nization has been struggling with, you can immediately share it with your col-leagues and thereby generate some discussion and movement on these issues.
While this edition also includes many corrections and improvements, the addi-tion of the videos constitutes a radical change in the learning experience over the previous editions. In total, there are 31 such videos, representing about 12 hours of viewing, which you can view at your convenience, pause and rewind at leisure, and share. The videos can be accessed at http://videos.asq.org/complex-service-delivery-processes. Your feedback, critique, and suggestions (info@complexservice delivery.com) are essential for the continuous improvement of this admittedly very imperfect material.
H1490_Harvey.indd 25 7/9/15 8:35 AM

H1490_Harvey.indd 26 7/9/15 8:35 AM

xxvii
Professionals are some of the most rigorous and structured people in our advanced economies. They are trained to understand the relationships in a system of complex notions (such as the human body, the legal system, or
the laws of physics) and to use different techniques and procedures to intervene and effect desirable changes for the benefit of a client. Yet, a single individual, competent as he may be, cannot single- handedly bring about the solutions that people and organizations need. For all their strengths, and probably because of their training, professionals are staunch individualists and often do not function well in teams, especially multidisciplinary ones. This situation is largely attribut-able to their lack of understanding of how organizations work. Ironically, they are unable to transfer the systems notions that have become second nature to them in their discipline to the discipline of management. This book means to facilitate such a transfer.
A process is a system of activities (together with the associated resources) that takes an input and transforms it into an output of greater value for a customer, and it is processes, not individual departments (or centers of expertise), that cre-ate value in an organization. Functions contribute to value creation through the part they play (that is, the tasks they perform) in processes. Processes create the benefits customers want by delivering the service or by making this delivery pos-sible in one way or another. Treating a cancer, for instance, is a process. The input is the patient with an active cancer. The desired output is the patient with a cancer in remission. The transformation (treating the cancer) involves many centers of expertise, such as family medicine, radiology, medical oncology, surgical oncol-ogy, and radiation oncology, and value comes from the synergistic interaction of all these departments. Antagonism, or simply a lack of coordination, denies that value, in whole or in part.
Processes embody the know- how of an organization. Understanding the DNA of processes is the key to becoming a learning organization. The classical image of an organization—conveyed by the ubiquitous organizational chart—as a set of functions linked at the top is very convenient for professionals, as it reinforces their paradigm. It does not, however, reflect the reality of value creation. The reader will come to view an organization as a complex system of processes, crisscrossing the organizational chart as if there were no boundaries between functions. Neverthe-less, boundaries do exist and are sometimes very hard to cross, thus producing the interference that can be so detrimental to the smooth operation of processes, and thus to value creation.
Preface to the First Edition
H1490_Harvey.indd 27 7/9/15 8:35 AM

xxviii Preface to the First Edition
The process view of organizations is far from prevalent in organizations today. Professional service organizations may be the ones experiencing the most difficul-ties in managing processes, as professional “bubbles” create a multitude of rigid boundaries: professionals focus on their body of knowledge and on accepted prac-tices in their field. All too often they pay little or no attention to the way their actions mesh with those of others in the generation of an overall result for a client. Compounded by the substantial power wielded by professionals—individually and as a group—this narrow perspective results in poor performance.
SErViCES AnD PrOFESSiOnAL SErViCESPeople need help, either because they lack the knowledge or skills required to achieve, by themselves, the result they want or because they do not have the right tools, facilities, or equipment. Perhaps they do not have access to the required net-work, or they would simply rather have help than do it alone. Help may take the form of providing information or advice, performing some of the required actions on the customer’s behalf, performing some actions jointly with the customer, or assuming full responsibility for delivering the desired results (that is, providing a “solution”).
The book focuses on complex services, that is, services sought because of a lack of knowledge or skills. Complex services fall into three categories: professional services, quasi- professional services, and technical services. Strictly speaking, we use the word “professional” to designate a university graduate in an applied field such as law, engineering, or architecture (excluding theoretical fields such as mathematics or philosophy). Professionals often belong to a professional regu-lating body, such as the American Board of Medical Specialties or a state board of public accountancy. We need such bodies because these services address very important needs and because the knowledge gap between the client and the pro-fessional makes the former vulnerable to malpractice. A constantly evolving body of knowledge, generally requiring compulsory continuing education, and a code of ethics guide professionals in their practice. They are subject to sanctions by the regulating body for any malpractice, including suspension or the withdrawal of practice privileges.
Quasi-professional services are similar in many ways to professional services, except that the service providers receive less training. Insurance brokers, real estate agents, radiology technologists, and electricians, for example, do not need a college education. They do need a permit, however, which can be revoked if they are caught breaking important rules. Their training is typically not at university level and may last between six months and two years. The knowledge and skills they acquire, linked as they are to specific legislation, procedures, or technolo-gies, are typically shorter- lived than that of professionals. While the consequences of mistakes may be equally dramatic, the capabilities required to avoid them are more procedural than intellectual.
Finally, technical services involve helping the customer to use complex products or technology- based services. Computers, telecommunications systems, software, camcorders, internet access, and satellite dishes are examples of such products, and they are all critical to self- service. We exclude from this category the direct repair
H1490_Harvey.indd 28 7/9/15 8:35 AM

PrefaCe To The firsT ediTion xxix
of complex products such as cars, aircraft, or home appliances, which are quasi- manufacturing activities, but we do include customer support activities (such as training car dealership technicians to service a new model, for example). Techni-cians providing such services are generally not responsible to a regulating body, but solely to their employers. People use these services in order to be able to per-form complex tasks themselves (such as using a computer or a camcorder). Even though the knowledge gap may be very substantial here as well, the consequences of the service are often more immediate and easier to verify than would be the case for professional and quasi- professional services.
Why do these three categories of service deserve special attention?
• Professional services1 are centered on the most important human needs, and it is very hard for the client to assess their quality, and thus to make sure he is in competent hands. As mentioned earlier, the knowledge gap between provider and client gives the former power over the latter and, like any power, entails the potential for abuse.
• As a class of workers, professionals share a number of characteristics, such as autonomy and independence, that separate them from other categories of workers and require a different management approach.
• Professionals represent an increasingly high proportion of the workforce in industrialized countries, as machines perform many tasks that add less value (such as many manufacturing tasks), and the tasks that remain are rapidly moving to developing countries. Using these machines, however, requires assistance, a sector of the economy that is growing very fast (and, incidentally, one that is not immune to international outsourcing, as information technology [IT] increasingly facilitates delocation).
• Finally, the management literature has focused excessively on the process of, for example, making a hamburger, to the detriment of processes that create more value, such as the counseling of a dysfunctional couple or helping someone fend off a liability suit. Professional services in general, and professional service delivery processes in particular, remain to this day a blur in the literature—a shortfall that needs to be remedied.
This book is also concerned with the many organizations that provide services requiring a mixture of professional and other services to produce the results that customers or clients want. Hospitals and banks, for instance, cover the spectrum of types of services. These organizations face the added challenge of managing the often- turbulent interface between professional services, technical services, and other services. We include internal services as well, such as those offered by the legal or engineering department within an organization.
TArgET AuDiEnCEWe have written this book for professionals, quasi- professionals, and technical workers laboring in all spheres of human endeavor, from law to medicine, from accounting to engineering, who are involved or are interested in taking part in
H1490_Harvey.indd 29 7/9/15 8:35 AM

xxx Preface to the First Edition
managing their businesses. Most professionals, even those who do not care about management, can benefit from the book. Indeed, most do assume some level of management responsibility through such activities as the following:
• Giving instructions to quasi- professionals, technicians, or clerical workers, or coordinating the activities of service providers of all kinds
• Assuming a responsibility for practice development, their take- home income depending on how good they are at it
• Managing their own one- person business
• Managing what customers do (customers are very much a part of the service delivery process)
Processes play a vital role in all these activities. The notions, methods, and tools presented in this book offer the reader a perspective on her work that she most likely never envisaged and that could be a source of insights and a lever for innovation.
STyLEFor the professional or manager interested in learning more about how the process view applies to his own environment, we provide hands- on end- of-chapter exer-cises. One’s own organization and environment constitute the proving ground for the material presented in each chapter. The exercises are structured in such a way that the new theory added by each chapter can be immediately applied to work done in earlier chapters, giving the reader an opportunity to apply the theories she has just learned, and so transform knowledge into know- how. Thus, a global picture gradually emerges, as early chapters paint a broad- brush picture of the connection between strategy and processes and later chapters delve into the spe-cifics of designing and improving processes in a professional service environment.
We do not shy away from theory, but illustrate it abundantly with examples. The case studies presented in the book fall into three categories: actual businesses (in those cases, the company is identified), personal situations to which the author was a party, and generic (thus fictitious) situations built from a composite of the author’s general experience. While we broadly assume throughout the book the context of a for- profit organization, much of the discussion is readily transfer-able to nonprofit organizations. Indeed, the latter also have customers to satisfy, employees to keep happy, and shareholders looking for the “biggest bang for the buck,” whatever the socially desirable “bang” (healthy population, low crime rate, socially healthy families, safe kids, and so on) may be. Such organizations, as illus-trated by the health and social services examples used extensively in this book, are also competing for funds with other service providers, and achieving superior performance is just as important to them as it is for private sector organizations.
We also draw on a broad spectrum of complex services such as legal, financial planning and management, consulting, and real estate services. We first illustrate complex notions with simple examples—often drawn from the personal sphere (processes occur in the home as well) or simple services (such as restaurants
H1490_Harvey.indd 30 7/9/15 8:35 AM

PrefaCe To The firsT ediTion xxxi
or airports)—before adapting them to the more intricate reality of professional services.
Professionals evolving in organizations of all sizes—ranging from the one- person firm to the huge professional bureaucracies that constitute large hospitals—will discover that the process view of the organization is universal, and they can all benefit from it.
Senior executives who want to explore the potential of a process- based stra-tegic initiative in their organization will find it worthwhile to share the book with their associates and compare notes on the end- of-chapter exercises. While this is not a “cookbook,” it is detailed enough and specific enough to allow experimenta-tion to take place, as well as vetting of the principles and tools of process- based management in one’s own environment, and shaping of an operational change initiative. Of course, large organizations should use a consultant to guide them through such an undertaking. Having experienced the book, however, they will be in a better position to select suitable consultants and stay in the driver’s seat throughout the initiative.
nOTE 1. A term used loosely throughout the book to refer to the three categories of
complex services, unless otherwise specified.
H1490_Harvey.indd 31 7/9/15 8:35 AM

H1490_Harvey.indd 32 7/9/15 8:35 AM

xxxiii
Acknowledgments
The author has tested all the methodologies and techniques presented in this book. He cannot, however, claim them all to be his own. The content of this book has evolved over more than three decades of research, teach-
ing, and consulting after obtaining a PhD in management science. It has been influenced—one way or another—by every business with which he interacted during those years as a consultant or researcher, by every executive that has attended an in- house seminar or executive MBA program (thousands, in more than 10 countries around the globe), and by every book and article that he has read during those years of practice. This is what we generally call experience. He cannot possibly give credit to all of them, nor name them all. However, he does most sincerely thank them all. The result is the author’s own paradigm, and any limitations or errors that it may contain are his alone.
H1490_Harvey.indd 33 7/9/15 8:35 AM

H1490_Harvey.indd 34 7/9/15 8:35 AM
1
Part IThe Conceptual Framework
Linking Strategy and Operations
In this part of the book we define many notions such as process, value, and strategy. We illustrate these notions with many examples, relate them to one another, and weave them together. Chapter 1 brings out the nature and importance of rigorous execution. Chapter 2 discusses value for cus-tomers, employees, and shareholders. The discussion leads to decisions about quality and positioning. Chapter 3 explores all aspects of processes from conceptual, operational, and organizational points of view. The key role of processes in learning, and thus in the creation of sustainable com-petitive advantage, is highlighted. Chapters 4 and 5 put together the pre-ceding elements, using coherence, profit leverage, and dual positioning as adjustment variables, to ensure the viability of the business model.
H1490_Harvey.indd 1 7/9/15 8:53 AM

H1490_Harvey.indd 2 7/9/15 8:53 AM

3
If you keep hearing (or worse, repeating) “I want results, no matter how” in your organization, you work in an organization that does not learn. Focusing on the “how” is the key to learning.
In the learning organization, the basics of rigor, logical validity, evidence-based actions, and discipline combine with creativity and innovation to make things work the first time and to continuously find and implement better ways to compete.
After presenting the execution challenge, we illustrate it by comparing three situations related to transportation. In section 1.3, we present various fea-tures that distinguish organizations that learn from those that suffer from
a learning disability. After discussing process management issues in complex ser-vices, we conclude the chapter by presenting the organization of the material in this book.
1.1 The exeCuTiOn ChaLLenge and The need FOr rigOrIn From Poverty to Prosperity (Kling and Schulz 2009), the authors argue that the major factor that separates fast- developing countries from the one that stagnates is “software.” In economics 1.0—as they call traditional economic analysis—labor, land, and equipment (capital) are the factors of production that determine pro-ductivity and growth. Call that the hardware. In economics 2.0, the software—or operating system, to use a computer analogy—is the real discriminating factor. It is the “recipe” for how to use these resources, or “protocols.” Some authors call them “routines.” In this book, we prefer the word “process.” This includes shared ways of doing things based on customs, technology, shared mental mod-els, shared values, social norms, laws, and regulations. Some of these protocols are written and explicit, while others, no less important, are implicit and deeply ingrained in the social fabric of society itself.
The discriminating factor between fast- growing and merely surviving orga-nizations is of a similar nature. Protocols smooth out and speed up interactions between individual and organizational units while leaving the necessary elbow room where it is required. Some interactions merely require discipline, such as
1Toward Value and Strategic advantage
through rigorous execution
One
H1490_Harvey.indd 3 7/9/15 8:53 AM

4 Chapter One
showing up on time for the game when you play basketball, while others, like the timely pass or the successful fake, require a combination of experience, practice, intuition, judgment, strategic thinking, opportunism, team spirit, and flawless execution.
Larry Bossidy (General Electric, Honeywell, Allied Signal) and Ram Charan make the point that many organizations fail not because they had a bad strategy, but because they executed poorly (Bossidy and Charan 2002). Execution, they say, is a discipline in its own right. Its practice is neither glamorous nor spectacular. It is not rocket science, either, but it does involve science and rigor. Interpreting facts, planning experiments, measuring results, and managing feedback, control, and learning loops are all predicated on rigor. This does not preclude intuition, sponta-neity, and even improvisation at times. The scientific method, however, is one of the roots of the foundations of learning. Leadership and “people processes,” as Boss-idy and Charan call them, are complementary roots. In a study, 11 companies that crossed the chasm from being merely good to becoming great companies (tripling their already good stock return and sustaining this for 15 years) were matched to comparable companies that had failed to become great companies, and key differ-ences were isolated (Collins 2001). Collins found that companies that became great stood out for the disciplined people they hired, the disciplined thought process they nurtured, and the disciplined actions they undertook. He defines discipline in this context as “freedom (and responsibility) within a framework.”
In a sequel, Collins (2009) looks at how some great companies lost their grip and fell into irrelevance, while others, even after facing major turbulence, recov-ered and found a path out of their predicament. Arrogance, he finds, is often a factor that triggers wrongheaded decisions or lack of response to ominous events. Organizations that previously excelled at facing hard facts become complacent in their interpretation of unpleasant data, as they take their dominance for granted. Their perception of reality becomes warped by their unwavering belief that they are unbeatable. When the evidence becomes overwhelming, they return to reality with a shock. But it is often too late in the game. They then lose sight of their core strength, succumb to panic, change leadership, and go for the “Hail Mary” pass, grasping at any straw. In short, success can breed arrogance and loss of the very discipline that lies at its root.
During the last two centuries, science has triggered a great leap forward for humanity. During this period, our knowledge has grown incalculably, and with it the complexity of what professionals and technical workers do. This in turn has triggered specialization, as it is not humanly possible for anyone to single- handedly achieve the theoretical and practical mastery (knowledge and know- how) of the various disciplines required to deliver solutions at the level of quality and reliabil-ity clients have come to expect. Therefore, fully addressing clients’ needs requires the coordinated intervention of many such specialists, each with a deep knowl-edge of his or her narrow field and a very limited understanding of what the other specialties do. This is often a source of contempt for the other, thus raising barriers between professionals on whose very cooperation rests the successful outcome sought by the client.
The challenges of coordination have thus grown exponentially. While technol-ogy has opportunely come to the rescue, it brings to the task its own flaws, chal-lenges, complexity, and risks as well. Dr. Atul Gawande (2009) makes this vivid in his description of the tragic case of a three- year-old Austrian girl walking in a
H1490_Harvey.indd 4 7/9/15 8:53 AM

Toward Value and STraTegic adVanTage Through rigorouS execuTion 5
park with her parents. While the parents were momentarily distracted, the little girl ran onto a (barely) frozen pond and fell through the ice. Despite the parents’ desperate efforts, she had spent 30 minutes underwater by the time she was res-cued. The process of trying to save her life involved the coordinated work of a host of specialists (rescue personnel, emergency technicians, surgical team, perfusion-ists, and various medical specialists) using a battery of complex equipment (heart-lung bypass machine, artificial lung system, mechanical ventilator, and CT scan to name but a few). The story ends well: the little girl was resuscitated (that’s not an exaggeration) and fully recovered.
What’s remarkable in this story is that, even though the hospital had acquired all this equipment two years earlier with such cases in mind, until that case it had always failed at saving any victim’s life, essentially because of the chal-lenges involved in managing such extreme complexity. To improve the flow of the process and avoid errors (two notions that will be explored in this book), it had learned from its previous failures and finally devised a simple mechanism (part of a protocol, routine, or process) that made it possible to save the little girl’s life, and others thereafter: a checklist. For all the years of study and research, as well as millions of dollars in investment, it was the simple device of ensuring that all the required steps are performed, in the right sequence, in the right way that “debugged the software” and made the difference between life and death. The reader, however, should not underestimate the challenges involved in develop-ing, implementing, and sustaining the use of such checklists. The hard stuff is the soft stuff.
This book is about the development, implementation, maintenance, and con-tinuous improvement of the “software” that seamlessly glues together individual human action in nimble value chains.
1.2 WheTher YOu are rOLLing, FLYing, Or SaiLing, gOOd PrOCeSSeS are required FOr a SmOOTh ride
In this section we use three transportation- related events to illustrate how invest-ment in process mastery can allow organizations to rise and respond successfully to apparently insurmountable challenges, and how failure to do so can go unde-tected for a long time and eventually lead to disaster. These episodes are in the public domain and thus well documented. Together they span a century and occur on land, in the air, and on the sea.
We first present two events taking place in the Southwest and the Northeast of the United States some 20 years apart. One was an unmitigated disaster, and the other one an unmitigated success. Let us first consider the specifics of each situ-ation and then proceed to compare them to isolate lessons. Finally, to gain some further perspective, we go back in time to discuss an event that took place almost a century ago.
1.2.1 Southern Pacific’s extra 7551 east1
As Southern Pacific’s Extra 7551 East train reached the crest of the pass at 7 a.m. on May 12, 1989, 24 miles away and 2000 feet up from San Bernardino, California, its speed was 25 mph and everything was fine for engineers Frank Holland, operating
H1490_Harvey.indd 5 7/9/15 8:53 AM

6 Chapter One
the four head- end locomotives, and Lawrence Hill, operating two locomotives at the back of the train hauling 69 cars loaded with a mineral. However, while neither of them had a complete picture of this, there had been a number of flaws in the upstream process that led them to that point. These flaws constituted an unknown liability (a “bubble”) that would prove fatal in the downstream process as they reached the curve at the bottom of the long descent toward San Bernardino:
1. The two engineers had never worked together, had not planned the trip together, and had had very little communication during the trip.
2. The shipper had not entered the weight of the mineral, assuming that Southern Pacific would know it (it did not).
3. Holland was unable to reach the shipper to confirm the weight, so he used his best guess. He came up with a weight of 6150 tons for the convoy, well short of the actual weight of 9000 tons.
4. Holland could not start one of his four locomotives. Lacking clear instructions about what to do in this situation, he left it on the train.
5. Hill learned that one of his two locomotives had no dynamic braking capability, but he assumed that this had already been reported.
6. Unbeknownst to either man, another locomotive had only intermittent power.
7. The company’s directions to engineers on downhill braking procedures were inadequate.
Taken individually, none of these events appears to be a fatal flaw. Taken together, however, they would create a downstream situation where critical processes that had always worked were now out of control. Upstream, they reflect a “good enough” or “so what” attitude in action that appears to have been endemic in the organization.
As the train gathered speed, Holland gradually applied braking power. After a brief stabilization of its speed, the train started to accelerate again. He applied some more, with the same effect. He did not start to panic until the train reached 45 mph in a straightaway. By that time Hill was really worried. He applied all the pneumatic braking power he had, without talking to Holland. Coordination between the two engineers was nonexistent as they did not have a game plan (braking procedures were not clear), did not proceed from the same fact sheet, and had not established an operational working relationship. When the train reached 90 mph (the recorder does not register beyond that), there was no backup plan. Maydays were sent and the engineers braced for the inevitable disaster. The train derailed in the curve. Four people died in the crash, and houses in a nearby resi-dential development were destroyed. The damage was estimated at $12 million. The two engineers miraculously survived. No act of God was involved here, only poorly executed steps of men acting with little forethought, rigor, and coordina-tion. Most of the blame does not fall on the two operators, however. It lies with the leaders of the organization, their lack of vision, and their poor understanding of the discipline of execution. The bubble was waiting to burst, and, as is often the case, it did so in a situation where the organization’s processes were under maximum stress.
H1490_Harvey.indd 6 7/9/15 8:53 AM

Toward Value and STraTegic adVanTage Through rigorouS execuTion 7
1.2.2 uS airways Flight 1549
Just two minutes after taking off from La Guardia Airport at 3:27 p.m. on January 15, 2009, the Airbus A320-214, under Captain Chesley Sullenberger and flown by first officer Jeffrey Skiles, hit a flock of Canada geese. The aircraft, headed for Char-lotte, North Carolina, with 155 people on board, was hit in the windshield, and both engines swallowed one or two birds and simultaneously shut off. The two very experienced pilots were flying together for the first time. They had become an operational team while going through the pre- takeoff checklist, allowing them to verify the interoperability of their skill sets and their ability to function as a team at the command of their aircraft. They kept their cool as they peered through the blood- stained windshield in the suddenly frighteningly silent cockpit.
Sullenberger immediately took over (from the cockpit voice recorder— Sullenberger: “my plane,” Skiles: “your plane”) from his copilot and started assess-ing the situation and his options as Skiles began to go through a three- page check-list to try to restart each engine in turn. Although they were still too low to reach any runway, they had enough height to clear George Washington Bridge. The Air-bus’s fly- by-wire technology somewhat facilitated the handling of the aircraft in these unusual circumstances. There is, however, no substitute for the cool- headed thinking and perfect execution that come only with repeated training, drills, and experience, even for a cockpit crew that had met just 30 minutes earlier.
The simple instructions—“Brace for impact”—given 90 seconds before ditch-ing were enough for the flight attendants to go through a well- rehearsed lifesaving routine. Their familiarity with the procedure allowed them to perform quickly and calmly, thereby avoiding panic setting in among the untrained passengers. The captain’s training led him to pick a location on the Hudson River close to operat-ing boats, allowing for a quick rescue. Getting the flaps out at the right time and hitting the “ditching button” to close openings that would otherwise let the water in were critical actions that were performed “by the book.”
Evacuating 155 very scared passengers is certainly not something that the three flight attendants could have improvised. Here, again, a well- designed proto-col, drilled in through repeated training, kicked in when it was required. The plane was fully evacuated in three minutes—by the book again—in standard time. All passengers and crew survived, and there were only five serious injuries. This was one of the most successful ditchings of an airliner in history. Thank goodness for a good book—shared, trusted, and well understood by all—when it is time to act quickly and synchronously.
1.2.3 Comparing the Two events
It does not take anything away from the skills and human qualities of Captain Sul-lenberger to observe that flight 1549 did not simply avoid disaster because of the lone heroic actions of a superman. It did so because of the disciplined actions of a team of well- trained, experienced, level- headed employees, acting responsibly according to procedures, using equipment designed and maintained with just such an event in mind, under able leadership. His decision to ditch in the Hudson was his to make and to assume. He did not wait for instructions to proceed. Indeed, this would most probably have meant disaster, as Sullenberger himself had the best information to assess the situation and, with his team, was in the best position to execute it. His
H1490_Harvey.indd 7 7/9/15 8:53 AM

8 Chapter One
actions were totally in line with his training and best flying practice. The coordina-tion system with his teammates and the air traffic controllers never broke down. In fact, the “framework” responded perfectly to the full and appropriate exercise of his freedom. Nothing else could have produced such a positive outcome.
The single most important difference between the two situations is that much effort and resources have been dedicated over the years at US Airways, Airbus, the Federal Aviation Administration (FAA), and the National Transportation Safety Board (NTSB), among others, toward building and continuously improving a quality system, that is, a system to ensure that desired customer outcomes are delivered reliably and flawlessly, even in the face of rare events. This investment and the resulting quality culture allowed all the players involved to communi-cate clearly and economically, to act effectively, and to coordinate seamlessly, even though they had never worked together prior to that day. This was obviously not the case at Southern Pacific at the time. The NTSB’s detailed investigation of the event, however, provided Southern Pacific with a wealth of information about how to avoid a recurrence. A failure from which you learn is a step forward toward becoming a better organization. However, this is learning the hard way, and it comes too late to do any good for the four victims.
Designing and operating a quality system requires a thorough understanding of the nature of the task, of what could go wrong (failure modes), and of the best way to deal with such emergencies. Again, this does not require a stroke of genius, but dedicated, rigorous efforts over time to think risks through, learn from varia-tions and defects, and use these lessons to continuously improve processes. Taking resources away from daily operations—with the immediate pain that this inflicts on the organization—to dedicate them to this long- term task, with no immediately visible benefits, requires vision, wisdom, strength, and leadership. This is nothing new, as the next example illustrates.
1.2.4 going Back Farther: The Trip of the James Caird 2
On April 24, 1916, the James Caird left Elephant Island near the South Pole with a crew of six, leaving the remaining 22 members of the British expedition stranded on the island waiting for the relief that the Caird would hopefully send back when it reached the Norwegian whaling station on South Georgia Island, some 1300 kilometers away. The boat was skippered by E. H. Shackleton, who had orga-nized and led the expedition that set out to perform the first land crossing of the Antarctic continent. Facing a particularly harsh winter, their ship, the Endurance, had been caught in the ice pack that had formed, and as Shackleton put it, “What the ice gets, the ice does not surrender.” In the middle of the Antarctic winter, the boat had indeed been crushed by the ice, leaving the crew stranded on the ice pack, hundreds of miles from the nearest land.
Through wonderful execution allowed by well- honed reflexes and splendid resolve, the crew had succeeded in escaping the melting ice pack the following summer and reaching Elephant Island on three lifeboats, with no loss of life. Reaching South Georgia Island before the new winter set in was their only hope of survival. The success of the expedition hinged on the hardware (or infrastructure) and the software, including processes and the people factor.
H1490_Harvey.indd 8 7/9/15 8:53 AM

Toward Value and STraTegic adVanTage Through rigorouS execuTion 9
One of the lifeboats was improvised by the team’s carpenter as best he could with salvaged material: a combination of naval carpentry processes and improvi-sation upgraded the infrastructure to the level required for the task. Shackleton picked his crew carefully (people processes), making sure he had all the expertise on board that he would need (process mastery). The crew managed several vital processes, including:
• Navigation—taking a sight with the sextant, dead reckoning, and plotting a course
• Sailing—“reading” the sea, the ice, and the weather; steering the ship; and giving instructions to set sails, trim sales as required, assess progress, adjust to conditions, foresee what’s coming, and correct course
• Bailing the water to keep the boat afloat
A flaw in any of these processes would mean certain death for the six men and their mates waiting for rescue on Elephant Island.
Consider navigation error. Because of the distance, a very small error when taking a sight or dead reckoning would mean missing South Georgia Island, sail-ing endlessly in the South Atlantic, and running short of drinking water within a few days. Calculating the angle of the sun with the horizon using a sextant requires some stability. In a seven- meter lifeboat navigating the most turbulent sea on earth under a cloudy sky, performing this with the required precision is an amazing feat. To reduce variation to a tolerable level when taking a sight, for instance, Captain Frank Worsley developed an approach whereby two fellow crew members bracing him on both sides, like bookends, would stabilize him at the hip. To further reduce measurement error, they took several readings until the mean reading stabilized. Such meticulous focus on reducing variation in critical processes is a distinctive feature of high- performance organizations.
Shackleton also paid careful attention to the people factor, that is, the human qualities and compatibility of character among the crew, as the men had already lived in proximity and depended on each other for survival for the last 14 months since they had left civilization. He monitored the crew’s situation on board con-tinuously and took appropriate measures, such as having hot drinks prepared for everyone, when he detected a human situation that needed to be dealt with.
They successfully landed the craft on South Georgia Island after a 16-day voy-age that stretched the limits of human endurance. As they were on the wrong side of the island, they still had to cross unexplored Antarctic terrain by foot through crevasses, cliffs, glaciers, blinding snowstorms, and treacherous ice. They reached the whaling station totally exhausted on May 21, 1916. “Who the hell are you?” asked the incredulous Norwegian station chief as the men appeared out of nowhere. “My name is Shackleton” was the bearded man’s simple reply to the at- first incredulous, then highly emotional reaction of the first witnesses of one of the most phenomenal feats of exploration and navigation in history.
While we may be better able nowadays to name the various phenomena involved in high- performance processes, they are nothing new. From Phoenician sailors to Roman engineers and medieval artisans, human history is about get-ting better at producing results. The path of improvement, obviously, has been anything but linear, with numerous regressions and forgetting, and plenty of
H1490_Harvey.indd 9 7/15/15 10:26 AM

10 Chapter One
superstition meshed with the growing knowledge and know- how. What is differ-ent today is the complexity of the world. With globalized markets, instantaneous communication and access to data, phenomenal computing capability, the need for quick response and nimbleness, and strong international competition, coopera-tion, and coopetition, managing the ingredients of high performance presents new challenges and requires more method.3 The goal, however, is not to do better than Shackleton’s Endurance crew did in its time. It is in fact to try to do as well as they did, but in a world that is infinitely more complex.
The three situations just described highlight the importance of having a good game plan that adapts as the game unfolds, good infrastructure, the right people, processes, teamwork, commitment, and rigor. Clearly, the new “hardware” avail-able today makes it possible to deal with complexity. It is only a qualifier, however, since any organization can acquire it. The differentiator lies in the “software”—the way the infrastructure is used and deployed to systematically create more value for the organization’s customers, that is, to become a learning organization. This is the subject of the next section.
1.3 The dimenSiOnS OF The Learning OrganizaTiOnThe learning organization has strategic, organizational, and operational dimen-sions. We discuss these in turn.
1.3.1 Strategic Considerations: Leadership and a good game Plan Based on Capabilities
Reaching the South Pole involved raising the necessary funding; planning the expe-dition in detail; assembling the right people, the proper material, and provisions; transporting crew, equipment, and provisions by sea to Antarctica, as close as pos-sible to the destination; crossing the continent to the pole; coming back to the boat; and sailing back home. Any flaw in the initial steps could prove fatal later on in the expedition. Thus, good planning is crucial. Being willing and able to adjust the plan as reality unfolds in unexpected ways is no less critical a skill. It requires getting the facts right, taking a hard look at them no matter how much they differ from what we expected to see (or wished we would see), exploring options creatively, and making choices soundly based on clear priorities and well- understood capabilities.
It is the task of leaders to elaborate such plans, frame them into a compel-ling vision, and get everyone to understand it, buy into it, and then contribute to making it happen. Robert Falcon Scott’s death with his crew in 1912 while trying to make his way back from the South Pole was a source of moral inspiration for the Britons. It was not an example of good planning, however. While the expedi-tion involved many unknowns and great challenges, it was clear that being adept at managing dog sleighs and skiing in difficult terrain were critical capabilities for the success of the expedition. Yet Scott failed either to see the importance of these capabilities or to appreciate the extent to which his team had (or lacked, as it were) the required skills and what it would require to acquire them. Yet, his plan assumed those capabilities. Unfortunately, there is no good way to execute a bad plan. Scott’s rival Roald Amundsen laid out detailed plans based on his team’s mastery of these core processes. He reached the South Pole on December 14, 1911, 35 days before Scott. Scott and his team never made it back.
H1490_Harvey.indd 10 7/9/15 8:53 AM

Toward Value and STraTegic adVanTage Through rigorouS execuTion 11
The success of complex projects, like the success of ongoing organizations (see Box 1.1), value networks (see Box 1.2), and societies (see section 1.3.2.1) as a whole, is predicated on the mastery of a critical set of interrelated processes. “People pro-cesses” (Bossidy and Charan 2002, pp. 22–27) such as recruiting people with the right skill set and the right mind- set, sharing common mental frameworks, and keeping them motivated and working harmoniously together are among these. Processes are shared, clearly defined, and well- controlled ways of doing things together (see Chapter 3 for a detailed discussion). They are inseparable from the discipline required to carry them through, repeatedly. Daily operation of these processes requires close monitoring, early detection of defects, quick correction, learning, and improvement. The challenge for organizations is to design logical chains of commitment, feedback mechanisms, and process management struc-tures that ensure such quick mutual adjustment, adaptation, and learning.
1.3.2 Organizational Considerations: Commitments
As a customer trying to resolve an issue with a service provider, you should first try to deal with someone who is really trying to resolve it. This is easy to ascertain. Is the person actually listening to me or is her mind somewhere else? Is she look-ing for solutions or merely protecting herself—telling me I am at fault or someone else is at fault—and trying to close the episode by sending me somewhere else so that she can get back to her work as soon as possible? The body language tells it all. This is equally true when you are trying to resolve an issue with an internal service provider or supplier. When you reach a conclusion about this, this is a moment of truth (see Chapter 2). Now you know whether you can depend on that provider. Organizations with a logical and solid chain of such commitments deliver value. Others create frustration and waste resources. We now turn to three examples of processes gone awry in society at large, in a small professional service organiza-tion (PSO), and in an international service network.
1.3.2.1 Aligning the Chain of Commitment and Incentives to the Value Creation Flow—A Societal Example
The so- called subprime crisis of 2008 was the end result of a self- destructing chain of counterproductive inducements and a commitment to get rich quick, at any cost to others.
The mortgage lender would try to find anyone willing to buy a ridiculously big house, with a ridiculously low down payment, a very low interest rate, and low payments that the borrower could afford . . . for a while. The narrative would go more or less as follows: “What have you got to lose? You move into this beauti-ful new house with your family. Don’t you think you owe it to them? Don’t you think they deserve it? Within 12 months, the house will have gone up at least 10% in value—and I am being very conservative right now, just to be on the safe side. And it will keep going up. There is such demand out there. No way is this ending soon. You can then borrow on the value of the house, sell it to cash in, whatever.”
As unconscionable, unethical, and unsustainable as the loan was, the lender would then proceed with the loan, the credit department would approve it, and disbursement would proceed without a hitch. The bank would then sell the loan to an institution (such as Fannie Mae or Freddie Mac) that would buy a huge portfo-lio, pool the mortgages, and “securitize it,” that is, create a derived financial prod-uct (derivative) that would be sold in unit shares, mostly to institutional investors.
H1490_Harvey.indd 11 7/9/15 8:53 AM
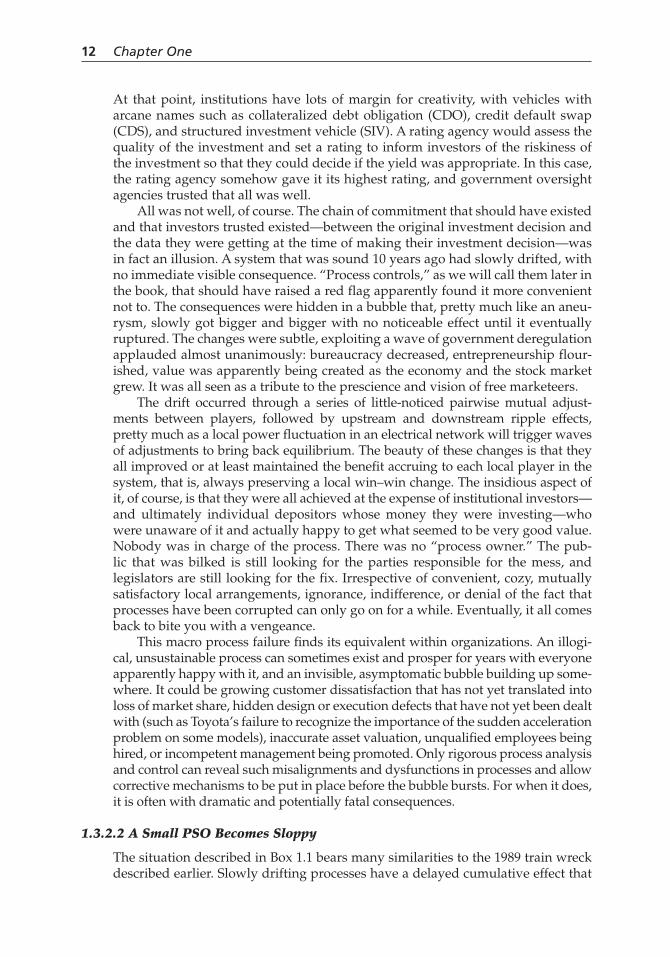
12 Chapter One
At that point, institutions have lots of margin for creativity, with vehicles with arcane names such as collateralized debt obligation (CDO), credit default swap (CDS), and structured investment vehicle (SIV). A rating agency would assess the quality of the investment and set a rating to inform investors of the riskiness of the investment so that they could decide if the yield was appropriate. In this case, the rating agency somehow gave it its highest rating, and government oversight agencies trusted that all was well.
All was not well, of course. The chain of commitment that should have existed and that investors trusted existed—between the original investment decision and the data they were getting at the time of making their investment decision—was in fact an illusion. A system that was sound 10 years ago had slowly drifted, with no immediate visible consequence. “Process controls,” as we will call them later in the book, that should have raised a red flag apparently found it more convenient not to. The consequences were hidden in a bubble that, pretty much like an aneu-rysm, slowly got bigger and bigger with no noticeable effect until it eventually ruptured. The changes were subtle, exploiting a wave of government deregulation applauded almost unanimously: bureaucracy decreased, entrepreneurship flour-ished, value was apparently being created as the economy and the stock market grew. It was all seen as a tribute to the prescience and vision of free marketeers.
The drift occurred through a series of little- noticed pairwise mutual adjust-ments between players, followed by upstream and downstream ripple effects, pretty much as a local power fluctuation in an electrical network will trigger waves of adjustments to bring back equilibrium. The beauty of these changes is that they all improved or at least maintained the benefit accruing to each local player in the system, that is, always preserving a local win–win change. The insidious aspect of it, of course, is that they were all achieved at the expense of institutional investors— and ultimately individual depositors whose money they were investing—who were unaware of it and actually happy to get what seemed to be very good value. Nobody was in charge of the process. There was no “process owner.” The pub-lic that was bilked is still looking for the parties responsible for the mess, and legislators are still looking for the fix. Irrespective of convenient, cozy, mutually satisfactory local arrangements, ignorance, indifference, or denial of the fact that processes have been corrupted can only go on for a while. Eventually, it all comes back to bite you with a vengeance.
This macro process failure finds its equivalent within organizations. An illogi-cal, unsustainable process can sometimes exist and prosper for years with everyone apparently happy with it, and an invisible, asymptomatic bubble building up some-where. It could be growing customer dissatisfaction that has not yet translated into loss of market share, hidden design or execution defects that have not yet been dealt with (such as Toyota’s failure to recognize the importance of the sudden acceleration problem on some models), inaccurate asset valuation, unqualified employees being hired, or incompetent management being promoted. Only rigorous process analysis and control can reveal such misalignments and dysfunctions in processes and allow corrective mechanisms to be put in place before the bubble bursts. For when it does, it is often with dramatic and potentially fatal consequences.
1.3.2.2 A Small PSO Becomes Sloppy
The situation described in Box 1.1 bears many similarities to the 1989 train wreck described earlier. Slowly drifting processes have a delayed cumulative effect that
H1490_Harvey.indd 12 7/9/15 8:53 AM
407
Aachieved positioning, in the market, 50Achieving Competitive Excellence (ACE),
355–356activity cycles (exercise), 64–65activity-based costing (ABC), 359activity-based management (ABM), 359adaptability, of process, 101Africa, development approach, 259airport, 71, 71f, 72–75, 210fAmerican Productivity & Quality Center
(APQC), 78process model, 78f, 122
Amundsen, Roald, 10analyze, phase of DMAIC methodology,
276–295Apgar, Virginia, 16Apgar scale, 16, 146architecture and design, 48, 151Arthur Andersen, 126artisan process, 131–134, 133fattribution error, 19–21automation, in processes, 95–96
Bbalanced scorecard, 372–373Basel accords, 352basic element, category of Kano model, 397basic tool project, 247Beijing Olympics (2008), 102benchmarking (exercise), 29best practices, in continuous improvement,
358big Y, 186, 210f, 223t, 224, 224f, 267, 268, 279,
283, 392black box processes, as process improvement
opportunity, 244f, 246blueprint, process, 336–338, 337f
body mass index (BMI), 384, 388–389bull’s-eye element, and Kano model, 397business model, 114
example, Body and Mind Inc. (BMI), 114–116
in professional services, 111–119business process reengineering (BPR), 210,
307, 358business processes, changing (exercises),
29business to business (B2B), positioning in,
56
Ccapability, process, 180–184capability maturity model (CMM), 266, 352capacity, of process, 130capacity planning, 196Carlzon, Jan, 150cause-and-effect diagram, 233–234, 234fchain of commitment, 97–103
aligning to value creation flow, 11challenge, nature of, in processes, 93–94change vehicles, 247–249
in learning organization, 369–370matching to problem, 260–261, 260t
exercise, 262changes
culture as impediment to, 95–96integrating into daily routine, in learning
organization, 367–368changing, moment of truth, 257characterize, phase of DCDV methodology,
314–323, 343child protective services. See Midtown Child
Protective Services (CPS)Churchill, Winston, 360, 388client, versus customer, 38Club Med, 333
Index
Note: Page numbers followed by f refer to figures; those followed by t refer to tables.
H1490_Harvey.indd 407 7/15/15 12:58 PM

408 Index
coherence, of service delivery process, 135–137, 137t
exercise, 141commitment
exercise, 109eye contact as, 100multi-agency process example, 98–101personal example, 98to task or result, 97
complex service delivery process, example of, 72–75
complex services, managing processes in, 21–23
continuous improvementapproaches to, 351–360in learning organization, 365practice of, 349–351
continuous process, 131, 132, 133fcontrol, phase of DMAIC methodology,
302–303control chart, decision rules, 395–396control system (exercise), 206confusion, in processes, 103consulting services, 18, 145, 148–151,
204–205, 266–267, 350, 371coordination, in learning organization, 370correlation diagram, 225, 225fcost-effectiveness, of process, 130critical to process (CTP) variables,
identification, 277t, 278–279critical to satisfaction (CTS) elements, 168
exercise, 172cross-functional processes (exercise), 109culture
changing by creating experiences, 250–251in learning organization, 371
customerversus client, 38internal, 268–271reactions to service offerings, 48–50understanding, 45–48
customer behavior, search for superior value as driver of, 43–45
customer contact, and service processes, 94–95
customer experience, 250–251customer focus, in learning organization, 365customer involvement, and customization,
126–128customer needs (exercises), 65–66, 66fcustomer relationship management (CRM)
systems, 358customer satisfaction, 34–38
and technical quality, 39–40customer surveys, limitations of, 399
customer value equation, 41–45exercise, 67
customization, and customer involvement, 126–128
cycle time, 93
Ddata, rigor in interpretation of, 17–19DCDV (define, characterize, design, verify)
methodology, 307–312design workshop, conducting (exercise),
345versus DMAIC methodology, 344–345understanding, 341–344
decision rules, for control charts, 395–396defects, as waste, 354define
phase of DCDV methodology, 312–314, 342phase of DMAIC methodology, 267–272
delighter, category of Kano model, 397Delphi method, 276Demand Media, 162–163Deming wheel, 369dependent variable (big Y), 224design
detailed, 336–340high-level, 323–336phase of DCDV methodology, 323–340, 344
design methodologyhigh-level view of, 307–312versus improvement methodology, in
learning organization, 368–369understanding, 341–344
desired positioning, in the market, 50diabetes, as complex process control
problem, 382diagnosis, formulating, in DMAIC, 292–295,
293fdiagnostic, stage of PSDPs, 154discipline, 4
as moment of truth, 258dispatch process
in PSDPs, 155–159in hospitals, 156
dissatisfaction, moment of truth, 253–254DMAIC (define, measure, analyze, improve,
control) improvement methodology, 369
versus DCDV methodology, 344–345high-level view of, 263–266kaizen event, conducting (exercise), 305underlying principles, 263–266understanding, 303–304
double-loop learning, 93, 370
H1490_Harvey.indd 408 7/15/15 12:58 PM

Index 409
Eeconomic value added (EVA), 62–63Edwards, Torri, 102effectiveness, of process, 128efficiency, of process, 128–129employee value equation, professional
(exercise), 67empowerment, moment of truth, 255f, 257enabling processes, 107Endurance, 9–10engineering, 24f, 40, 146f, 371Enron Corporation, 126enterprise resource planning (ERP) systems,
93, 358eye contact, as commitment, 100execution, 3–5
rigorous, value and strategic advantage through, 3–29
expectations, in service encounter, 40–41
Ffads, management, 350–351, 350ffailure mode, 289failure mode and effects analysis (FMEA),
288–292, 290t, 292fprocess design, 338
family processes (exercises), 28Fannie Mae, 11Financial Planning Associates, Inc. (FPA),
case study, 165–171, 312–345, 313f, 319f, 321f, 322f, 324f, 326f, 328f, 330f, 334f, 335f, 339f
DCDV methodology at, 312–341, 313f, 316f, 317t, 318t, 319f, 320f, 321f, 322f, 324f, 326f, 327f, 328f, 330f, 334f, 335f, 339f
financial services, 23, 25, 40, 58, 146f, 211–220, 212f, 213f, 214f, 216t, 217f, 218f. See also Financial Planning Associates
fishbone diagram, 279–280 five S (5S), 355five whys, 282–284, 283fFleming, Alexander, 19flexibility of process, 130fortitude, in learning organization, 370–371Freddie Mac, 11From Poverty to Prosperity (Kling and Schulz),
3functional analysis system technique (FAST)
diagram, 48–49, 48f, 75, 212f, 320f
GGaines, Chryste, 102global value network, insurance claim
example, 13, 14Godfather, The (1972), 251Golden Years Drug Store example, 188–198Groundhog Day (1993), 17
HHammer, Michael, 307hazard analysis and critical control points
(HACCP), 352health knowledge base, distilling useful
knowledge from, 388–389Hill, Lawrence, 6Holland, Frank, 6hospitals, dispatch process in, 156house of quality, 212–213, 213f, 318–322, 319f,
321fhuman resources, processes (exercise),
140–141Huygens, Christiaan, 23
II (individual observations) chart, 384–385
preparing (Appendix A), 395–396ICUKU (impact, controllable, uncontrollable,
known, unknown) classification tool, 280–284, 281t, 283f, 296–297
idea evaluation card, 296, 297fimprove, phase of DMAIC methodology,
295–302improvement methodology, versus design
methodology, in learning organization, 368–369
I-MR (individual and moving range) chart, 386, 386f
incentives, aligning to value creation flow, 11–12
indifferent, category of Kano model, 397influence diagram, 226, 226finformation flow, in learning organization,
367information systems and technology (IS/IT),
in continuous improvement, 357–358Information Technology Infrastructure
Library (ITIL), 352inputs, to processes, 95internal customers, 268–271internal professional services, 147inventory, as waste, 354
H1490_Harvey.indd 409 7/15/15 12:58 PM

410 Index
inverse, category of Kano model, 397Ishikawa diagram, 279–280ISO 9000 standards, in continuous
improvement, 351–353
JJames Caird, voyage of, 8–10job concept, delivering, 122–125job shop process, 131–134, 133f
Quality Knowledge Management example, 204–205
Jones, Marion, 102just do it, change vehicle, 248f, 249, 261just-in-time (JIT) methodology, 261
Kkaizen event, 22, 247, 249–261
DMAIC, conducting (exercise), 305exercise, 262learning cycle and, 241–262moments of truth in, 251–259outputs of, 249–250
Kano model (Appendix B), 397–400Keynes, John Maynard, 389knowledge base, in learning organization, 371Korea, development approach, 259
Llabor market
positioning in, 56–61, 60f, 61fprofessional, positioning in, 59–60
leadershipat the moment of truth, 151–153technical quality and, 38–39
leading, moment of truth, 258lean operation, 354–356learning, and processes, 103–108learning cycle, 241–242
and kaizen event, 241–262learning maturity level, 372–373
rating organizational (exercise), 374learning organization, 137–139, 361–374
becoming, 371–374dimensions of, 10–21and structure of book, 23–25, 26f
legal services, 24f, 126–128, 146f, 160–162line flow process, 131–134, 133f
line of visibility, 134logical validity, lack of about causality as
cause for superstition, 19–21
Mmacro blueprint, 338, 339fmacro map, 84, 110, 198–199, 236, 268Malcolm Baldrige National Quality Award
(MBNQA), 353–354, 353fmanagement fads, 350, 350fmanagement style, of learning organization,
362–363matching, stage of PSDPs, 154measure, phase of DMAIC methodology,
272–276measurement
in learning organization, 366in wellness, 382–383
medical services, 24f, 40, 146f, 163–165, 188–204
Medsol Clinic example, 81–83, 156metrics, 171
evaluating impact of processes on, 211–214, 227–229
in scoping, 224–227Midtown Child Protective Services (CPS),
128–130, 198–204, 199f, 202f, 222–238, 224f, 225f, 228f, 230f, 233f, 234f, 235f, 236f, 237f, 238f
mission, process, 77–78, 220–221mission statement, 77–78, 221moments of truth, 150, 150f, 250, 379f
in kaizen event, 253–259leadership and respect at, 151–153
motion, as waste, 355Motorola, Inc., 356muda, 354MySpace, 162
Nnew product, as process improvement
opportunity, 243new service, as process improvement
opportunity, 243nimble payment system, example, 99non-value-added (NVA) tasks, 284–288, 286f
reasons for performing, 284notary, 40, 49f, 339f
Oone-person business (OPB), 377–380
wellness and, 375–394one-worker processes, 90, 90foperational excellence, methodologies and
techniques to achieve, 173–346
H1490_Harvey.indd 410 7/15/15 12:58 PM

Index 411
operational improvement initiatives (OII), 350
identifying most helpful (exercise), 374preparing for, 360–361
operationsand process mission, 220–221and strategy, conceptual framework
linking, 1–172operations strategy
Golden Years Drug Store example, 188–191
and profit leverage, 118–119optimization algorithm, behind Pugh matrix,
335, 336forganization, as system of processes, 78–83organizational dimension, of learning
organization, 11–16other providers’ service systems, in self-
service experience, 35–38outputs, of processes, 95overprocessing, as waste, 355overproduction, as waste, 354
Ppenicillin, discovery of, 19Perry, Nanceen, 102personal health dashboard, 384–388personal processes, 90
changing, 389–391exercises, 28–29improvement methodology, 392targeting (exercise), 394
personal service system, in self-service experience, 36
personal value equation, 57–58performance
category of Kano model, 397of processes, assessing, 217–218selecting processes on the basis of,
214–219physical services system, in self-service
experience, 36plan–do–check–act (PDCA) methodology, 369poka-yoke, 301positioning
Golden Years Drug Store example, 188–191
in labor market, 31, 56–61in the market, 50–56and processes (exercises), 140, 141–144in professional services, 45–56, 125–126real estate example, 52–56
prescription, stage of PSDPs, 154
prescription fulfillment process, managing, Golden Years Drug Store example, 193–195
process, 3, 69–89adaptability of, 102criteria for, 89decision to outsource/offshore, 198definition, 70–78dysfunctional, anatomy of, 375–376improving an existing, 263–305managing, 175–205
Golden Years Drug Store example, 195–198
perimeter, establishing, 235scoping for improvement or design,
222–238selecting for improvement, 210–211versus system, 70–75understanding dynamics of, Midtown
CPS example, 198–201workable, designing, 307–346
process action course (PAC), 266–267process blueprint, 336–337process capability, 180–184process commitment, and the functional
organization, 102–103process concept, versus service package,
325–327process control
Midtown CPS example, 201–204professional considerations in, exercise,
208in professional services, 188–205a systems view, 184–188variation and, 175–184in wellness, 382–383
process drift, pharmacy example, 13process families, 131–134
exercise, 141process flow diagram (PFD), 81–83
preparing (exercise), 108–109process improvement, 241–243, 243f, 263–304
forms of, 301Midtown CPS example, 201–204opportunities, 243–247
process management, in learning organization, 366–367
process management team, 248, 261process mapping, 83–88, 272–275
facilitating by workers, 85–86exercise, 110
process metrics diagram, 228–231process mission, 77, 220–221process model, exercise, 109–110
H1490_Harvey.indd 411 7/15/15 12:58 PM

412 Index
process performanceassessing, 217–218
exercise, 240conducting high-level evaluation of,
231–233process problems, 243–247
matching to change vehicle, 260–261exercise, 262
process space, exploring, 90–97process thinking, in wellness, 381–382process variable, 77processes
assessing current performance of, 217–218exercise, 240
assessing strategic impact of, 214–216black box, as process improvement
opportunity, 246categories of, 106–107characteristics of, 128–131
exercise, 141complex, as process improvement
opportunity, 245–246confusion in, 102–103connecting value to, techniques, 209–240evaluating impact on key metrics, 211–214human resources (exercise), 140–141ineffective, as process improvement
opportunity, 244inefficient, as process improvement
opportunity, 244–245and learning, 103–108managing, in complex services, 21–23nature of, 69–110need for good, 5–10nonexistent, as process improvement
opportunity, 243–244number of players in, 90with physical flow problems, as process
improvement opportunity, 246and positioning (exercises), 140, 141–144prioritizing (exercise), 240priority, formulating mission of (exercise),
240professional service delivery, 145–172rating, importance for clients (exercise),
239reference systems for, 90–92repetitiveness and, 92–93salient, identifying (exercise), 239–240selecting on the basis of salience and
performance, 214–220
understanding, to ensure strategic fit, 128–137
and value, 103–105, 111–144and value creation, 103–108value-adding, 211which to improve, 106–108why to improve, 105-106
product life cycle management (PLM) systems, 358
productivity, of process, 129professional bureaucracy, 146–147
case study, 163–165professional employee value equation
(exercise), 67professional labor market, positioning in,
59–61professional service delivery processes
(PSDPs), 145–172case studies, 162–171dispatch process in, 155–157flows in, 157–160generic view of, 153–154legal services example, 160–162
professional service experience, 148–151delivering, 153–162exercise, 172
professional service firm (PSF), 146case study, 165–171
professional service workers, 58–59professional services
classifying, 145–148exercise, 172
diagnosis in, 38internal, 147positioning in, 45–56, 125–126process control in, 188–205
professionals, characteristics of, 58profit leverage, and operations strategy,
118–119project(s), 92, 260–261
definition, 22, 247setup, 307–312
Pugh design matrix, 329–330, 330f, 332–333, 335–336, 336f
QQS-9000 automotive standard, 352quality, in learning organization, 365quality function deployment (QFD), 212–213quality of service, 32–41quasi-manufacturing services, 147
case study, 162–163
H1490_Harvey.indd 412 7/15/15 2:11 PM

Index 413
Rrandom variation, 186ratchet effect, in Kano model, 399reference systems, for processes, 90–92reliability, of process, 131repetitiveness, and processes, 92–93respect, at the moment of truth, 151–153results, in customer satisfaction, 33, 34rigor
business (exercise), 29in learning organization, 16–19, 366need for, 3–5personal (exercise), 29
rigorous execution, value and strategic advantage through, 3–30
risk identification, 289risk priority number (RPN), 289–291, 302root cause analysis, 282–283Rosenblatt, Richard, 162
Ssalience, selecting processes on the basis of,
214–220sampling, 275–276Sarbanes–Oxley Act of 2002 (SOX), 352scope
assessing, 236reviewing, 236–237
scopingprocess, for improvement of design,
222–237project (exercise), 240
Scott, Robert Falcon, 10segmenting, market, 50–51self-service experience, in customer
satisfaction, 33, 34, 35–38semiautonomous work teams, 249, 261server, 148service concept, 51
delivering, 120–122real estate example, 53
service delivery process (SDP), coherence of, 135–137
service episode/encounter, 32–33before and after, 40–41
service experience, in customer satisfaction, 33, 35
service offerings, customer reaction to, 48–50service package, 170
versus process concept, 325–327specifying effect on client (Appendix B),
397–400
service processes, and customer contact, 94–95
Service Profit Chain, The (Heskett et al.), 118service warranty, 359–360services
complex vs. complicated, 151managing processes in, 21–23
Shackleton, E. H., 8–10shareholder value equation, managing,
62–63Shouldice Hospital, 163–165SITOC (supplier, input, transformation,
output, customer), 70, 190fSix Sigma, 263, 356Skiles, Jeffrey, 7small y, 234–235, 235f, 268, 279SMART (specific, measurable, achievable,
relevant, time-bound) statement, 224, 267, 268
Southern Pacific railway accident, 5–6, 8special cause variation, 186stakeholders, types, 215standard, definition, 351standard deviation (s), 178, 180standards, in continuous improvement,
351–353statistical process control (SPC) (exercise),
206strategic advantage, through rigorous
execution, 3–30strategic overview (exercise), 140strategy
in learning organization, 10–11and operations, conceptual framework
linking, 1–172and process mission, 220–221in professional services, 111–119
strategy-to-process connection, 116, 119–128in learning organization, 365–366
subprime crisis of 2008, 11–12Sullenberger, Chesley, 7superstition
lack of logical validity about causality as cause for, 19–21
using quality principles to break free of, 391
supply chain management (SCM), 357systems, 357
support processes, 107Sydney Summer Olympic Games (2000),
102system
definition, 70versus process, 70–75
H1490_Harvey.indd 413 7/15/15 12:58 PM

414 Index
systems viewexercise, 206Golden Years Drug Store example,
191–193in wellness, 381–382
Ttargeting, and value proposition, 51–52technical quality
customer satisfaction and, 39–40and leadership, 38–39
technologydefinition of, 95four components of, 95in processes, 95–96
technology-based services, 147theory of constraints (TOC), 357togetherness, moment of truth, 256tools
benefits of simultaneous use, 304use in learning organization, 368
total preventive maintenance (TPM), 355total quality management (TQM), 353–354Toyota Motor Corporation, 50transportation, as waste, 355treatment, stage of professional services
delivery processes, 154trust, moment of truth, 253Twain, Mark, 40type I error, 200type II error, 200
Uunderstanding, moment of truth, 256–257US Airways flight 1549 emergency, 7
Vvalue
components of, 37tconnecting to processes, techniques,
209–240nature of, 31–67and processes, 103–105, 111–144as a ratio, 41–43relational approach to, 43through rigorous execution, 3–30superior, search for as driver of customer
behavior, 43–45transactional approach to, 43
value chain, 135value creation
flow, aligning chain of commitment and incentives to, 11–12
mirror image, 32fand processes, 103–108
value network, 135value proposition, 167–168
real estate example, 52–56targeting and, 51–52
value stream, visual representation of (exercise), 141–144
value-added analysis, 284–288, 288fvalue-adding processes, 106–107, 211value-to-process (V2P) model, 122
for one-person business, 377–380variation
and process control, 175–184random, 186and Six Sigma, 356special cause, 186
variation coefficient, 180verify, phase of DCDV methodology, 340–341videos, 23, 24f, 34f, 71f, 113f, 113f, 146f, 176f,
210f, 242f, 263, 264f, 308f, 350f, 376fvirtual service system, in self-service
experience, 36vision, moment of truth, 258voice of the customer, 168–171, 180–181,
183–184voice of the process, 180–181, 183–184, 203,
340
Wwait time, as waste, 355waste
avoiding, 134categories of, 354–355and lean operation, 354–356
wellness, 380–389and one-person business, 375–394
World Wide Web, use of in positioning professional services, 48–49, 51–52
workersfacilitating process mapping by, 85–86number in processes, 90
work flow, 160workout, change vehicle, 248, 248f, 261Worsley, Frank, 9
H1490_Harvey.indd 414 7/15/15 12:58 PM


