
guildresearch_salary2014
47
SURVEY Patti Shank, PhD, CPT 2014 GLOBAL ELEARNING SALARY & COMPENSATION REPORT
-
Upload
openide6tihptk -
Category
Documents
-
view
12 -
download
0
description
Guild
Transcript of guildresearch_salary2014

SURVEY
Patti Shank, PhD, CPT
2014 GLOBAL ELEARNING
SALARY & COMPENSATION
REPORT

2014 Global eLearning Salary & Compensation Report
+ 1 . 7 0 7 . 5 6 6 . 8 9 9 0 w w w. e L e a r n i n g G u i l d . c o mi
SURVEY
© 2014 The eLearning Guild. All rights reserved.
The eLearning Guild
120 Stony Point Rd., Suite 125
Santa Rosa, CA 95401
1.707.566.8990
Written by: Patti Shank, PhD, CPT
Copy Editing: Charles Holcombe
Publication Design: Scott Hanson
Guild Research TypesThe eLearning Guild delivers four specific types of research reports whose single goal is helping you make
sense of the depth of our field. We work with great thinkers to analyze existing and new sources of knowledge
and bring you concise reports that you can use to make important decisions, inform practice, and keep up-
to-date. This is where you will find out about research in the field, new technologies, and what your peers are
doing and thinking, in practical language.
Perspectives: This type of report discusses myths, issues, and concerns, and educates learning and
eLearning practitioners and managers so they can make informed decisions on important issues in the
learning field. These reports include relevant references from the field and provide educated opinions.
Hot Topics: The training industry is constantly coming up with new technologies. This type of report
explains new technologies from all relevant angles to learning and eLearning practitioners and
managers so they can quickly get up to speed on critical new knowledge.
Big Answers: This type of report provides definitive answers to significant questions that learning
and eLearning practitioners and managers need to improve their practice. These reports pull together
relevant research on critical questions in the learning field in an open and practitioner-friendly way.
Survey: This type of report answers questions that learning and eLearning practitioners and managers
have about the thoughts, practices, actions, and choices of other eLearning professionals. These
reports are based on survey responses from eLearning Guild members.
Disclaimer The ratings, information, and opinions set forth on the Guild Research section of The eLearn ing Guild Website,
and in the Guild Research charts and graphs found in this report, are those of the members of The eLearning
Guild. The eLearning Guild, Focuszone Media, Inc., and its officers, employ ees, directors, and shareholders have
no liability for any loss, damage, action, causes of action, expense, cost, or liability including attorney fees,
arising out of any statements, ratings, informa tion, opinions, or claims set forth in the Guild Research section.
See the “Guild Research” section of the Privacy, Membership, and Terms of Use Agreement at http://www.
elearningguild.com/pbuild/linkbuilder.cfm?selection=fol.12.
2014 Global eLearning Salary & Compensation Report
+ 1 . 7 0 7 . 5 6 6 . 8 9 9 0 w w w. e L e a r n i n g G u i l d . c o mii
SURVEY
License Agreement for Guild ResearchThe eLearning Guild (the “Guild”) provides charts, graphs, studies, reports, and other research materials
in the field of eLearning on its website and in printed form (the “Materials”) for use by persons engaged
in ad vancing research and study in eLearning. Except as provided herein, none of the Materials may be
duplicated, copied, re-published, or reused without written permission from the Guild. The Materials reflect
the research and opinion of the Guild’s members, as well as the opinions of certain subject matter experts
contracted by the Guild.
The Guild grants a limited, non-exclusive, non-transferable license to each user permitted under the
particular license category he/they have purchased (each “Member,” “Member-Plus,” or “Premium Member”
being a “Licensee”) to use the Materials in accordance with the following terms and conditions:
1. Except as otherwise restricted in this License Agreement, Licensee may read, download, and print
the Materials for Licensee’s personal use for purposes of research, evaluation, development, and
testing in order to advance knowledge in the field of eLearning.
2. Licensee may cite, reproduce, or copy up to four statistics, tables, graphs, or charts in any 12-month
period, but may not reproduce images that show product comparisons without written permission
from the Guild. Additional citations, reproductions, or copies may be made only with written
permission from the Guild.
3. The Guild must be cited as the source of any original statistics, tables, graphs, charts, or any other
Materials copied or reproduced by Licensee. The citation to the Guild as the source must be in
eight-point font or larger, and be placed immediately following the portion of the Materials used
by Licensee.
4. Licensee may not use or distribute the materials for commercial purposes, directly or indirectly.
Com mercial use or distribution of the Materials is permitted only pursuant to a separate reprint/
redistribution commercial license agreement between Licensee and the Guild. The Guild retains all
commercial rights in the Materials.
5. This License Agreement grants to Licensee no right, title, or interest in or to the Guild’s copyrights
or other intellectual property in the Materials. Other than the specific rights granted by this License
Agree ment, the Guild retains all right, title, and interest in and to the Materials.
6. The Guild makes no representations or warranties of any kind, express or implied, with regard to
the Materials. The Guild makes no express or implied warranties of merchantability or fitness for a
particular purpose with regard to the Materials, and no warranty that the use of the Materials will not
infringe any patent, copyright, trademark, or other intellectual or proprietary rights.
7. Licensee agrees to use the materials in compliance with all applicable laws.
8. In any use of the Materials by Licensee, Licensee may not, in any way, indicate or imply that the Guild
has endorsed Licensee or its products.
9. Neither the Guild, nor its employees, agents, or representatives, will be liable or responsible to
Licensee in any manner whatsoever for damages of any nature, incidental, consequential, or punitive,
arising from the termination of this License Agreement or the use of the Materials by Licensee.
10. The provisions of the Privacy, Membership, and Terms of Use Agreement between Licensee and the
Guild, including specifically but without limitation the Guild Research section of such agreement, are
incorporated in this License Agreement by reference, and are a part of this License Agreement.
11. This License Agreement is to be construed and enforced in accordance with the laws of the state of
California. The parties consent to the exclusive jurisdiction of the state and federal courts located in
Sonoma County, California.

2014 Global eLearning Salary & Compensation Report
+ 1 . 7 0 7 . 5 6 6 . 8 9 9 0 w w w. e L e a r n i n g G u i l d . c o miii
SURVEY
Table of Contents
Executive Summary ...........................................................................................................................................................1
Average (Mean) Salaries ............................................................................................................................................... 2
Methodology and Demographics ...........................................................................................................................4
Five-year Global Compensation Trends ............................................................................................................. 7
Additional Compensation .............................................................................................................................................. 9
Last Merit Increase, Full-time Hours Worked, and Vacation Days .................................................. 11
Last Merit Increase ............................................................................................................................................................11
Hours Worked ....................................................................................................................................................................12
Vacation Days ....................................................................................................................................................................13
Variables Associated with Salary .......................................................................................................................... 14
Gender ..................................................................................................................................................................................14
Hourly Rate Differences .................................................................................................................................................15
Global Salary Comparison Data ..................................................................................................................................16
Region ........................................................................................................................................................................... 17
Industry ......................................................................................................................................................................... 17
Company Size ........................................................................................................................................................... 20
Number of People Managed .................................................................................................................................21
Years of Experience in eLearning .......................................................................................................................22
Education Variables ................................................................................................................................................22
Job Focus Variables ................................................................................................................................................24
Examples ................................................................................................................................................................................26
Scenario One: Employee in Austria Preparing to Negotiate a Salary Increase.........................................27
Scenario Two: Executive in the US Staffing a New eLearning Department ...............................................28
Scenario Three: Candidate in Canada Interviewing for New Job ..................................................................29
Scenario Four: Instructional Designer in the US Determining the Value of a Master’s Degree ......... 30
Appendix A: Regional Groupings .........................................................................................................................33
Appendix B: United States Salary Comparison Data ..............................................................................35
Appendix C: Canadian Province and Territory Average Salary Data ...........................................39
Resources .............................................................................................................................................................................. 41
The eLearning Guild .........................................................................................................................................................41
Other Resources ...............................................................................................................................................................41
About the Author .............................................................................................................................................................42

The eLearning Guild Academy’s new online training delivers live, scheduled, facilitated instruction focused on the acquisition and application of new skills in the context of real-world situations. Choose from a vari-ety of educational opportunities to help you master the skills that will make a difference in your career.
Private training sessions for teams of 10 or more are available for several Guild Academy courses. For more information, please contact Steve Firpo at [email protected] or +1.707.566.8990 x306.
Private Training for Teams
www.elgd.co/academy +1.707.566.8990
NEW! LIVE ONLINE TRAINING
Registration Is Now Open!
Video Production for eLearning
with Stephen HaskinStarts February 24
The Business of Instructional Design
with Tracy Bissette Starts February 26
Articulate Storyline Basic
with Stefanie LawlessStarts March 3
Facilitation Skills for Virtual Trainers
with Hyder, Olson, ChambersStarts March 4
Adobe Presenter 9
with Pooja JaisinghStarts March 5
HTML5 & CSS: Fundamentals for
eLearning Developers
with Mark Lassoff Starts March 25
Instructional Design: The A.G.I.L.E. Approach
with Conrad GottfredsonStarts March 31
Articulate Storyline Advanced
with Stefanie LawlessStarts March 31
2014 Global eLearning Salary & Compensation Report
+ 1 . 7 0 7 . 5 6 6 . 8 9 9 0 w w w. e L e a r n i n g G u i l d . c o m1
SURVEY
Executive Summary
The eLearning Guild’s 2014 Salary & Compensation Survey found that this was a year of flat
salary growth for the United States and Canada and of decreases in salaries for the United
Kingdom and Australia. While it might appear at first glance that the United States being 3.1%
higher and Canada being 3.4% higher than the 2014 average (mean) global eLearning salary
respectively are good news, a deeper look shows that both countries’ salaries have actually
been flat for the past five years.
Figure 6 (on page 8) shows that Australia, Canada, the United Kingdom, and the United States
experienced a decrease in average salaries in 2014, which is the opposite of what we saw last
year. The United Kingdom saw the largest drop of 7.1%. Australia’s salaries had been growing
in the past few years, but dipped 4.7% this past year. Australia leads all countries and regions
with the highest average salary among the four respondents. India was the only one of the five
highlighted countries to see a rise from the previous year, having risen 9.4% from 2013.
The 2014 average global salary is $76,530 and the 2014 average US salary is $78,932. (In order
to use a common currency throughout, the report shows all salaries in US dollars [USD], which
allows us to make comparisons.) The 2014 average global salary is down 1.5% from 2013, when
it was $77,682. The average US salary is essentially the same as 2013, a 0.1% change, when it
was $78,984.
There were 2,476 (41.8%) male and 3,447 (58.2%) female respondents. Of all respondents, 13%
were contractors, 86.4% were employees, and 0.6% were unemployed. Of people responding
to the survey, 89.3% were full-time and 10.7% were part-time.
Average global salaries vary dramatically, ranging from $94,665 in Australia to $33,743 in
India. Globally, pay for men is consistently more than for women in most geographic regions
of the world. Women’s average eLearning salaries are 9.7% lower, on average, than men’s.
The average hourly pay rate in eLearning is $37 per hour, one dollar more than last year, and
hourly rates are higher in the United States than outside the United States. The average full-
time workweek is 44.5 hours in 2014, down from 44.9 hours in 2013.
In this report, we explore trends in pay and look at how full- and part-time employment
status, country, regional areas, gender, industry, company size, number of people managed,
years of eLearning experience, years of education, and job focus influence salary calculations.
It’s critical to note that there are more variables than these that impact salaries, and the
connection between salary variables and salary is likely far more complex than is obvious.
2014 Global eLearning Salary & Compensation Report
+ 1 . 7 0 7 . 5 6 6 . 8 9 9 0 w w w. e L e a r n i n g G u i l d . c o m2
SURVEY
Average (Mean) Salaries
We begin our 2014 Global eLearning Salary & Compensation Report with average (mean)
salaries, which come from the 5,923 eLearning Guild members worldwide who provided their
salary and compensation information as part of eLearning Guild general membership data. It
is interesting to note that this number represents a 25.9% increase in respondents over last
year. This is good news for our members, as increased response, especially internationally,
improves the validity of the salaries from other countries and regions and allows for improved
benchmarking. (See the Methodology and Demographics section.)
Figure 1 (on page 3) shows the 2014 average global salary by continent and region, which
includes the average US salary. It also shows the number of respondents reporting for each
continent and region. In some cases, we grouped together data with smaller numbers of
respondents into “Other” (for example, Other Asia, Other Europe). See Appendix A for the
detailed list of countries and the groupings by region.
In some continents, regional areas, and countries, the number of respondents are small. When
the numbers are quite small (for example, the Netherlands), it is difficult to say that the average
salaries shown are representative. They become more representative as the response increases.

2014 Global eLearning Salary & Compensation Report
+ 1 . 7 0 7 . 5 6 6 . 8 9 9 0 w w w. e L e a r n i n g G u i l d . c o m3
SURVEY
Figure 1: Average global salary by continent and region

2014 Global eLearning Salary & Compensation Report
+ 1 . 7 0 7 . 5 6 6 . 8 9 9 0 w w w. e L e a r n i n g G u i l d . c o m4
SURVEY
Methodology and Demographics
For all data except trend data, the data represents the period from January 1 to December
31, 2013. In order to show a common currency throughout to allow comparisons, we show
amounts in US dollars (USD). When members entered salary data, we provided a currency
converter to assist worldwide respondents. We assumed that conversions to US dollars
were accurate.
The response from several countries grew substantially this past year. For example, last year
we had 313 respondents from Canada and this year we have 411, a 31.3% increase. Last year
we had 33 respondents from Africa and this year we have 76. Even our largest audience,
the United States, increased from 3,528 to 4,452 respondents, an increase of 26.2%. We
thank those of you who worked to help us increase the response in your countries. The more
respondents we have, the more valid our regional and country salary averages become, and
the better international data we can provide to you.
There were 2,476 (41.80%) male and 3,447 (58.20%) female respondents. Of all respondents,
13% were contractors, 86.4% were employees, and 0.6% were unemployed. And 89.3% were
full-time and 10.7% were part-time.
Figure 2 shows their length of time in position. More than half of respondents are impacting
fewer than 5,000 employees and close to 28% are impacting fewer than 999 employees (Figure
3 on page 5). Slightly more than 40% consider themselves practitioners (Figure 4 on page 5).
Figure 2: Length of time in position

2014 Global eLearning Salary & Compensation Report
+ 1 . 7 0 7 . 5 6 6 . 8 9 9 0 w w w. e L e a r n i n g G u i l d . c o m5
SURVEY
Figure 3: Number of learners impacted
Figure 4: Job level
Adjustments may have been made to the data for incomplete responses and for the ongoing
use of archived data, and charts in the report may include weighted data or other data
that isn’t apparent. If we found errors in past data, we fixed it in this report. As a result, the
historical trend data in the 2014 report may show some variations from data in past reports.

2014 Global eLearning Salary & Compensation Report
+ 1 . 7 0 7 . 5 6 6 . 8 9 9 0 w w w. e L e a r n i n g G u i l d . c o m6
SURVEY
When totaling the number of respondents in the tables shown in the report, they may not
equal the number of respondents to the survey, as respondents may not have answered every
question. There may also be an extremely slight variation between some respondent counts in
the charts and the totals listed in the appendix due to the reinsertion of some areas with only
one respondent.
RE DEFINING TRAININGwith TECHNOLOGY
March 19 – 21, 2014 | Orlando, FL
Redefining Innovation
Soren Kaplan, Author, Leapfrogging; Writer, Fast Company;
Founder, InnovationPoint
Redefining Data
Douglas Merrill,Co-founder and CEO,
ZestFinance.com; Former Google CIO
Redefining the Mind
Cathy Davidson, Author, Now You See It;
Co-founder, HASTAC
Discover new technologies that are redefining the ways we deliver training and con-tent to our learners, and connect with peers who will show you proven solutions at Learning Solutions 2014.
eLearning Guild Members Save 20% or More!www.LearningSolutions14.com/sal +1.707.566.8990
Keynotes:

2014 Global eLearning Salary & Compensation Report
+ 1 . 7 0 7 . 5 6 6 . 8 9 9 0 w w w. e L e a r n i n g G u i l d . c o m7
SURVEY
Five-year Global Compensation Trends
In this section, we discuss trends in global compensation, including additional compensation
items, over the past five years. We specifically highlight Australia, Canada, the United
Kingdom, the United States, and India.
In Figure 5 you see slight fluctuations in average global compensation every year since 2010.
As of January 2014, average total compensation for 2014 is $80,586, dropping 1.5% from 2013.
See the Additional Compensation subsection for more information on specific changes in
additional compensation such as bonuses.
Figure 5: Five-year trend of average global compensation

2014 Global eLearning Salary & Compensation Report
+ 1 . 7 0 7 . 5 6 6 . 8 9 9 0 w w w. e L e a r n i n g G u i l d . c o m8
SURVEY
Over the past five years, while each year alternates up and down slightly, over time eLearning
compensation has been relatively flat, with salaries worldwide growing by 1.6% over the past
five years and total compensation growing by 0.3% over the past five years.
Figures 6 and 7 (on page 9) show the five-year trend of average respondent salaries in
Australia, Canada, the United Kingdom, the United States, and India. As noted previously, all
amounts reported are in US dollars (USD).
Figure 6: Five-year trend of average global salaries in Australia, Canada, the United Kingdom, and the
United States

2014 Global eLearning Salary & Compensation Report
+ 1 . 7 0 7 . 5 6 6 . 8 9 9 0 w w w. e L e a r n i n g G u i l d . c o m9
SURVEY
Figure 7: Five-year trend of average global salaries in India
Most salaries were quite flat from the previous year. All except India experienced a decrease in
average salaries in 2014, which is the opposite of what we saw last year. The United Kingdom
saw the largest drop, 7.1%. Australia’s salaries had been growing in the past few years but
dipped 4.7% this past year. Australia leads all countries and regions with the highest average
salary among respondents. India was the only one of the five countries to see a rise from the
previous year. It rose 9.4% from 2013.
Additional Compensation
Total additional respondent compensation decreased by 19.7% or $994 (see Figure 8 on page
10) from 2010 to 2014 and 1.6% from 2013 to 2014. In 2014, the average bonus decreased by
5.1%, or $126, from 2013; tuition amount increased by 12.8%, or $123, from 2013; and continuing
education decreased by 9.4%, or $63, from 2013.
It is important to note that many people do not receive these forms of additional compensation.

2014 Global eLearning Salary & Compensation Report
+ 1 . 7 0 7 . 5 6 6 . 8 9 9 0 w w w. e L e a r n i n g G u i l d . c o m10
SURVEY
Figure 8: Five-year trend of average global additional compensation
The eLearning Guild does not track other forms of additional compensation such as stock
options, employee stock purchase plans, retirement plans, holidays, meal allowances,
employer matching, and other benefits. Additional compensation and incentive pay strategies
may vary by country and region depending on the organization.

2014 Global eLearning Salary & Compensation Report
+ 1 . 7 0 7 . 5 6 6 . 8 9 9 0 w w w. e L e a r n i n g G u i l d . c o m11
SURVEY
Last Merit Increase, Full-time Hours Worked, and Vacation Days
In this section, we look at some variables related to compensation, including last merit
increase, the number of hours worked in full-time jobs, and number of vacation days.
Last Merit Increase
Figure 9 shows 51.9% of respondents have had a merit increase in the last year and 4%
received their last merit increase more than 3 years ago. Almost 25% responded that they
have not received any merit increases in the recent past.
Figure 9: Last merit increase
2014 Global eLearning Salary & Compensation Report
+ 1 . 7 0 7 . 5 6 6 . 8 9 9 0 w w w. e L e a r n i n g G u i l d . c o m12
SURVEY
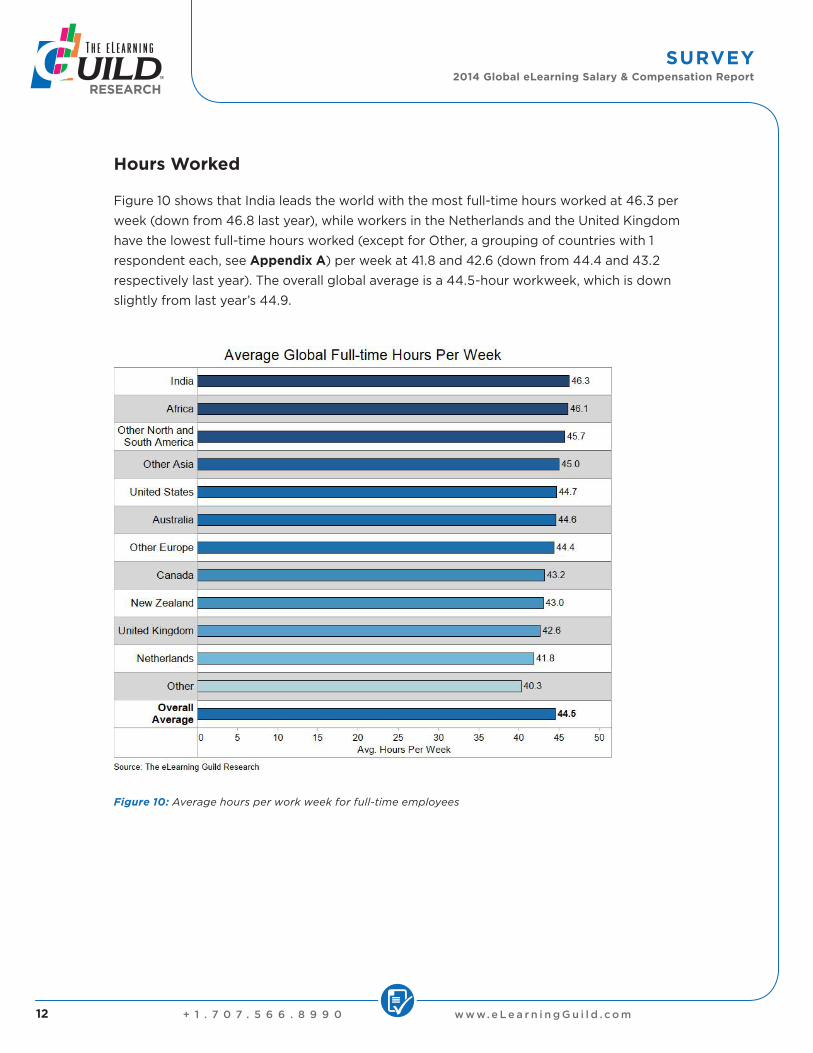
Hours Worked
Figure 10 shows that India leads the world with the most full-time hours worked at 46.3 per
week (down from 46.8 last year), while workers in the Netherlands and the United Kingdom
have the lowest full-time hours worked (except for Other, a grouping of countries with 1
respondent each, see Appendix A) per week at 41.8 and 42.6 (down from 44.4 and 43.2
respectively last year). The overall global average is a 44.5-hour workweek, which is down
slightly from last year’s 44.9.
Figure 10: Average hours per work week for full-time employees
2014 Global eLearning Salary & Compensation Report
+ 1 . 7 0 7 . 5 6 6 . 8 9 9 0 w w w. e L e a r n i n g G u i l d . c o m13
SURVEY
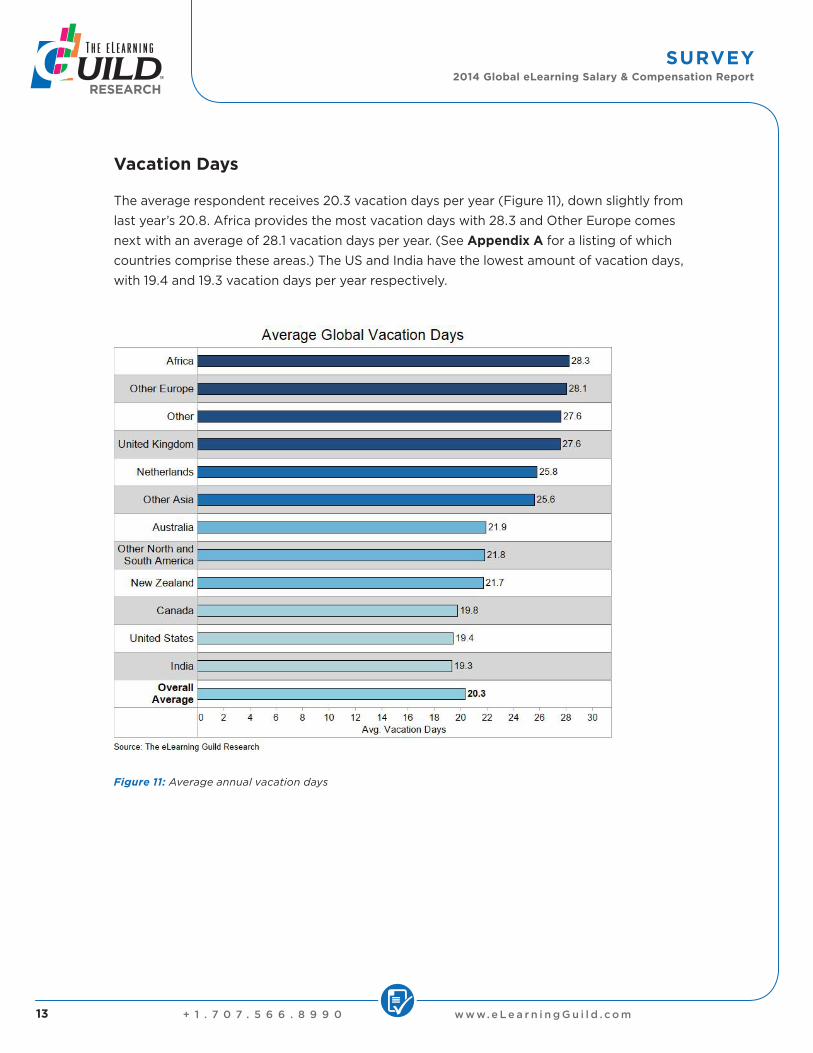
Vacation Days
The average respondent receives 20.3 vacation days per year (Figure 11), down slightly from
last year’s 20.8. Africa provides the most vacation days with 28.3 and Other Europe comes
next with an average of 28.1 vacation days per year. (See Appendix A for a listing of which
countries comprise these areas.) The US and India have the lowest amount of vacation days,
with 19.4 and 19.3 vacation days per year respectively.
Figure 11: Average annual vacation days
2014 Global eLearning Salary & Compensation Report
+ 1 . 7 0 7 . 5 6 6 . 8 9 9 0 w w w. e L e a r n i n g G u i l d . c o m14
SURVEY
Variables Associated with Salary
In the following sections, we show charts and discuss findings related to salary across a
number of variables. In this first section, we discuss gender alone and by region. Next, we
explore hourly rate differences between contractors and employees and part-time vs. full-time
workers. Then we look at how a number of employer and employee variables influence salary.
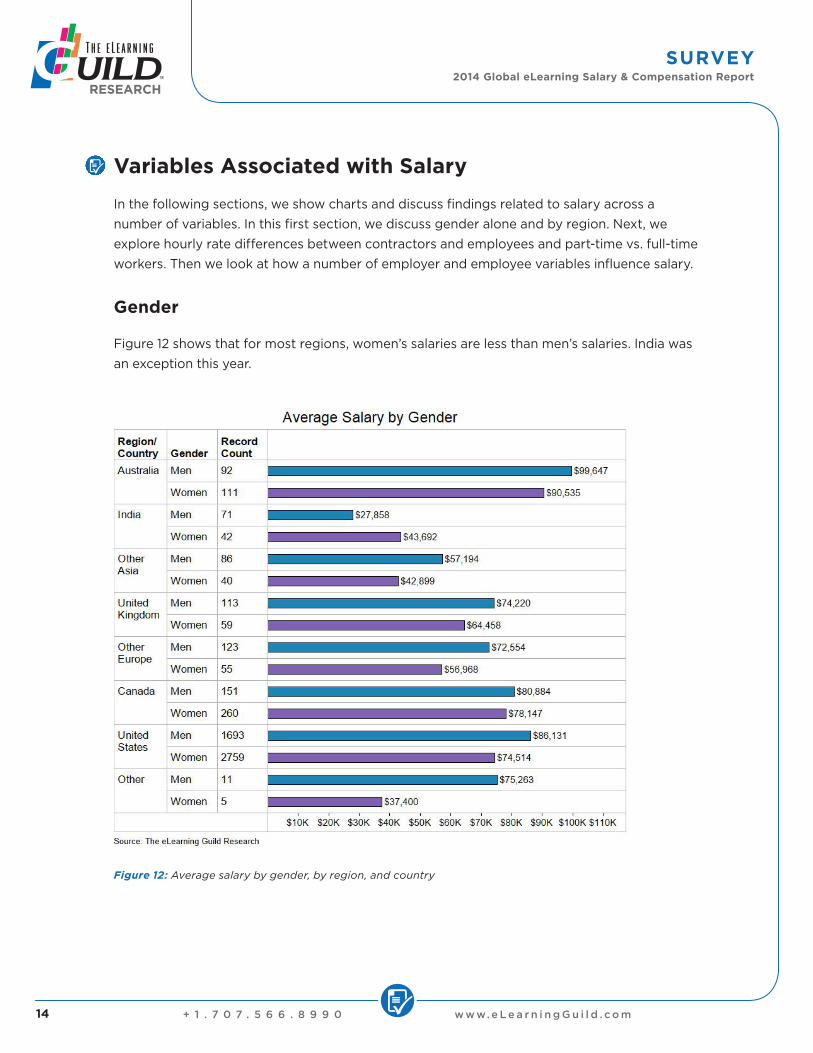
Gender
Figure 12 shows that for most regions, women’s salaries are less than men’s salaries. India was
an exception this year.
Figure 12: Average salary by gender, by region, and country

2014 Global eLearning Salary & Compensation Report
+ 1 . 7 0 7 . 5 6 6 . 8 9 9 0 w w w. e L e a r n i n g G u i l d . c o m15
SURVEY
Table 1 shows the percentage of survey respondents, the count, and the average global salary
by gender. Women’s salaries are 9.7% lower, on average, than men’s and 4.3% lower than the
average global salary.
% of Total
Respondents
Count Avg. Global
Salary (USD)
Men 41.8% 2,476 $81,104
Women 58.2% 3,447 $73,245
Table 1: Percentage of respondents, count, and average global salary by gender
The American Association of University Women (AAUW) research shows that full-time, year-
round women workers are paid 77 percent of what men are paid, and this has been the case
since 2002. Contrary to some assumptions about the gender pay gap having to do with
women taking time off with children, AAUW’s research found that among full-time workers
just a year after college graduation, women at this point were paid just 82% of what their male
counterparts were paid. It also shows that women face a pay gap that grows with age.
The Institute for Women’s Policy Research provides data showing women’s median weekly
earnings are lower in nearly all occupations, whether they work in female-dominated
occupations, male-dominated occupations, or occupations dominated by a mix of females and
males. According to our data, eLearning appears to be no exception.
The World Economic Forum calculates complex global gender gaps by country and region.
Its report, The Global Gender Gap 2012, underscores the impact of gender-based income
disparities.
Hourly Rate Differences
In Figure 13 (on page 16) we see eLearning hourly rates based upon whether the person doing
the work is an employee or a contractor and whether they are full-time or part-time.
The overall average global hourly rate is $37/hour, which rose $1 from last year. Outside
the US, part-timers are earning, on average, $46/hour (up from $43/hour last year). Full-
timers outside the US, on average, earn $31/hour (down from $34/hour last year). Part-
time contractors, on average, earn quite a bit more than part-time employees, but full-time
contractors, on average, earn only a few more dollars per hour than full-time employees do.

2014 Global eLearning Salary & Compensation Report
+ 1 . 7 0 7 . 5 6 6 . 8 9 9 0 w w w. e L e a r n i n g G u i l d . c o m16
SURVEY
In the US, all of the averages are higher than the non-US averages. In the US, part-time
employees earn 42.9% more than full-time employees and full-time contractors, on average,
earn 14.3% more than full-time employees. Part-time contractors, on average, earn 82.5% more
than full-time contractors.
Figure 13: Average hourly rates for part-time and full-time contractors and employees
The Methodology and Demographics section provides information on the split of employees,
contractors, full-time, and part-time respondents in the survey.
Global Salary Comparison Data
For the rest of the report, we will be examining salary comparison data about employer
and employee variables that appear to influence or at least vary along with salary. For
corresponding US salary comparison data, please refer to the charts in Appendix B.
For each of the following charts, you will see percentages associated with the average global
salary of $76,530 (from Figure 1 on page 3). The “average salary delta” refers to a comparison to
the average global salary (or average US salary in the US-specific charts). A positive percentage
means that it is higher than the average global salary of $76,530 by that percentage and a negative
percentage means it is lower than the average global salary of $76,530 by that percentage.
For example, in Figure 14 (on page 17), the average respondent in the US is paid 3.1% more
than the average global salary, while the average worker in the UK is paid 7.4% less than
average global salary.

2014 Global eLearning Salary & Compensation Report
+ 1 . 7 0 7 . 5 6 6 . 8 9 9 0 w w w. e L e a r n i n g G u i l d . c o m17
SURVEY
Region
Figure 14 shows a comparison of pay by region and country, with Australia 23.7% above the
global average salary and India 55.9% below it. Please note that we grouped countries and
regions with small numbers of respondents together. See Appendix A for the number of
respondents in each region. For those regions with a small number of respondents, the salary
differences may not be representative because the numbers may be by chance (because the
survey acquired too few respondents in that area).
Figure 14: Salary difference vs. average global salary of $76,530 by country or region
As compared to 2013, we see most of the countries below the average global salary are further
below the average global salary than in 2013. For example, United Kingdom was -1.8% in 2013
and is -7.4% in 2014. Other Asia was -20.9% is 2013 and is -31.2% in 2014. Both Canada and the
United States gained slightly from 2013 to 2014, from 2.7% to 3.4% and 1.7 to 3.1% respectively.
Industry
Figure 15 (on page 18) shows salary differences across industries. For example, the
Pharmaceutical/Biotech and Energy/Utilities industries pay the most at 26.9% and 22.3%
respectively above the average global salary, and University/College and K-12 Education pay
the least at 18.7% and 23.5% below the average global salary respectively. Telecommunications

2014 Global eLearning Salary & Compensation Report
+ 1 . 7 0 7 . 5 6 6 . 8 9 9 0 w w w. e L e a r n i n g G u i l d . c o m18
SURVEY
and Retail/Wholesale/Distribution pay the closest to the average global salary. Table 2 (on
page 19) shows how many respondents are in each grouping. For those industries with a small
number of respondents, the salary differences may not be representative since the numbers
may be by chance (because the survey acquired too few respondents in that area).
Figure 15: Salary difference vs. average global salary of $76,530 by industry

2014 Global eLearning Salary & Compensation Report
+ 1 . 7 0 7 . 5 6 6 . 8 9 9 0 w w w. e L e a r n i n g G u i l d . c o m19
SURVEY
Industry Average Salary
Difference
Number of
Respondents
Pharmaceuticals/Biotech 26.9% 147
Energy/Utilities 22.3% 130
Computer Manufacturing 18.8% 318
Consulting (Non-computer) 16.3% 446
Government (Federal Including Military) 11.5% 198
Consulting (Computer) 10.1% 228
Aerospace/Defense 7.9% 87
Healthcare 4.4% 471
Financial/Banking/Accounting 3.1% 335
Insurance/Real Estate 2.7% 229
Automotive/Agriculture/Mining 2.2% 92
Manufacturing (Non-computer) 1.9% 182
eLearning Tool/Service Provider 1.7% 667
Telecommunications -0.1% 116
Retail/Wholesale/Distribution -0.5% 185
Construction/Architecture/Engineering -1.7% 57
Travel/Hospitality -3.4% 92
Legal -4.1% 30
Non-Profit/Trade Association -7.8% 234
Marketing/Advertising/Entertainment -8.6% 110
Government (State and Local) -13.7% 186
Education (University/College) -18.7% 1,008
Education (K-12) -23.5% 269
Table 2: Average salary difference and number of respondents by industry

2014 Global eLearning Salary & Compensation Report
+ 1 . 7 0 7 . 5 6 6 . 8 9 9 0 w w w. e L e a r n i n g G u i l d . c o m20
SURVEY
Company Size
Figure 16 shows comparisons of salary by company size. Larger companies tend to have
larger salaries, with companies having 50,000+ employees paying 9.8% more than the global
average salary, and companies with 10,001 – 49,999 paying 3.3% more than the global average
salary. Companies with 1 – 20 employees pay 3.5% above it. The rest are close to the average
global salary, except those between 101 – 1,000 paying 7.1% below it. Table 3 shows how many
respondents are in each grouping.
Figure 16: Salary difference vs. average global salary of $76,530 by company size
Company Size Average Salary
Difference
Number of
Respondents
50,000+ 9.8% 523
1 – 20 3.5% 992
10,001 – 49,999 3.3% 743
21 – 100 1.0% 668
1,001 – 10,000 -1.1% 1,568
101 – 1,000 -7.1% 1,360
Table 3: Average salary difference and number of respondents by company size
2014 Global eLearning Salary & Compensation Report
+ 1 . 7 0 7 . 5 6 6 . 8 9 9 0 w w w. e L e a r n i n g G u i l d . c o m21
SURVEY
Number of People Managed
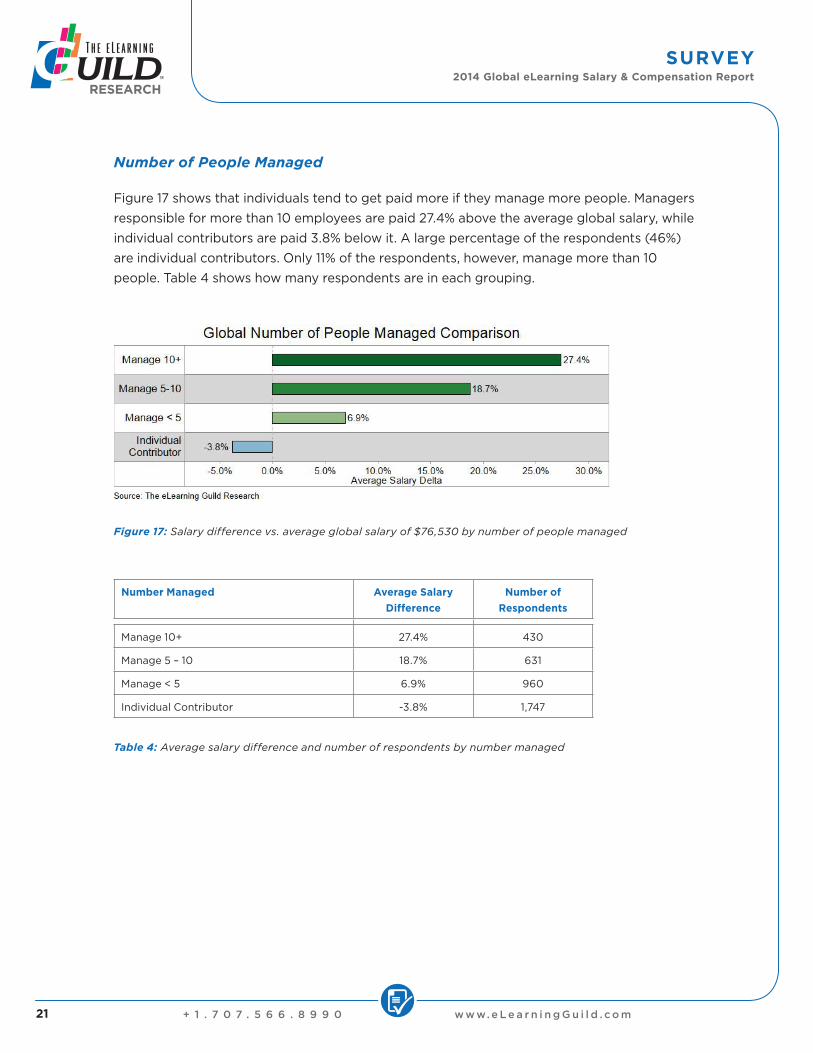
Figure 17 shows that individuals tend to get paid more if they manage more people. Managers
responsible for more than 10 employees are paid 27.4% above the average global salary, while
individual contributors are paid 3.8% below it. A large percentage of the respondents (46%)
are individual contributors. Only 11% of the respondents, however, manage more than 10
people. Table 4 shows how many respondents are in each grouping.
Figure 17: Salary difference vs. average global salary of $76,530 by number of people managed
Number Managed Average Salary
Difference
Number of
Respondents
Manage 10+ 27.4% 430
Manage 5 – 10 18.7% 631
Manage < 5 6.9% 960
Individual Contributor -3.8% 1,747
Table 4: Average salary difference and number of respondents by number managed

2014 Global eLearning Salary & Compensation Report
+ 1 . 7 0 7 . 5 6 6 . 8 9 9 0 w w w. e L e a r n i n g G u i l d . c o m22
SURVEY
Years of Experience in eLearning
Figure 18 shows you that generally, with more experience in eLearning, salaries climb. With
10 – 14 years of experience, for instance, salaries were 11.3% higher, relative to the global
average salary. Table 5 shows you the number of respondents in each grouping.
Figure 18: Salary difference vs. average global salary of $76,530 by number of years in eLearning
Years of eLearning Experience Average Salary
Difference
Number of
Respondents
20+ 26.4% 527
15 – 19 21.7% 679
10 – 14 11.3% 1,184
5 – 9 -4.8% 1,647
0 – 4 -18.1% 1,886
Table 5: Average salary difference and number of respondents by years of eLearning
Education Variables
Graduate degrees tend to be more highly compensated in our field, and there is a significant
difference in pay between a master’s degree and a doctorate degree (Figure 19 on page 23).
Individuals holding a doctorate degree are paid 8.3% above average, while those holding
an associate’s degree are paid 3.2% below average, and those with less than two years of
higher education are paid 0.3% above average. Interestingly, most (89%) of the respondents
reported having a bachelor’s degree or higher level of education, and more than 47% of the
respondents reported having a master’s degree. Table 6 (on page 23) provides the number of
respondents who reported having each level of education.

2014 Global eLearning Salary & Compensation Report
+ 1 . 7 0 7 . 5 6 6 . 8 9 9 0 w w w. e L e a r n i n g G u i l d . c o m23
SURVEY
Figure 19: Salary difference vs. average global salary of $76,530 by level of education
Education Level Average Salary
Difference
Number of
Respondents
Doctorate 8.3% 396
Master's Degree 2.2% 2,793
Less Than 2 Years Higher Education 0.3% 291
Associate's Degree -3.2% 356
Bachelor's Degree -4.0% 2,087
Table 6: Average salary difference and number of respondents in each education grouping
The Guild published a Guild Research Report entitled Degrees for eLearning Professionals:
What’s Needed? in March 2012 about the types of jobs Guild members say they want in this
field and whether degrees help to get them. It can help you determine whether degrees are
worthwhile in this field.

2014 Global eLearning Salary & Compensation Report
+ 1 . 7 0 7 . 5 6 6 . 8 9 9 0 w w w. e L e a r n i n g G u i l d . c o m24
SURVEY
Job Focus Variables
Figure 20 shows that the individual’s job focus can have an impact on salary. For example,
Executive Management receives significantly higher pay than all other types of jobs at 52.3%
above the average global salary. The other job roles range from 32.7% above it for Business
Unit Management to 23.5% below it for Other Writing/Technical/Support. Developers (Web
and Programmers) receive a salary that is closest to the average global salary at 0.7% below
average. Table 7 (on page 25) provides the number of respondents who reported having each
job focus. For those jobs with a small number of respondents, the salary differences may not
be representative since the numbers may be by chance (because the survey acquired too few
respondents in that area).
Figure 20: Salary difference vs. average global salary of $76,530 by job focus

2014 Global eLearning Salary & Compensation Report
+ 1 . 7 0 7 . 5 6 6 . 8 9 9 0 w w w. e L e a r n i n g G u i l d . c o m25
SURVEY
Job Focus Average Salary
Difference
Number of
Respondents
Executive Management 52.3% 188
Business Unit Management 32.7% 90
Strategy and Planning 30.6% 112
Sales/Marketing/Business Development 20.3% 143
Independent Consultant 17.4% 171
Creative Direction 14.9% 65
People/Resource Management 12.2% 102
Curriculum Direction 11.1% 144
Product/Project Management 5.6% 188
Training/Education/Certification/SME 4.9% 779
Development (Web and Programmer) -0.7% 53
Do a Lot/Little of Everything -0.7% 933
Research and Development -6.5% 71
Instructional Design -7.3% 1,514
Information Technology -7.7% 87
Media Production -9.5% 121
LMS/LCMS -10.2% 228
Content Authoring -13.6% 205
Instruction/Training/Coaching -14.6% 623
Other Writing/Technical/Support -23.5% 106
Table 7: Average salary difference and number of respondents by job focus

2014 Global eLearning Salary & Compensation Report
+ 1 . 7 0 7 . 5 6 6 . 8 9 9 0 w w w. e L e a r n i n g G u i l d . c o m26
SURVEY
Examples
In this section we’ll show some examples of how you can use this report to calculate
benchmark salaries. In addition to the scenarios provided here, you can use an online version
of the Guild Research 2014 Salary Calculator to explore your own scenario at
http://www.learningsolutionsmag.com/articles/1352/.
In order to calculate a benchmark salary for yourself or others, you can use the comparison
charts earlier in this report or the charts in Appendix B for US salary calculations. Start with
the average global salary or the average US salary, and then multiply by the adjustments in
each category. Depending on your location, you may also need to convert from US dollars
(USD) to the appropriate currency.
Below we show four scenarios that show how to calculate a benchmark salary from the data
provided in this report. Each scenario involves employees. Contractors who work for many
clients typically charge a multiplier of two or more times the hourly rate reported in Figure 13
(on page 16) to adjust for expenses, administrative time, and benefits. See the 2010 Salary and
Compensation Report—United States for a detailed explanation for calculating contractor pay.
Calculating Percentage Change
In order to calculate percentage change, if X1 represents the old value (such as
salary in 2013) and X2 represents the new value (such as the salary in 2014), the
percentage change is calculated as follows:
% Change = (X2-X1) / X1 x 100%
Example:
• Theoldvalueis$20,000andthenewvalueis$25,000.
• Thepercentagechangeformulalookslikethis:
(25,000 – 20,000)/20,000 x 100% = 5,000/20,000 x 100% = 25%

2014 Global eLearning Salary & Compensation Report
+ 1 . 7 0 7 . 5 6 6 . 8 9 9 0 w w w. e L e a r n i n g G u i l d . c o m27
SURVEY
SCENARIO ONE:
Employee in Austria Preparing to Negotiate a Salary Increase
Rachel, an instructional designer who lives in Austria, is preparing for her annual review. She
wants to negotiate a salary increase. She currently earns 36,750 Euros (EUR) per year. She
works in the banking industry, has seven years of eLearning experience, and holds a bachelor’s
degree. She is an individual contributor, and her organization has 3,800 employees. For this
scenario we used the numbers in Figure 14 through Figure 20 (on pages 17 – 24).
SCENARIO ONE
Region/country/state Austria -11.5%
Industry Financial/banking/accounting 3.1%
Company size 1,000 – 10,000 employees -1.1%
People managed Individual contributor -3.8%
Years of eLearning experience 5 – 9 -4.8%
Education Bachelor’s degree -4.0%
Job focus Instructional design -7.3%
Total adjustments -29.4%
Now we apply these adjustments to the global average salary of $76,530 to calculate a
benchmark salary for Rachel.
Global average salary $76,530
Adjustment of -29.4% -22,499
Benchmark salary in USD $54,031
USD to EUR exchange rate
(at the time of writing this report)
x 0.737
EUR Benchmark Salary €39,821
Rachel should adjust this benchmark salary up or down depending on other variables such as
company, personal, and location-specific ones. Based on this calculation, Rachel may be in a
good position to negotiate a raise, although she may or may not be able to, depending on her
employer’s specific situation and budget for increases and her skills and performance.

2014 Global eLearning Salary & Compensation Report
+ 1 . 7 0 7 . 5 6 6 . 8 9 9 0 w w w. e L e a r n i n g G u i l d . c o m28
SURVEY
SCENARIO TWO:
Executive in the US Staffing a New eLearning Department
Marco is a learning director in California. He is budgeting to start a new eLearning department
for his organization. He works for a real estate company that employs 2,640 individuals.
He wants to hire an instructional designer, a developer, an LMS administrator, and a media
specialist. He wants the instructional designer to have approximately 10 years of experience
and the others to have approximately five years of experience. The instructional designer
position requires a master’s degree and all other jobs require a bachelor’s degree. For this
scenario, we will use the US-specific charts in Appendix B (on page 35 – 38).
SCENARIO TWO
Variables Instructional
Designer
Developer LMS Admin Media
Specialist
Grand Total
Region/country/state: California
12.7% 12.7% 12.7% 12.7%
Industry: Insurance/real estate
1.7% 1.7% 1.7% 1.7%
Company size:
1,001 – 10,000
-0.3% -0.3% -0.3% -0.3%
People managed -6.6% -6.6% -6.6% -6.6%
Years of eLearning experience
11.5% -5.1% -5.1% -5.1%
Education 1.5% -2.5% -2.5% -2.5%
Job focus -7.7% 2.2% -7.7% -6.8%
Total adjustments 12.8% 2.1% -7.8% -6.9%
Average US salary $78,932 $78,932 $78,932 $78,932
Adjustment $10,103 $1,658 -$6,156 -$5,446
Benchmark salary $89,035 $80,590 $72,776 $73,486 $315,887
After applying the adjustments to the average US salary, Marco is looking at a benchmark
cost of $315,887 USD per year to staff his new eLearning department, plus additional costs
for benefits. He will need to adjust his benchmark salaries up or down based on other specific
company, location, and individual candidate-specific variables.
It’s interesting to note that if Marco were hiring in Arizona instead of California, his total
budget would be 6.7% below the national average instead of 12.7% above it.
2014 Global eLearning Salary & Compensation Report
+ 1 . 7 0 7 . 5 6 6 . 8 9 9 0 w w w. e L e a r n i n g G u i l d . c o m29
SURVEY
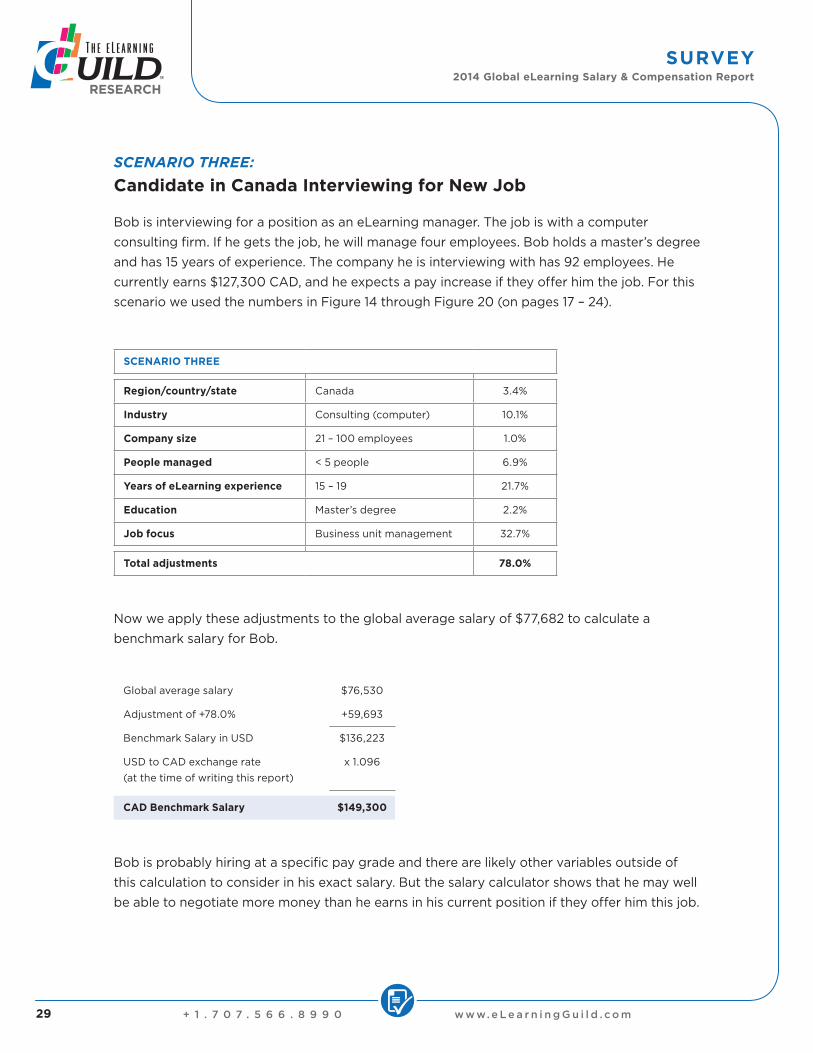
SCENARIO THREE:
Candidate in Canada Interviewing for New Job
Bob is interviewing for a position as an eLearning manager. The job is with a computer
consulting firm. If he gets the job, he will manage four employees. Bob holds a master’s degree
and has 15 years of experience. The company he is interviewing with has 92 employees. He
currently earns $127,300 CAD, and he expects a pay increase if they offer him the job. For this
scenario we used the numbers in Figure 14 through Figure 20 (on pages 17 – 24).
SCENARIO THREE
Region/country/state Canada 3.4%
Industry Consulting (computer) 10.1%
Company size 21 – 100 employees 1.0%
People managed < 5 people 6.9%
Years of eLearning experience 15 – 19 21.7%
Education Master’s degree 2.2%
Job focus Business unit management 32.7%
Total adjustments 78.0%
Now we apply these adjustments to the global average salary of $77,682 to calculate a
benchmark salary for Bob.
Global average salary $76,530
Adjustment of +78.0% +59,693
Benchmark Salary in USD $136,223
USD to CAD exchange rate
(at the time of writing this report)
x 1.096
CAD Benchmark Salary $149,300
Bob is probably hiring at a specific pay grade and there are likely other variables outside of
this calculation to consider in his exact salary. But the salary calculator shows that he may well
be able to negotiate more money than he earns in his current position if they offer him this job.

2014 Global eLearning Salary & Compensation Report
+ 1 . 7 0 7 . 5 6 6 . 8 9 9 0 w w w. e L e a r n i n g G u i l d . c o m30
SURVEY
SCENARIO FOUR:
Instructional Designer in the US Determining the Value of a
Master’s Degree
Marcia is an instructional designer who worked her way up from a content editor. She is
working for a defense contractor in Maryland that has approximately 25,000 employees. She
has six years of experience and really likes working at her company. Her company tends to
promote people with good skills and master’s degrees. Therefore, Marcia is completing her
bachelor’s degree (with only one class left) and has considered starting a master’s degree
program that should only take two years, but wonders if the salary difference is really worth
all the extra time and effort. Her current salary is $69,990. Her supervisor has encouraged her
and the company has a tuition reimbursement plan that will cover a large part of her tuition and
books. For this scenario, we will use the US-specific charts in Appendix B (on pages 35 – 38).
SCENARIO FOUR
NOW AFTER
State Maryland 7.7% Maryland 7.7%
Industry Aerospace/defense 8.6% Aerospace/defense 8.6%
Company size 10,001 – 49,999 2.5% 10,001 – 49,999 2.5%
People managed Individual contributor -6.6% Individual contributor -6.6%
Years of eLearning experience
5 – 9 -5.1% 5 – 9 -5.1%
Education Associate’s degree -6.3% Master’s degree 1.5%
Job focus Instructional design -7.7% Instructional design -7.7%
Total Adjustments -6.9% Total Adjustments 0.9%
Now we apply these adjustments to the US average salary of $78,932 to calculate a
benchmark salary for now and after the master’s degree.
Now After master’s
US average salary $78,932 US average salary $78,932
Adjustment of -6.9% -5,446 Adjustment of 0.9% +710
Benchmark Salary in USD $73,486 Benchmark Salary in USD $79,642

2014 Global eLearning Salary & Compensation Report
+ 1 . 7 0 7 . 5 6 6 . 8 9 9 0 w w w. e L e a r n i n g G u i l d . c o m31
SURVEY
One thing to be aware of is that we are calculating everything using today’s figures and these
figures are likely to change in three years. The now part of these figures shows that Marcia
could potentially ask for a higher salary even now, but could ask for more with her bachelor’s
degree and more yet with her master’s degree.
Table 6 (on page 23) shows that most instructional designers in this survey had bachelor’s
or master’s degrees, so a master’s degree may be valuable, especially if her supervisor
believes she is promotion worthy (if she can add on the salary dividend for management
responsibilities). Since salaries are determined by more factors than are shown here, it would
be a good idea for Marcia to have a discussion with her supervisor about the benefits of
graduate degrees and its potential to increase her likelihood of promotion.
In today’s dollars, the benchmark salary figures show that the combination of additional years
and education can be worth a lot in today’s dollars. (To determine the ROI, you should subtract
the costs of gaining the education. For a simple cost/benefit analysis, see Degrees for eLearning
Professionals: What’s Needed?)
Table 8 (on page 32) includes some additional variables that may modify the baseline salary.
Co-located Event:
March 19 – 21, 2014 | Orlando, FL
eLearning Guild Members
SAVE 20% or More
www.Ecosystem2014.com +1.707.566.8990
Strategy Technology Implementation
Learn how to create a compre-hensive plan that that’s right for your organization.
Develop a solid understanding of available learning technolo-gies, systems, and platforms.
Discover best practices from peers and experts for success-fully integrating and implement-ing multifaceted systems.
At Ecosystem 2014, you’ll find the answers to develop a cohesive strategy to navigate the com-plex and changing learning ecosystems needed to support today’s learners and organizations.

2014 Global eLearning Salary & Compensation Report
+ 1 . 7 0 7 . 5 6 6 . 8 9 9 0 w w w. e L e a r n i n g G u i l d . c o m32
SURVEY
Other Salary Variable Categories Subcategories
Location • Cityversussuburbanversusrural
• Companylocationversusemployeelocation
Economic factors • Economicsituation
• Costofliving
Company compensation program • Locationinpaygrade
• Frequencyofreviews
• Frequencyofpayincreases
• Budgetforpayincreases
• Meritincreasesversuscost-of-livingadjustments
• Internalequityamongemployees/departments
• Otherbenefitsandtotalcompensationcomponents
Company performance • Financialperformanceofcompany
• Privateversuspubliccompany
Competition • Benchmarkingacrossregionandindustrypay
Employee experience and skills • eLearning/training/jobfunctionexperience
• Industryexperience
• Specializedoruniqueskills,credentials,orvalue
• Competitiveoffers/leverage
Employee performance • Currentperformanceandconsistencyofperformance
• Performanceimpactonbusinessdrivers
• Supportofdecisionmakersandcustomers
• Promotionpath
Time • Sincelastincrease
Table 8: Additional variables that may adjust baseline salary up or down
These adjustments help evaluate eLearning salaries but readers should not use it exclusively
to determine salary levels. It is merely a starting point that creates a benchmark salary, which
the reader should then adjust up or down based on the circumstances, including location,
company, or individual characteristics. For example, within the UK, rates of pay are likely
higher in London than they are elsewhere, and a star performer with great references and
highly specialized skills is likely to draw a larger salary than her co-workers do.
2014 Global eLearning Salary & Compensation Report
+ 1 . 7 0 7 . 5 6 6 . 8 9 9 0 w w w. e L e a r n i n g G u i l d . c o m33
SURVEY
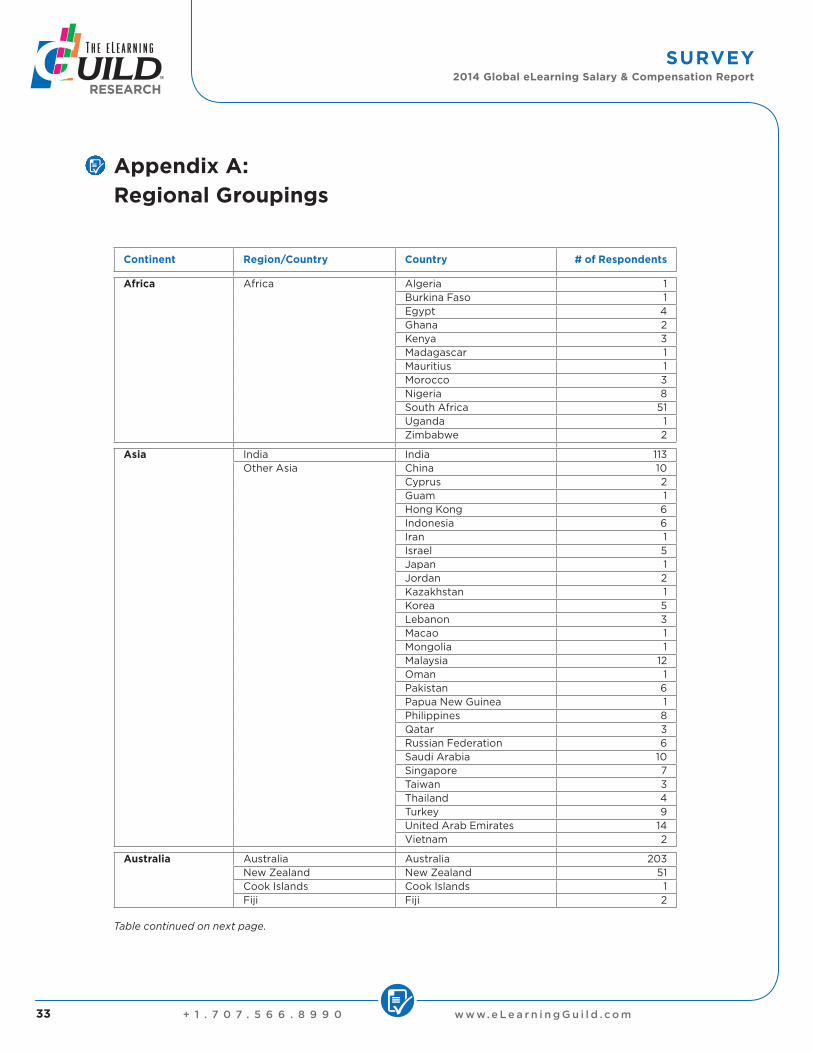
Appendix A: Regional Groupings
Continent Region/Country Country # of Respondents
Africa Africa Algeria 1Burkina Faso 1Egypt 4Ghana 2Kenya 3Madagascar 1Mauritius 1Morocco 3Nigeria 8South Africa 51Uganda 1Zimbabwe 2
Asia India India 113Other Asia China 10
Cyprus 2Guam 1Hong Kong 6Indonesia 6Iran 1Israel 5Japan 1Jordan 2Kazakhstan 1Korea 5Lebanon 3Macao 1Mongolia 1Malaysia 12Oman 1Pakistan 6Papua New Guinea 1Philippines 8Qatar 3Russian Federation 6Saudi Arabia 10Singapore 7Taiwan 3Thailand 4Turkey 9United Arab Emirates 14Vietnam 2
Australia Australia Australia 203New Zealand New Zealand 51Cook Islands Cook Islands 1Fiji Fiji 2
Table continued on next page.

2014 Global eLearning Salary & Compensation Report
+ 1 . 7 0 7 . 5 6 6 . 8 9 9 0 w w w. e L e a r n i n g G u i l d . c o m34
SURVEY
Continent Region/Country Country # of Respondents
Europe Netherlands Netherlands 34Other Europe Austria 3
Belgium 14Bulgaria 1Czech Republic 1Croatia 1Denmark 12Finland 3France 12Germany 17Greece 8Hungary 1Iceland 1Ireland 21Italy 11Latvia 1Lithuania 1Norway 10Poland 5Portugal 6Romania 2Slovakia 1Spain 28Sweden 6Switzerland 13Ukraine 1
United Kingdom United Kingdom 172
North and South America
Canada Canada 411United States United States 4,452Other North and South America
Argentina 7Bermuda 1Brazil 18Bolivia 1Cayman Islands 1Chile 6Colombia 9Costa Rica 1Ecuador 1Guatemala 5Guyana 1Jamaica 2Mexico 25Panama 1Paraguay 1Peru 3Puerto Rico 5Saint Lucia 1Trinidad and Tobago 1Uruguay 1Venezuela 4
Table 9: Region and country groupings and number of respondents, regions are as defined by Wikipedia

2014 Global eLearning Salary & Compensation Report
+ 1 . 7 0 7 . 5 6 6 . 8 9 9 0 w w w. e L e a r n i n g G u i l d . c o m35
SURVEY
Appendix B: United States Salary Comparison Data
In this section, you will see data for the United States separately as there were 4,452
respondents from the US. Table 10 and Figures 21 through 26 (on pages 36 – 38) highlight the
differences versus the average US salary of $78,932. If you are from the United States, you
should use this data rather than global data as it will be more precise.
US State Average Salary Difference # of Respondents
District of Columbia 19.5% 50
California 12.7% 488
Connecticut 12.0% 52
Massachusetts 11.9% 152
New Jersey 11.1% 87
Illinois 10.7% 191
New York 9.6% 144
Maryland 7.7% 175
Virginia 6.0% 202
Washington 3.4% 128
Texas 3.0% 276
Pennsylvania 2.3% 187
Colorado -1.7% 147
Florida -4.0% 290
Minnesota -4.5% 144
Georgia -4.7% 156
Indiana -4.7% 101
Ohio -5.1% 165
Tennessee -6.5% 80
Arizona -6.7% 122
Oregon -8.3% 73
North Carolina -8.5% 137
Michigan -10.3% 112
Other States -11.5% 467
Kentucky -11.8% 47
Missouri -12.3% 105
Wisconsin -13.5% 94
Utah -17.1% 79
Table 10: Salary difference vs. average US salary of $78,932 by US state
2014 Global eLearning Salary & Compensation Report
+ 1 . 7 0 7 . 5 6 6 . 8 9 9 0 w w w. e L e a r n i n g G u i l d . c o m36
SURVEY
Figure 21: Salary difference vs. average US salary of $78,932 by industry
Figure 22: Salary difference vs. average US salary of $78,932 by company size
2014 Global eLearning Salary & Compensation Report
+ 1 . 7 0 7 . 5 6 6 . 8 9 9 0 w w w. e L e a r n i n g G u i l d . c o m37
SURVEY
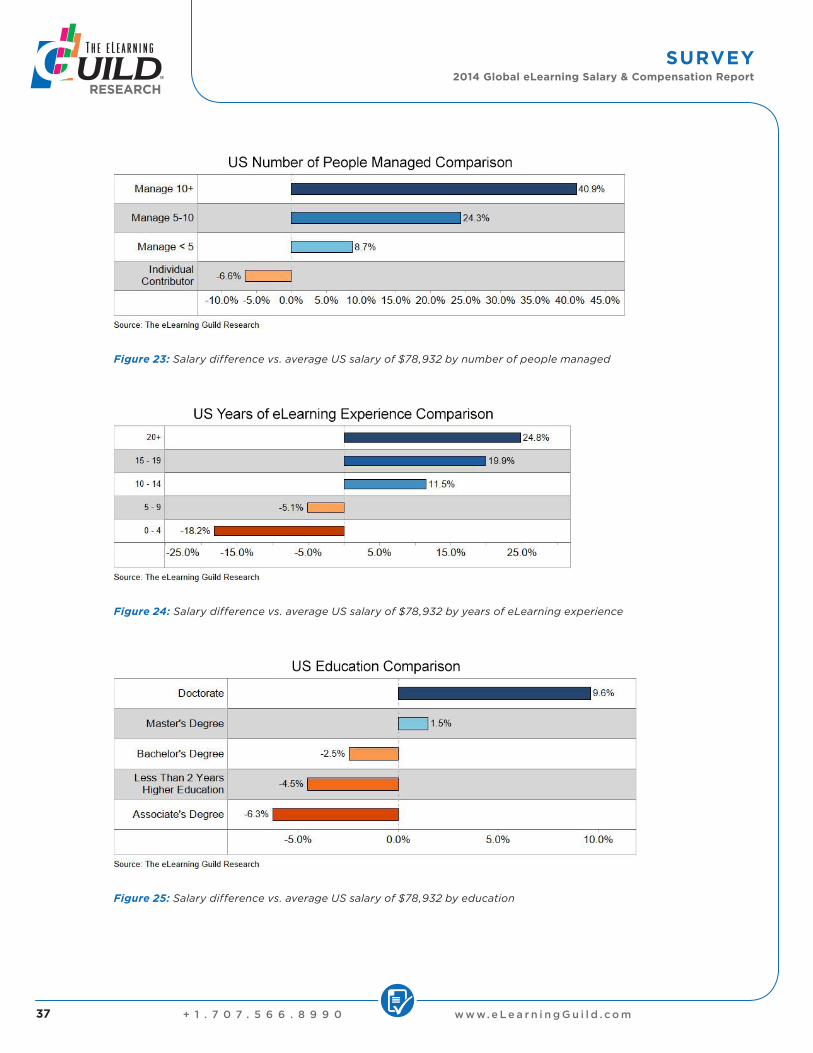
Figure 23: Salary difference vs. average US salary of $78,932 by number of people managed
Figure 24: Salary difference vs. average US salary of $78,932 by years of eLearning experience
Figure 25: Salary difference vs. average US salary of $78,932 by education
2014 Global eLearning Salary & Compensation Report
+ 1 . 7 0 7 . 5 6 6 . 8 9 9 0 w w w. e L e a r n i n g G u i l d . c o m38
SURVEY
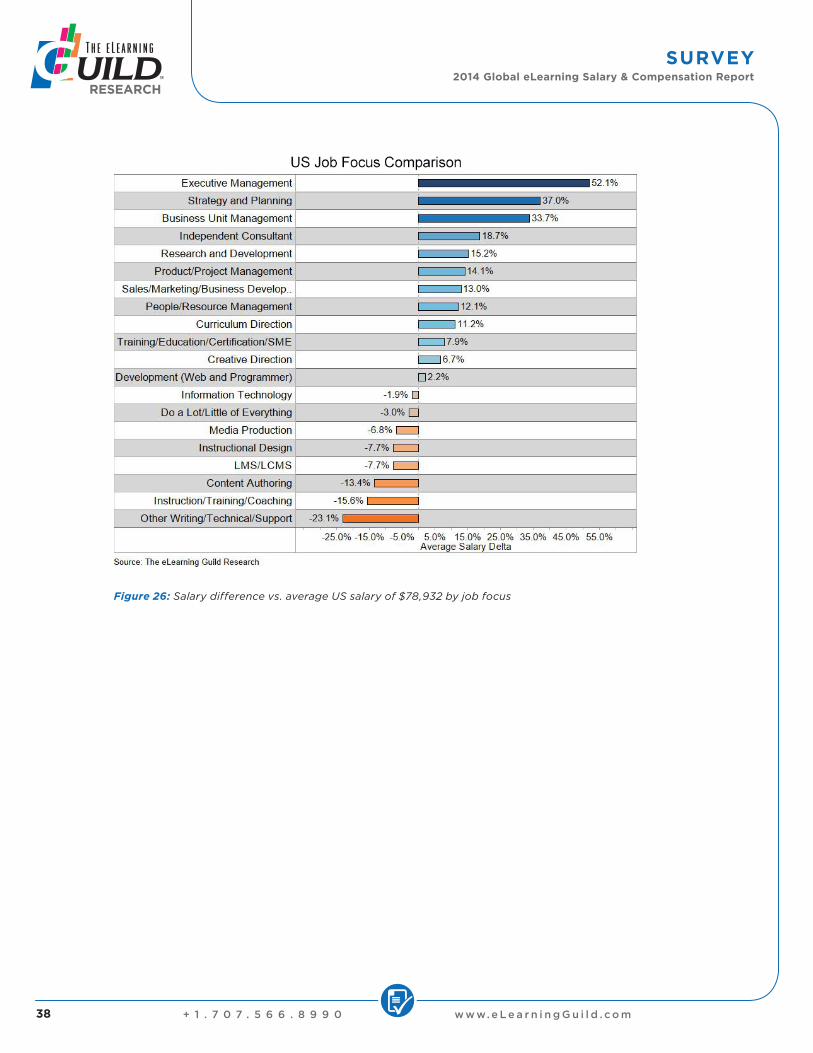
Figure 26: Salary difference vs. average US salary of $78,932 by job focus

2014 Global eLearning Salary & Compensation Report
+ 1 . 7 0 7 . 5 6 6 . 8 9 9 0 w w w. e L e a r n i n g G u i l d . c o m39
SURVEY
Appendix C: Canadian Province and Territory Average Salary Data
This section shows average salary data for Canadian provinces and territories. Most of the
response numbers (i.e., number of respondents from each of the provinces and territories)
are far too small for us to suggest using (with the exception, perhaps, of Ontario). But since
we are aware of how hard some of our Canadian Guild members tried to get respondents to
submit data for this survey and because there were a larger number of responses this year, we
are responding to their efforts by sharing the data we received. We hope to get more data in
future surveys so this salary data is more valid for using in developing benchmarks. Note that
we express the average salaries in US dollars (USD). At the time that the report was written,
the USD to CAD exchange rate was 1.096.
Canadian Province or Territory Average Salary Number of
Respondents
Northwest Territory $110,000 1
Alberta $87,889 65
Quebec $86,085 58
British Columbia $78,649 51
Newfoundland/Labrador $78,616 2
Ontario $77,129 198
Manitoba $72,666 8
Saskatchewan $71,241 8
Yukon Territory $65,000 1
Nova Scotia $61,875 8
New Brunswick $52,287 9
Prince Edward Island $47,182 2
Average Salary $79,153 411
Table 11: Canadian province and territory average salary data

The eLearning Guild is the oldest and most trusted source of information, community, and professional development for
eLearning professionals. Build the skills, network, and expertise to propel your career forward by taking advantage of all the benefits available
to paid Guild members!
Community & Resources for eLearning Professionals
Invest in the professional development of everyone on your team. Groups of three or moreare eligible for membership discounts starting at 10%. Visit www.eLearningGuild.com/groupsor contact [email protected] to learn more!
www.eLearningGuild.com | +1.707.566.8990
Here are just a few member benefits:
Group Discounts Available!
Member Member-Plus Premium
ConferencesExclusive discounts on industry-leading events
Conference ArchiveKeynote videos, session videos, and handouts
Online ForumsTwo-day online conferences held 10 times a year
Online Forums ArchiveOn-demand access to 900-session archive
Guild Academy Live, interactive online training courses
Guild ResearchSix reports per year, plus access to 60+ report library
eBooks & White PapersValuable insights, tips, and ideas from Guild members
WebinarsCutting-edge ideas and best sessions from Guild events
Learning Solutions MagazineYour source for learning technology, strategy, and news
Job BoardFind the best jobs and the best candidates in the industry
20% Discount 20% DiscountOne Conference +
One Pre-conference Workshop
20% Discount 20% Discount 20% Discount
20% Discount

2014 Global eLearning Salary & Compensation Report
+ 1 . 7 0 7 . 5 6 6 . 8 9 9 0 w w w. e L e a r n i n g G u i l d . c o m41
SURVEY
Resources
The eLearning Guild
Salary Calculator: http://www.learningsolutionsmag.com/articles/1352/
Research Reports
Shank, Patti. Degrees for eLearning Professionals: What’s Needed? The eLearning Guild, 2012. http://www.
elearningguild.com/research/archives/index.cfm?id=155&action=viewonly&from=content&mode=filter&source=archives
Shank, Patti. 2013 Global eLearning Salary & Compensation Report. The eLearning Guild, 2013. http://www.
elearningguild.com/research/archives/index.cfm?id=165&action=viewonly
Shank, Patti. What’s Changing in Your Work World? The eLearning Guild, 2012. http://www.elearningguild.com/
research/archives/index.cfm?id=163&action=viewonly
Smolen, Temple. 2010 Global eLearning Salary and Compensation Report—United States. The eLearning Guild, 2010.
http://www.elearningguild.com/research/archives/index.cfm?id=141&action=viewonly
Smolen, Temple. 2012 Global eLearning Salary and Compensation Report. The eLearning Guild, 2012. http://www.
elearningguild.com/research/archives/index.cfm?id=154&action=viewonly
Other Resources
Reports
American Association of University Women. The Simple Truth about the Gender Pay Gap, 2013 edition. AAUW,
2013. http://www.aauw.org/research/the-simple-truth-about-the-gender-pay-gap/
Hausmann, Ricardo, Laura D. Tyson, and Saadia Zahidi. The World Economic Forum: The Global Gender Pay Gap
Report 2012. World Economic Forum, 2012. http://www.weforum.org/reports/global-gender-gap-report-2012
Hegewisch, Ariane, Claudia Williams, and Vanessa Harbin. The Gender Wage Gap by Occupation. Institute for
Women’s Policy Research, 2012. http://www.iwpr.org/publications/pubs/the-gender-wage-gap-by-occupation-1
Websites
Currency Exchange Rate. http://www.xe.com/
Wikipedia—Regional Groupings
http://en.wikipedia.org/wiki/Africa
http://en.wikipedia.org/wiki/Geography_of_Asia
http://en.wikipedia.org/wiki/Geography_of_Europe
http://en.wikipedia.org/wiki/North_America
http://en.wikipedia.org/wiki/Oceania
http://en.wikipedia.org/wiki/South_America
2014 Global eLearning Salary & Compensation Report
+ 1 . 7 0 7 . 5 6 6 . 8 9 9 0 w w w. e L e a r n i n g G u i l d . c o m42
SURVEY
About the Author
Patti Shank, PhD, CPT is the research director of The eLearning
Guild and president of Learning Peaks. She is listed in Who’s Who in
Instructional Technology and is an often-requested speaker at training
and instructional technology conferences. Patti is quoted frequently
in training publications and is the co-author of Making Sense of Online
Learning (Pfeiffer, 2004), editor of The Online Learning Idea Book
(Pfeiffer, 2007, 2011), co-editor of The E-Learning Handbook (Pfeiffer,
2008), and co-author of Essential Articulate Studio ’09 (Jones and
Bartlett, 2009).


