
GUIDANCE DOCUMENT ON METHOD VALIDATION AND QUALITY CONTROL ... · PDF fileHellenic...
36
Hellenic Accreditation System ESYD G-FYTOPROST/01/02/20-10-2016 1/36 GUIDANCE DOCUMENT ON METHOD VALIDATION AND QUALITY CONTROL PROCEDURES FOR PESTICIDES RESIDUES LABORATORIES
Transcript of GUIDANCE DOCUMENT ON METHOD VALIDATION AND QUALITY CONTROL ... · PDF fileHellenic...
Hellenic Accreditation System
ESYD G-FYTOPROST/01/02/20-10-2016 1/36
GUIDANCE DOCUMENT ON METHOD VALIDATION AND QUALITY CONTROL
PROCEDURES FOR PESTICIDES RESIDUES LABORATORIES
Hellenic Accreditation System
ESYD G-FYTOPROST/01/02/20-10-2016 2/36
ESYD G-PESTICIDES
Issue: 01 Revision: 02 Issue Date: 09-02-2004 Revision Date: 20-10-2016 Prepared by: The Quality Manager of ESYD Approved by: The Head of ESYD
Quality Manager of ESYD Head of ESYD
Hellenic Accreditation System
ESYD G-FYTOPROST/01/02/20-10-2016 3/36
1. GENERAL COMMENTS:
The SANCO / SANTE document (e.g. 11945/2015) describes the method validation requirements to
support the validity of data reported within the framework of official controls on pesticide residues.
Official control laboratories perform among other checking compliance with maximum residue
levels (MRLs), taking enforcement actions, and perform assessment of consumer exposure to
pesticides. They have to follow all SANCO / SANTE requirements.
Laboratories not performing official controls have to comply with a number or requirements
described in the present guidance document. These requirements are originated in the SANCO /
SANTE document, as well as in other regulative documents, as the Decision 2002/657/EC, the
EURACHEM/CITAC Guide CG 4, etc.
The extent of the validation requirements is usually related to the instrumentation used. There is a
current trend for many laboratories to use gas chromatography-mass spectrometry (GC-MS or GC-
MS/MS) and liquid chromatography-mass spectrometry (LC-MS/MS) based multi-residue methods,
in order to greatly increase the number of pesticides of their accreditation scope. At the same time
laboratories using GC or LC based methods have limited accreditation capabilities and the
requirements for their accreditation differ from laboratories using MS methods.
2. OFFICIAL CONTROL LABORATORIES
Accreditation of official control laboratories is based on their proven fully compliance with the
requirements of the most recent SANCO /SANTE document.
3. NON-OFFICIAL CONTROL LABORATORIES
3.1 The method must be validated to assess linearity, recovery (as a measure of trueness), RSDR (as a
measure of precision), limit of detection (LOD) and of quantitation (LOQ), and selectivity (proven by
identification-confirmation procedures). Additionally, the effect of each matrix on quantitation
should be evaluated and the uncertainty of results must also be estimated.
3.2 Linearity: The line generated for each analyte at ≥5 concentration levels should be provided,
together with the slope, the intercept and correlation co-efficient data. The requirements for a
calibration line to be used for quantitation are: the correlation coefficient (r) to be >0.98 over the
working range and the interval (a ± tst x Sa)to include zero, where a is the intercept, Sa its standard
deviation and tst the student test value for N-2 degrees of freedom.
If a linear relation is not supported, an alternative calibration is required, e.g. bracketing technique.
3.3 Trueness: A minimum of 5 replicates is required to check the recovery at the targeted LOQ or
reporting level (RL) of the method, and at least one other higher level, for example, 2-10 times the
targeted LOQ or the MRL. Where the residue definition includes more than one analyte, then the
method should be validated for all analytes included in the residue definition if compliance with
maximum residue levels (MRLs) is to be given in the report. Acceptable mean recoveries are usually
those within the range 70–120%. However, in certain cases and typically with multi-residue
methods, recoveries outside this range are accepted. These are cases, where recovery is low but

Hellenic Accreditation System
ESYD G-FYTOPROST/01/02/20-10-2016 4/36
consistent, i.e. demonstrating acceptable precision (RSDr values ≤20%). A correction factor for the
recovery should be used in the report for these analytes. Additionally, a proficiency test should be
sought for these analytes to verify the correctness of the procedure followed.
3.4 Precision: A minimum of 5 replicates is required to check the precision, at the targeted LOQ or
reporting level (RL) of the method, and at least one other higher level, for example, 2-10 times the
targeted LOQ or the MRL. Repeatability RSDr values determined from the validation experiments
should be ≤ 20%, while within-laboratory reproducibility (RSDR), which may be determined from on-
going QC-data in routine analyses, should be ≤ 25%. Contributions arising from sample
heterogeneity should be excluded when evaluating precision of the method.
3.5 LOD and LOQ: The Limit of Quantitation (LOQ) is evaluated as the lowest spike level of the
validation experiments meeting the method performance acceptability criteria, i.e. presenting
acceptable trueness and precision values. The signal of a sample containing the analyte at
concentration equal to the LOQ should be ≥10 compared to the signal of the noise. The signal of a
sample containing the analyte at concentration equal to the limit of detection (LOD) should be ≥3
compared to the signal of the noise.
3.6 Selectivity: Response in reagent blank and blank control samples should be <30% of the LOQ or the
reporting level response. The following Identification criteria should be met:
3.6.1 Selectivity requirements for chromatography:
3.6.1.a The retention time of the analyte in the extract should correspond to that of the calibration
standard (may need to be matrix-matched), with a tolerance of ±0.1min, for both gas
chromatography and liquid chromatography. Larger retention time deviations are acceptable, based
on experimental data of the laboratory, as for example RT tolerance ≤ 2s, with s the standard
deviation of the retention time over a certain time period.
3.6.1.b The peak shape of the analyte in the extract should match with that of the calibration
standard, e.g. the peak width, at half of its height, must be within ±10 % of the original width of the
analyte peak.
3.6.1.c The chromatographic profile of the isomers of an analyte may provide helpful evidence.
3.6.1.d Co-chromatography may be used for providing evidence of analyte identity, however it is not a
fully confirmatory technique, as it is based on the retention time criterion only. According to this
technique the sample extract is fortified by addition of an appropriate amount of calibration
solution. The amount of analyte added must be similar to the amount of the analyte found in the
sample extract.
In order not to reject the assumption that the suspect peak is the analyte peak, only the height of
the analyte peak and the internal standard peak should be enhanced after taking into account both
the amount added and the dilution of the extract. The peak width, at half of its height, must be
within ± 10 % of the original width of the analyte peak or the internal standard peak of the
unfortified sample extracts.

Hellenic Accreditation System
ESYD G-FYTOPROST/01/02/20-10-2016 5/36
3.6.1.e If confirmation is not based on a MS technique, the use of a different chromatographic
separation is required that will also satisfy the above mentioned criteria 3.6.1a – 3.6.1d. For
example a different chromatographic separation could be the use of a LC system in the case that the
initial system was a GC system. In the case that only a GC system is available, then a different
chromatographic separation could be at least the use of a column of significantly different polarity.
3.6.2 Selectivity requirements for Mass Spectrometry: Selective ion chromatograms should have peaks
exceeding S/N 3:1, of similar retention time, peak shape and response ratio to those obtained from
a calibration standard analysed at comparable concentration in the same batch. Chromatographic
peaks from different selective ions for the same analyte must overlap with each other. The
requirements for different types of MS detectors are given in the following Table.
MS mode: Single MS (unit mass
resolution)
Single MS of high mass
accuracy
MS/MS
Typical systems
(examples)
Quadrupole, ion trap,
time-of-flight (TOF)
High resolution: Q-TOF,
Orbitrap, FTMS, magnetic
sector
Triple quadrupole, ion
trap, hybride MS (e.g.
Q-TOF, Q-trap)
Acquisition: Full scan,
Limited m/z range,
Selected ion
monitoring (SIM)
Full scan,
Limited m/z range,
Selected ion monitoring
(SIM)
Selected/multiple
reaction monitoring
(SRM/MRM),
full scan product-ion
spectra
Requirements for
ions:
≥ 3 ions ≥ 2 ions with mass accuracy
< 5 ppm.
≥ 2 product ions
Ion ratio: Within ±30% (relative) of average of calibration standards from same sequence.
Other: S/N ≥ 3,
Analyte peaks in the extracted ion chromatograms must fully overlap.
3.7 Matrix effects: Matrix effects are known to occur frequently in both GC and LC methods and should
be assessed at the initial method validation stage. The analytes that require use of calibration
standards in solvent and the analytes that require use of calibration standards in matrix should be
clearly identified during this process. Comparison of response arising from solvent standards and
from matrix-matched standards is used for this purpose. A maximum 20% difference is considered
as acceptable for using solvent standards as calibration standards. In a different case matrix
matched calibration is required.
3.8 Uncertainty: It is a requirement of ISO/IEC 17025 that laboratories determine and make available
the uncertainty associated with analytical results. To this end, laboratories should have available
sufficient data derived from method validation/verification, inter-laboratory studies (as proficiency
tests) and in-house quality control tests, which are applied to estimate the uncertainties.
Reproducibility RSDR may be used as the basis, but the contribution of additional uncertainty
sources (e.g. heterogeneity of the sample from which the analytical test portion is taken) should be
included. The contribution of the uncertainty of a critical step (e.g. uncertainty of calibration curve)
to the total uncertainty of the method should be evaluated.

Hellenic Accreditation System
ESYD G-FYTOPROST/01/02/20-10-2016 6/36
4. VALIDATION FOR ACCREDITATION ON A FLEXIBLE SCOPE:
Accreditation of flexible scope has to follow all procedures described in the previews paragraphs 1-3
as well as the guidance document ΕΣΥΔ ΚΟ ΕΥΕΛ. Additionally the following should be applied:
4.1 Accreditation in “Fruits and vegetables” is performed by use of the Table:
Commodity
groups
Typical commodity categories Typical representative commodities
1. High water
content
Pome fruit
Stone fruit
Other fruit
Alliums
Fruiting vegetables/cucurbits
Brassica vegetables
Leafy vegetables and fresh herbs
Stem and stalk vegetables
Forage/fodder crops
Fresh legume vegetables
Leaves of root and tuber
vegetables
Fresh Fungi
Root and tuber vegetables or
feed
Apples, pears
Apricots, cherries, peaches,
Bananas
Bulb onion, leeks
Tomatoes, peppers, cucumber, melon
Cauliflower, brussel sprouts, cabbage,
broccoli
Lettuce, spinach, basil
Celery, asparagus
Fresh alfalfa, fodder vetch, fresh sugar beets
Fresh peas with pods, petit pois, mange
tout, broad beans, runner beans, French
beans
Sugar beet and fodder beet tops
Champignons, chanterelles
Sugar beet and fodder beet roots, carrots,
potatoes, sweet potatoes
2. High acid
content and
high water
content
Citrus fruit
Small fruit and berries
Other
Lemons, mandarins, tangerines, oranges
Strawberry, blueberry, raspberry,
blackcurrant, red currant, white currant,
grapes
Kiwifruit, pineapple, rhubarb
4.1.1 Validation in 1 representative commodity (e.g. apple), leads to accreditation for the whole
commodity category (e.g. pome fruit) for the validated analytes.
Hellenic Accreditation System
ESYD G-FYTOPROST/01/02/20-10-2016 7/36
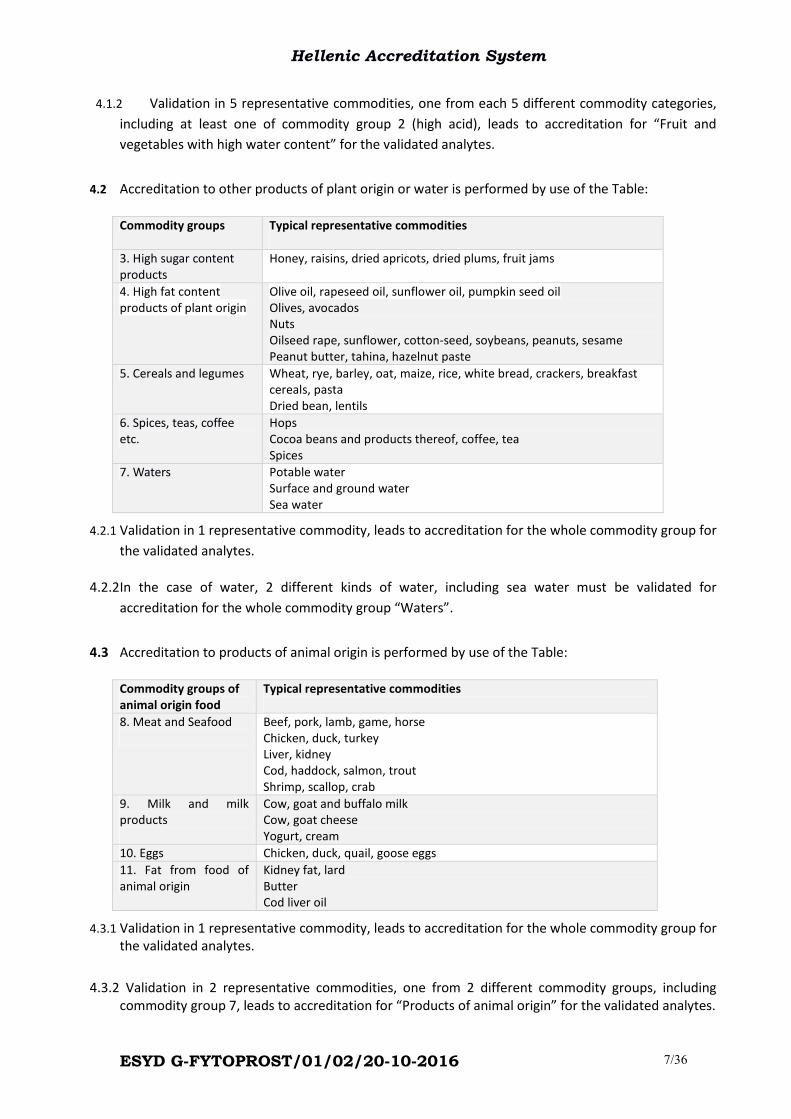
4.1.2 Validation in 5 representative commodities, one from each 5 different commodity categories,
including at least one of commodity group 2 (high acid), leads to accreditation for “Fruit and
vegetables with high water content” for the validated analytes.
4.2 Accreditation to other products of plant origin or water is performed by use of the Table:
Commodity groups Typical representative commodities
3. High sugar content
products
Honey, raisins, dried apricots, dried plums, fruit jams
4. High fat content
products of plant origin
Olive oil, rapeseed oil, sunflower oil, pumpkin seed oil
Olives, avocados
Nuts
Oilseed rape, sunflower, cotton-seed, soybeans, peanuts, sesame
Peanut butter, tahina, hazelnut paste
5. Cereals and legumes Wheat, rye, barley, oat, maize, rice, white bread, crackers, breakfast
cereals, pasta
Dried bean, lentils
6. Spices, teas, coffee
etc.
Hops
Cocoa beans and products thereof, coffee, tea
Spices
7. Waters Potable water
Surface and ground water
Sea water
4.2.1 Validation in 1 representative commodity, leads to accreditation for the whole commodity group for
the validated analytes.
4.2.2 In the case of water, 2 different kinds of water, including sea water must be validated for
accreditation for the whole commodity group “Waters”.
4.3 Accreditation to products of animal origin is performed by use of the Table:
Commodity groups of
animal origin food
Typical representative commodities
8. Meat and Seafood
Beef, pork, lamb, game, horse
Chicken, duck, turkey
Liver, kidney
Cod, haddock, salmon, trout
Shrimp, scallop, crab
9. Milk and milk
products
Cow, goat and buffalo milk
Cow, goat cheese
Yogurt, cream
10. Eggs Chicken, duck, quail, goose eggs
11. Fat from food of
animal origin
Kidney fat, lard
Butter
Cod liver oil
4.3.1 Validation in 1 representative commodity, leads to accreditation for the whole commodity group for
the validated analytes.
4.3.2 Validation in 2 representative commodities, one from 2 different commodity groups, including
commodity group 7, leads to accreditation for “Products of animal origin” for the validated analytes.
Hellenic Accreditation System
ESYD G-FYTOPROST/01/02/20-10-2016 8/36
4.4 As for the chemical class of analytes, accreditation on a flexible scope requires validation of
representative analytes from each chemical class. In order to facilitate the choice of a proper
number of representative analytes, the following numbers in parentheses may be considered as an
estimation of the maximum number of analytes in each class: organophosphates (70),
organochlorines (15), pyrethroids (40), triazines (15), triazoles (25), antibiotics (10), dinitroanilines
(10), amides (10), bendimidazoles (5), carbamates (50), aryloxy alcanoic acids (10), benzoyl ureas
(10), sulfonyl ureas (30), phenyl ureas (20), dithiocarbamates(10), inorganic compounds(10),
strobylurines (10), neonicotinoids (5).
4.4.1 The selected analytes from a chemical class for a flexible validation, should be representative of the
class; i.e. it should be documented that the physicochemical properties (water solubility, vapor
pressure, logPow) of the selected analytes cover the whole range of physicochemical properties of
the chemical class.
Typical example is the class of organophosphorous compounds that contains some very polar and of
high water-solubility compounds, unlike most compounds of the class.
4.4.2 For accreditation on a fully flexible scope, representative analytes should be selected from at least
12 different chemical classes, including carbamates, organophosphates, organochlorines,
pyrethroids, and triazoles. From each one of these 12 chemical classes, at least 50% of the
compounds of the class, as mentioned in paragraph 4.4, should be included in validation. This leads
to accreditation scope “determination of pesticide residues”.
4.4.3 For accreditation on a partially flexible scope, representative analytes, at least 20% of the
compounds of a class, as mentioned in paragraph 4.4, should be included in validation. This leads to
accreditation of the class.
4.4.4 A procedure is required, for the determination of analytes not initially validated, including at least
estimation of recovery and LOQ.
4.5 For the revision of a validated method on a fully flexible scope, the relevant validation data are sent
to ESYD. Furthermore:
4.5.1 A standard operating procedure is required, describing procedures followed for revisions of
methods and characterizing them according to their importance.
4.5.2 For minor revisions, a check for the accuracy is required using quality control samples.
4.5.3 For major revisions, validation in accordance with the procedures described above in respect to
the categories of food and chemical analyst class is required.
5. INTERNAL QUALITY CONTROL PROCEDURES DURING ROUTINE ANALYSIS
Internal quality control should include system suitability tests, run of blank samples, routine
recovery checks, checks of reporting level and of carryover. The frequency of the quality control
checks should be at a rate of 5% (1 check every 20 samples) unless otherwise stated below.
Hellenic Accreditation System
ESYD G-FYTOPROST/01/02/20-10-2016 9/36
5.1 System suitability tests: the performance of analytical instruments should periodically be tested
with representative selected analytes. Parameters monitored for chromatographs should include
the retention time and the detector response, and for MS systems the ratio of 3 ions. Control charts
should be constructed with these data.
5.2 Blanks: Reagent blank and matrix blanks for different matrices should be routinely used, especially
when unusual findings are detected.
5.3 Routine recovery checks: A number of appropriately selected representative analytes (at least 5 per
detection system) should be routinely checked for recovery and control charts should be
constructed with these data to monitor recovery. Additionally, recovery checks for the total number
of analytes should be performed at least on a yearly basis for each different method (e.g. method
for high water content products, method for cereals, method for high fat content products).Analyte
recovery should normally be determined by spiking within a range corresponding to 1–10 times the
RL, or at the MRL, or at a level of particular relevance to the samples being analyzed. The level of
addition may be changed occasionally or regularly, to provide information on analytical
performance over a range of concentrations. Acceptable limits for individual recovery results should
normally be within the range r±2s, where r is the mean recovery and s the standard deviation taken
from validation or QC data. However, alternatively, a range of 60-140 % may accept.
5.4 Reporting level should be verified with every batch of samples to avoid false negative results. This
could be done by running a suitable standard solution containing the matrix.
5.5 Carryover should be routinely checked in order to avoid false negative results. This can be done by
running a blank matrix extract following a standard solution of relatively high concentration.
7. EXTERNAL QUALITY CONTROL FOR LABORATORIES ACCREDITED ON A FLEXIBLE SCOPE
The laboratory must select proficiency testing organizers that meet the requirements of ESYD PDI
and the number (N) of analytes in the sample should be the highest possible, not less than 5. The
laboratory must report at least for N-1 analytes in scope if N≤10; or N-2 analytes, if N>10.

Hellenic Accreditation System
ESYD G-FYTOPROST/01/02/20-10-2016 10/36
Appendix A
I. General instructions for method validation procedure
The validity of a specific method should be demonstrated in laboratory experiments using samples
or standards that are similar to unknown samples analyzed routinely. The preparation and
execution should follow a validation protocol, preferably written in a step-by-step instruction
format. Possible steps for a complete method validation are listed in Table I.1.
Table I.1. Strategies and steps in analytical method validation
1. Develop a validation protocol, an operating procedure, or a validation master plan for the
validation
2. For a specific validation project, define owners and responsibilities
3. Develop a validation project plan
4. Define the application, purpose, and scope of the method
5. Define the performance parameters and acceptance criteria
6. Define validation experiments
7. Verify relevant performance characteristics of equipment
8. Qualify materials, e.g. standards and reagents for purity, accurate amounts, and sufficient
stability
9. Perform pre-validation experiments
10. Adjust method parameters and/or acceptance criteria if necessary
11. Perform full internal (and external) validation experiments
12. Develop standard operation procedures for executing the method in the routine
13. Define criteria for revalidation
14. Define type and frequency of system suitability tests and/or analytical quality control
checks for the routine
15. Document validation experiments and results in the validation report Table
I.1. Theoretical Aspects
Validation means “confirmation by examination and prediction of objective evidence that
the particular requirements for a specified intended use are fulfilled” (according to ISO 8402:1994).
Method validation means:
-The process of establishing the performance characteristics and limitations of a method and the
identification of the influences, which may change these characteristics, and to what extent.
• Which analytes can be determined, in which matrices, in the presence of which
interferences?
• Within these conditions what levels of precision and accuracy can be achieved?
Hellenic Accreditation System
ESYD G-FYTOPROST/01/02/20-10-2016 11/36
-The process of verifying that a method is fit for a purpose, i.e. for solving a particular analytical
problem.
Verification means “confirmation by examination and prediction of objective evidence
proving that the specified requirements have been fulfilled” (according ISO 8402:1994).
It is necessary to make the difference between validation and verification.
Verification is applied for standardized methods and validation must be made for:
• non-standard methods;
• laboratory - designed / developed methods;
• standard methods used outside their intended purpose;
• standard methods
Validation studies for analytical methods typically determine the following parameters:
• detection limit;
• quantification limit;
• working range;
• selectivity;
• sensitivity;
• robustness;
• recovery;
• accuracy;
• precision ;
• repeatability ;
• reproducibility.
The performance parameters being tested are selected depending on the analytical
requirements and based on the specifications from Table I.1.

Hellenic Accreditation System
ESYD G-FYTOPROST/01/02/20-10-2016 12/36
Table I.1.1. Analytical requirements and the corresponding performance parameters
Analytical requirements Related performance parameters
- Qualitative or quantitative answer? Confirmation of identity,
selectivity/specificity,
Limit of detection
Limit of quantification
For the analyte present in more than one
form, is important the extractable, free or
total analyte?
Recovery
Analyte(s) of interest and the most probable
level (%, μg g-1
, ng g-1
etc.)?
Limit of detection
Limit of quantification
Working range
Level of precision and accuracy, allowed
uncertainty degree.
Recovery
Accuracy
Repeatability
Reproducibility
Possible interferences Selectivity/specificity
Comparison of results with results from other
laboratories?
robustness
Reproducibility
Comparison of the results with external
specifications?
Accuracy
Reproducibility
Limit of Detection (LoD) means:
- the lowest content that can be measured with reasonable statistical certainty;
- the lowest concentration of analyte in a sample that can be detected, but not necessarily
quantified under the stated conditions of the test;
- the lowest analyte content, if actually present, that can be detected and can be identified.
Where measurements are made for low concentrations of analyte (trace analysis) it is
important to know what is the lowest concentration of analyte that can be confidently detected by
the method. This problem must be analyzed statistically and a domain of decision criteria must be
proposed.
It is normally sufficient to provide an indication of the level at which detection becomes
problematic.
For quantitative measurements, 10 independent blank samples (a) or 10 independent
blank samples fortified at lowest acceptable concentration (b) are analyzed, measured a single time
each, and the mean value and standard deviation (s) of the blank sample is calculated for each set
of measurements.
LoD is expressed as the analyte concentration corresponding to:
a) mean value of the blank sample + 3 s;
b) 0 + 3 s or the mean value of the blank sample + 4.65 s

Hellenic Accreditation System
ESYD G-FYTOPROST/01/02/20-10-2016 13/36
For qualitative measurements, it is sufficient a critical concentration below which the
specificity can not be identified. Thus, a series of blank samples fortified with analyte are analyzed.
For each concentration level it is necessary to make 10 independent repeated measurements and a
response curve of % positive or negative results versus concentration should be constructed. From
this curve it can be established, by interpolation, the threshold concentration at which the test
becomes unreliable.
Generally, the LoD, expressed in terms of concentration cL, or the quantity qL, is derived
from the smallest measurement xL, that can be detected with reasonable certainty for a given
analytical procedure. The value of xL is calculated with the formula:
xL = xbl + k sbl
where: xbl is the mean value of the measurements for the blank sample of reagents; sbl is the
standard deviation of the measurements for the blank sample of reagents ; k is a numerical factor
chosen according to the desired confidence level.
Hellenic Accreditation System
ESYD G-FYTOPROST/01/02/20-10-2016 14/36
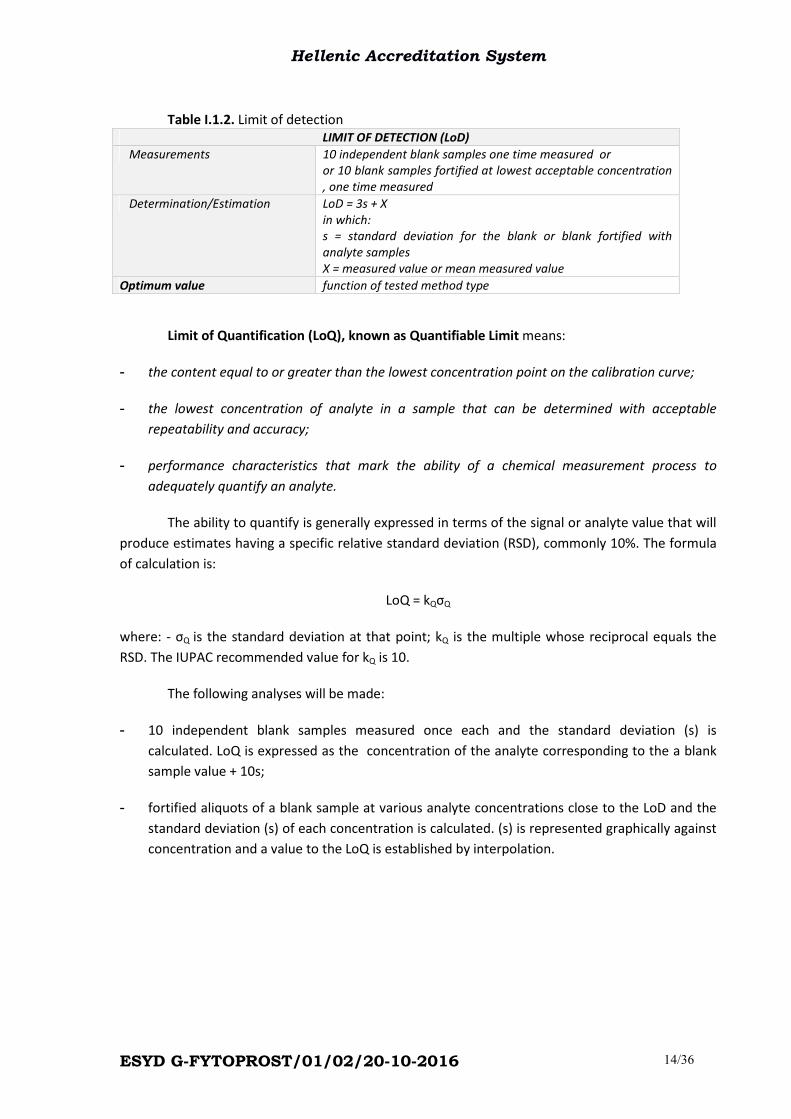
Table I.1.2. Limit of detection
LIMIT OF DETECTION (LoD)
Measurements 10 independent blank samples one time measured or
or 10 blank samples fortified at lowest acceptable concentration
, one time measured
Determination/Estimation LoD = 3s + X
in which:
s = standard deviation for the blank or blank fortified with
analyte samples
X = measured value or mean measured value
Optimum value function of tested method type
Limit of Quantification (LoQ), known as Quantifiable Limit means:
- the content equal to or greater than the lowest concentration point on the calibration curve;
- the lowest concentration of analyte in a sample that can be determined with acceptable
repeatability and accuracy;
- performance characteristics that mark the ability of a chemical measurement process to
adequately quantify an analyte.
The ability to quantify is generally expressed in terms of the signal or analyte value that will
produce estimates having a specific relative standard deviation (RSD), commonly 10%. The formula
of calculation is:
LoQ = kQσQ
where: - σQ is the standard deviation at that point; kQ is the multiple whose reciprocal equals the
RSD. The IUPAC recommended value for kQ is 10.
The following analyses will be made:
- 10 independent blank samples measured once each and the standard deviation (s) is
calculated. LoQ is expressed as the concentration of the analyte corresponding to the a blank
sample value + 10s;
- fortified aliquots of a blank sample at various analyte concentrations close to the LoD and the
standard deviation (s) of each concentration is calculated. (s) is represented graphically against
concentration and a value to the LoQ is established by interpolation.
Hellenic Accreditation System
ESYD G-FYTOPROST/01/02/20-10-2016 15/36
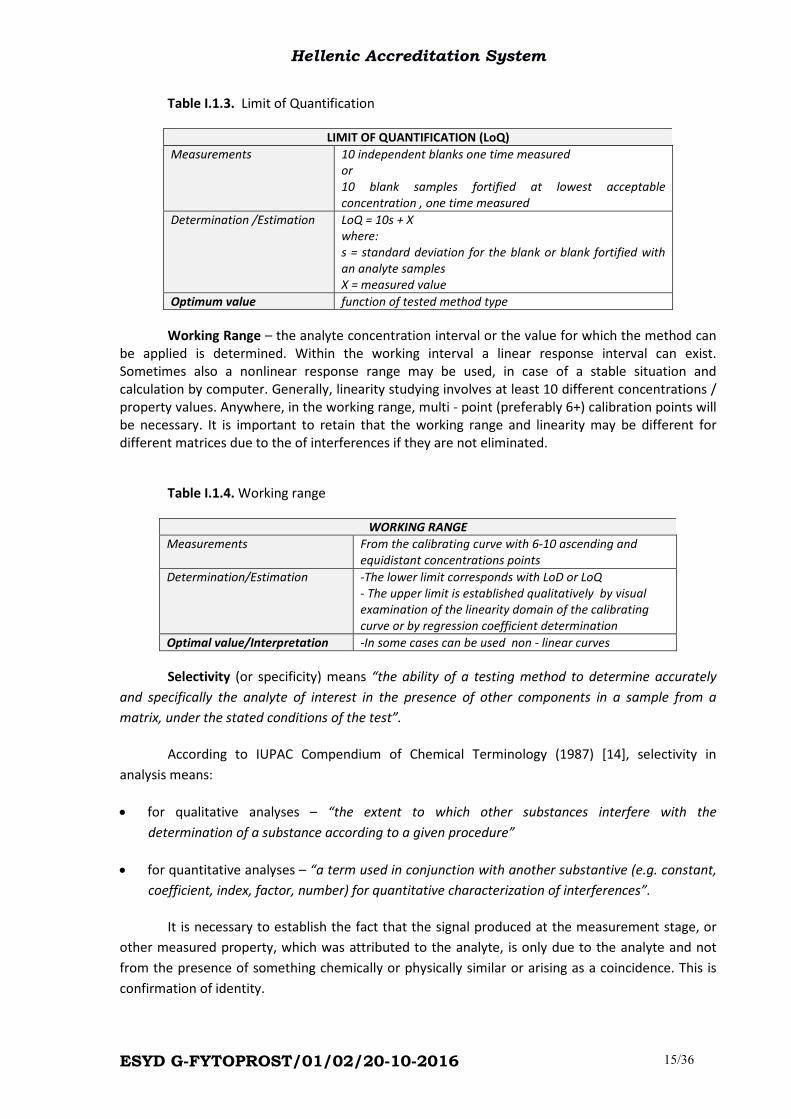
Table I.1.3. Limit of Quantification
LIMIT OF QUANTIFICATION (LoQ)
Measurements 10 independent blanks one time measured
or
10 blank samples fortified at lowest acceptable
concentration , one time measured
Determination /Estimation LoQ = 10s + X
where:
s = standard deviation for the blank or blank fortified with
an analyte samples
X = measured value
Optimum value function of tested method type
Working Range – the analyte concentration interval or the value for which the method can
be applied is determined. Within the working interval a linear response interval can exist.
Sometimes also a nonlinear response range may be used, in case of a stable situation and
calculation by computer. Generally, linearity studying involves at least 10 different concentrations /
property values. Anywhere, in the working range, multi - point (preferably 6+) calibration points will
be necessary. It is important to retain that the working range and linearity may be different for
different matrices due to the of interferences if they are not eliminated.
Table I.1.4. Working range
WORKING RANGE
Measurements From the calibrating curve with 6-10 ascending and
equidistant concentrations points
Determination/Estimation -The lower limit corresponds with LoD or LoQ
- The upper limit is established qualitatively by visual
examination of the linearity domain of the calibrating
curve or by regression coefficient determination
Optimal value/Interpretation -In some cases can be used non - linear curves
Selectivity (or specificity) means “the ability of a testing method to determine accurately
and specifically the analyte of interest in the presence of other components in a sample from a
matrix, under the stated conditions of the test”.
According to IUPAC Compendium of Chemical Terminology (1987) [14], selectivity in
analysis means:
• for qualitative analyses – “the extent to which other substances interfere with the
determination of a substance according to a given procedure”
• for quantitative analyses – “a term used in conjunction with another substantive (e.g. constant,
coefficient, index, factor, number) for quantitative characterization of interferences”.
It is necessary to establish the fact that the signal produced at the measurement stage, or
other measured property, which was attributed to the analyte, is only due to the analyte and not
from the presence of something chemically or physically similar or arising as a coincidence. This is
confirmation of identity.
Hellenic Accreditation System
ESYD G-FYTOPROST/01/02/20-10-2016 16/36
Selectivity / specificity are measures which assess the reliability of measurements in the presence of
interferences.
The selectivity of a method is usually investigated by studying its ability to measure the
analyte of interest in test portions to which specific interferences have been deliberately
introduced.
Thus, firstly:
• analysis of the samples and reference materials by the selected or other independent methods
and use of the results from the confirmatory techniques to assess the ability of the method to
confirm analyte identity and its ability to measure the analyte separately from other
interferences. To which extent the obtained data are reasonably sufficient to provide enough
reliability is then decided;
• analysis of the samples containing various suspected interferences in the presence of analytes
of interest and determination of the effect of interferences - if the presence of the
interference enhances or inhibits detection or quantification of the measurands. If the
detection or quantification is inhibited by interferences, further method development will be
required.
Specificity is generally considered to be 100% selectivity.
Sensitivity
Sensitivity is “the slope of the response curve, i.e. the change in instrument response
function of the change in analyte concentration”.

Hellenic Accreditation System
ESYD G-FYTOPROST/01/02/20-10-2016 17/36
Table I.1.5. Sensitivity
SENSITIVITY
Measurements From calibrating curve with 6-10 ascending and
equidistant concentrations points
Determination/Estimation b= calibrating curve slope
or S = Δ Y/ Δ C
where:
S = sensitivity
Δ Y= absorbance variation
Δ C = concentration variation
Optimal value -alternates on different concentration ranges
Robustness
The robustness test is used for the analysis of the behaviour of an analytic process when
slight changes in the working conditions / operating parameters are executed or by the evaluation
of the effects on the results over a longer period.
Recovery
Recovery is “the fraction of analyte added to a test sample (fortified or injected sample)
before the measurement”. The percentage recovery R% is calculated with the formula:
R% = [(CF-CU)/CA] x 100
where: - CF is the concentration of the analyte measured in the fortified sample; CU is the
concentration of the analyte measured in the unfortified sample; CA is the concentration of the
analyte added in the fortified sample.
Recovery can be determined analyzing CRM and reporting the concentration found to the
certified value.
Accuracy
Accuracy means “degree of concordance between the results of a test and the accepted
reference value”. The method validation seeks to quantify the accuracy of the results by assessing
systematic and random errors.
Accuracy has two components: trueness and precision. The trueness of a method is “the
degree of concordance between the mean value obtained between a large series of results for a test
and the accepted reference value”.

Hellenic Accreditation System
ESYD G-FYTOPROST/01/02/20-10-2016 18/36
Table I.1.6. Robustness
ROBUSTNESS
Measurements On 4 sub-samples with the same known concentration
are executed measurements when three factors from
the working procedure are modified. The three factors
(A, B ,C) depend on the tested analysis stage.
For example, in the solvent extraction stage the three
factors can be:
- stirring time for the separation funnel,
- mL of extraction agent,
-temperature of sample to be extracted.
In the GC analysis – the three factors can be:
-chromatographic column length
-carrying gas flow
-working temperature
The parameters could be modified in the range ±10%
or less if major changes will occur. The amplified
factors will be marked (+) and the unchanged or
reduced factors with (–).
Determination /Estimation The Youden and Steiner scheme will be applied
Experiment Factors
A B C
Result
1 + + + Y1
2 - + - Y2
3 + - + Y3
4 - - - Y4
The effect A = (∑ Y A+ - ∑ Y A- ) /2
Where : ∑ Y A+ is the sum of results Yi where factor A
has positive values
∑ Y A- is the sum of result Yi where factor A has
negative values
The effect B = (∑ Y B+ - ∑ Y B- ) /2
The effect C = (∑ Y C+ - ∑ Y C- ) /2
Optimum value/Interpretation The effect of modified factor will be established by
applying the t-Student test or a strong modifying effect
will be considered if:
The effect A ( B, C) > 1.4 s cc
s cc = initial method standard deviation from the control
chart.
The method will be considered robust if these
modifications do not have an important influence on
the theoretical values.
Hellenic Accreditation System
ESYD G-FYTOPROST/01/02/20-10-2016 19/36
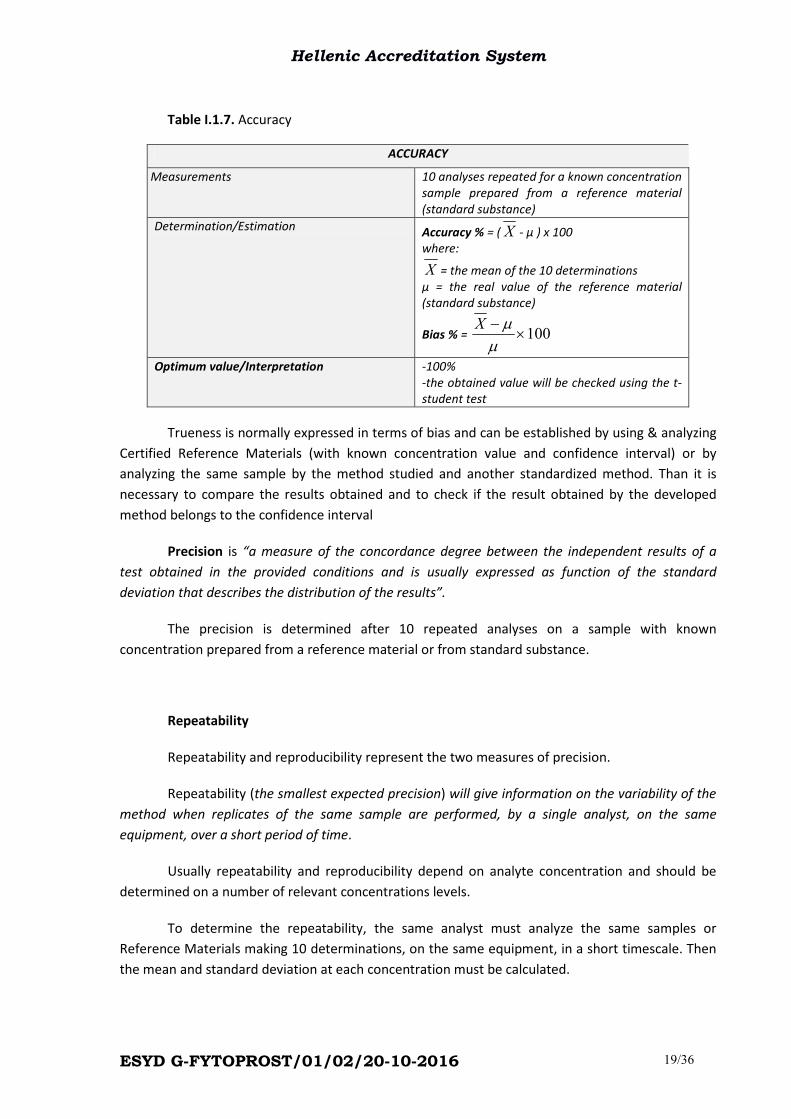
Table I.1.7. Accuracy
ACCURACY
Measurements 10 analyses repeated for a known concentration
sample prepared from a reference material
(standard substance)
Determination/Estimation Accuracy % = ( X - μ ) x 100
where:
X = the mean of the 10 determinations
μ = the real value of the reference material
(standard substance)
Bias % = 100×−
µ
µX
Optimum value/Interpretation -100%
-the obtained value will be checked using the t-
student test
Trueness is normally expressed in terms of bias and can be established by using & analyzing
Certified Reference Materials (with known concentration value and confidence interval) or by
analyzing the same sample by the method studied and another standardized method. Than it is
necessary to compare the results obtained and to check if the result obtained by the developed
method belongs to the confidence interval
Precision is “a measure of the concordance degree between the independent results of a
test obtained in the provided conditions and is usually expressed as function of the standard
deviation that describes the distribution of the results”.
The precision is determined after 10 repeated analyses on a sample with known
concentration prepared from a reference material or from standard substance.
Repeatability
Repeatability and reproducibility represent the two measures of precision.
Repeatability (the smallest expected precision) will give information on the variability of the
method when replicates of the same sample are performed, by a single analyst, on the same
equipment, over a short period of time.
Usually repeatability and reproducibility depend on analyte concentration and should be
determined on a number of relevant concentrations levels.
To determine the repeatability, the same analyst must analyze the same samples or
Reference Materials making 10 determinations, on the same equipment, in a short timescale. Then
the mean and standard deviation at each concentration must be calculated.

Hellenic Accreditation System
ESYD G-FYTOPROST/01/02/20-10-2016 20/36
Table I.1.8. Precision
PRECISION
Measurements 10 analyses repeated for a known
concentration sample prepared from a
reference material (standard substance)
Determination/Estimation CV ( RSD) % = 100×
X
s
where:
X = mean value of the 10 determinations
s = standard deviation
Optimal value - depends on the tested method
Table III.1.9. Repeatability
REPEATABILITY
Measurements 10 analyses repeated for a known concentration
sample prepared from a reference material
(standard substance). The analyses will be achieved
in the same laboratory, by the same analyst, with the
same equipment, with the same method within close
time intervals
Determination/Estimation r = 2.8 x sr
where:
sr = repeatability standard deviation
Optimal value -depends on the methods and the laboratory’s level
of proficiency
Reproducibility (the largest expected precision) will give information on the variability of the
method when the same sample is analyzed in different laboratories, by different analysts, on
different equipment, over a long period of time.
To determine the intra-laboratory reproducibility, different analysts of the same laboratory
must analyze the same samples or Reference Materials making 10 determinations, on different
equipment, in an extended timescale. Then the mean and standard deviation at each concentration
must be calculated.
To determine the inter-laboratory reproducibility, different analysts of different
laboratories must analyze the same samples or Reference Materials making 10 replicates, on
different equipment, in an extended timescale. For the inter-laboratory reproducibility is necessary
to organize a collaborative study.
Hellenic Accreditation System
ESYD G-FYTOPROST/01/02/20-10-2016 21/36
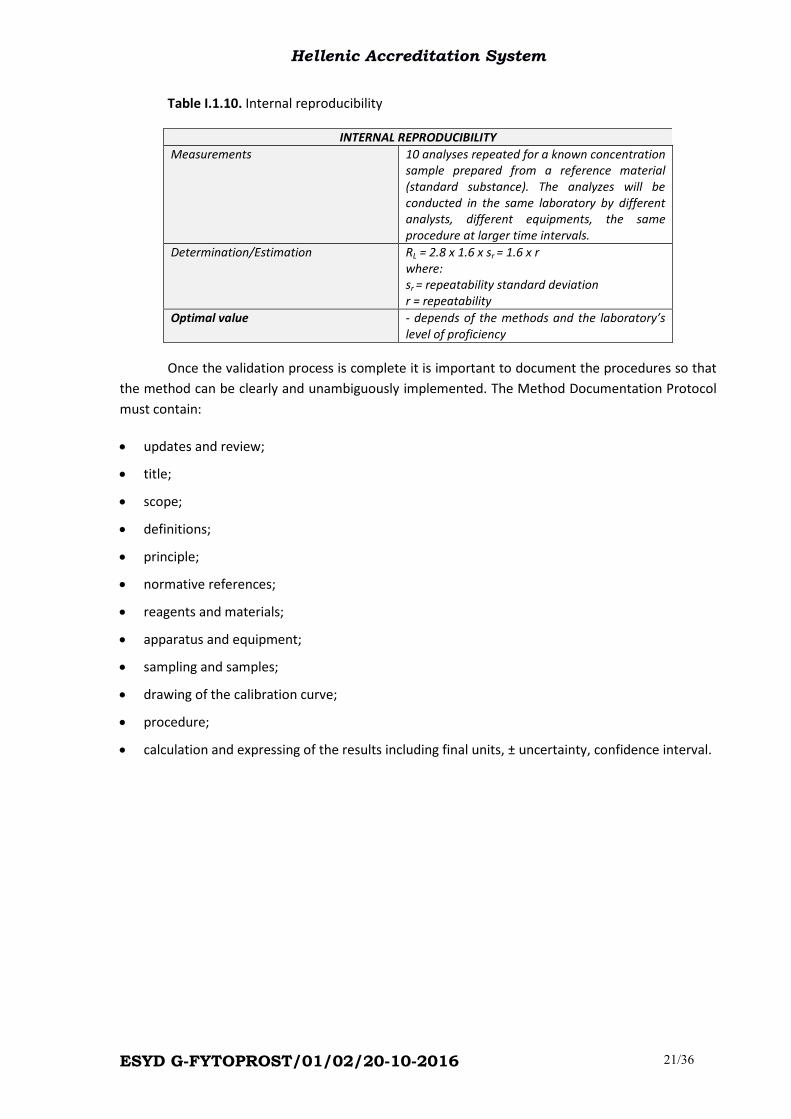
Table I.1.10. Internal reproducibility
INTERNAL REPRODUCIBILITY
Measurements 10 analyses repeated for a known concentration
sample prepared from a reference material
(standard substance). The analyzes will be
conducted in the same laboratory by different
analysts, different equipments, the same
procedure at larger time intervals.
Determination/Estimation RL = 2.8 x 1.6 x sr = 1.6 x r
where:
sr = repeatability standard deviation
r = repeatability
Optimal value - depends of the methods and the laboratory’s
level of proficiency
Once the validation process is complete it is important to document the procedures so that
the method can be clearly and unambiguously implemented. The Method Documentation Protocol
must contain:
• updates and review;
• title;
• scope;
• definitions;
• principle;
• normative references;
• reagents and materials;
• apparatus and equipment;
• sampling and samples;
• drawing of the calibration curve;
• procedure;
• calculation and expressing of the results including final units, ± uncertainty, confidence interval.

Hellenic Accreditation System
ESYD G-FYTOPROST/01/02/20-10-2016 22/36
Appendix B. General Instructions for Quality Control
II.1. Theoretical Aspects
Quality Control (QC) is a “part of Quality Management focused on fulfilling quality
requirements”
The ISO/REMCO document 271 introduces the concept of Quality Control of analytical data,
described as “the complete set of procedures undertaken by the laboratory for continuous
monitoring of operations and results in order to decide whether the results are reliable enough to be
used”.
The techniques and activities involved in Quality Control can be divided into three levels of control,
as shown below:
- first line of control: Instrument check/calibration;
- second line of control: Batch control (control sample);
- third line of control: Inter-laboratory proficiency tests.
The first and the second lines of control represent the internal quality control, while the
third line of control is the external quality control.
The level and type of quality control will depend on the nature and frequency of analysis, batch size,
degree of automation, and test difficulty.
The obtaining of quality data is a bold action for the laboratories requiring a continuous
human and financial effort. A fundamental rule is that 10-20% of the total costs of analysis should
be spent on quality control. Therefore, for quality work at least four conditions should be fulfilled:
- availability of means (adequate personnel and facilities);
- efficient use of time and means (cost aspects);
- availability of expertise (answering questions);
- maintaining and improvement level of output (process continuity).
Internal quality control checks
As part of the quality systems and to monitor day-to-day and batch-to-batch analytical
performance, the laboratories must apply an appropriate level of internal quality control checks and
participate wherever possible in inter-laboratory comparison schemes as external quality control
checks.
The level and type of quality control will depend on the nature and frequency of analyses, batch size
and degree of automation, test difficulty and confidence level for the test.
Hellenic Accreditation System
ESYD G-FYTOPROST/01/02/20-10-2016 23/36
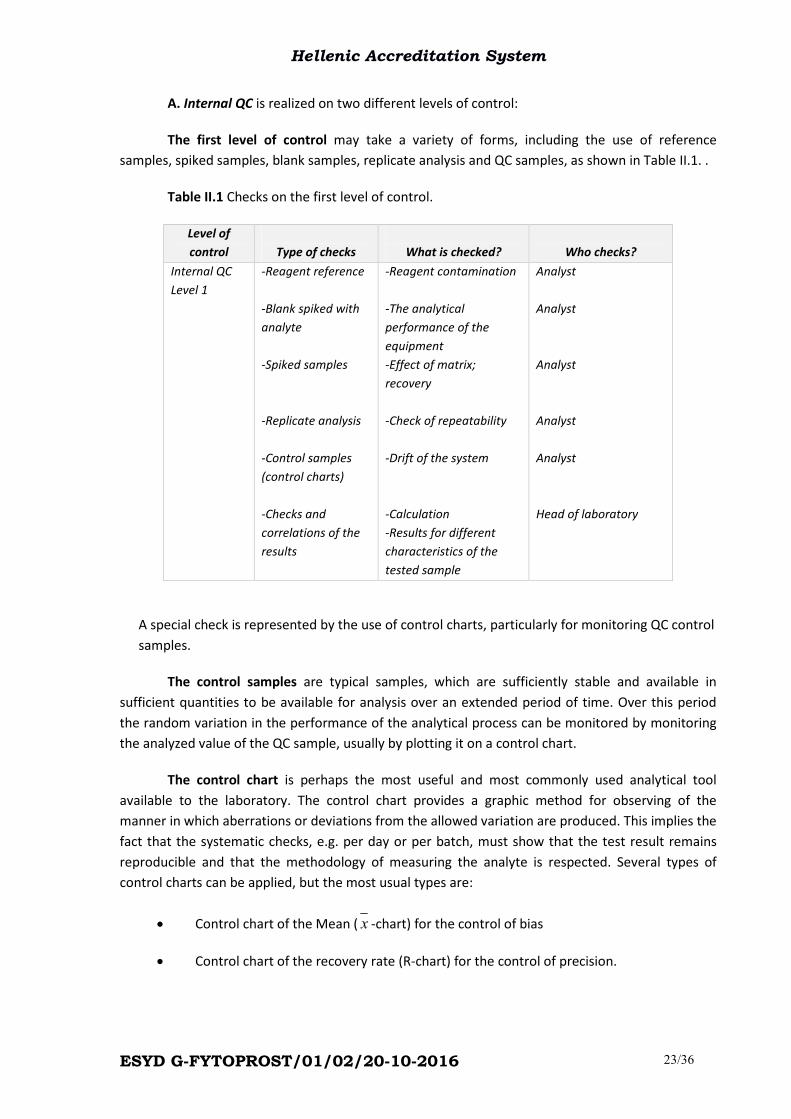
A. Internal QC is realized on two different levels of control:
The first level of control may take a variety of forms, including the use of reference
samples, spiked samples, blank samples, replicate analysis and QC samples, as shown in Table II.1. .
Table II.1 Checks on the first level of control.
Level of
control
Type of checks
What is checked?
Who checks?
Internal QC
Level 1
-Reagent reference
-Blank spiked with
analyte
-Spiked samples
-Replicate analysis
-Control samples
(control charts)
-Checks and
correlations of the
results
-Reagent contamination
-The analytical
performance of the
equipment
-Effect of matrix;
recovery
-Check of repeatability
-Drift of the system
-Calculation
-Results for different
characteristics of the
tested sample
Analyst
Analyst
Analyst
Analyst
Analyst
Head of laboratory
A special check is represented by the use of control charts, particularly for monitoring QC control
samples.
The control samples are typical samples, which are sufficiently stable and available in
sufficient quantities to be available for analysis over an extended period of time. Over this period
the random variation in the performance of the analytical process can be monitored by monitoring
the analyzed value of the QC sample, usually by plotting it on a control chart.
The control chart is perhaps the most useful and most commonly used analytical tool
available to the laboratory. The control chart provides a graphic method for observing of the
manner in which aberrations or deviations from the allowed variation are produced. This implies the
fact that the systematic checks, e.g. per day or per batch, must show that the test result remains
reproducible and that the methodology of measuring the analyte is respected. Several types of
control charts can be applied, but the most usual types are:
• Control chart of the Mean ( x -chart) for the control of bias
• Control chart of the recovery rate (R-chart) for the control of precision.

Hellenic Accreditation System
ESYD G-FYTOPROST/01/02/20-10-2016 24/36
LW = warning limit
LA = action limit
Date/batch
Conc.
(mg/L)s (LA) x 3+
s (LW) x 3 +
x
s (LW) - x 2
s (LA)- x 3
LW = warning limit
LA = action limit
Date/batch
Conc.
(mg/L)s (LA) x 3+
s (LW) x 3 +
x
s (LW) - x 2
s (LA)- x 3
• A control chart is obtained by plotting the analytical data in specific units on the
vertical scale, against time or sequence of tests on the horizontal scale.
1. An x -chart can be started when a sufficient number of measured values for the control
sample are available. For this, it is recommended to start with at least 10 replicates
collected in each bath. The mean, x , and standard deviation, s, of a set of result are
calculated and then the warning limits (±2s) and the action limits (±3s) are drawn on
one and the other side of the mean value (Figure II.1).
Each time that a result for the control sample is obtained in a batch of test samples, this result is
recorded on the control chart. When a chart is full, a new chart must be started. Quality control
rules have been developed to detect excess bias and imprecision as well as shift and tendencies in
the analysis.
Warning rule - (if occurring), then data requires further inspection:
-one control result beyond warning limit
Rejection rules - (if occurring), then the data is rejected:
-one control result over the Action Limit;
-two successive control results over the Warning Limit;
-ten successive control results on the same side of the mean;
-four out of five successive points in decreasing or increasing order.
If any of the rejection rules is violated, specific action must be taken.
Fig. II.1. Control chart of the Mean ( x -chart).
Hellenic Accreditation System
ESYD G-FYTOPROST/01/02/20-10-2016 25/36
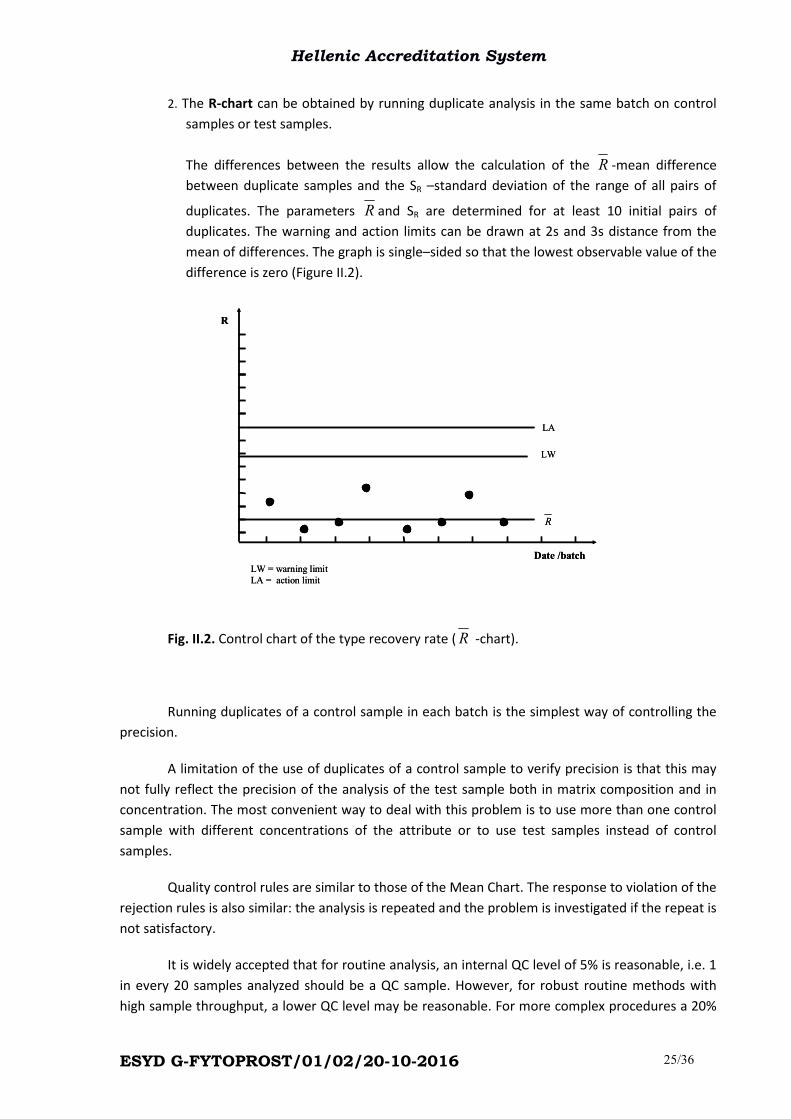
2. The R-chart can be obtained by running duplicate analysis in the same batch on control
samples or test samples.
The differences between the results allow the calculation of the R -mean difference
between duplicate samples and the SR –standard deviation of the range of all pairs of
duplicates. The parameters R and SR are determined for at least 10 initial pairs of
duplicates. The warning and action limits can be drawn at 2s and 3s distance from the
mean of differences. The graph is single–sided so that the lowest observable value of the
difference is zero (Figure II.2).
Fig. II.2. Control chart of the type recovery rate (R -chart).
Running duplicates of a control sample in each batch is the simplest way of controlling the
precision.
A limitation of the use of duplicates of a control sample to verify precision is that this may
not fully reflect the precision of the analysis of the test sample both in matrix composition and in
concentration. The most convenient way to deal with this problem is to use more than one control
sample with different concentrations of the attribute or to use test samples instead of control
samples.
Quality control rules are similar to those of the Mean Chart. The response to violation of the
rejection rules is also similar: the analysis is repeated and the problem is investigated if the repeat is
not satisfactory.
It is widely accepted that for routine analysis, an internal QC level of 5% is reasonable, i.e. 1
in every 20 samples analyzed should be a QC sample. However, for robust routine methods with
high sample throughput, a lower QC level may be reasonable. For more complex procedures a 20%
LW = warning limit
LA = action limit
R
Date /batch
LA
LW
R
LW = warning limit
LA = action limit
R
Date /batch
LA
LW
R
Hellenic Accreditation System
ESYD G-FYTOPROST/01/02/20-10-2016 26/36
level is not unusual, and on occasion even 50% may be required. For analyses performed
infrequently, it is necessary to use a reference material containing a certified or known
concentration of analyte, followed by repeated analyses of the sample and spiked samples. Analyses
undertaken more frequently should be the subject of systematic QC procedures incorporating the
use of control charts and check samples.
The second level of internal QC is represented by “intra-laboratory testing” or in-house
proficiency testing of the analysts. The purpose of such activities is to identify the sources of
measurement method error and to estimate their bias (accuracy), repeatability and reproducibility.
Some of the potential error sources during the test are the operator, the analyst, the equipment,
the calibration and the operating conditions. The results may be analyzed by making comparisons
against each other or against reference standards. The major problems associated with designing a
program of intra- laboratory testing concern the following questions:
• what kind of samples to use;
• how to prepare and introduce the samples into the run without the recipient’s
knowledge;
• how often to check the analyst’s proficiency.
The solutions or criteria for decision-making are listed in Table V.4.3
Table V.II.2. Problems in assessing intra-laboratory tests
No. Problem Solutions and decision criteria
1
Kind of samples
-Replicate samples of unknowns of reference materials
-An aliquot from one day can be introduced for analysis
by another analyst
-Supervisor can place known samples or replicates in the
system occasionally
2
Introducing the sample
-Samples should have the same labels and appearance
as unknowns
-Samples must be exposed by the analyst to the same
preparatory steps as normal unknown samples
3
Frequency of checking
performance
-Function of the method precision
-Function of the degree of automation
-Function of the analyst’s training, attitude and
performances recorded
Such intra-laboratory tests are organized periodically by the supervisor of the laboratory
and by the quality manager, in accordance with a scheduled program.

Hellenic Accreditation System
ESYD G-FYTOPROST/01/02/20-10-2016 27/36
B. External QC
The third line of control is constituted by external quality control. It consists in the
participation of laboratories in different types of inter-laboratory programs organized locally,
regionally, nationally or internationally, as well as within the organization. Before a scheme is
joined, the purpose of participation must be clear, so that a rational choice can be made.
The following operational types can be distinguished:
� Evaluation of the performances of an analytical method by participating to:
- Collaborative study – establishing the performance, characteristics of an analytical
method;
- Comparative study – comparing analytical methods by comparing the results.
� Testing of the performances of the laboratory by participating to :
- Proficiency test (one method) – comparing the performance of the laboratories on the
basis of the same analytical method;
- Proficiency test (different methods) – comparing the performance of laboratories by
comparing the results obtained with their own methods.
� Tests for the certification of the reference materials:
- Certification study – establishing benchmark values for components or properties of a
material;
- Consensus study – establishing characteristic values for components or properties of a
material, for quality control.
The most common type of inter-laboratory comparison scheme in which laboratories
participate consists of proficiency tests, where sub-samples of a large sample are sent to
participating laboratories at regular intervals. Depending on the material to be analyzed, the
laboratories can follow their own analytical procedures or can perform analyses according to a
detailed method proposed by the organizer of the test. When sub-samples have been analyzed for
one or more attributes by the participants, the results are sent to the scheme’s coordinator, where
they will be processed. The “normal” way of data treatment would be to calculate the mean and the
standard deviation. However, in proficiency tests and consensus studies there is a preference for
using the median value rather than the mean, in order to reduce the influence of extreme data.
Individual rating of the proficiency of a laboratory is done with the so-called “Z-score”,
Hellenic Accreditation System
ESYD G-FYTOPROST/01/02/20-10-2016 28/36
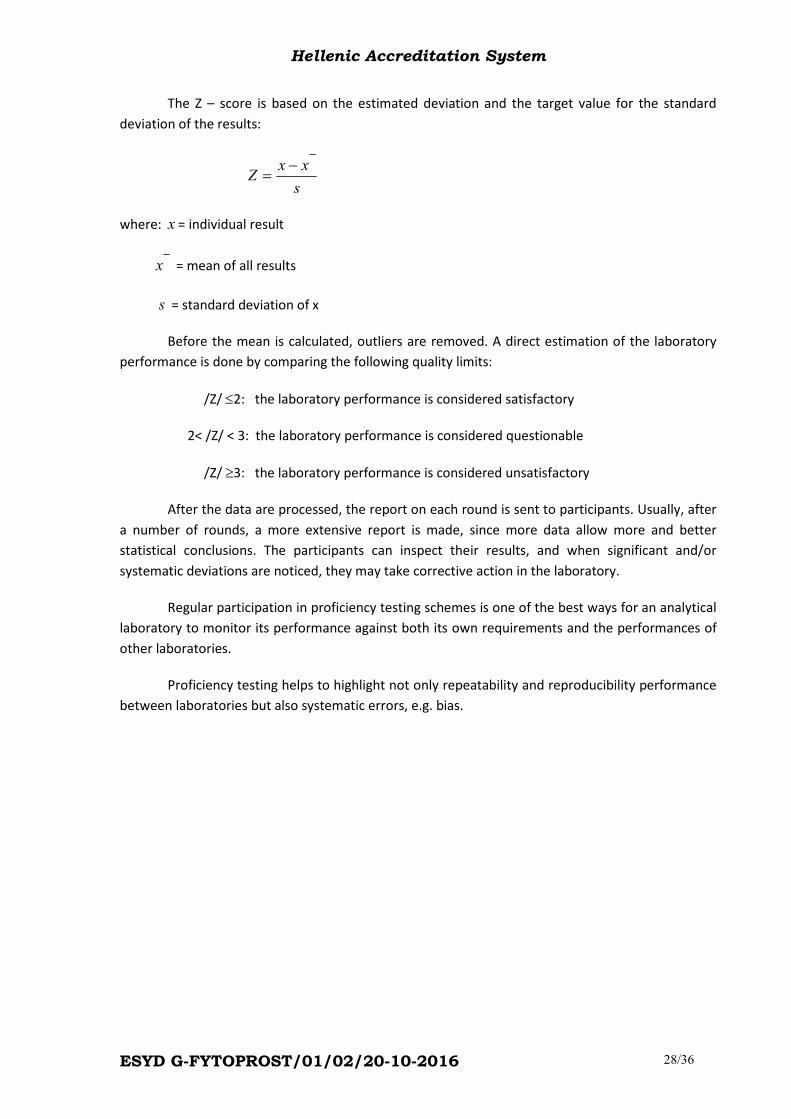
The Z – score is based on the estimated deviation and the target value for the standard
deviation of the results:
s
xxZ
−=
where: x = individual result
x = mean of all results
s = standard deviation of x
Before the mean is calculated, outliers are removed. A direct estimation of the laboratory
performance is done by comparing the following quality limits:
/Z/ ≤2: the laboratory performance is considered satisfactory
2< /Z/ < 3: the laboratory performance is considered questionable
/Z/ ≥3: the laboratory performance is considered unsatisfactory
After the data are processed, the report on each round is sent to participants. Usually, after
a number of rounds, a more extensive report is made, since more data allow more and better
statistical conclusions. The participants can inspect their results, and when significant and/or
systematic deviations are noticed, they may take corrective action in the laboratory.
Regular participation in proficiency testing schemes is one of the best ways for an analytical
laboratory to monitor its performance against both its own requirements and the performances of
other laboratories.
Proficiency testing helps to highlight not only repeatability and reproducibility performance
between laboratories but also systematic errors, e.g. bias.
Hellenic Accreditation System
ESYD G-FYTOPROST/01/02/20-10-2016 29/36
Appendix C. Glossary [SANTE/11945/2015]
Accuracy Closeness of agreement between an analytical result and the true, or accepted
reference value. When applied to a set of results, it involves a combination of
random error (estimated as precision) and a common systematic error
(trueness or bias) (ISO 5725-1). Analyte The chemical species for which the concentration (or mass) is to be
determined. For the purposes of these procedures: a pesticide or a
metabolite, breakdown product or derivative of a pesticide or an internal
standard.
AQC Analytical quality control. Measurement and recording requirements intended
to demonstrate the performance of the analytical method in routine practice.
The data supplement those generated at method validation. AQC data may be
used to validate the extension of methods to new analytes, new matrices and
new levels. Synonymous with the terms internal quality control (IQC) and
performance verification. Concurrent AQC data are those generated during
analysis of the batch in which the particular sample is included.
Batch (analysis) For extraction, clean-up and similar processes, a batch is a series of samples
dealt with by an analyst (or team of analysts) in parallel, usually in one day, and
should incorporate at least one recovery determination. For the determination
system, a batch is a series undertaken without a significant time break and
which incorporates all relevant calibration determinations (also referred to as an
“analysis sequence”, a “chromatography sequence”, etc.). A determination batch
may incorporate more than one extraction batch.
Bias The difference between the mean measured value and the true value.
Blank (i) Material (a sample, or a portion or extract of a sample) known not to contain
detectable levels of the analyte(s) sought. Also known as a matrix blank.
(ii) A complete analysis conducted using the solvents and reagents only; in the
absence of any sample (water may be substituted for the sample, to
make the analysis realistic). Also known as a reagent blank or procedural
blank.
Calibration Determination of the relationship between the observed signal (response
produced by the detection system) from the target analyte in the sample extract
and known quantities of the analyte prepared as standard solutions. In the
present document, calibration does not refer to calibration of weighing and
volumetric equipment, mass calibration of mass spectrometers, and so on.
Calibration standard A solution (or other dilution) of the analyte (and internal standard, if used)
used for calibration of the determination system. May be prepared from a
working standard and may be matrix-matched.
Certified reference material (CRM)
See reference material.
Hellenic Accreditation System
ESYD G-FYTOPROST/01/02/20-10-2016 30/36
Confirmation Confirmation is the combination of two or more analyses that are in agreement with each other (ideally, using methods of orthogonal selectivity), at least one of which meets identification criteria.
It is impossible to confirm the complete absence of residues. Adoption of an
”RL” at the LCL avoids the unjustifiably high cost of confirming the presence, or
absence, of residues at unnecessarily low levels.
The nature and extent of confirmation required for a positive result depends
upon importance of the result and the frequency with which similar residues
are found.
Assays based on an ECD tend to demand confirmation, because of their lack
of specificity.
Mass spectrometric techniques are often the most practical and the least
equivocal approach to confirmation.
AQC procedures for confirmation should be rigorous.
Contamination Unintended introduction of a target analyte into a sample, extract, internal
standard solution etc., by any route and at any stage during sampling or
analysis.
Fragment ion Product ion that results from the dissociation of a precursor ion
GC Gas chromatography (gas-liquid chromatography).
Identification Is a qualitative result from a method capable of providing structural
information (e.g., using mass spectrometric (MS) detection) that meets acceptable criteria for the purpose of the analysis.
The process of generating of sufficient evidence to ensure that a result for a
specific sample is valid. Analytes must be identified correctly in order to be
quantified.
AQC procedures for identification should be rigorous.
Interference A positive or negative response produced by a compound(s) other than the
analyte, contributing to the response measured for the analyte, or making
integration of the analyte response less certain or accurate. Interference is
also loosely referred to as “chemical noise” (as distinct from electronic noise,
“flame noise”, etc.). Matrix effects are a subtle form of interference. Some
forms of interference may be minimised by greater selectivity of the detector.
If interference cannot be eliminated or compensated, its effects may be
acceptable if there is no significant impact on accuracy.
Internal quality
control See AQC.
Within-
laboratory See reproducibility.
Internal standards Definitions are given in the main body of text. Laboratory sample The sample sent to and received by the laboratory.
LC Liquid chromatography (primarily high performance liquid chromatography, HPLC
and Ultra high performance liquid chromatography, UPLC).
LCL Lowest calibrated level. The lowest concentration (or mass) of analyte with
which the determination system is successfully calibrated, throughout the
analysis batch. See also “reporting limit”.
Hellenic Accreditation System
ESYD G-FYTOPROST/01/02/20-10-2016 31/36
LC-MS/MS Liquid chromatographic separation coupled with tandem mass spectrometric
detection.
Level In this document, refers to concentration (e.g. mg/kg, µg/ml) or quantity
(e.g. ng, pg).
LOD
Limit of determination (LOD) means the validated lowest residue concentration which can be quantified and reported by routine monitoring with validated control methods; In this respect it can be regarded as the LOQ (see below)
LOQ Limit of quantitation (quantification). The lowest concentration or mass of the
analyte that has been validated with acceptable accuracy by applying the
complete analytical method.
LOQ is preferable to LOD because it avoids possible confusion with “limit of
detection”. However, In Reg.396/2005 MRLs that are set at the limit of
quantification/determination are referred to as “LOD MRLs”, not “LOQ MRLs”.
Mass accuracy: Mass accuracy is the deviation of the measured accurate mass from the
calculated exact mass of an ion. It can be expressed as an absolute value in milliDaltons (mDa) or as a relative value in parts-per-million (ppm) error and is calculated as follows:
(accurate mass – exact mass)
Example:
the experimentally measured mass = 239.15098,
the theoretical exact mass of the ion m/z = 239.15028. The
mass accuracy = (239.15098 – 239.15028) = 0.7 mDa
or
(accurate mass – exact mass) / exact mass * 106
Example:
the experimentally measured mass = 239.15098,
the theoretical exact mass of the ion m/z = 239.15028
The mass accuracy=(239.15098–239.15028)/239.15028 * 106=2.9 ppm
Mass resolution The resolution of a mass spectrometry instrument is the ability to distinguish between two ions with similar m/z values (IUPAC definition20: the smallest mass difference between two equal magnitude peaks so that the valley between them is a specified fraction of the peak height).
Mass resolving power The resolving power, defined at full-width half maximum (FWHM), is m/Δm,
where m is the m/z being measured and Δm the width of the mass peak at
half peak height.
Note 1: for magnetic sector instruments another definition is used (“10%
valley”). Roughly the difference between the two definitions is a factor of 2
(i.e. 10,000 resolving power by the 10% valley method equals 20,000 resolving
power by FWHM).
Note 2: mass resolving power is often confused or interchangeably used with
mass resolution (see definition above).
Matrix blank See blank.
Matrix effect An influence of one or more co extracted compounds from the sample on the
measurement of the analyte concentration or mass. It may be observed as
increased or decreased detector response, compared with that produced by
solvent solutions of the analyte. The presence, or absence, of such effects
may be demonstrated by comparing the response produced from the analyte in
a solvent solution with that obtained from the same quantity of analyte in the
sample extract.

Hellenic Accreditation System
ESYD G-FYTOPROST/01/02/20-10-2016 32/36
Matrix-matched /matrix- based calibration
Calibration using standards prepared from extracts of the same (matrix-
matched) or any other (matrix-based) blank matrix.
Method A sequence of procedures or steps, from receipt of a sample through to the calculation and reporting of results.
Method validation The process of characterizing the performance to be expected of a method
in terms of its scope, specificity, accuracy sensitivity, repeatability and within
laboratory reproducibility. Some information on all characteristics, except
within laboratory reproducibility, should be established prior to the analysis of
samples, whereas data on reproducibility and extensions of scope may be
produced from AQC, during the analysis of samples. Wherever possible, the
assessment of accuracy should involve analysis of certified reference materials,
participation in proficiency tests, or other inter-laboratory comparisons.
MRL Maximum residue level. In Regulation 396/2005 list MRLs for
pesticide/commodity combinations, an asterisk indicates that the MRL* is set at
or about the LOQ, with the LOQ being here a consensus figure rather than a
measured value.
MRM In pesticide residue analysis: multi-residue method
MRM In mass spectrometry: Application of selected reaction monitoring (SRM)
to multiple product ions from one or more precursor ions
MS Mass spectrometry.
MS/MS n Tandem mass spectrometry, here taken to include MS. An MS
procedure in which ions of a selected mass to charge ratio (m/z) from the
primary ionisation process are isolated, fragmented usually by collision, and the
product ions separated (MS/MS or MS2). In ion-trap mass spectrometers, the
procedure may be carried out repetitively on a sequence of product ions (MSn),
although this is not usually practical with low-level residues.
Performance
verification see analytical quality control (AQC).
Precision The closeness of agreement between independent analytical results obtained
by applying the experimental procedure under stipulated conditions. The smaller
the random part of the experimental errors which affect the results, the more
precise the procedure. A measure of precision (or imprecision) is the standard
deviation21.
Precursor ion Ion that reacts to form particular product ions or undergoes specified neutral
losses. The reaction can be of different types including unimolecular dissociation,
ion/molecule reaction, change in charge state, possibly preceded by
isomerization.
Procedural blank See blank.
Product ion Ion formed as the product of a reaction involving a particular precursor ion
Hellenic Accreditation System
ESYD G-FYTOPROST/01/02/20-10-2016 33/36
”Reference” standard A solid, liquid or gaseous compound that has been prepared in a largely purified
form and packed appropriately to ensure stability and allow transportation
and storage. The storage conditions, expiry date, purity must be indicated as
well as the hydratation water content and the isomer composition where this is
relevant.
Where standards are bought in solution they should be treated as secondary
standards (i.e. as stock or working solutions).
Reagent blank See blank.
Recovery
(of analyte through
an analytical method)
The proportion of analyte remaining at the point of the final determination,
following its addition (usually to a blank sample) immediately prior to extraction.
Usually expressed as a percentage.
Routine recovery refers to the determination(s) performed with the analysis of
each batch of samples.
Reference material Material characterized with respect to its notionally homogeneous content of
analyte. Certified reference materials (CRMs) are normally characterized in a
number of laboratories, for concentration and homogeneity of distribution of
analyte. In-house reference materials are characterized in the owner’s laboratory
and the accuracy may be unknown.
Repeatability (r) The precision (standard deviation) of measurement of an analyte (usually
obtained from recovery or analysis of reference materials), obtained using the
same method on the same sample(s) in a single laboratory over a short
period of time, during which differences in the materials and equipment used
and/or the analysts involved will not occur. The measure of precision usually is
expressed in terms of imprecision and computed as standard deviation of the test
result.
May also be defined as the value below which the absolute difference between
two single test results on identical material, obtained under the above
conditions, may be expected to lie with a specified probability (e.g. 95%).
Reporting limit (RL) The lowest level at which residues will be reported as absolute numbers. It is equal to, or higher than the LOQ. For EU monitoring purposes where samples for surveys are analysed over a 12-month period, the same RL should be achievable throughout the whole year.
Representative analyte
An analyte used to assess probable analytical performance in respect of other
analytes notionally sought in the analysis. Acceptable data for a representative
analyte are assumed to show that performance is satisfactory for the
represented analytes. Representative analytes must include those for which the
worst performance is expected.
Residuals The residuals are the deviations of the measurement values from their values
predicted by the regression line.

Hellenic Accreditation System
ESYD G-FYTOPROST/01/02/20-10-2016 34/36
Reproducibility (R) The precision (standard deviation) of measurement of an analyte (usually by
means of recovery or analysis of reference materials), obtained using the same
method in a number of laboratories, by different analysts, or over a period in
which differences in the materials and equipment will occur. The measure of
precision usually is expressed in terms of imprecision and computed as standard
deviation of the test result.
Within-lab-reproducibility (RSDwR) is that produced in a single laboratory under
these conditions.
May also be defined as the value below which the absolute difference between
two single test results on identical material, obtained under the above
conditions, may be expected to lie with a specified probability (e.g. 95%).
Response The absolute or relative signal output from the detector when presented with
the analyte.
RSD Relative standard deviation (coefficient of variation).
Sample A general term with many meanings but, in these guidelines, refers to
laboratory sample, test sample, test portion, or an aliquot of extract.
Sample preparation The first of two processes which may be required to convert the laboratory
sample into the test sample. The removal of parts that are not to be analysed, if
required.
Selectivity The ability of the extraction, the clean-up, the derivatisation, the separation
system and (especially) the detector to discriminate between the analyte and
other compounds. GC-ECD is a selective determination system providing no
specificity.
SIM Selected ion monitoring. Operation of a mass spectrometer in which the
abundance of several ions of specific m/z values are recorded rather than the
entire mass spectrum
SRM Selected reaction monitoring. Measurement of specific product ions
corresponding to m/z selected precursor ions recorded via two or more stages
of mass spectrometry (MSn).
S/N Signal-to-noise ratio.
Specificity The ability of the detector (supported by the selectivity of the extraction, clean-
up, derivatisation or separation, if necessary) to provide signals that
effectively identify the analyte. GC-MS with EI is a fairly non- selective
determination system capable of high specificity. High resolution mass MS and
MSn can be both highly selective and highly specific.
Spike or spiking Addition of analyte for the purposes of recovery determination or standard
addition.
Standard A general term which may refer to a “pure” standard, stock standard, working
standard, or calibration standard.
Stock standard
solution The most concentrated solution (or solid dilution, etc.) of the “pure”
standard or internal standard, from which aliquots are used to prepare working
standard solutions or calibration standard solutions
Hellenic Accreditation System
ESYD G-FYTOPROST/01/02/20-10-2016 35/36
Trueness The measure of trueness is normally expressed as ‘bias’.
The closeness of agreement between the average value obtained from a series of
test results (i.e. the mean recovery) an accepted reference or true value (ISO
5725-1).
Uncertainty
(of measurement) A range around the reported result within which the true value can be
expected to lie with a specified probability (confidence level, usually
95%). Uncertainty data should encompass trueness (bias) and reproducibility
Unit (sample) A single fruit, vegetable, animal, cereal grain, can, etc. For example, an apple, a
T-bone steak, a grain of wheat, a can of tomato soup.
Unit mass resolution Mass resolution such that it is possible to clearly distinguish a peak
corresponding to a singly charged ion from its neighbours 1 Dalton away, usually
with no more than 5–10 % overlap
Validation See method validation.
Working standard solution
A general term used to describe dilutions produced from the stock standard,
which are used, for example, to spike for recovery determination or to prepare
calibration standard solutions.
Hellenic Accreditation System
ESYD G-FYTOPROST/01/02/20-10-2016 36/36
REFERENCES AND BACKGROUND MATERIAL
1. SANTE/11945/2015 -Guidance document on analytical quality control and method
validation procedures for pesticides residues analysis in food and feed. Supersedes
SANCO/12571/2013, Implemented by 01/01/2016
2. COMMISSION DECISION of 12 August 2002 (2002/657/EC) implementing Council
Directive 96/23/EC concerning the performance of analytical methods and the
interpretation of results.
3. International Organization for Standardization/International Electrotechnical
Commission, ISO/IEC 17025:2005 General Requirements for Competence of Testing and
Calibration Laboratories
4. EURACHEM Guide - The Fitness for Purpose of Analytical Methods A Laboratory Guide to
Method Validation and Related Topics, Second Edition 2014
5. W. Funk, V. Dammann, G. Donnevert “Quality Assurance in Analytical Chemistry”, VCH,
1995;
6. Guide to method validation for quantitative analysis in chemical testing laboratories,
INAB Guide PS15, 3 April 2012, www.inab.ie.
7. ISO 7870:1993- Chart Control – General Principles and applications;
8. ISO 8258-1991- Shewart Chart Control.
9. J. N. Miller, Basic statistical methods for analytical chemistry. Part 2. Calibration and
regression methods. A review, Analyst, 1991, 116, 3.
10. J. C. Miller, J. N. Miller, Statistics and Chemometrics for analytical chemistry, 6th ed.,
Pearson, Harlow, 2010, ISBN 978-0-273730422.
11. VIM (2012): International Vocabulary of Metrology – Basic and General Concepts and
Associated Terms (VIM 3rd edition) JCGM 200:2012