KATS Travel Model Update - Kalamazoo Area Transportation Study

Greening America’s Schools costs and benefits
Gregory Kats
October 2006 | A Capital E Report | www.cap-e.com
sponsoring organizations:
American Federation of TeachersAmerican Institute of ArchitectsAmerican Lung AssociationFederation of American ScientistsU.S. Green Building Council
about the authorGregory Kats, Capital E
Greg Kats is Managing Principal of Capital E, a national clean energy technology and green
building firm. He serves as Senior Advisor to Cherokee Investment Partners (www.cherokeefund.
com), the country’s largest private brownfield developer (with over $5 billion in projected green
developments). He is the Principal Advisor in developing $1 billion of green affordable housing,
involving Enterprise Community Partners, JPMorgan, Chase, Citibank, NRDC, Fannie Mae,
American Institute of Architects, and others (www.greencommunitiesonline.org). He serves as
Senior Advisor to the Cheyne Carbon Fund, the leading investor in the voluntary carbon offset
market. (Cheyne Capital Management is a $30 billion European hedge fund.)
Mr. Kats served as the Director of Financing for Energy Efficiency and Renewable Energy at the
U.S. Department of Energy (1996-2001). With a billion dollar budget, it is the country’s largest
clean technology development and deployment program, including over $400 million annually
in high performance building technology development and deployment. He co-founded and from
1995 to 2001 chaired the International Performance Measurement & Verification Protocol
(www.ipmvp.org) that has served as a technical basis for $8 billion in building upgrades, and been
translated into 10 languages. Mr. Kats serves as Chair of the Energy and Atmosphere Technical
Advisory Group for LEED and serves on the LEED Steering Committee. Mr. Kats recently led
a national technical review (for the US EPA) on the performance of Energy Star commercial
and public buildings, and is a principal author of Green Office Buildings: a Practical Guide to
Development, (Urban Land Institute, 2005).
Mr. Kats earned an MBA from Stanford University and, concurrently, an MPA from Princeton
University on a Woodrow Wilson Fellowship, and is a Certified Energy Manager and a LEED
Accredited Professional. He is a founder of New Resource Bank (www.newresourcebank.com),
the country’s first green bank, and the American Council of Renewable Energy (www.acore.
org), and serves on a half dozen private and public boards. Mr. Kats regularly testifies, serves as
keynote speaker at national conferences, and speaks to organizations such as the American Bar
Association, the National Academy of Sciences, and the US Conference of Mayors.
contributing researcherJon Braman, Capital E
Jon Braman, Research Associate and Assistant to Greg Kats at Capital E, has published articles
in Orion magazine, worked on energy and sustainability issues with the State Public Interest
Research Groups and managed a sustainable homestead in Hawaii. He holds a B.S. in Ecology
and Evolutionary Biology from Yale University.
This document is based on and draws from the 2005 report “National Review of Green Schools:
Costs, Benefits and Implications for Massachusetts,” a report for the Massachusetts Technology
Collaborative. principal author Greg Kats, contributing author Jeff Perlman, contributing
researcher Sachin Jamadagni. (Available at www.cap-e.com.)
This analysis also draws extensively on the 2003 Capital E report “The Costs and Financial
Benefits of Green Buildings“, a report to California’s Sustainable Building Task Force, developed
for 40 state agencies.1 The report was the first to develop a rigorous analysis of the costs and
benefits of green buildings, and found that the average cost premium for green buildings was 2%.
Acknowledgements The generosity of these institutions in funding this study is gratefully acknowledged:
george gund Foundation www.gundfdn.org
kendall Foundation www.kendall.org
the U.s. green Building council www.usgbc.org
Front cover photo:
Third Creek Elementary School
Photography by Spark Productions
Facing page photos:
Clearview Elementary School
Photography by Jim Schafer
Mabel Rush Elementary
Photography by Michael Mathers
Third Creek Elementary
Photography by Spark Productions

�
“This carefully documented study conclusively demonstrates the financial, environmental, and other benefits of using green technologies in schools. In fact,
failure to invest in green technologies is not financially responsible for school
systems; the study uses conservative accounting practices to show that
investments in green technologies significantly reduce the life-cycle cost of
operating school buildings. And the public benefits of green schools are even
larger than those that work directly to the financial advantage of schools. These
include reductions in water pollution, improved environmental quality, and
increased productivity of learning in an improved school environment.”
— Henry Kelly, President, Federation of American Scientists
”This important study persuasively demonstrates that it costs little more to
build high performance, healthy schools and that there are enormous financial,
educational and social benefits to students, schools and society at large.”
— Edward J. McElroy, President, American Federation of Teachers, AFL-CIO
Greening America’s Schools costs and benefits

2
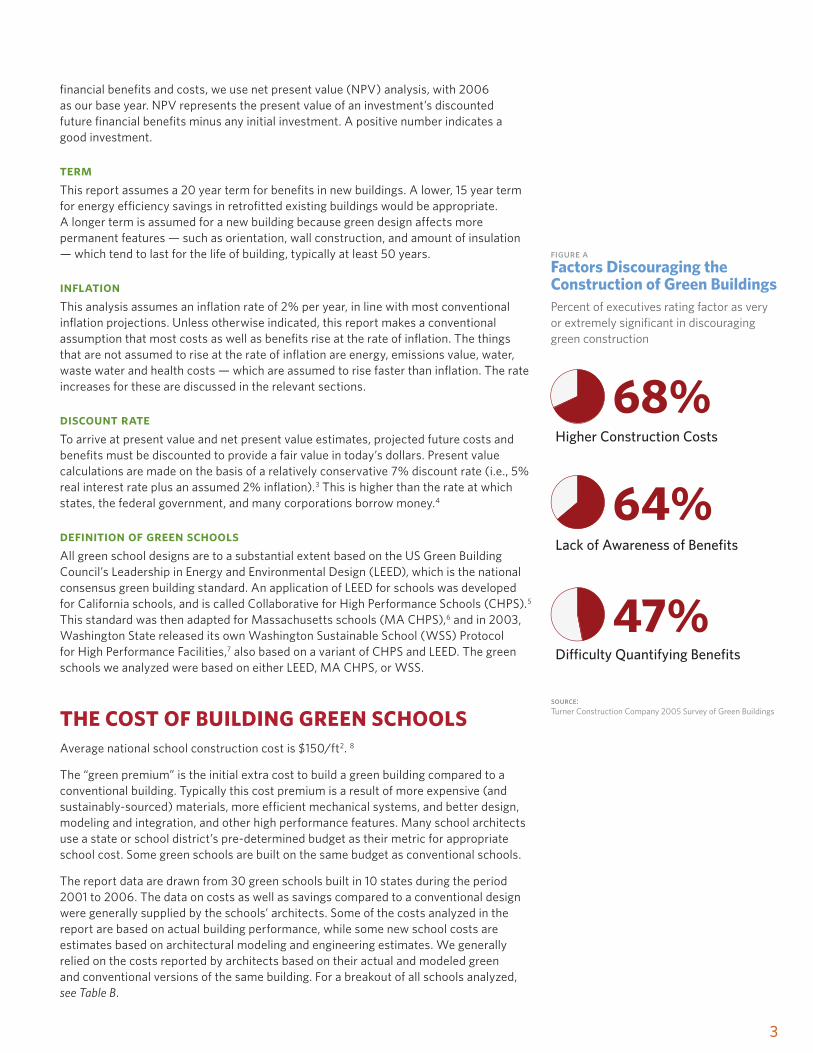
execUtive sUmmArySome 55 million students spend their days in schools that are too often unhealthy and that restrict their ability to learn. A recent and rapidly growing trend is to design schools with the specific intent of providing healthy, comfortable and productive learning environments. These green, high performance schools generally cost more to build, which has been considered a major obstacle at a time of limited school budgets and an expanding student population. A 2005 survey by Turner Construction Company of 665 senior executives found that executives are discouraged from undertaking green construction because of concerns about cost, and a lack of awareness and available information on the financial benefits of green buildings.2
This report is intended to answer this fundamental question: how much more do green schools cost, and is greening schools cost effective?Conventional schools are typically designed just to meet building codes — that are often incomplete. Design of schools to meet minimum code performance tends to minimize initial capital costs but delivers schools that are not designed specifically to provide comfortable, productive, and healthy work environments for students and faculty. Few states regulate indoor air quality in schools or provide for minimum ventilation standards. Not surprisingly, a large number of studies have found that schools across the country are unhealthy — increasing illness and absenteeism and bringing down test scores.
This report documents the financial costs and benefits of green schools compared to conventional schools. This national review of 30 green schools demonstrates that green schools cost less than 2% more than conventional schools - or about $3 per square foot ($3/ft2) - but provide financial benefits that are 20 times as large. Greening school design provides an extraordinarily cost-effective way to enhance student learning, reduce health and operational costs and, ultimately, increase school quality and competitiveness.
The financial savings are about $70 per ft2, 20 times as high as the cost of going green. (Table A) Only a portion of these savings accrue directly to the school. Lower energy and water costs, improved teacher retention, and lowered health costs save green schools directly about $12/ft2, about four times the additional cost of going green. For an average conventional school, building green would save enough money to pay for an additional full-time teacher. Financial savings to the broader community are significantly larger, and include reduced cost of public infrastructure, lower air and water pollution, and a better educated and compensated workforce.
Green schools provide a range of additional benefits that are not quantified in this report, including reduced teacher sick days, reduced operations and maintenance costs, reduced insured and uninsured risks, improved power quality and reliability, increased state competitiveness, reduced social inequity, and educational enrichment. There is insufficient data to quantify these additional benefits, but they are substantial and, if calculated, would substantially increase the recognized financial benefits of greening schools.
Building healthy high performance school buildings is now far more fiscally prudent and lower risk than building conventional, inefficient and unhealthy school buildings.
methodology And AssUmptions
net present valueConventional schools usually have lower design and construction costs and higher operational costs, whereas green schools usually have higher design and construction costs and lower operational costs. To evaluate the current value of a future stream of
greening school design provides an extraordinarily cost-effective way to enhance student learning.
Financial Benefits of Green Schools ($/ft2)
Energy $9
Emissions $1
Water and Wastewater $1
Increased Earnings $49
Asthma Reduction $3
Cold and Flu Reduction $5
Teacher Retention $4
Employment Impact $2
Total $74
Cost of Greening ($3)
Net Financial Benefits $71
table a
�
financial benefits and costs, we use net present value (NPV) analysis, with 2006 as our base year. NPV represents the present value of an investment’s discounted future financial benefits minus any initial investment. A positive number indicates a good investment.
termThis report assumes a 20 year term for benefits in new buildings. A lower, 15 year term for energy efficiency savings in retrofitted existing buildings would be appropriate. A longer term is assumed for a new building because green design affects more permanent features — such as orientation, wall construction, and amount of insulation — which tend to last for the life of building, typically at least 50 years.
inflationThis analysis assumes an inflation rate of 2% per year, in line with most conventional inflation projections. Unless otherwise indicated, this report makes a conventional assumption that most costs as well as benefits rise at the rate of inflation. The things that are not assumed to rise at the rate of inflation are energy, emissions value, water, waste water and health costs — which are assumed to rise faster than inflation. The rate increases for these are discussed in the relevant sections.
discount rateTo arrive at present value and net present value estimates, projected future costs and benefits must be discounted to provide a fair value in today’s dollars. Present value calculations are made on the basis of a relatively conservative 7% discount rate (i.e., 5% real interest rate plus an assumed 2% inflation).3 This is higher than the rate at which states, the federal government, and many corporations borrow money.4
definition of green schoolsAll green school designs are to a substantial extent based on the US Green Building Council’s Leadership in Energy and Environmental Design (LEED), which is the national consensus green building standard. An application of LEED for schools was developed for California schools, and is called Collaborative for High Performance Schools (CHPS).5 This standard was then adapted for Massachusetts schools (MA CHPS),6 and in 2003, Washington State released its own Washington Sustainable School (WSS) Protocol for High Performance Facilities,7 also based on a variant of CHPS and LEED. The green schools we analyzed were based on either LEED, MA CHPS, or WSS.
the cost oF BUilding green schoolsAverage national school construction cost is $150/ft2. 8
The “green premium” is the initial extra cost to build a green building compared to a conventional building. Typically this cost premium is a result of more expensive (and sustainably-sourced) materials, more efficient mechanical systems, and better design, modeling and integration, and other high performance features. Many school architects use a state or school district’s pre-determined budget as their metric for appropriate school cost. Some green schools are built on the same budget as conventional schools.
The report data are drawn from 30 green schools built in 10 states during the period 2001 to 2006. The data on costs as well as savings compared to a conventional design were generally supplied by the schools’ architects. Some of the costs analyzed in the report are based on actual building performance, while some new school costs are estimates based on architectural modeling and engineering estimates. We generally relied on the costs reported by architects based on their actual and modeled green and conventional versions of the same building. For a breakout of all schools analyzed, see Table B.
figure a

�
Four of the green schools (in Georgia, Massachusetts and Oregon) cost no more than conventional design, while several schools cost substantially more. Six schools cost at least 3% more than conventional design while one – the Punahou School in Hawaii – costs 6.3% more. Typically green schools cost 1% to 2% more, with an average cost premium of 1.7%, or about $3/ft2.
Increased cost of green design is typically partially offset by savings elsewhere, for example in reduced cost of HVAC systems or in reduced code compliance costs. Similarly, increased water retention through the use of a green roof or greywater system can avoid the capital cost of a water retention system normally required to comply with water codes. The model green school developed by the architectural firm OWP/P for the Chicago market includes a green roof that allows the building to avoid a water retention system, providing savings sufficient to reduce the school cost premium to 1%.10 A recent evaluation of the impact of LEED adoption, developed for the Portland Energy Office, found that regional life cycle savings from adopting 15 individual green building technologies was over 8 times as large as the direct first cost of these measures.11
Achieving full cost savings requires early integrated design.
BeneFits oF high perFormAnce schools
Energy Cost Savings in Green SchoolsGreen schools use an average of 33% less energy than conventionally designed schools (See Table B). Typical energy performance enhancements include more efficient lighting, greater use of daylighting and sensors, more efficient heating and cooling systems and better insulated walls and roofs.
Reduced energy consumption in green schools has two distinct financial benefits: (1) direct reduction in school energy costs, and (2) indirect secondary impact from reduced overall market demand and resulting lower energy prices market-wide. Direct savings are in the form of lower bills to the school. Indirect savings result from the impact that reduced demand has in lowering the market price of energy. This indirect impact shows up in minute changes in price across entire markets. For an individual school, this price impact is not measurable, but state-wide or nationally, the price impact of reduced energy consumption in schools could be substantial.
Average school energy use in 2005/2006 was $1.15/ft2, of which electricity was 63% and natural gas 34%. For the 30 green schools reviewed in this report, the average energy reduction compared with conventional design is 33%, indicating an average savings of $0.38/ft2 per year in green schools.12 Average electricity prices are $0.09 kWh in 2006 and rose an average 6% per year over the last three years.13 The average gas price rose 14% annually over the same period. Future prices are of course unknowable, but finite energy resources combined with rapid projected international demand growth suggests rising prices. This report projects recent rapid growth in average energy prices to slow to 5% per year, or 3% above inflation, over the next 20 years.
Over a 20 year period, and assuming 7% discount of future benefits of lower energy prices, the result is a present value of $6/ft2 for energy savings in green schools. In green building upgrades of existing schools, the present value benefit of reduced energy use over a 15 year period at a 7% discount rate is $5/ft2. Note that the costs and benefits numbers in this report have all been rounded to the nearest whole dollar amount. Uncertainties about the data, including future price escalation, make greater precision misleading.
some green schools are built on the same budget as conventional schools.
Homewood Middle SchoolGiattina Fisher Aycock Architects Photo: John O’Hagan

�
Name Stat
e
Year
Co
mpl
eted
2005
M
A-CH
PSLE
ED S
core
LEED
Lev
el
or E
quiv
alen
t
Cost
pr
emiu
m
Ener
gy
Savi
ngs
Wat
er
Savi
ngs
Ash Creek Intermediate School OR 2002 CERTIFIED 0.00% 30% 20%
Ashland High School* MA 2005 19 1.91% 29%
Berkshire Hills* MA 2004 27 3.99% 34% 0%
Blackstone Valley Tech* MA 2005 27 0.91% 32% 12%
Capuano MA 2003 26 CERTIFIED 3.60% 41%
Canby Middle School OR 2006 40 GOLD 0.00% 47% 30%
Clackamas OR 2002 33 SILVER 0.30% 38% 20%
Clearview Elementary PA 2002 49 42 GOLD 1.30% 59% 39%
Crocker Farm School MA 2001 37 1.07% 32% 62%
C-TEC OH 2006 35 38 SILVER 0.53% 23% 45%
The Dalles Middle School OR 2002 SILVER 0.50% 50% 20%
Danvers* MA 2005 25 3.79% 23% 7%
Dedham* MA 2006 32 2.89% 29% 78%
Lincoln Heights Elementary School WA 2006 SILVER 30% 20%
Melrose Middle School MA 2007 36 1.36% 20% 20%
Model Green School IL 2004 34 SILVER 2.02% 29% 35%
Newton South High School MA 2006 32 CERTIFIED 0.99% 30% 20%
Prairie Crossing Charter School IL 2004 34 SILVER 3.00% 48% 16%
Punahou School HI 2004 43 GOLD 6.27% 43% 50%
Third Creek Elementary NC 2002 39 GOLD 1.52% 26% 63%
Twin Valley Elementary PA 2004 41 35 SILVER 1.50% 49% 42%
Summerfield Elementary School NJ 2006 42 44 GOLD 0.78% 32% 35%
Washington Middle School WA 2006 40 GOLD 3.03% 25% 40%
Whitman-Hanson* MA 2005 35 1.50% 35% 38%
Williamstown Elementary School MA 2002 37 0.00% 31%
Willow School Phase 1 NJ 2003 39 GOLD 25% 34%
Woburn High School* MA 2006 32 3.07% 30% 50%
Woodword Academy Classroom GA 2002 34 SILVER 0.00% 31% 23%
Woodword Academy Dining GA 2003 27 CERTIFIED 0.10% 23% 25%
Wrightsville Elementary School PA 2003 38 SILVER 0.40% 30% 23%
AVERAGE 1.65% 33.4% 32.1%
table b: school buildings analyzed in this report9
6
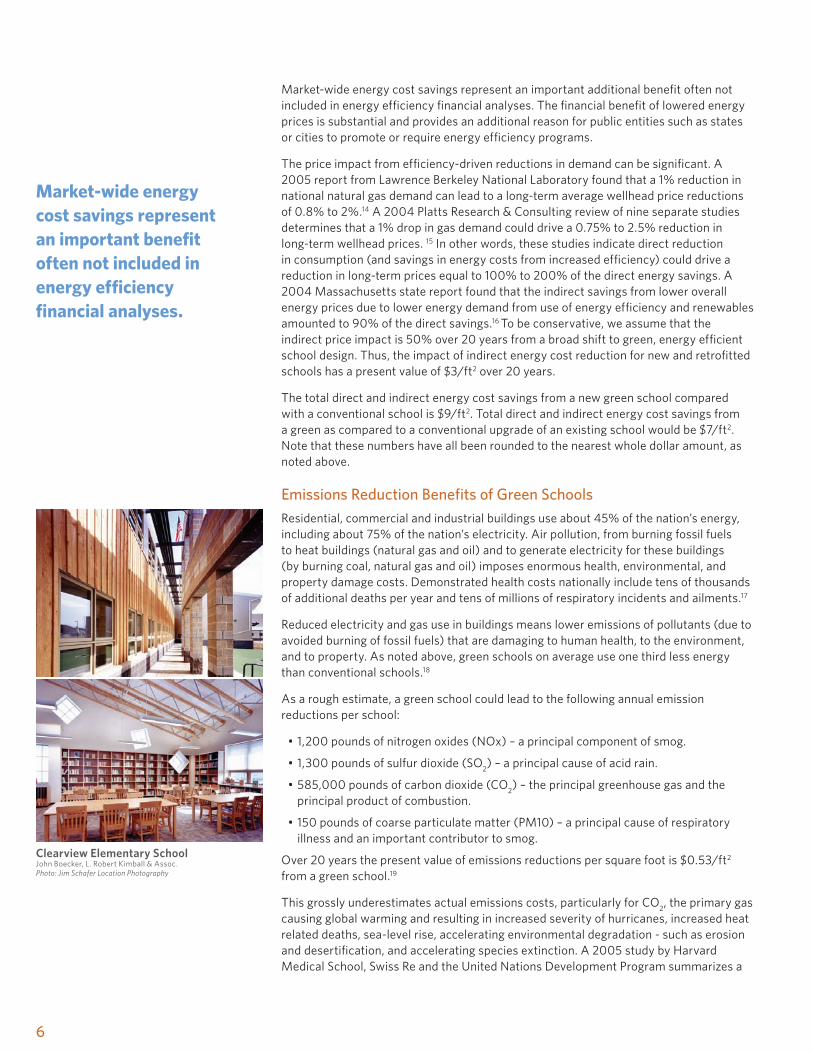
Market-wide energy cost savings represent an important additional benefit often not included in energy efficiency financial analyses. The financial benefit of lowered energy prices is substantial and provides an additional reason for public entities such as states or cities to promote or require energy efficiency programs.
The price impact from efficiency-driven reductions in demand can be significant. A 2005 report from Lawrence Berkeley National Laboratory found that a 1% reduction in national natural gas demand can lead to a long-term average wellhead price reductions of 0.8% to 2%.14 A 2004 Platts Research & Consulting review of nine separate studies determines that a 1% drop in gas demand could drive a 0.75% to 2.5% reduction in long-term wellhead prices. 15 In other words, these studies indicate direct reduction in consumption (and savings in energy costs from increased efficiency) could drive a reduction in long-term prices equal to 100% to 200% of the direct energy savings. A 2004 Massachusetts state report found that the indirect savings from lower overall energy prices due to lower energy demand from use of energy efficiency and renewables amounted to 90% of the direct savings.16 To be conservative, we assume that the indirect price impact is 50% over 20 years from a broad shift to green, energy efficient school design. Thus, the impact of indirect energy cost reduction for new and retrofitted schools has a present value of $3/ft2 over 20 years.
The total direct and indirect energy cost savings from a new green school compared with a conventional school is $9/ft2. Total direct and indirect energy cost savings from a green as compared to a conventional upgrade of an existing school would be $7/ft2. Note that these numbers have all been rounded to the nearest whole dollar amount, as noted above.
Emissions Reduction Benefits of Green Schools Residential, commercial and industrial buildings use about 45% of the nation’s energy, including about 75% of the nation’s electricity. Air pollution, from burning fossil fuels to heat buildings (natural gas and oil) and to generate electricity for these buildings (by burning coal, natural gas and oil) imposes enormous health, environmental, and property damage costs. Demonstrated health costs nationally include tens of thousands of additional deaths per year and tens of millions of respiratory incidents and ailments.17
Reduced electricity and gas use in buildings means lower emissions of pollutants (due to avoided burning of fossil fuels) that are damaging to human health, to the environment, and to property. As noted above, green schools on average use one third less energy than conventional schools.18
As a rough estimate, a green school could lead to the following annual emission reductions per school:
• 1,200 pounds of nitrogen oxides (NOx) – a principal component of smog.
• 1,300 pounds of sulfur dioxide (SO2) – a principal cause of acid rain.
• 585,000 pounds of carbon dioxide (CO2) – the principal greenhouse gas and the
principal product of combustion.
• 150 pounds of coarse particulate matter (PM10) – a principal cause of respiratory illness and an important contributor to smog.
Over 20 years the present value of emissions reductions per square foot is $0.53/ft2 from a green school.19
This grossly underestimates actual emissions costs, particularly for CO2, the primary gas
causing global warming and resulting in increased severity of hurricanes, increased heat related deaths, sea-level rise, accelerating environmental degradation - such as erosion and desertification, and accelerating species extinction. A 2005 study by Harvard Medical School, Swiss Re and the United Nations Development Program summarizes a
Clearview Elementary SchoolJohn Boecker, L. Robert Kimball & Assoc.Photo: Jim Schafer Location Photography
market-wide energy cost savings represent an important benefit often not included in energy efficiency financial analyses.

�
broad range of large economic costs that continued climate change and global warming, driven primarily by burning fossil fuels, will increasingly impose.20
Virtually all of the world’s climate change scientists have concluded that human caused emissions – principally from burning fossil fuels — are causing global warming.21 In 2004, Science published a review of over 900 scientific studies on global warming published in refereed scientific journals over the prior decade and concluded that there is a consensus among climate scientists that serious human induced global warming is happening.22 In April 2005, James Hansen, Director of NASA’s Goddard Institute for Space Studies, stated that “There can no longer be genuine doubt that human-made gases are the dominant cause of global warming.”23
The USA is responsible for about one quarter of global greenhouse gas emissions. The building sector (including residential, commercial and industrial buildings) is responsible for over 40% of US CO
2 emissions — more than any other entire economy in the world
except China.
The large health, environmental and property damages associated with pollution from burning fossil fuels are only very partially reflected in the price of emissions. As the health, financial and social costs of global warming in particular continue to mount, cutting greenhouse gasses through energy efficiency and greater use of renewable energy in buildings will become an increasingly valued benefit of greening buildings.24
Water & Wastewater Benefits of Green SchoolsThe 30 green schools evaluated achieved an average water use reduction of 32%. This reduction has direct savings for the building as well as substantial societal benefits from lower pollution and reduced infrastructure costs to deliver water and to transport and treat wastewater.
When there is heavy and extended rainfall, wastewater systems commonly overflow, causing water pollution and illness, river contamination and beach closings. The benefits of some green building water strategies - such as rainwater catchment and green roofs - are recognized by some municipalities. For example, in Dedham, MA, the school design team, through providing rainwater storage capacity on site, saved the town the cost of enlarging an off site stormwater detention facility. The city valued this infrastructure improvement at $400,000.25
A recent EPA report concludes that the expected gap between future revenues (based on historical price increases) and infrastructure needs for potable water and wastewater treatment will be approximately $148 billion over the next twenty years.26 EPA found that nationally there is a gross under-investment in water delivery and treatment systems, indicating that current water utility rates will have to rise more steeply to secure the funds needed for required infrastructure upgrades.
An empirical study in Canada estimated that the price charged for fresh water was only one-third to one-half the long-run marginal supply cost, and the prices charged for sewage were approximately one-fifth the long run cost of sewage treatment.27
Prices typically reflect average rather than marginal costs. Because water and wastewater costs are generally rising, prices tend to substantially understate actual marginal cost of additional water and wastewater capacity borne by utilities and society at large. Based on discussions with school and green building experts, we can assume conservatively that water and wastewater costs for schools average 5% of the cost of energy, or about $0.06/ft2. Assuming an average rate of cost increase of 5% per year for water and wastewater, this provides an NPV estimate of $0.84/ft2, or roughly one dollar, over 20 years. This almost certainly underestimates the financial benefits of reduced water and sewer cost associated with green design. Nor does it reflect the large savings from reduced water runoff from green schools and the cost savings from reduced water pollution and increased groundwater recharging.
Mabel Rush High SchoolHeinz Rudolf, Boora ArchitectsPhoto: Michael Mathers
the building sector is responsible for over 40% of Us co2 emissions - more than any entire economy in the world except china.

�
Health and Learning Benefits of Green SchoolsAccording to the US General Accounting Office, 14 million students (over a quarter of all students) attend schools considered below standard or dangerous and almost two-thirds of schools have building features such as air conditioning that are in need of extensive repair or replacement. This statistic does not include schools with less obvious but important health related problems such as inadequate ventilation. A recently published document by the American Federation of Teachers notes that the General Accounting Office found that the air is unfit to breathe in nearly 15 thousand schools.28
Poor health and study conditions in schools are of particular concern for a number of reasons, including:
• There are some 60 million students, faculty and staff in schools.
• The large majority of schools are built not to optimize health and comfort, but rather to achieve a minimum required level of design performance at lowest cost.
• Few states regulate indoor air quality in schools or provide for minimum ventilation standards.
• Almost no schools are designed with the specific objective of creating healthy and productive study and learning environments.
• Chronic shortage of funds in schools means that schools typically suffer from inadequate maintenance, and experience degradation of basic systems such as ventilation, air quality and lighting quality, as well as poor control over pollutants (e.g., from cleaning materials).
• Students and faculty typically spend 85% to 90% of their time indoors (mostly at home and at school), and the concentration of pollutants indoors is typically higher than outdoors, sometimes by as much as 10 or even 100 times.29
• Children are growing, their organs are developing, and they breathe more air relative to their body size than adults, and as a result sustain greater health problems and risks than adults from toxics and pollutants common in schools.30
The costs of poor indoor environmental and air quality in schools, including higher absenteeism and increased respiratory ailments, have generally been “hidden” in sick days, lower teacher and staff productivity, lower student motivation, slower learning, lower tests scores, increased medical costs, and lowered lifelong achievement and earnings.
There is a large body of research linking health and productivity with specific building design operation attributes (e.g., indoor air quality and control over work environment, including lighting levels, air flow, humidity, and temperature).
New LeeD program for K-12 SchooLSLindsay Baker, USGBC staff
In December 2006, USGBC is launching LEED for Schools, a market-specific application of LEED that recognizes the unique nature and educational aspects of the design and construction of K-12 schools. The rating system is based on LEED for New Construction, and addresses issues such as classroom acoustics, master planning, mold prevention, and joint use of facilities. The program launch (no pilot period will take place) is supported by a full set of tools tailored to schools: a reference guide, workshop, and LEED Online with credit templates. In doing so, USGBC hopes to help school districts across the country better understand the business case for building green and to help them to implement their green building goals through a third-party certification program that is supported by educational offerings and a nationwide network of LEED Accredited Professionals, USGBC chapters and members. School districts can implement LEED without the additional cost of establishing in-house certification programs.
For more information on the LEED for Schools program, go to www.usgbc.org/leed.
there is a large body of research linking health and productivity with specific building design attributes.

�
However, many reviews of the effects of classroom healthiness on students look only at school-specific studies. This unnecessarily limits the relevant data available to understand and quantify benefits of high performance, healthy design in schools. The tasks done by “knowledge workers” (including most non-factory white collar workers) – such as reading comprehension, synthesis of information, writing, calculations, and communications – are very similar to the work students do. Large-scale studies correlating green or high performance features with increased productivity and performance in many non-academic institutions are therefore relevant to schools.
Two studies of over 11,000 workers in 107 European buildings analyzed the health effect of worker-controlled temperature and ventilation. These studies found significantly reduced illness symptoms, reduced absenteeism and increased productivity relative to workers in a group whose workspace lacked these features.31
One of the leading national centers of expertise on the topic is the Center for Building Performance at Carnegie Mellon University. The Center’s Building Investment Decision Support (BIDS) program has reviewed over 1,500 studies that relate technical characteristics of buildings, such as lighting, ventilation and thermal control, to tenant responses, such as productivity or health.32
Collectively, these studies demonstrate that better building design correlates with increases in tenant/worker well-being and productivity. The BIDS data set includes a number of controlled laboratory studies where speed and accuracy at specific tasks, such as typing, addition, proof reading, paragraph completion, reading comprehension, and creative thinking, were found to improve in high performance building ventilation, thermal control, and lighting control environments.33
17 separate studies all found positive health impacts from improved indoor air-quality, ranging from 13.5% up to 87% improvement.
figure b

�0
indoor air qualityThe Carnegie Mellon building performance program identified 17 substantial studies that document the relationship between improved air quality and health. The health impacts include asthma, flu, sick building syndrome, respiratory problems, and headaches. These 17 separate studies all found positive health impacts (i.e. reduction in reported prevalence of symptoms) ranging from 13.5% up to 87% improvement, with average improvement of 41% (Figure B).
temperature controlTeachers believe that temperature comfort affects both teaching quality and student achievement.34 Research indicates that the best teachers emphasized that their ability to control temperature in classrooms is very important to student performance.35
A review of 14 studies by Carnegie Mellon on the impact of improved temperature control on productivity found a positive correlation for all studies, with productivity improvements ranging from 0.2% up to 15%, and with an average (mean) of 3.6% (Figure C).
high performance lightingGreen school design typically emphasizes providing views and managing daylight – specifically increasing daylight while eliminating glare. These two design features have both been correlated with improvements in performance on tests of office workers. In a study of 200 utility workers, workers with the best views performed 10% -25% better on tests. Workers in offices without glare outperformed workers in offices with glare by 15% or more.36 The consensus findings in a review of 17 studies from the mid 1930s to 1997 found that good lighting “improves test scores, reduces off-task behavior, and plays a significant role in the achievement of students.”37 Another synthesis of 53 generally more recent studies also found that more daylighting fosters higher student achievement.38
good lighting “improves test scores, reduces off-task behavior, and plays a significant role in the achievement of students.”
figure c

��
Carnegie Mellon summarized findings from 11 studies documenting the impact of high performance lighting fixtures on productivity. Their analysis found that productivity gains ranged between 0.7% and 26.1% with an average (median) of 3.2%. (Figure D).
The high performance lighting attributes include efficient lighting and use of indirect lighting fixtures, features that are normal in high performance green buildings.
improved learning and test scores In fall 2005 Turner Construction released a survey of 665 executives at organizations involved in the building sector. Of those involved with green schools, over 70% reported that green schools reduced student absenteeism and improved student performance.39 (Figure E).
A large number of school specific studies indicate a significant positive impact. For example:
• An analysis of two school districts in Illinois found that student attendance rose by 5% after incorporating cost-effective indoor air quality improvements.40
• A study of Chicago and Washington, DC schools found that better school facilities can add 3 to 4 percentage points to a school’s standardized test scores, even after controlling for demographic factors.41
• A recent study of the cost and benefits of green schools for Washington State estimated a 15% reduction in absenteeism and a 5% increase in student test scores.42
Three of the green schools analyzed for this report demonstrate similar significant improvements in performance:
• Students moving into the Ash Creek Intermediate School in Oregon (See Table B) experienced a 15% reduction in absenteeism.43
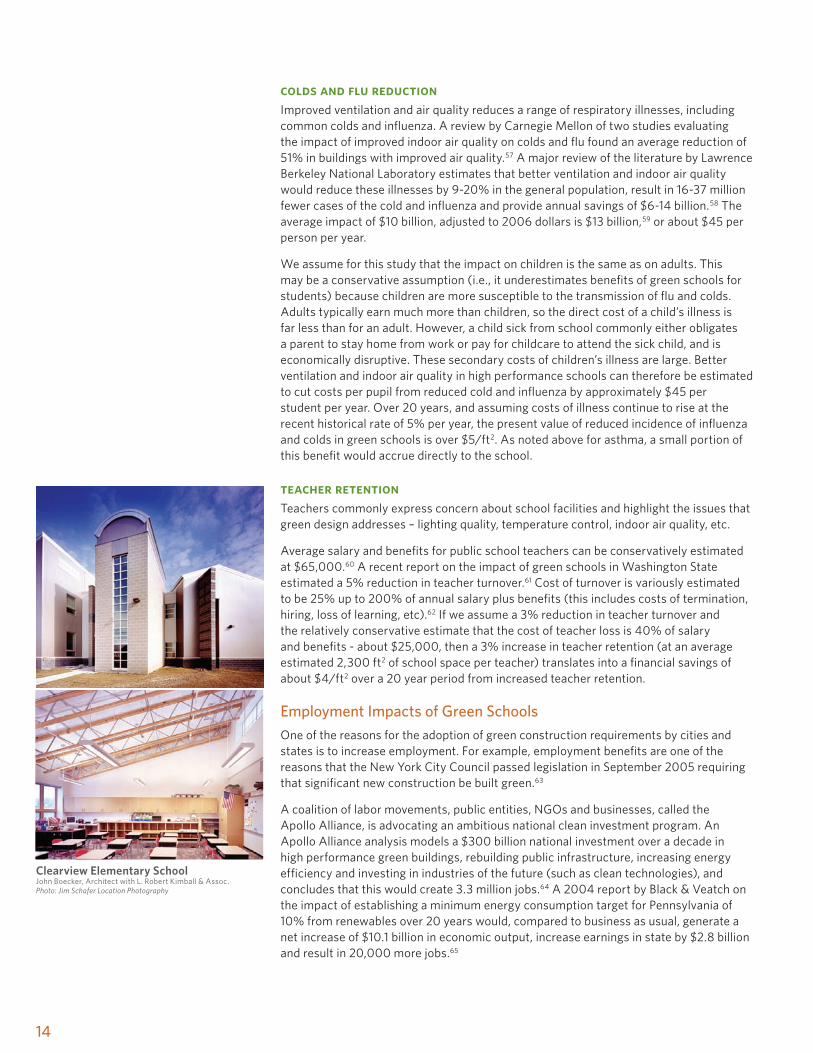
• Students moving from a conventional school to the new green Clearview Elementary School, a 2002 LEED Gold building in Pennsylvania (See Table B and photo on page 14), experienced substantial improvements in health and test scores. A PhD thesis on the school found a 19% increase in average Student Oral Reading Fluency Scores (DIBELS) when compared to the prior, conventional school.44
• The Third Creek Elementary School in Statesville, North Carolina (See Table B and front cover photo) is the country’s first LEED gold K-12 school. Completed in 2002, the 800 student school replaced two older schools. Documented student test scores before and after the move provide compelling evidence that learning and test scores improve in greener, healthier buildings.
According to Terry Holliday, the Superintendent of the Iredell Statesville Schools (which includes Third Creek Elementary School),
“Third Creek Elementary School replaced ADR and Wayside Elementary Schools, schools that were two of the district’s lowest performing school in regards to test scores and teacher retention/absence. This same group of students and teachers improved from less than 60% of students on grade level in reading and math to 80% of students on grade level in reading and math since moving into the new Third Creek Elementary School. Third Creek had the most gains in academic performance of any of the 32 schools in the school system. We feel that the sustainable approach to this project has had very positive results.”45
CHPS, LEED and other green school certifications include a range of material, design and operation measures that directly improve human health and productivity. In addition to achieving the related air and comfort quality prerequisites, the 30 green schools
Third Creek Elementary SchoolMoseley ArchitectsPhoto: Spark Productions

�2
reviewed achieved about half the available indoor environmental quality points from features specifically designed to improve lighting, air quality and comfort.
Based on actual improvements in design in green schools and based on a very substantial data set (some of which is addressed above) on productivity and test performance of healthier, more comfortable study and learning environments, a 3-5% improvement in learning ability and test scores in green schools appears reasonable and conservative. It makes sense that a school specifically designed to be healthy, and characterized by more daylighting, less toxic materials, improved ventilation and acoustics, better light quality and improved air quality would provide a better study and learning environment.
Financial Impact of Improved Health and Learning in Green Schools
future earningsFaster learning and higher test scores are significantly and positively associated with higher lifetime earnings.46 A 2005 review of the financial benefits of education in an International Monetary Fund (IMF) publication concludes:
[Recent] studies, which are based on different, nationally representative data sets that follow students after they leave the education system and enter the labor force, provide remarkably similar estimates: one standard deviation increase (moving from the average of the distribution to the 84th percentile) in mathematics performance at the end of high school translates into 12 percent higher annual earnings — an earnings gain that can be expected across the entire working life of the individual. And there are reasons to believe that these estimates provide a lower bound on the effect of higher educational achievement.47
figure d
greening school design is extraordinarily cost-effective compared with other available measures to enhance student performance.

��
An increase in test scores from 50% to 84% is associated with a 12% increase in annual earnings. As discussed earlier, a smaller improvement in test scores can be conservatively expected from high performance schools compared with conventional schools – in the range of 3% to 5%. Based on the IMF analysis cited above, a 3-5% improvement in learning and test scores is equivalent to a 1.4% lifetime annual earnings increase.
With average annual salary of about $38,000 per year, this improvement in learning and test scores implies an earnings increase of $532 per year for each graduate from a green school. We are assuming, conservatively, that the earnings benefits last only 20 years, even though studies indicate they last for the employment lifetime of about 40 years. Assuming that earnings rise only at the rate of inflation, the present value is about $6,800 per student, or about $49 per ft2. (At a marginal combined federal state and local taxes rate of 40% this indicates an NPV over 20 years of additional tax revenue of $2,700 per student, or $20/ft2. If one-third of students move to other states, state-specific employee earnings benefits decline to an estimated 20 year financial benefit of about $33/ft2.)
Increases in earning represent the single largest financial benefit from building healthier, more productive learning environments. Greening school design is extraordinarily cost-effective compared with other available measures to enhance student performance.
financial benefits of asthma reductionAsthma is a widespread and worsening disease among school children.48 The American Lung Association has found that American school children miss more than 14 million school days a year because of asthma exacerbated by poor indoor air quality.49 Nationally, about one in ten of all school children suffer from asthma.
An American Lung Association 2005 Fact Sheet on Asthma and Children notes that:
• Asthma is the most common chronic disorder in childhood, currently affecting an estimated 6.2 million children under 18 years; of which 4 million suffered from an asthma attack or episode in 2003.50
• Asthma is the third leading cause of hospitalization among children under the age of 15, and it disproportionately affects children.
• The annual direct health care cost of asthma is approximately $11.5 billion, with additional indirect costs (e.g. lost productivity) of another $4.6 billion.51
It costs nearly three times more to provide health care for a child with asthma than a child without asthma.52 In 2006 dollars this amount is equal to $1,650 per child.53 Note that most of these health costs are not borne by the schools but rather by the students and their families.
A recent review by Carnegie Mellon of five separate studies evaluating the impact of improved indoor air quality on asthma found an average reduction of 38.5% in asthma in buildings with improved air quality.54
We assume the impact of a shift from an unhealthy, conventional school to a healthy school results in a reduction in asthma incidence of 25%. In an average sized new school of 900 students, a 25% reduction in asthma incidence in a healthy school translates into 20 fewer children a year with asthma, with an associated annual cost savings of $33,000.55 Over 20 years, and assuming costs of medical treatment continue to rise at the recent historical rate of 5% per year,56 at a 7% discount rate this translates into a benefit of over $3/ft2. A small portion of this benefit would accrue directly to the school in the form of reduced need for nurse care and staff time, while the rest would benefit families and the larger community through reduced health-care needs. This calculation underestimates the asthma reduction benefits since it does not reflect health improvements in school faculty and staff, which are only partially captured in the analysis on faculty retention impact below.
A recent review of five separate studies found an average asthma reduction of 38.5% in buildings with improved air-quality.
figure e
��
colds and flu reductionImproved ventilation and air quality reduces a range of respiratory illnesses, including common colds and influenza. A review by Carnegie Mellon of two studies evaluating the impact of improved indoor air quality on colds and flu found an average reduction of 51% in buildings with improved air quality.57 A major review of the literature by Lawrence Berkeley National Laboratory estimates that better ventilation and indoor air quality would reduce these illnesses by 9-20% in the general population, result in 16-37 million fewer cases of the cold and influenza and provide annual savings of $6-14 billion.58 The average impact of $10 billion, adjusted to 2006 dollars is $13 billion,59 or about $45 per person per year.
We assume for this study that the impact on children is the same as on adults. This may be a conservative assumption (i.e., it underestimates benefits of green schools for students) because children are more susceptible to the transmission of flu and colds. Adults typically earn much more than children, so the direct cost of a child’s illness is far less than for an adult. However, a child sick from school commonly either obligates a parent to stay home from work or pay for childcare to attend the sick child, and is economically disruptive. These secondary costs of children’s illness are large. Better ventilation and indoor air quality in high performance schools can therefore be estimated to cut costs per pupil from reduced cold and influenza by approximately $45 per student per year. Over 20 years, and assuming costs of illness continue to rise at the recent historical rate of 5% per year, the present value of reduced incidence of influenza and colds in green schools is over $5/ft2. As noted above for asthma, a small portion of this benefit would accrue directly to the school.
teacher retentionTeachers commonly express concern about school facilities and highlight the issues that green design addresses – lighting quality, temperature control, indoor air quality, etc.
Average salary and benefits for public school teachers can be conservatively estimated at $65,000.60 A recent report on the impact of green schools in Washington State estimated a 5% reduction in teacher turnover.61 Cost of turnover is variously estimated to be 25% up to 200% of annual salary plus benefits (this includes costs of termination, hiring, loss of learning, etc).62 If we assume a 3% reduction in teacher turnover and the relatively conservative estimate that the cost of teacher loss is 40% of salary and benefits - about $25,000, then a 3% increase in teacher retention (at an average estimated 2,300 ft2 of school space per teacher) translates into a financial savings of about $4/ft2 over a 20 year period from increased teacher retention.
Employment Impacts of Green SchoolsOne of the reasons for the adoption of green construction requirements by cities and states is to increase employment. For example, employment benefits are one of the reasons that the New York City Council passed legislation in September 2005 requiring that significant new construction be built green.63
A coalition of labor movements, public entities, NGOs and businesses, called the Apollo Alliance, is advocating an ambitious national clean investment program. An Apollo Alliance analysis models a $300 billion national investment over a decade in high performance green buildings, rebuilding public infrastructure, increasing energy efficiency and investing in industries of the future (such as clean technologies), and concludes that this would create 3.3 million jobs.64 A 2004 report by Black & Veatch on the impact of establishing a minimum energy consumption target for Pennsylvania of 10% from renewables over 20 years would, compared to business as usual, generate a net increase of $10.1 billion in economic output, increase earnings in state by $2.8 billion and result in 20,000 more jobs.65
Clearview Elementary SchoolJohn Boecker, Architect with L. Robert Kimball & Assoc.Photo: Jim Schafer Location Photography

��
Green buildings typically involve greater initial costs to achieve important green objectives such as improved energy efficiency, increased use of renewable energy (on site and off site), and diversion of waste from landfills for reuse or recycling. These changes create local and US jobs and offset wasteful consumption of energy (some of it imported from anti-democratic nations) and improve productivity and the US trade deficit. Each of these aspects of green design – efficiency, renewable energy and waste diversion — involves increased employment compared with conventional non-green buildings.
energy efficiencyThe typical green school uses one-third less energy than conventional schools. This reduction is a result of a combination of things, including better design, more energy efficiency equipment, and installation of energy efficiency measures such as increased insulation.
A 2004 Massachusetts report found that every $10 million in additional energy efficiency investments contributes about 160 short-term jobs and 30 long-term or permanent jobs. Assuming about $200,000 in additional energy efficiency related investments in a green school relative to a conventional school, investment in energy efficiency creates three short- term jobs through additional work and half of a long-term job per school.66
The average income for a permanent job created can be conservatively estimated as $38,000,67 indicating a long-term annual increase in salary in-state for each green school of $19,000 (half of one fulltime job created from increased energy efficiency). On a 20 year discounted basis, and assuming salaries grow at inflation, this is $250,000 of direct in-state salary created, equal to $2/ft2 for a typical 125,000 ft2 school. This calculation does not include the positive net employment impact of short-term jobs created.
only 2.5 jobs are created for every 1,000 tons of waste disposed, while 4.7 jobs are created for 1,000 tons of waste diverted.
figure f

�6
increased use of renewable energy Green buildings generally use more renewable energy, both on site and off site, than conventional buildings, primarily from purchase of green power and renewable energy credits. Use of renewable energy generally displaces less labor intensive and more polluting energy sources such as imported heating oil, gas, and coal burned in power plants to make electricity.
A shift to more renewable energy would also increase employment. Compared with a business as usual energy growth mix, expanding renewable energy use to 20% nationally by 2020 would create roughly 100,000 net new jobs nationally. The majority of these jobs would be in manufacturing and construction, and would be relatively well paid and broadly distributed (all states would experience positive employment growth) and would particularly benefit sectors of the economy suffering relatively high unemployment.68
It is beyond the scope of this report to estimate the positive employment benefit from increased use of renewable energy in green schools. This increase in employment is expected to be significant, so not calculating it underestimates the financial benefits of requiring that schools be green.
waste diversionA third way that green schools increase employment is by diverting waste from landfills to more labor intensive activities such as separation and recycling.
A recent UC Berkeley study found that total economic impacts from diversion are nearly twice as large as the impacts from sending these materials to dumps. One ton of waste diverted to reuse/recycling generates about twice the employment impact of a ton of waste disposed in a landfill. Only 2.5 jobs are created for every 1,000 tons of waste disposed, while 4.7 jobs are created for waste diverted as recyclables (See Figure F).69
A comprehensive Massachusetts study on the environmental benefits of recycling calculated that the total benefits per ton were $151-$331.70 As noted above, the UC Berkeley study found that diversion was about two times as labor intensive as disposal. This report does not calculate the employment benefits of increased diversion in green schools, but they appear substantial.
conclusion on employment impactsClearly green schools create more jobs than conventional schools. Most energy used in schools comes from burning fossil fuels, some of which is imported from countries that fund terrorism. Thus, the shift to more energy efficiency, which includes in-state manufacturing, system design and installation labor for insulation, renewable energy systems, better windows, etc., would have significant positive employment, economic and security impacts. This report calculates only one of these — long-term employment impact of increased energy efficiency – and it is found to provide $2/ft2 of benefits.
Additional Non-Quantified BenefitsGreen schools provide a range of additional benefits compared with conventional schools. Some of these are discussed below.
reduced teacher sick daysImproved air, comfort and health in green school buildings positively affect teachers. As discussed above, improved lighting, ventilation and indoor environmental quality significantly improve measured health and productivity benefits for workers in buildings. As indicated in Figure E, three quarters of senior executives interviewed for the 2005 Turner Construction survey believe that being green improves the school’s ability to attract and retain teachers. A PhD thesis on the Clearview Elementary School (See Table B), a 2002 LEED gold building in Pennsylvania, found that teachers experience 1.41 fewer missed working days, a 12% decrease from previous traditional school.71 If teachers
Newberg High SchoolBoora ArchitectsPhoto: Michael Mathers
75% of senior executives believe that being green improves a school’s ability to attract and retain teachers.

��
experience a 7% decrease in sick days in green schools — one day a year less because of healthy air and a better work environment — the reduced cost of substitute teachers provides a present value of about $2/ft2.Conservatively, this benefit is not included in this report.
heat island reduction measuresNon-reflective building surfaces absorb more sunlight, increasing temperature within buildings, as well as on exterior surfaces. In cities this effect creates urban “heat islands” and an associated need for increased air conditioning. Non reflective (typically dark) roofs can be substituted with reflective roofs or green, planted roofs — collectively known as “cool roofs” — and significantly reduce city or local temperature as light/heat is reflected back into space rather than absorbed and radiated locally. By reducing ambient urban temperatures, heat island reduction directly contributes to reduced ozone creation, in turn reducing the large human health costs associated with smog. In addition to positive energy and heat island impacts, cool roofs also experience less expansion and contraction than non-reflective roofs, which contributes to a significant extension of the roof life. Typically, highly reflective roofs last 20% longer than conventional roofs.72 Green roofs (with plants in soil on an impermeable membrane) are expected to last 30-50 years or longer.
Lowered ambient air temperature cuts smog formation, improves comfort and health and cuts the cost of air conditioning. The financial benefits of this aspect of greening schools are substantial but are not quantified here.
lower operations and maintenance (o&m) costsA major recent study of costs and benefits of green buildings for 40 state agencies found that the operations and maintenance (O&M) benefits of greening California public buildings provide savings worth $8/ft2 over a 20 year period.73 Green schools, like other green buildings, incorporate design elements such as commissioning and more durable materials that reduce O&M costs. For example, the Canby School in Oregon, designed by Boora Architects, (see Table B) at a level equivalent to LEED Gold, features exterior surfaces of brick and metal with a baked finish that require virtually no maintenance/painting, as well as a linoleum floor with lower maintenance than conventional flooring.74 Estimating O&M benefits from green schools is beyond the scope of this study but the benefits are probably significant.
enhancement of generating system reliability and improved power qualityThe benefits for businesses and competitiveness from improved power quality resulting from greater energy efficiency can be large. National annual cost of power quality problems and outages have been estimated by the New York State Energy Research and Development Authority and the Electric Power Research Institute at over $100 billion.75 Power quality concerns are a significant issue for many businesses, and energy efficiency and renewable energy provide an important way to reduce power quality and reliability costs.
The Massachusetts Division of Energy Resources 2004 Annual Report on Energy Efficiency activities notes that:
By reducing demand, the energy efficiency programs contribute to system reliability in terms of supply adequacy within a particular area or region… all energy efficiency measures… help maintain adequate margins of generation supply, and can help deter brownouts and blackouts….By reducing load and demand on the power distribution network, the [efficiency] programs decrease the costly likelihood of failures.76
This report does not quantify the power quality and reliability economic benefits of greening the nation’s schools, but they appear substantial.
research has shown that it costs less to recycle most construction and demolition waste than to dispose of it.
North Clackamas High SchoolNote entirely day-lit corridor.Heinz Rudolf, Boora ArchitectsPhoto: Michael Mathers

��
construction & demolition waste reduction benefits of green schoolsAbout 25% of the solid waste discarded nationally is construction and demolition (C&D) waste, adding up to 130 million tons of waste per year.77 Fifty-seven percent of national C&D waste comes from non-residential building projects,78 deriving from three sources: 79,80
• demolition, which creates about 155 pounds of waste per square foot, and makes up 58% of national non-residential C&D waste;
• construction, which creates about 3.9 pounds of waste per square foot, and makes up 6% of national non-residential C&D waste;
• renovation, which makes up 36% of national non-residential C&D waste.
Research has shown that it actually costs less to recycle most C&D waste than to dispose of it. A rigorous 1999 study found that for all construction and demolition wastes (including mixed debris), the cost of recycling is less than the cost of disposal by at least 35%.81
C&D diversion rates are typically at least 50-75% in green buildings and have reached as high as 99% on some projects.82 The green schools studied in this report have an average C&D diversion rate of 74%. The financial benefits of increased waste diversion are not estimated here but appear significant.
insurance and risk related benefitsHealth related benefits from green schools have significant risk and insurance impacts. For example, according to the Chief Economist at the Insurance Information Institute, most insurers reported a tripling of mold-related claims in 2002. By early 2003, more than 9000 claims related to mold were pending the nation’s courts, though most involve family homes.83 Improved ventilation and greater commissioning in green buildings reduces the likelihood of mold and associated liability problems.
The Kats/California study characterized the potential insurance benefits of green buildings by mapping risk and insurance related benefits onto the credits of the LEED system. Each LEED prerequisite and credit was evaluated against seven types of risk: property loss, general liability, business interruption, vehicular, health & workers
INSuraNce BeNefItS of greeN BuILDINgS•Worker Health & Safety. Various benefits, including lower worker’s compensation costs, arise from improved indoor
environmental quality, reduced likelihood of moisture damage, and other factors enhancing workplace safety.
•Property Loss Prevention. A range of green building technologies reduce the likelihood of physical damages and losses in facilities.
•Liability Loss Prevention. Business interruption risks can be reduced by facilities that derive their energy from on-site resources and/or have energy-efficiency features. These risks include those resulting from unplanned power outages.
•Natural Disaster Preparedness and Recovery. A subset of energy efficient and renewable energy technologies make facilities less vulnerable to natural disasters, especially heat catastrophes.
greening public schools creates an opportunity to improve the health and educational settings for all students.
the financial benefits of greening schools are about $70 per ft2, more than 20 times as high as the cost of going green.
��
comp, life, and environmental liability. Of the 64 LEED points available (not including innovation credits) 49 (77%) are associated with measures that have potential risk-reduction benefits.
Insurance-related benefits of green, high performance design are summarized on page 18 (and reproduced from the Kats/California study). This report does not estimate the value of the risk and liability reduction benefits of green buildings.
improving equity and addressing spiritual valuesLower income and minority children disproportionately suffer from poor indoor air quality and related problems in conventional schools. Children in low income families are 30% to 50% more likely to have respiratory problems such as asthma and allergies that lead to increased absenteeism, and diminished learning and test scores. This increase in respiratory problems results in large part from exposure to polluted and unhealthy air and study conditions in schools and at home. Wealthy families can move their children into better designed and healthier private schools. Less affluent families are less likely to have that luxury. Greening public schools creates an opportunity to improve the health and educational settings for all students, regardless of income or background, a process with clear moral benefits. The financial benefits of a less inequitable educational system are difficult to calculate but could be substantial in terms of increased diversity in the work force, community development, increased productivity, etc.
Many people are spiritual and religious, and value environmental richness and environmental protection as an important spiritual issue. For example, a recent Le Moyne College/Zogby International Contemporary Catholic Trends Poll found that 87% of those polled said that protecting the environment is an important issue, with 21% placing it as “the most important issue” facing America today.84 For many Americans, protecting the environment and God’s creatures by cutting energy waste and air and water pollution is a very important part of their religious and spiritual value system.
While spiritual, religious and moral values are difficult to quantify they are important and are relevant for school design choices.
educational enrichment as an aspect of greener, healthier facilitiesHigh performance schools provide hands-on educational opportunities that conventional schools do not. For example, on site renewable energy generation, water conservation features and other green technologies provide very valuable opportunities for hands-on learning. Sidwell Friends, a highly regarded Quaker affiliated school in Washington DC, is making greening a principal objective in its campus renovation and expansion. The ongoing effort to make the school’s building more environmentally-friendly and healthy provides a rich source of hands-on educational material for both full time and summer students. Mike Saxenian, Assistant Head of the School and Chief Financial Officer says that “students have responded with enthusiasm to the school’s decision to build green, and faculty are eager to use the new facilities as a laboratory to demonstrate solutions to environmental problems discussed in class. Trustees, faculty and administrators see the green building program as an affirmation of the school’s core values.”85
summary of additional benefitsThese additional benefits of greening schools — including reduced teacher sick days, lower operations and maintenance costs, improved electricity quality and reliability, reduced insurance and risk related costs, and improved educational quality — are all substantial benefits that are not quantified in this study. These additional benefits, if calculated, would greatly increase the recognized financial benefits of greening schools and further strengthen the case that building conventional relatively inefficient and unhealthy school buildings today is financially imprudent and even irresponsible.
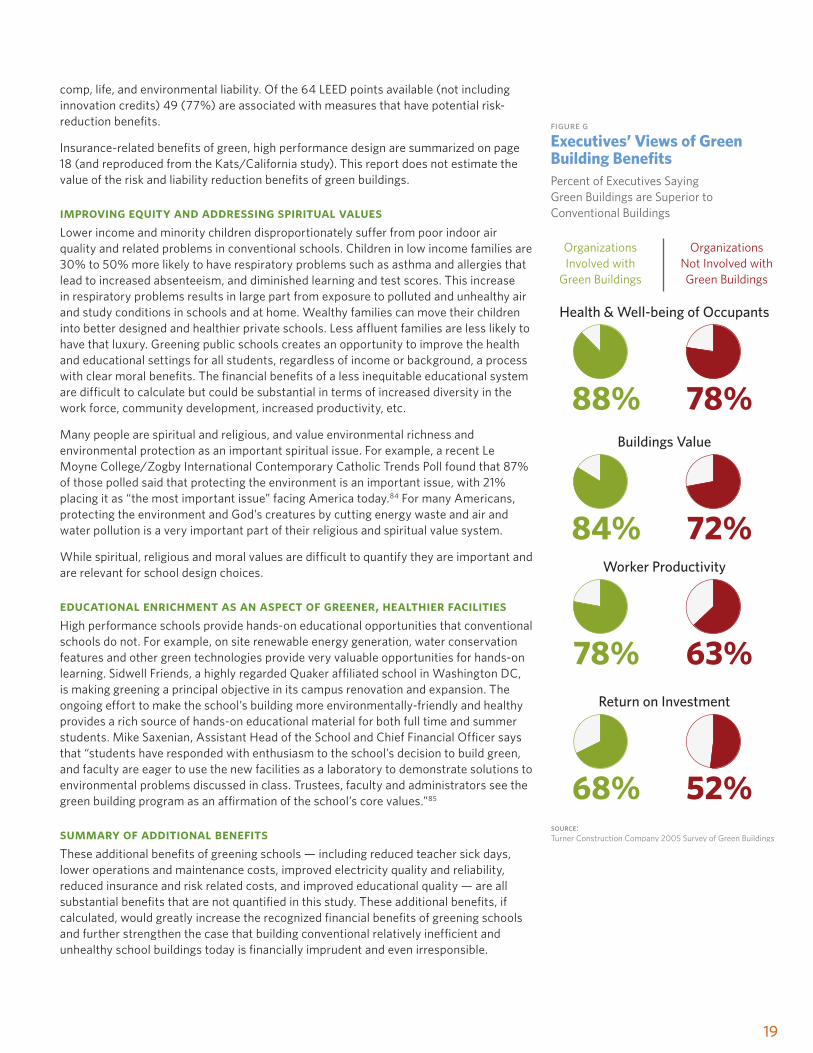
figure g

20
note on impact of increased experience with green buildingsThere is a learning curve associated with designing and building green schools. For both public and private owners and developers of green buildings, subsequent green buildings generally cost less than the first. The trend of declining costs associated with increased experience in green building construction has been experienced in Pennsylvania,86 as well as in Portland and Seattle. Portland’s first three reported completed LEED Silver buildings incurred cost premiums of 2%, 1% and 0% respectively.87 Seattle saw the cost premium of LEED Silver buildings drop from 3-4% to 1-2%.88
Similarly, a recent survey by the national construction firm, Turner Construction, found that the recognized benefits of green building in a range of areas, (including health benefits and productivity) increase significantly as they gain experience with green buildings (see Figure G).
For example, 78% of executives in organizations not involved with green building believe that greening a building improves health and well being of occupants, while 88% of executives in organizations with experiences of green buildings hold this view. Thus, increased experience with green buildings both reduces costs of building green and increases the recognized benefits of green design. For school districts considering greening their schools, these trends highlight the large educational and financial benefits of greening both new and existing schools.
conclUsionsGreening school design is extremely cost-effective. Green schools cost on average almost 2% more, or $3 more per ft2, than conventional schools. The financial benefits of greening schools are about $70 per ft2, more than 20 times as high as the cost of going green. Only a portion of these savings accrue directly to an individual school. Lower energy and water costs, improved teacher retention, and lowered health costs save green schools directly about $12/ft2, about four times the additional cost of going green, and enough to hire an additional full-time teacher.
Analysis of the costs and benefits of 30 green schools and use of conservative and prudent financial assumptions provides a clear and compelling case that greening schools today is extremely cost-effective, and represents a fiscally far better design choice. Building green schools is more fiscally prudent and lower risk than continuing to build unhealthy, inefficient schools.
greening schools today is extremely cost-effective, and represents a fiscally far better design choice.
Financial Benefits of Green Schools ($/ft2)
Energy $9
Emissions $1
Water and Wastewater $1
Increased Earnings $49
Asthma Reduction $3
Cold and Flu Reduction $5
Teacher Retention $4
Employment Impact $2
Total $74
Cost of Greening ($3)
Net Financial Benefits $71

2�
1 This report draws extensively on two recent studies of the costs and benefits of green schools and green buildings: Kats, Greg et al. “National Review of Green Schools: Costs, Benefits and Implications for Massachusetts,” a report for the Massachusetts Technology Collaborative (MTC), 2005. Principal Author Greg Kats, Capital E, contributing author Jeff Perlman, Capital E, contributing researcher Sachin Jamadagni, MTC. And Kats, Greg et al. “The Costs and Financial Benefits of Green Buildings,” a report to California’s Sustainable Building Task Force, 2003. Principal Author: Greg Kats, Capital E, Contributing Authors: Leon Alevantis, Department of Health Services, Adam Berman, Capital E, Evan Mills, Lawrence Berkeley National Laboratory “(on insurance issues)” and Jeff Perlman, Capital E. Task Force Chair: Arnie Sowell. Available at www.cap-e.com.
2 “2005 Survey of Green Buildings,” Turner Construction. Available at: http://www.turnerconstruction.com/greenbuildings
3 7% (e.g., 5% real plus inflation) is consistent with the Kats/California Report and is higher (more conservative) than the “Washington High Performance School buildings: Report to the Legislature,” which used 5% discount rate. (Washington State Board of Education and Office of the Superintendent of Public Instruction, prepared by Paladino & Company, January 2005)
4 The Wall Street Journal lists discount rates daily, dependent upon credit rating. See Market Data and Resources: http://online.wsj.com/public/site_map?page=Site+Map. See also: http://oregonstate.edu/Dept/pol_sci/fac/sahr/cf166503.pdf and http://www.jsc.nasa.gov/bu2/inflateGDP.html.
5 Collaborative for High Performance Schools http://www.chps.net
6 MA Collaborative for High Performance Schools: http://www.mtpc.org/RenewableEnergy/green_schools/chps_standards.htm Also see: http://www.mphaweb.org/pol_schools_green.html for valuable set of resources
7 O’Brien & Company, Inc. and Olympic Associates, Inc. “Washington Sustainable Schools Program – Phase 2. Pilot Project – Final Report.”
8 See: http://www.peterli.com/global/pdfs/SPMConstruction2006.pdf, http://asumag.com/mag/university_stalled_momentum/ and also see: http://www.edfacilities.org/cd/dodge0606.pdf
9 Data supplied by the architects except for * - from Doug Sacra, HMFH Architects, November 2005. See: Kats, et al 2005.
10 Personal communication with architect Kevin Hall, OWP/P.
11 “Green City Buildings: Applying the LEED Rating System,” Prepared for the Portland Energy Office by Xenergy Inc, and Sera Architects, June 18, 2000.
12 See: http://asumag.com/mag/university_coming_short/
13 See: http://www.eia.doe.gov/cneaf/electricity/epm/tablees1b.html
14 Wiser, Ryan, Mark Bolinger and Matt St. Clair. “Easing the Natural Gas Crisis: Reducing Natural Gas Prices through Increased Deployment of Renewable Energy and Energy Efficiency.” Lawrence Berkeley National Laboratory, January 2005. p. 40. http://eetd.lbl.gov/EA/EMP
15 “Hedging Energy Price Risk With Renewables and Energy Efficiency,” Platts Research &Consulting Sept, 2004
16 O’Connor, David, Commissioner of the Division of Energy Resources and Beth Lindstrom, Director of the Consumer Affairs and Business Regulation Agencies, “2002 Energy Efficiency Activities Report by the Division of Energy Resources.” Summer 2004, Office of Consumer and Business Affairs, Commonwealth of Massachusetts.
17 See, for example: “The Benefits and Costs of Clean Air Act 1990 to 2010,” 1991, http://www.epa.gov/air/sect812/1990-2010/fullrept.pdf; and Jonathan Samet et al., “The National Morbidity, Mortality, and Air Pollution Study – Part II: Morbidity and Mortality” from Air Pollution In the United States, Health Effects Institute, 2000, http://www.healtheffects.org/Pubs/Samet2.pdf.
18 The calculations below are based on electricity consumption of 8.57 kwh per square foot per year, gas consumption of 0.38 therms per square foot per year, and a total school space of 125,000 square feet. See Kats et al 2005.
19 Assumes 4% annual increase in cost/value of emissions. For more detailed description of emissions reductions calculations see Kats, Greg et al 2005; and the Ozone Transport Commission’s Emission Reduction Workbook: http://www.otcair.org/download.asp?FID=69&Fcat=Documents&Fview=Reports&Ffile=Workbook%202.1%20Manual.pdf
20 “Climate Change Futures Health, Ecological and Economic Dimensions,” Harvard Medical Schools, November 2005. http://www.climatechangefutures.org/pdf/CCF_Report_Final_10.27.pdf
21 Intergovernmental Panel on Climate Change. World Meteorological Association and United Nations Environmental Program. “IPCC Third Assessment Report – Climate Change 2001.” Available at: http://www.ipcc.ch/ Global surface temperature has increased 1/3 degree F in each of the last three decades. See: Hansen, James, et al. “Global Temperature Change,” Proceedings of the National Academy of Sciences. September 2006. http://www.pnas.org/cgi/reprint/0606291103v1
22 Oreskes, Naomi. “TheScientifc Consensus on Climate Change,” Science. 305:1686 December 2004. http://www.sciencemag.org/cgi/content/full/306/5702/1686
23 See Hell and High Water, Joseph Romm, forthcoming from William Morrow, publisher, January 2007. The book provides a very valuable and readable account of global warming science, impacts and politics. A valuable review of the science and impact of global warming is provided by James Hansen NASA’s top climate scientist: http://www.columbia.edu/~jeh1/keeling_talk_and_slides.pdf. Also see: James Hansen, “Answers about the Earth’s energy Imbalance,” 2005 www.earthinstitue.columbia.edu/news/2005/story11-04-05.html. Also,
http://www.climateprogress.org provides daily news updates on climate related science, policy and current events.
24 For example, Cheyne Capital Management Limited, one of Europe’s largest Hedge Funds, is buying high quality verified carbon emission reductions and selling them to financial firms and corporations in the US and Europe that want to manage and reduce their climate change impact. www.cheynecapital.com
25 HMFH Architects, Inc. and Vermont Energy Investment Corp. “The Incremental Costs and Benefits of Green Schools in Massachusetts”, MTC, 2005.
26 The Clean Water and Drinking Water Infrastructure Gap Analysis. Published by the EPA, August 2002. http://www.epa.gov/safewater/gapreport.pdf.
27 Renzetti, Steven. “Municipal Water Supply and Sewage Treatment: Costs, Prices, and Distortions.” Canadian Journal of Economics, May 1999. Available at: http://economics.ca/cje/
28 “An Environment for Learning,” American Federation of Teachers, April 21, 2004. http://www.aft.org/presscenter/speeches-columns/wws/2004/WWS_0404.pdf, Also see: “School Facilities: America’s Schools not Designed or Equipped for the 21st Century”, General Accounting Office Report # HEHS-95-95. See also: “IAQ and student performance”, Environmental Protection Agency, revised August 2003 http://www.epa.gov/iaq/schools/images/iaq_and_student_performance.pdf
29 US Environmental Protection Agency, “Indoor Air Quality,” January 6, 2003. Available at: http://www.epa.gov/iaq/.
30 Mendell and Heath, “Do indoor pollutants and thermal conditions in schools influence student performance? A critical review of the literature” Indoor Air, Vol. 15, p. 27, 2004. Also see: “Do School Facilities Affect Academic Outcome?” National Clearinghouse for Educational Facilities, Mark Schneider, November 2002. Available at www.edfacilites.org
31 Heerwagen, Judith. “Sustainable Design Can Be an Asset to the Bottom Line - expanded internet edition,” Environmental Design & Construction, July 2002.
32 Loftness, Vivian et al. “Building Investment Decisions Support (BIDS),” ABSIC Research 2001-2002 Year End report. Available at: http://nodem.pc.cc.cmu.edu/bids.
33 Data extracted from BIDS Carnegie Mellon University Department of Architecture. Communication with Vivian Loftness, CMU, February 2003, October 2005.
34 Schneider, Mark. “Do School Facilities Affect Academic Outcomes?” National Clearinghouse for Education Facilities, November 2002. Available at: www.edfacilites.org
35 Lowe, JM. “The Interface between educational facilities and learning climate.” Texas A&M dissertation , cited in Schneider.
36 Study described in a valuable review of green building productivity issues in: Alex Wilson, “Productivity in Green Buildings,” Environmental Building News, October 2004.
37 Buckley, Jack et al. “Fix it and they will stay: the effects of schools facility quality on teacher retention in urban school districts” Boston College, supported in Part by the Ford Foundation and the 21st Century schools fund. http://www2.bc.edu/~bucklesj/retention04.pdf
38 Lemasters, LK, “A synthesis of studies pertaining to facilities, student achievement and student behavior,” VA Polytechnic, 1997. Cited in Schneider
39 “2005 Survey of Green Buildings,” Turner Construction. Available at: http://www.turnerconstruction.com/greenbuildings
40 Illinois Healthy Schools Campaign, “Apparently Size Doesn’t Matter: Two Illinois School Districts Show Successful IAQ Management.” School Health Watch, Summer 2003. http://healthyschoolscampaign.org/news/newsletter/2003-summer_HSC-newsletter.pdf. Also see: US Environmental Protection Agency. “IAQ Tools for Schools,” December 2000 (Second Edition). Available at: http://www.epa.gov/iaq/schools/.
41 Schneider, Mark. “Public School Facilities and Teaching: Washington, DC and Chicago,” November 2002. A Report Prepared for the Neighborhood Capital Budget Group (NCBG). Available at: http://www.ncbg.org/press/press111302.htm.
42 “Washington High Performance School Buildings: Report to Legislature” prepared by Paladino & Company, January 31, 2005
43 Personal communication with architect Heinz Rudolf November 2005.
44 Personal communication with architect John Boecker, 7Group, November 2005. Also see: “Wesley Doll, “Green Design Experiences: A Case Study,” PhD Dissertation for University of Pennsylvania, 2005. The thesis evaluated the impacts on students of the Clearview green school compared to the prior, conventional school.
Endnotes

22
45 From Moseley Architects summary sheet, http://www.moseleyarchitects.com
46 See for example http://www.ed.gov/pubs/VoEd/Chapter4/Part6.html, and http://portal.unesco.org/education/en/ev.php-URL_ID=35945&URL_DO=DO_TOPIC&URL_SECTION=201.html
47 Hanushek, Erick. “Why Quality Matters in Education” Finance And Development, International Monetary Fund, June 2005. http://www.imf.org/external/pubs/ft/fandd/2005/06/hanushek.htm
48 “Trends in Asthma Morbidity and Mortality,” American Lung Association, Epidemiology and Statistics Unit, May 2005. Also see: “Pediatric Asthma in Massachusetts 2003-2004,” Mass Department of Public Health, Center for Environmental Health, August 2005.
49 “Asthma in Children fact sheet.” American Lung Association, 2002, www.lungusa.org/asthma/ascpedface99.html. And, “Indoor Air Quality and Student Performance” US EPA, 2003. http://www.epa.gov/iaq/schools/images/iaq_and_student_performance.pdf.
50 National Center for Health Statistics. Raw Data from the National Health Interview Survey, U.S., 2003. (Analysis by the American Lung Association in “Asthma and Children Fact Sheet” July 2005 http://www.lungusa.org/site/pp.asp?c=dvLUK9O0E&b=44352)
51 National Heart, Lung and Blood Institute Chartbook, U.S. Department of Health and Human Services, National Institute of Health, 2004. See: American Lung Association, “Asthma and Children Fact Sheet,” July 2005 at: http://www.lungusa.org/site/pp.asp?c=dvLUK9O0E&b=44352
52 “Attacking Asthma, Combating an epidemic among our children.” Report to the Senate Committee on Post Audit and Oversight of the Massachusetts Senate, December 2002. Referencing The Economic Burden of Asthma in US Children: Estimates from the National Medical Expenditure Survey.” Journal of Allergy, Clinical Immunology 1999; 104:957-63 See: http://www.mass.gov/legis/senate/asthma.htm
53 In 1987 dollars average yearly health costs $468 for a child without asthma, and $1129 with asthma, for a difference of $661. From 1987 to 2006 average health experienced a 150% price increase, based on a 5% yearly average CPI for medical care. Annual per capita health expenditures grew by an average of 5.5% per year from 1995-2003.From: “Health, United States, 2005” Center for Disease Control.
http://www.cdc.gov/nchs/data/hus/hus05.pdf
54 Carnegie Mellon University Center for Building Performance, 2005. http://www.arc.cmu.edu/cbpd/index.html
55 25% reduction from the current national student asthma prevalence rate of 9.5%. From “Trends in Asthma Mortality and Morbidity,” American Lung Association, 2006. http://www.lungusa.org/atf/cf/{7A8D42C2-FCCA-4604-8ADE-7F5D5E762256}/ASTHMA06FINAL.PDF
56 Annual per capita health expenditures grew by an average of 5.5% per year from 1995-2003.Source: http://www.cdc.gov/nchs/data/hus/hus05.pdf “Health, United States, 2005” Center for Disease Control.
57 Carnegie Mellon University Center for Building Performance 2005, http://www.arc.cmu.edu/cbpd/index.html
58 Fisk, Bill. Indoor Air Quality Handbook, McGraw Hill, Lawrence Berkeley National Laboratory, 1999.
59 For Health CPI inflator: See: www.hrsa.gov/osp/dfcr/provide/ppn0401.htm
60 Also see: http://www.aft.org/salary/index.htm. 2003/2004 salary basis of $46,597 adjusted to 2006. Benefits assumed conservatively to be 30%. See for example: http://boston.k12.ma.us/textonly/jobs/teaching.asp#salary
61 “Washington High Performance School Buildings: Report to Legislature” prepared by Paladino & Company, Jan, 2005
62 “The Cost of Teacher Turnover” Texas Center for Educational Research, 2000 See: http://www.sbec.state.tx.us/SBECOnline/txbess/turnoverrpt.pdf
63 See: http://www.nyccouncil.info/pdf_files/newswire/greenbuildings.pdf
64 “The Apollo Jobs Report: For Good Jobs & Energy Independence New Energy for America.” See: http://www.apolloalliance.org/docUploads/ApolloReport.pdf
65 “Economic Impact of Renewable Energy in Pennsylvania”, Black &Veatch, March 2004
66 Based on the analysis by the Massachusetts Division of Energy Resources and the Consumer Affairs and Business Regulation Agencies. See Kats et al., 2005
67 “May 2005 National Occupational Employment and Wage Estimates,” US Department of Labor, Bureau of Labor Statistics. http://www.bls.gov/oes/current/oes_nat.htm#b00-0000
68 Kammen et al, UC Berkeley, “Putting renewables to work: How many jobs can the clean energy industry generate?” Energy Resources Group, University of California at Berkeley, April 2004. http://rael.berkeley.edu/files/2006/Kammen-Renewable-Jobs-2006.pdf
69 Goldman, George and Aya Ogishi, “The Economic Impact of Solid Waste Disposal and Diversion in California.” Paper presented at the Western Agricultural Economic Association Meeting, Logan Utah, July 20, 2001, p. 14. http://are.berkeley.edu/extension/EconImpWaste.pdf.
70 Skumatz, Lisa, Jeffrey Morris et al. “Recycle 2000: Recommendations for Increasing Recycling in the Commonwealth of Massachusetts” prepared for the Commonwealth of Massachusetts Executive Office of Environmental Affairs (EOEA) by the Recycling 2000 Task Force, February 1999. p. 6-7
71 Personal communication with architect John Boecker, L. Robert Kimball & Associates, November 2005. Also see: Doll, Wesley “Green Design Experiences: A Case Study” PhD Dissertation for University of Pennsylvania, 2005. The thesis evaluated the impacts on students of the Clearview green school compared to the prior, conventional school.
72 Data provided by Hashem Akbari Lawrence Berkeley National Laboratory. See: http://eetd.lbl.gov/heatisland/ See also: PG&E. “High Albedo (Cool) Roofs: Codes and Standards Enhancement Study,” 2000. http://www.newbuildings.org/downloads/codes/CoolRoof.pdf
73 Kats, Greg et al. “The Costs and Financial Benefits of Green Buildings: A Report to California’s Sustainability Task Force.” October 2003. www.cap-e.com
74 Personal communication with architect Heinz Rudolph, Boora Architects, October 2005.
75 See: http://www.mtpc.org/dg/benefits/2005-12_NYSERDA_EEA_DG-Power-Quality.pdf#search=%22NYSERDA%20EEA%20DG%20power%20quality%22
76 Division of Energy Resources, Summer 2004, “An Annual Report to the Great and General Court on the Status of Energy Efficiency activities in Massachusetts for the year 2002” Available at: http://www.mass.gov/doer/pub_info/ee02-long.pdf
77 Lennon, Mark et al. Recycling Construction and Demolition Wastes: A Guide for Architects and Contractors, April 2005. The Institution Recycling Network. Page 3. http://www.wastemiser.com/CDRecyclingGuide.pdf
78 Kats, Greg et al. “The Costs and Financial Benefits of Green Buildings: A Report to California’s Sustainability Task Force.” October 2003. www.cap-e.com
79 Freyman, Vance. “Making plans: a New England Contractor conducts careful planning for its construction materials recycling program – Construction Recycling Trends,” Construction & Demolition Recycling, Jan-Feb 2004. Available at: www.findarticles.com
80 US Environmental Protection Agency Municipal and Industrial Solid Waste Division, Office of Solid Waste. “Characterization of Building-related Construction and Demolition Debris in the United States.” June 1998. p. 2-11, Table 8
81 Skumatz, Lisa, Jeffrey Morris et al. “Recycle 2000: Recommendations for Increasing Recycling in the Commonwealth of Massachusetts” prepared for the Commonwealth of Massachusetts Executive Office of Environmental Affairs (EOEA) by the Recycling 2000 Task Force, February 1999
82 California State and Consumer Services Agency and Sustainable Building Task Force. “Building Better Buildings: A Blueprint for Sustainable State Facilities.” December 2001. p16
83 Smith, Ray. “Mold Problems Grow in Shops, Hotels, Offices,” Wall Street Journal, December 4, 2002. http://www.iuoe.org/cm/iaq_bpconc.asp?Item=356.
84 See: http://www.lemoyne.edu/academics/zogby_fall05.htm. See also Kats, Greg “The costs and benefits of green buildings” in Green Office Buildings A Practical Guide to Development, Urban Land Institute, 2005.
85 Personal communication, Mike Saxenian, November 2005. The National Wildlife Federation has developed a schoolyards habitat program to help schools use school grounds as a teaching resource about nature. See: www.nwf.org/schoolyard.
86 John Boecker, L. Robert Kimball and Associates, A/E Firm for the Pennsylvania Department of the Environment Cambria Office Building, Ebensburg, PA, the PA Department of Environmental Protection Southeast Regional Office, Norristown, PA. See: http://www.lrkimball.com/Architecture%20and%20Engineering/ae_experience_green.htm
87 Data provided by Heinz Rudolf, BOORA Architects. See Portfolio/Schools at: http://www.boora.com/ Also see Kats, Greg et al. “The Costs and Financial Benefits of Green Buildings: A Report to California’s Sustainability Task Force.” October 2003
88 Personal Communication with Lucia Athens, Seattle Green Building Program, November 2002. See: http://www.cityofseattle.net/light/conserve/sustainability/.
89 “2005 Survey of Green Buildings,” Turner Construction. Available at: http://www.turnerconstruction.com/greenbuildings

Sidwell Friends SchoolArchitect: KieranTimberlakePhoto: Peter Aaron /Esto

2�
“USGBC is proud to be a sponsor of this important national analysis of the costs and benefits of greening our nation’s schools. The report’s conclusions provide confirmation of USGBC’s position that by building green we all profit. For our nation’s students this is particularly true. Children’s health is disproportionately affected by indoor pollutants, while light and air quality affects their capacity to learn and succeed. This report shows that we owe it to our children - and ourselves - to make all our schools green.”
— S. Richard Fedrizzi, CEO and Founding Chair, U.S. Green Building Council
“High performance, cost effective schools begin with good design. As this study details, nowhere is good design more important than for our schools. Enhanced learning environments that are also environmentally responsible continue to be an ongoing focus of AIA awards programs and government advocacy. But, as the study makes clear, all schools must also be green. Members of The American Institute of Architects believe good design makes a difference. This study underscores the enormous costs of poor design, and the critical impact that good design and operation has on the quality of our children’s education. It deserves widespread consideration if we are to properly prepare students to address the environmental challenges of our new century.”
— Kate Schwennsen, President, The American Institute of Architects
“This report makes the business case for greening America’s schools, and it makes a compelling case indeed. But there is also a public health case to be made. Better indoor air quality, lower levels of chemical emissions, generous provision of natural daylighting, better humidity control--these and other features of green schools offer not only environmental and fiscal benefits, but health benefits as well. These health benefits, in turn, manifest in lower student and staff absenteeism, lower staff turnover, lower health care costs, and improved school and job performance. For the more than 50 million students and the more than 5 million teachers and staff who spend their days in schools, these benefits are substantial and precious. Health professionals, educators, parents, and policymakers should carefully consider the conclusions of this report, and do their part to support environmentally friendly, healthy, and sustainable schools.”
— Howard Frumkin, M.D., Dr.P.H., Director, National Center for Environmental Health and Agency for Toxic Substances and Disease Registry, U.S. Centers for Disease Control and Prevention. Senior Editor, Safe and Healthy School Environments (Oxford University Press, 2006).
“The choices we make in new construction have huge implications for the health of students, faculty and staff. Unfortunately, too many of America’s 55 million elementary through high school students attend schools that are unhealthy and unsound, and inhibit rather than foster learning. This important study persuasively demonstrates that it costs little more to build high performance, healthy schools and that there are enormous financial, educational and social benefits to students, schools and society at large.”
— Edward J. McElroy, President, American Federation of Teachers, AFL-CIO