Greenville County School District ES.pdfGreenville County School District Diane Jackson, Principal...
40
1 Greenville County School District Diane Jackson, Principal Dr. W. Burke Royster, Superintendent Scope of plan: 2018-19 through 2022-23
Transcript of Greenville County School District ES.pdfGreenville County School District Diane Jackson, Principal...

1
Greenville County School District
Diane Jackson, Principal Dr. W. Burke Royster, Superintendent
Scope of plan: 2018-19 through 2022-23

4
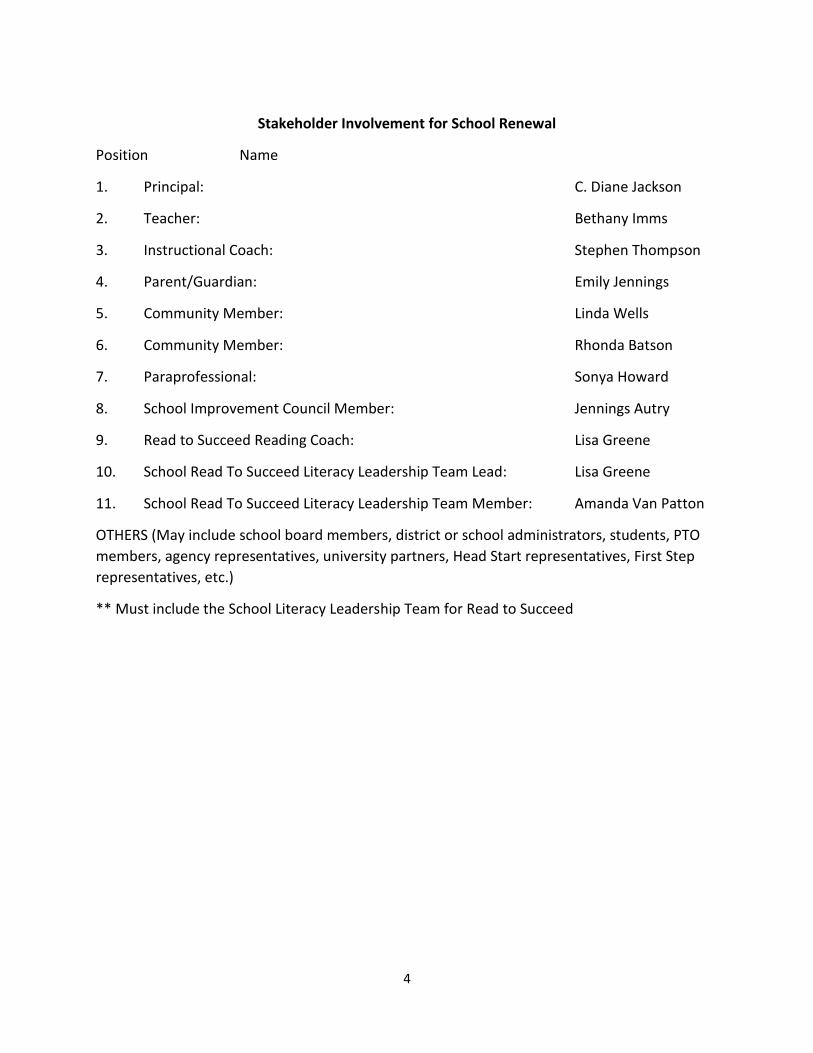
Stakeholder Involvement for School Renewal
Position Name
1. Principal: C. Diane Jackson
2. Teacher: Bethany Imms
3. Instructional Coach: Stephen Thompson
4. Parent/Guardian: Emily Jennings
5. Community Member: Linda Wells
6. Community Member: Rhonda Batson
7. Paraprofessional: Sonya Howard
8. School Improvement Council Member: Jennings Autry
9. Read to Succeed Reading Coach: Lisa Greene
10. School Read To Succeed Literacy Leadership Team Lead: Lisa Greene
11. School Read To Succeed Literacy Leadership Team Member: Amanda Van Patton
OTHERS (May include school board members, district or school administrators, students, PTO
members, agency representatives, university partners, Head Start representatives, First Step
representatives, etc.)
** Must include the School Literacy Leadership Team for Read to Succeed

5
Table of Contents
Introduction 6
Executive Summary 6
School Profile 8
Mission, Vision, and Beliefs 11
Data Analysis and Needs Assessment 12
Action Plan 13

6
Introduction
The strategic planning process at Tigerville involves all members of the faculty and staff. Teams are
formed and use data and narrative summaries for each section of the portfolio. These teams
collaborate after school to construct rough drafts of their findings, strengths, weaknesses, and next
steps. After teams have finalized their research, the entire faculty meets two or three times to refine
and conduct a consensus on each teams’ findings. After each section has been approved by everyone,
the administrative team comes together to finalize the portfolio. Upon the final edits by the
administrative team, the final portfolio is presented one final time to the faculty before it is submitted.
Portfolio Teams:
Teams Curriculum and Planning
Other Curriculum Areas
Instructional Methods,
Interventions, and Assessments
School Climate and Culture
Engaging Families and Community
Name Grade Level
Name Grade Level
Name Grade Level
Name Grade Level
Name Grade Level
Spindler Hansen Guthrie Ward Upton VanPatton Parsons Henley
3rd IC 4K 4th K5 2nd 1st Para
Imms Cummings S. Smith Bartlett
Media PE Art Speech
Kitchens Belt Magaha M. Smith Childs Augustin Howard Boone Jackson
4th 2nd Interv Sp.Ed Bal. Lit. 5th Para 1st Princ.
Paolini Goodwin Arms Goodwin Messer Morgan
Guid. K5 3rd 5th Clerk Para
Greene Albin Biondo Cannada Lewan
3rd Admin. Music 1st Secretary
Executive Summary
Needs Assessment:
Student Achievement - Our school uses many data points/sources when it comes to use of our funding,
allocations, and instructional planning and delivery. We utilize all employees at the school in order to
“reach and teach” all of our students as well as meet their individual needs. The needs of our students
are defined not only as deficit areas, but also as areas to grow and capitalize upon through any means
necessary. We believe that our intentional instructional planning, use of data, and a true sense of
urgency are all key to attaining student achievement, along with student growth and success.
SC READY ELA:
Our SC READY ELA data shows that in Grade 3, the number of students scoring “Does Not Meet” (DNM)
decreased by 4.7% from 2016 to 2017, with an increase of 26.9% in the category of “Meets”. Although
this same group of students dropped by 12.4% in the “Exceeds” category, overall they increased by
14.5% in total number of students “Meets” or “Exceeds” standard. Grade 4 data showed an increase

7
from 0% to 18.6% in the number of students scoring “Does Not Meet” (DNM), increased by 5.9% in the
category of “Meets”, and a decline of 9.0% in students scoring in the “Exceeds” category. The total
number of students scoring “Meets” or “Exceeds” declined by 3.1% from 2016 to 2017. Grade 5 data
showed an 8.6% decline in the number of students scoring “Does Not Meet” (DNM) along with a 2.8%
increase in the percent of students scoring “Meets”. The percent of students meeting or exceeding
standard increased by 10.9% from 2016 to 2017.
When comparing our school’s 2017 scores to those of our district’s, our students scored 14.2 % higher in
regards to students scoring “Meets” or “Exceeds” than the district average. The number of our students
scoring “Meets” or “Exceeds” increased 7.4% from 2016 to 2017. Our school was rated eighth out of
fifty-three elementary schools in the district for our ELA performance on SC READY in 2017
SC READY MATH:
The SC READY Math data indicates the following: In regards to Grade 3, the number of students scoring
“Does Not Meet” (DNM) declined by 12.8% from 2016 to 2017. These same students showed an 11.4%
increase in students scoring “Meets”, as well as a 3.5% increase in the percentage of students scoring
“Exceeds”. From 2016-2017 testing years, Grade 4 students showed an 11.6% increase in the number of
students scoring “Does Not Meet” (DNM), a 9.0% decrease in students scoring “Meets”, and a .4%
increase in students scoring “Exceeds”. Grade 5 students had 0 students scoring “Does Not Meet”
(DNM) in 2017. From 2016-2017 testing years, the percentage of students scoring “Meets” decreased by
15.7% and the percent of students scoring “Exceeds” increased by 36.2%.
When comparing our school’s 2017 raw data scores to those of the district, our students scored 26.5%
higher with students scoring “Meets” or “Exceeds”. The number of our students scoring “Meets” or
“Exceeds” increased 11.4% from 2016 to 2017. Our school was rated first out of fifty-three elementary
schools in the district for our Math performance on SC READY in 2017.
SCPASS Data:
SCPASS Social Science and Social Studies are administered to our 4th (Science) and 5th (Social Studies)
grade students. The data below shows our performance in these two content areas for the past three
years. The 2016-2017 information is based on raw data received from our district.
Our students have continued to show continued growth in Social Studies. According to our data (Chart
#5) Grade 4 had 100% of their students score “Met or “Exemplary” in the 2015-2016 school year; while
Grade 5 had 100% of their students meet or exceed in the 2016-2017 school year (raw data).
When comparing our school’s 2017 raw data scores to those of our district, our students scored 13.4%
higher with students scoring “Met” or “Exemplary” than our school district average. The number of our
students scoring “Met” or “Exemplary” increased from 91.7% to 96.3% for a 4.6% increase from 2016 to
2017. Our school was rated first out of fifty-three elementary schools in the district for our Social Studies
performance on SCPASS in 2017.
When comparing our school’s 2017 raw data scores to those of our district, our students scored 30.5%
higher with students scoring “Met” or “Exemplary” than our school district average. The number of our
students scoring “Met” or “Exemplary” declined from 89.7% to 83.8% for a 6.1% decrease from 2016 to

8
2017. Our school was rated first out of fifty-three elementary schools in the district for our Science
performance on SCPASS in 2017.
Teacher and Administrative Quality:
Based on SC READY results over the past few years, we have made more significant gains in math than
ELA. Therefore, we have set ELA as a priority in order to raise student achievement. Our professional
development plan includes a graduate writing course and trainings on how to create higher level
questions for formative and summative assessments. Teachers also had the opportunity to participate
in a phonics graduate course as well. Most teachers/staff took advantage of this opportunity.
Based on end of the year surveys, the staff indicated a need for Love and Logic refresher training. This
training took place over nine sessions and was completed by November. The entire staff noticed an
increase in student accountability for their actions. This translated into students being more
accountable for their learning as well.
School Climate:
The school report card surveys indicate that the percentage of teachers, students, and parents who are
satisfied with the learning environment is above 93%. At least 89% of teachers, students, and parents
are satisfied with the social and physical environment. Overall, teachers, students, and parents are at
least 78% satisfied with school-home relations. It is noted that parents were the least satisfied in all
three categories.
Significant Challenges:
We have seen a deficit area in vocabulary and writing. Through faculty meeting and grade level
discussions, it was clear that we needed to begin with our end in mind. We needed to provide our
tested grades with a stronger base and scaffolding. We have put an emphasis on increasing writing
student achievement through providing our teachers with onsite graduate course work through Project
Read. We also have dedicated intense support for lesson planning, standard interpretation and
modeling with our primary grades to provide a stronger foundation in these two.
Significant Awards, Results, or Accomplishments:
Tigerville has seen steady growth in standardized test scores over the past three years. We were
recommended to become a Palmetto’s Finest applicant and have recently been nominated as a National
Blue Ribbon School. Our SC READY scores, as mentioned above, have gained district and state level
attention; but more importantly, demonstrate that our students are achieving and that we are
continuing to evolve and meet each students’ needs with each school year.
School Profile
School Community:

9
Tigerville Elementary School, situated in the heart of a small, rural, mountain community, was first built
in 1866 as a one-room schoolhouse. The community feels pride and ownership of the school. In fact,
before the year 2000, the community rallied together to prevent our school from closing or being
converted to a child development center. The school moved from a traditional wooden schoolhouse
structure into a bright, cheerful child-friendly building over a decade ago. Today the school serves 282
students in four-year-old kindergarten through fifth grade. Currently, we have 54 students with special
permission to attend our school. Universal breakfast, a free breakfast/snack program, is available to all
of our students. Our poverty index is 47.4, and we believe this to be relatively inaccurate because our
parents are proud and do not complete the free and reduced forms offered.
As a small school, several challenges appear in the way of funding. A low student population equals lower funds in general. Additionally, a smaller school has a smaller PTA and smaller fundraising capabilities. The majority of our parents are blue-collar labor workers. It is not uncommon that our current students represent the third generation of Tigerville families to come through our school. While being small presents funding hurdles, it gives the faculty and staff greater opportunities to work with students and invest in the individual child. Each day administration, teachers, and staff members greet each child by name; we are truly a family. While our size can be a great weakness, it presents our greatest opportunity. Business partnerships are a vital part of support at Tigerville. Our partners include:
North Greenville University Cliffs Outreach Organization Glassy Elves
Tyger Baptist Church Greenville Drive Buchanan Oil
C & M Grading Tigerville Fire Department Greer Charter High School
Blue Ridge High School Coca Cola
School Personnel:
Our Principal is presently completing her seventh year at Tigerville Elementary. Our Administrative
Assistant is completing his second year. We presently have fifteen classroom teachers, four resource
teachers, specialists and coaches, one guidance counselor and three paraprofessionals. The custodial
team is comprised of one plant engineer and three other custodians. The cafeteria manager is assisted
by two additional staff positions. Tigerville has one attendance clerk, school secretary, and nurse. Our
average student-classroom teacher ratio is 19:1.
Staff Level of Education:
Education Level
Bachelor’s Degree Bachelor’s +18 Master’s Degree Master’s+30
# of Teachers 4 4 18 2
Student Population:
Our student attendance rate for the 2017-2018 school year was 95.4% and teacher attendance was
83.2%. The percent of Gifted and Talented students is 11% of student population
3rd Grade 4th Grade 5th Grade

10
# of Students in Gifted and Talented Program
16 4 11
Present enrollment is 279 students. Demographics are:
4K K5 1st 2nd 3rd 4th 5th
Male 13 25 19 18 32 22 23
Female 9 18 19 18 29 16 18
Racial/Ethnic Composition:
American Indian or Alaska Native
Asian Black or African American
Hispanic or Latino
Native Hawaiian or Other Pacific Islander
White Two or more Races
Percentage 0% 1% 3% 2% 0% 91% 3%
Special Education Services – 11% - 32 Students
Autism Developmentally Delayed
Other Health Impaired,
Specific Learning Disability
Speech or Language Impairment
# of Students 2 3 6 21 26
Student retention rate is 0%, attendance rate is 95.4% and mobility rate is 10.49%.
School’s Major Academic and Behavioral Features/Programs/Initiatives:
Tigerville’s core curriculum is multi-faceted. Faculty and staff conversations are data-driven to identify and establish school initiatives. All lesson plans are based on the Learning Focused format. The curricula foundations for all content areas lies first in: the state standards/indicators, the district’s breakdown of standards (knows/dos) found in the Rubicon Atlas scope and sequence pacing guide, and individual classroom students’ needs. Tigerville’s teachers are lifelong learners that strive to keep current on new developments in technology, integration of curriculum, and the utilization of vertical teaming. Tigerville faculty is flexible and forgiving, as well as willing to stop to regroup if that is in the best interest of their students. In addition to the curricula foundations for all content listed above, Reading/ELA’s curriculum is based on the Fountas and Pinnell balanced literacy approach. This approach utilizes small, fluid guided reading groups based on individual student reading levels determined through formal and informal benchmarking, anecdotal notes, and teacher observations. The administrative team, support staff, and community volunteers all assist with the implementation of these groups. The Balanced Literacy Specialist and Literacy Mentors (primary and intermediate) provide additional support for Reading. They share and model effective ELA strategies with other faculty members. Our school incorporates Project Read components such as phonics, grammar, and writing instruction in all grade levels to further enhance student achievement. Teacher/student-created anchor charts are the foundation of

11
Reading/ELA mini-lessons in our classrooms. These anchor charts serve as a teaching tool not just for that day of instruction, but as a student reference tool throughout the unit and school year. The implementation of a schoolwide Fast Facts initiative five years ago has extended Math’s curricula foundations. This extension was in response to a need for students to master basic computation facts (addition, subtraction, multiplication, division) at each grade level. Each year goals setting takes place through vertical teaming. Each grade “owns” components of the four basic math operations and each grade level builds on the skills from the previous year and allows students opportunities to move beyond that grade level’s expectations. At the beginning of each school year, teachers talk about how well-prepared the children are with knowing their basic math facts. Goals have steadily increased in rigor based on student progress each year in surpassing set goals. As in reading, our teachers also incorporate daily small, flexible math groups that are formed and served based on the same criteria as the Reading small groups. Science and Social Studies at Tigerville do not take a back seat to the core Reading/ELA/Math curricula. The curriculum foundations described above apply to both of these disciplines as well. In the area of Social Studies, field trips and in-house speakers support content. Other extensions of this curriculum include Career Day, Veterans’ Day, and numerous community-based food/toy drives that directly correlate with our district’s G+ Graduation Career Cluster and College Readiness initiative. The curriculum foundations have further support through the integration of informational and literary text units, novel studies, articles, electronic research, and leveled texts. Interactive notebooking in both Science and Social Studies provides opportunities for our students to respond to the standards and indicators of both disciplines. Science’s curriculum foundations are extended and supported through field trips to Greenville’s Roper Mountain Science Center, science lab experiences for fourth and fifth grades, hands-on experiments, and project-based learning experiences. District science kits provide our teachers and students with experiments, lesson plans, resources and assessments for each unit of study. Gifted and Talented students (grades 3-5) participate in STEAM/STEM project-based learning experiences that support both the Social Studies and Science curriculums for these grade levels. The foundation of our 4K program focuses on building background knowledge for our students through immersion of language and concepts of print. This immersion takes the form of a print-rich classroom environment and ongoing opportunities for students to explore words through the use of pictures and books. This curriculum focuses on the whole child by further immersing our students in real-world opportunities known as learning centers. Through these centers, students practice how to interact socially while learning academically. This classroom prepares our students with the background knowledge and the stamina needed for progression throughout the grade levels. Tigerville Elementary wanted to establish a school environment where everyone felt welcomed, respected, and loved. To foster this atmosphere, Tigerville began using the Love and Logic approach to behavior management. The premises of Love and Logic is to establish positive relationships between teachers and students and to shape responsible, agreeable, and accountable students.
Mission, Vision, and Beliefs
Mission

12
We will provide quality educational experiences tailored to meet the individual needs of students.
Vision
“Where Children Are At The Top!”
Beliefs
The curriculum must be:
Based on state and district standards
Developmentally appropriate and adaptive to student needs
Real World relevant
Instruction must include:
Current instructional tools and methodology
A variety of strategies
Adaptations for meeting individual student needs and learning styles
The assessment must be:
Reflective to guide future instruction
Considerate of diverse learning styles
Varied and developmentally appropriate
The environment must provide:
Physical and emotional safeness
A variety of field experiences
Opportunity for parent and community involvement and support
Data Analysis and Needs Assessment
The SDE School Report Card is the data source used for identifying Student Achievement Needs
Assessment. The school’s professional development plan is the data source used to identify the Teacher
and Administrator Quality Needs Assessment. School report card surveys found on the SDE website is
the data source used for the School Climate Needs Assessment analysis.

13
Action Plan
Performance Goal Area: Student Achievement* Teacher/Administrator Quality* School Climate (Parent Involvement, Safe and Healthy Schools, etc.)* (* required) District Priority Gifted and Talented Requires Gifted and Talented: Academic Gifted and Talented: Artistic Gifted and Talented: Social and Emotional 1 Academic Goal and 1 Additional Goal Gifted and Talented: Other
PERFORMANCE GOAL: 1 The percentage of students scoring Meets Expectations and Exceeds Expectations on SC READY ELA will increase from ___64__% in 2016-17 to __79___% in 2022-23.
Per SBE Regulation 43-261, measurable performance goals, written in five-year increments,
shall be developed to address the major areas of discrepancy found in the needs assessment in
key areas reported in the district and school report cards.
INTERIM PERFORMANCE GOAL: The percentage of students scoring Meets Expectations and Exceeds Expectations on SC READY ELA will increase by __3___% annually.
DATA SOURCE(s):
AVERAGE BASELINE
2018–19 2019–20 2020–21 2021–22 2022–23
SC READY ELA SC
READY test data file
% Meets Expectations and Exceeds Expectations
64% (2016-17)
School Projected
Elementary 67% 70% 73% 76% 79%
School Actual
Elementary
SC READY ELA SC
READY test data file
% Meets Expectations and Exceeds Expectations
49 (2016-17)
District Projected
Elementary 52 55 58 61 64

14
ACTION PLAN FOR STRATEGY #1: EVALUATION
ACTIVITY
TIMELINE (Start and End Dates)
PERSON RESPONSIBLE
ESTIMATED COST
FUNDING SOURCE
INDICATORS OF IMPLEMENTATION
1. Participate in a
Graduate course on
reading
comprehension
July
2018-
October
2018
Teachers No Cost N/A Lesson plans and
classroom
observations
2. Create a
vocabulary focus in
K5-2nd
grade
(Making Words)
August
2018-
June 2019
Teachers $300 District
funds
Lesson plans and
classroom
observations
3. Create higher level
standards based
questions using
Mastery Connect
August
2018-
June 2019
Teachers No Cost N/A Mastery Connect
reports, lesson
plans and
classroom
observations
4. Utilize IXL
program target
specific
skill/standards
August
2018-
June 2019
Teachers No Cost N/A IXL reports, lesson
plans and
classroom
observations
District Actual
Elementary

15
Performance Goal Area: Student Achievement* Teacher/Administrator Quality* School Climate (Parent Involvement, Safe and Healthy Schools, etc.)* (* required) District Priority Gifted and Talented Requires Gifted and Talented: Academic Gifted and Talented: Artistic Gifted and Talented: Social and Emotional 1 Academic Goal and 1 Additional Goal Gifted and Talented: Other
PERFORMANCE GOAL: 2 The percentage of students scoring Meets Expectations and Exceeds Expectations on SC READY Math will increase from _81____% in 2016-17 to _91_% in 2022-23.
INTERIM PERFORMANCE GOAL: The percentage of students scoring Meets Expectations and Exceeds Expectations on SC READY Math will increase by ___2__% annually.
DATA SOURCE(s):
AVERAGE BASELINE
2018–19 2019–20 2020–21 2021–22 2022–23
SC READY ELA SC
READY test data file
% Meets Expectations and Exceeds Expectations
_81%__ (2016-17)
School Projected
Elementary 83% 85% 87% 89% 91%
School Actual
Elementary
SC READY Math SC
READY test data file
% Meets Expectations and Exceeds Expectations
54 (2016-17)
District Projected
Elementary 57 60 63 66 69
District Actual
Elementary

16
ACTION PLAN FOR STRATEGY #1: EVALUATION
ACTIVITY
TIMELINE (Start and End Dates)
PERSON RESPONSIBLE
ESTIMATED COST
FUNDING SOURCE
INDICATORS OF IMPLEMENTATION
1. Continue with
implementation with
grade level fast facts
August
2018-
June 2019
Teachers No Cost N/A Fast fact goal sheet,
Lesson plans, and
classroom
observations
2. Utilize IXL
program target
specific
skill/standards
August
2018-
June 2019
Teachers No Cost N/A IXL reports, lesson
plans and
classroom
observations
3. Create higher level
standards based
questions using
Mastery Connect
August
2018-
June 2019
Teachers No Cost N/A Mastery Connect
reports, lesson
plans and
classroom
observations

17
Performance Goal Area: Student Achievement* Teacher/Administrator Quality* School Climate (Parent Involvement, Safe and Healthy Schools, etc.)* (* required) District Priority Gifted and Talented Requires Gifted and Talented: Academic Gifted and Talented: Artistic Gifted and Talented: Social and Emotional 1 Academic Goal and 1 Additional Goal Gifted and Talented: Other
PERFORMANCE GOAL: 3 The percentage of students scoring Meets Expectations and Exceeds Expectations on SCPASS Science will meet or exceed the state and federal accountability standard annually from 2018-19 through 2022-23.
INTERIM PERFORMANCE GOAL: The percentage of students scoring Meets Expectations and Exceeds Expectations on SCPASS Science will increase by _1__% annually.
DATA SOURCE(s):
AVERAGE BASELINE
2018–19 2019–20 2020–21 2021–22 2022–23
SCPASS Science
SCPASS test data file
Baseline will be
established in 2017-18
Grade 4 only
School Projected
Elementary 88% 89% 90% 91% 92%
School Actual
Elementary
SCPASS Science
SCPASS test data file
Baseline will be
established in 2017-18
Grade 4 only
District Projected
Elementary TBD TBD TBD TBD TBD
District Actual
Elementary
ACTION PLAN FOR STRATEGY #1: EVALUATION

18
ACTIVITY
TIMELINE (Start and End Dates)
PERSON RESPONSIBLE
ESTIMATED COST
FUNDING SOURCE
INDICATORS OF IMPLEMENTATION
1. Integrating content
leveled readers into
Guided Reading
groups
August
2018-
June 2019
Teachers $400 District
funds
Lesson plans and
classroom
observations
2. Utilize IXL
program target
specific
skill/standards
August
2018-
June 2019
Teachers No Cost N/A IXL reports, lesson
plans and
classroom
observations
3. Create higher level
standards based
questions using
Mastery Connect
August
2018-
June 2019
Teachers No Cost N/A Mastery Connect
reports, lesson
plans and
classroom
observations

19
Performance Goal Area: Student Achievement* Teacher/Administrator Quality* School Climate (Parent Involvement, Safe and Healthy Schools, etc.)* (* required) District Priority Gifted and Talented Requires Gifted and Talented: Academic Gifted and Talented: Artistic Gifted and Talented: Social and Emotional 1 Academic Goal and 1 Additional Goal Gifted and Talented: Other
PERFORMANCE GOAL: 4 The percentage of students scoring Meets Expectations and Exceeds Expectations on SCPASS Social Studies will meet or exceed the state and federal accountability standard from 2018-19 through 2022-23.
INTERIM PERFORMANCE GOAL: The percentage of students scoring Meets Expectations and Exceeds Expectations on SCPASS Social Studies will increase by __.5%__% annually.
DATA SOURCE(s):
AVERAGE BASELINE
2018–19 2019–20 2020–21 2021–22 2022–23
SCPASS Social
Studies SCPASS test
data file
Baseline will be
established in 2017-18
Grade 5 only
School Projected
Elementary 95.5% 96.0% 96.5% 97.0% 97.5%
School Actual
Elementary
SCPASS Social
Studies SCPASS test
data file
Baseline will be
established in 2017-18
Grade 5 only
District Projected
Elementary TBD TBD TBD TBD TBD
District Actual
Elementary

20
ACTION PLAN FOR STRATEGY #1: EVALUATION
ACTIVITY
TIMELINE (Start and End Dates)
PERSON RESPONSIBLE
ESTIMATED COST
FUNDING SOURCE
INDICATORS OF IMPLEMENTATION
1. Integrating content
leveled readers into
Guided Reading
groups
August
2018-
June 2019
Teachers $400 District
funds
lesson plans and
classroom
observations
2. Utilize IXL
program target
specific
skill/standards
August
2018-
June 2019
Teachers No Cost N/A IXL reports, lesson
plans and
classroom
observations
3. Create higher level
standards based
questions using
Mastery Connect
August
2018-
June 2019
Teachers No Cost N/A Mastery Connect
reports, lesson
plans and
classroom
observations

21
Performance Goal Area: Student Achievement* Teacher/Administrator Quality* School Climate (Parent Involvement, Safe and Healthy Schools, etc.)* (* required) District Priority Gifted and Talented Requires Gifted and Talented: Academic Gifted and Talented: Artistic Gifted and Talented: Social and Emotional 1 Academic Goal and 1 Additional Goal Gifted and Talented: Other
PERFORMANCE GOAL: 5 Annually increase learning outcomes for traditionally underperforming student demographic groups across the performance goals as measured by gap data for each standardized test (Hispanic – Hispanic/Latino, AA - Black/African-American, SWD - Disabled, LEP - Limited English Proficient, SIP - Students in Poverty).
INTERIM PERFORMANCE GOAL: Meet annual targets below.
DATA SOURCE(s):
AVERAGE BASELINE
2018–19 2019–20 2020–21 2021–22 2022–23
SC READY ELA SC
READY test data file
% Meets Expectations and Exceeds Expectations
__N/A (2016-17)
Annual Increase = __
Projected Hispanic
SC READY ELA SC
READY test data file
% Meets Expectations and Exceeds Expectations
N/A__ (2016-17)
Annual Increase = __
Actual Hispanic
SC READY ELA SC
READY test data file
% Meets Expectations and Exceeds Expectations
_N/A_ (2016-17)
Annual Increase = __
Projected AA
SC READY ELA SC
READY test data file
% Meets Expectations and Exceeds Expectations
N/A__ (2016-17)
Annual Increase = __
Actual AA
SC READY ELA SC
READY test data file
% Meets Expectations and Exceeds Expectations
__N/A (2016-17)
Annual Increase = __
Projected SWD

22
SC READY ELA SC
READY test data file
% Meets Expectations and Exceeds Expectations
_N/A_ (2016-17)
Annual Increase = __
Actual SWD
SC READY ELA SC
READY test data file
% Meets Expectations and Exceeds Expectations
_N/A_ (2016-17)
Annual Increase = __
Projected LEP
SC READY ELA SC
READY test data file
% Meets Expectations and Exceeds Expectations
N/A__ (2016-17)
Annual Increase = __
Actual LEP
SC READY ELA SC
READY test data file
% Meets Expectations and Exceeds Expectations
58% (2016-17)
Annual Increase = __
Projected SIP
SC READY ELA SC
READY test data file
% Meets Expectations and Exceeds Expectations
58% (2016-17)
Annual Increase = __
Actual SIP
SC READY Math SC
READY test data file
% Meets Expectations and Exceeds Expectations
__N/A _ (2016-17)
Annual Increase = __
Projected Hispanic
SC READY Math SC
READY test data file
% Meets Expectations and Exceeds Expectations
__N/A _ (2016-17)
Annual Increase = __
Actual Hispanic
SC READY Math SC
READY test data file
% Meets Expectations and Exceeds Expectations
___N/A (2016-17)
Annual Increase = __
Projected AA
SC READY Math SC
READY test data file
% Meets Expectations and Exceeds Expectations
__N/A _ (2016-17)
Annual Increase = __
Actual AA

23
SC READY Math SC
READY test data file
% Meets Expectations and Exceeds Expectations
__N/A _ (2016-17)
Annual Increase = __
Projected SWD
SC READY Math SC
READY test data file
% Meets Expectations and Exceeds Expectations
__N/A _ (2016-17)
Annual Increase = __
Actual SWD
SC READY Math SC
READY test data file
% Meets Expectations and Exceeds Expectations
__N/A _ (2016-17)
Annual Increase = __
Projected LEP
SC READY Math SC
READY test data file
% Meets Expectations and Exceeds Expectations
__N/A _ (2016-17)
Annual Increase = __
Actual LEP
SC READY Math SC
READY test data file
% Meets Expectations and Exceeds Expectations
78% (2016-17)
Annual Increase = __
Projected SIP
SC READY Math SC
READY test data file
% Meets Expectations and Exceeds Expectations
78% (2016-17)
Annual Increase = __
Actual SIP
SCPASS Science SCPASS
test data file
Baseline will be established
in 2017-18 Grades 4 only
Projected Hispanic
SCPASS Science SCPASS
test data file
Baseline will be established
in 2017-18 Grades 4 only
Actual Hispanic
SCPASS Science SCPASS
test data file
Baseline will be established
in 2017-18 Grades 4 only
Projected AA

24
SCPASS Science SCPASS
test data file
Baseline will be established
in 2017-18 Grades 4 only
Actual AA
SCPASS Science SCPASS
test data file
Baseline will be established
in 2017-18 Grades 4 only
Projected SWD
SCPASS Science SCPASS
test data file
Baseline will be established
in 2017-18 Grades 4 only
Actual SWD
SCPASS Science SCPASS
test data file
Baseline will be established
in 2017-18 Grades 4 only
Projected LEP
SCPASS Science SCPASS
test data file
Baseline will be established
in 2017-18 Grades 4 only
Actual LEP
SCPASS Science SCPASS
test data file
Baseline will be established
in 2017-18 Grades 4 only
Projected SIP
SCPASS Science SCPASS
test data file
Baseline will be established
in 2017-18 Grades 4 only
Actual SIP
SCPASS Social
Studies SCPASS
test data file
Baseline will be established
in 2017-18 Grades 5 only
Projected Hispanic
SCPASS Social
Studies SCPASS
test data file
Baseline will be established
in 2017-18 Grades 5 only
Actual Hispanic

25
SCPASS Social
Studies SCPASS
test data file
Baseline will be established
in 2017-18 Grades 5 only
Projected AA
SCPASS Social
Studies SCPASS
test data file
Baseline will be established
in 2017-18 Grades 5 only
Actual AA
SCPASS Social
Studies SCPASS
test data file
Baseline will be established
in 2017-18 Grades 5 only
Projected SWD
SCPASS Social
Studies SCPASS
test data file
Baseline will be established
in 2017-18 Grades 5 only
Actual SWD
SCPASS Social
Studies SCPASS
test data file
Baseline will be established
in 2017-18 Grades 5 only
Projected LEP
SCPASS Social
Studies SCPASS
test data file
Baseline will be established
in 2017-18 Grades 5 only
Actual LEP
SCPASS Social
Studies SCPASS
test data file
Baseline will be established
in 2017-18 Grades 5 only
Projected SIP
SCPASS Social
Studies SCPASS
test data file
Baseline will be established
in 2017-18 Grades 5 only
Actual SIP
ACTION PLAN FOR STRATEGY #1: EVALUATION
ACTIVITY
TIMELINE (Start and End Dates)
PERSON RESPONSIBLE
ESTIMATED COST
FUNDING SOURCE
INDICATORS OF IMPLEMENTATION

26
ACTION PLAN FOR STRATEGY #1: EVALUATION
ACTIVITY
TIMELINE (Start and End Dates)
PERSON RESPONSIBLE
ESTIMATED COST
FUNDING SOURCE
INDICATORS OF IMPLEMENTATION
1. Provide early
morning classroom
enrichment
August
2018-
June 2019
Teachers No Cost N/A Classroom
observations
2. Provide
afterschool tutorial
for ELA and math
August
2018-
June 2019
Teachers as
needed
$3000 Flex
allocation
funds
Attendance records,
pre- and post-
assessment

27
Performance Goal Area: Student Achievement* Teacher/Administrator Quality* School Climate (Parent Involvement, Safe and Healthy Schools, etc.)* (* required) District Priority Gifted and Talented Requires Gifted and Talented: Academic Gifted and Talented: Artistic Gifted and Talented: Social and Emotional 1 Academic Goal and 1 Additional Goal Gifted and Talented: Other
PERFORMANCE GOAL: 6 Annually increase the percentage of K-5 students reading on grade level as defined by Fountas and Pinnell, FastBridge, MAP, and other measures.
INTERIM PERFORMANCE GOAL: Meet annual targets below.
DATA SOURCE(s):
AVERAGE BASELINE
2018–19 2019–20 2020–21 2021–22 2022–23
Fountas and Pinnell
73%
School Projected
TBD TBD TBD TBD TBD
School Actual
FastBridge 64% School
Projected TBD TBD TBD TBD TBD
School Actual
MAP 69% School
Projected TBD TBD TBD TBD TBD
School Actual

28
Fountas and Pinnell
TBD
District Projected
TBD TBD TBD TBD TBD
District Actual
FastBridge TBD District
Projected TBD TBD TBD TBD TBD
District Actual
MAP TBD District
Projected TBD TBD TBD TBD TBD
District Actual
ACTION PLAN FOR STRATEGY #1: EVALUATION
ACTIVITY
TIMELINE (Start and End Dates)
PERSON RESPONSIBLE
ESTIMATED COST
FUNDING SOURCE
INDICATORS OF IMPLEMENTATION
1. Participate in a
Graduate course on
reading
comprehension
July
2018-
October
2018
Teachers No Cost N/A Lesson plans and
classroom
observations
2. Create a
vocabulary focus in
K5-2nd
grade
August
2018-
June 2019
Teachers $300 District
funds
Lesson plans and
classroom
observations

29
ACTION PLAN FOR STRATEGY #1: EVALUATION
ACTIVITY
TIMELINE (Start and End Dates)
PERSON RESPONSIBLE
ESTIMATED COST
FUNDING SOURCE
INDICATORS OF IMPLEMENTATION
(Making Words)
3. Create higher level
standards based
questions using
Mastery Connect
August
2018-
June 2019
Teachers No Cost N/A Mastery Connect
reports, lesson
plans and
classroom
observations
4. Utilize IXL
program target
specific
skill/standards
August
2018-
June 2019
Teachers No Cost N/A IXL reports, lesson
plans and
classroom
observations
Performance Goal Area: Student Achievement* Teacher/Administrator Quality* School Climate (Parent Involvement, Safe and Healthy Schools, etc.)* (* required) District Priority Gifted and Talented Requires Gifted and Talented: Academic Gifted and Talented: Artistic Gifted and Talented: Social and Emotional 1 Academic Goal and 1 Additional Goal Gifted and Talented: Other
PERFORMANCE GOAL: 1 The school will have qualified, diverse teachers (gender and ethnicity) by 2023.
INTERIM PERFORMANCE GOAL: Meet annual targets below.
DATA SOURCE(s):
AVERAGE BASELINE
2018–19 2019–20 2020–21 2021–22 2022–23
Employment report
0% of
diverse
teachers
2017-18
School Projected
TBD TBD TBD TBD TBD

30
School Actual
Employment report
% of
diverse
teachers
2017-18
District Projected
TBD TBD TBD TBD TBD
District Actual
ACTION PLAN FOR STRATEGY #1: EVALUATION
ACTIVITY
TIMELINE (Start and End Dates)
PERSON RESPONSIBLE
ESTIMATED COST
FUNDING SOURCE
INDICATORS OF IMPLEMENTATION
1. Actively recruit
diverse teachers at
Shinning Stars
July
2018-
October
2018
Teachers No Cost N/A Lesson plans and
classroom
observations

31
Performance Goal Area: Student Achievement* Teacher/Administrator Quality* School Climate (Parent Involvement, Safe and Healthy Schools, etc.)* (* required) District Priority Gifted and Talented Requires Gifted and Talented: Academic Gifted and Talented: Artistic Gifted and Talented: Social and Emotional 1 Academic Goal and 1 Additional Goal Gifted and Talented: Other
PERFORMANCE GOAL: 1 Achieve and maintain a rate of 90% among parents, students, and teachers who agree or strongly agree that they feel safe during the school day on the South Carolina Department of Education Survey.
INTERIM PERFORMANCE GOAL: Meet annual targets below.
DATA SOURCE(s):
AVERAGE BASELINE
2018–19 2019–20 2020–21 2021–22 2022–23
SDE School Report Card
Survey
97% School
Projected Students
≥ 90 ≥ 90 ≥ 90 ≥ 90 ≥ 90
School Actual
Students
100% School
Projected Teachers
≥ 90 ≥ 90 ≥ 90 ≥ 90 ≥ 90
School Actual
Teachers
89% School
Projected Parents
≥ 90 ≥ 90 ≥ 90 ≥ 90 ≥ 90

32
School Actual
Parents
SDE School Report Card
Survey
91 District
Projected Students
≥ 90 ≥ 90 ≥ 90 ≥ 90 ≥ 90
District Actual
Students
94 District
Projected Teachers
≥ 90 ≥ 90 ≥ 90 ≥ 90 ≥ 90
District Actual
Teachers
88 District
Projected Parents
≥ 90 ≥ 90 ≥ 90 ≥ 90 ≥ 90
District Actual
Parents
ACTION PLAN FOR STRATEGY #1: EVALUATION
ACTIVITY
TIMELINE (Start and End Dates)
PERSON RESPONSIBLE
ESTIMATED COST
FUNDING SOURCE
INDICATORS OF IMPLEMENTATION
1. Ensure the Ignore
the Door policy
followed
July
2018-
October
All staff and
students
No Cost N/A Observations

33
ACTION PLAN FOR STRATEGY #1: EVALUATION
ACTIVITY
TIMELINE (Start and End Dates)
PERSON RESPONSIBLE
ESTIMATED COST
FUNDING SOURCE
INDICATORS OF IMPLEMENTATION
2018
2. Frequent walks
through the building
by administrators
July
2018-
October
2018
Administrators No Cost N/A Observations
3. Ensure all guests
and visitors have
badges
July
2018-
October
2018
All staff No Cost N/A Observations

34
Performance Goal Area: Student Achievement* Teacher/Administrator Quality* School Climate (Parent Involvement, Safe and Healthy Schools, etc.)* (* required) District Priority Gifted and Talented Requires Gifted and Talented: Academic Gifted and Talented: Artistic Gifted and Talented: Social and Emotional 1 Academic Goal and 1 Additional Goal Gifted and Talented: Other
PERFORMANCE GOAL: 2 The school will proactively address student behavior so the percentage of students recommended for expulsion each year is maintained at less than 1% of the total student population. PERFORMANCE GOAL: 3 The school will continue to contribute to a safe school environment and positively impact student behavior as indicated by an annual expulsion rate of less than .07 %.
INTERIM PERFORMANCE GOAL: Meet annual targets below.
Percent Recommended for Expulsion
DATA SOURCE(s):
AVERAGE BASELINE
2018–19 2019–20 2020–21 2021–22 2022–23
ESSA Federal Accountability and SDE School
Report Card
(2016-17) 0
School Projected
≤1.0 ≤1.0 ≤1.0 ≤1.0 ≤1.0
School Actual
ESSA Federal Accountability and SDE School
Report Card
(2016-17) 0.7
District Projected
≤1.0 ≤1.0 ≤1.0 ≤1.0 ≤1.0
District Actual
Annual Expulsion Rate

35
DATA SOURCE(s):
AVERAGE BASELINE
2018–19 2019–20 2020–21 2021–22 2022–23
ESSA Federal Accountability and SDE School
Report Card
(2016-17) 0
School Projected
≤ .07 ≤ .07 ≤ .07 ≤ .07 ≤ .07
School Actual
ESSA Federal Accountability and SDE School
Report Card
(2016-17)
District Projected
≤ .07 ≤ .07 ≤ .07 ≤ .07 ≤ .07
District Actual
ACTION PLAN FOR STRATEGY #1: EVALUATION
ACTIVITY
TIMELINE (Start and End Dates)
PERSON RESPONSIBLE
ESTIMATED COST
FUNDING SOURCE
INDICATORS OF IMPLEMENTATION
1. Employ Love and
Logic
July
2018-
October
2018
All Staff No Cost N/A Discipline Reports
Performance Goal Area: Student Achievement* Teacher/Administrator Quality* School Climate (Parent Involvement, Safe and Healthy Schools, etc.)* (* required) District Priority Gifted and Talented Requires Gifted and Talented: Academic Gifted and Talented: Artistic Gifted and Talented: Social and Emotional 1 Academic Goal and 1 Additional Goal Gifted and Talented: Other

36
PERFORMANCE GOAL: 4 The school will demonstrate a caring environment as indicated by an increase in the percent of elementary students who describe their teacher as caring on the AdvancED Culture and Climate Survey.
INTERIM PERFORMANCE GOAL: Meet annual targets below.
DATA SOURCE(s):
AVERAGE BASELINE
2018–19 2019–20 2020–21 2021–22 2022–23
AdvancED Culture & Climate Surveys
94% School
Projected
School Actual
AdvancED Culture & Climate Surveys
89 District
Projected 90 90 90 90 90
District Actual
ACTION PLAN FOR STRATEGY #1: EVALUATION
ACTIVITY
TIMELINE (Start and End Dates)
PERSON RESPONSIBLE
ESTIMATED COST
FUNDING SOURCE
INDICATORS OF IMPLEMENTATION
1. Employ Love and
Logic
July
2018-
October
All Staff No Cost N/A Observations and
discipline reports
37
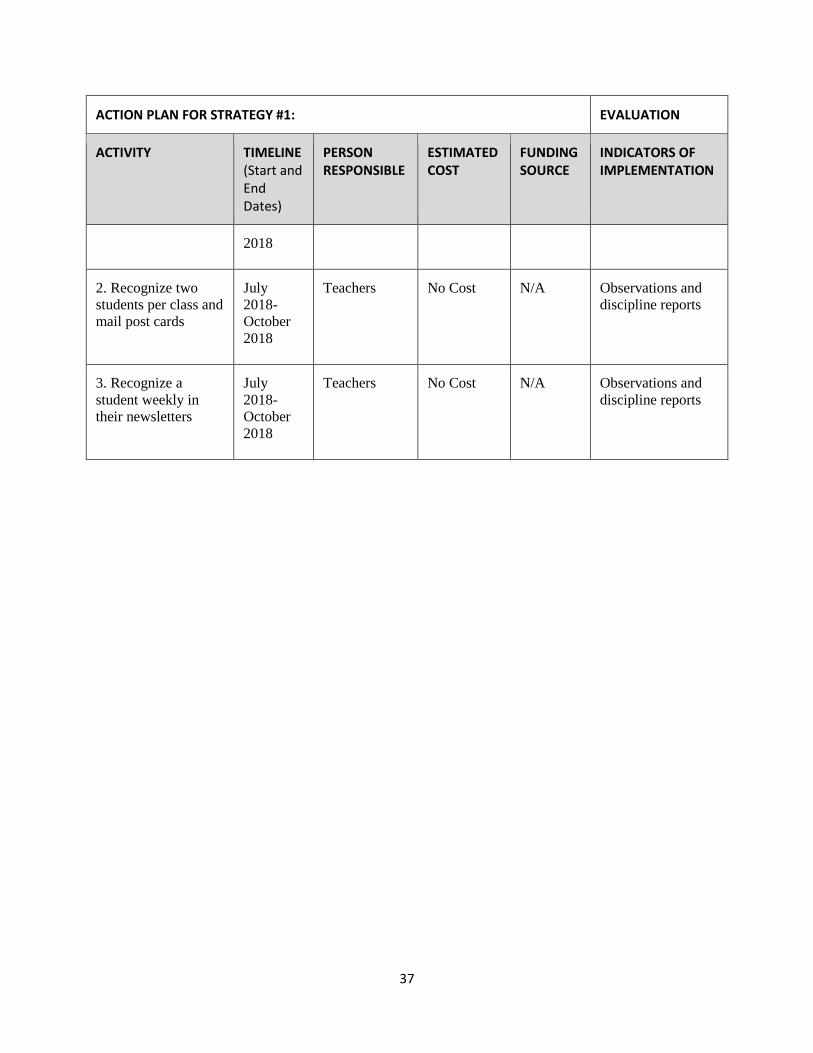
ACTION PLAN FOR STRATEGY #1: EVALUATION
ACTIVITY
TIMELINE (Start and End Dates)
PERSON RESPONSIBLE
ESTIMATED COST
FUNDING SOURCE
INDICATORS OF IMPLEMENTATION
2018
2. Recognize two
students per class and
mail post cards
July
2018-
October
2018
Teachers No Cost N/A Observations and
discipline reports
3. Recognize a
student weekly in
their newsletters
July
2018-
October
2018
Teachers No Cost N/A Observations and
discipline reports

38
Performance Goal Area: Student Achievement* Teacher/Administrator Quality* School Climate (Parent Involvement, Safe and Healthy Schools, etc.)* (* required) District Priority Gifted and Talented Requires Gifted and Talented: Academic Gifted and Talented: Artistic Gifted and Talented: Social and Emotional 1 Academic Goal and 1 Additional Goal Gifted and Talented: Other
PERFORMANCE GOAL: 5 Achieve and maintain a student attendance rate of 95% or higher.
INTERIM PERFORMANCE GOAL: Maintain an annual student attendance rate of 95% or higher.
DATA SOURCE(s):
AVERAGE BASELINE
2018–19 2019–20 2020–21 2021–22 2022–23
ESSA Federal Accountability and SDE School
Report Card
(2016-17) 95%
School Projected
School Actual
(2016-17)
95
District Projected
95 95 95 95 95
District Actual
ACTION PLAN FOR STRATEGY #1: EVALUATION

39
ACTIVITY
TIMELINE (Start and End Dates)
PERSON RESPONSIBLE
ESTIMATED COST
FUNDING SOURCE
INDICATORS OF IMPLEMENTATION
1. Make daily contact
with absent students
August
2018-
June 2019
Attendance
clerk
No Cost N/A Attendance log
2. Recognition at
monthly assembly for
class with the highest
attendance
August
2018-
June 2019
Diane Jackson No Cost N/A Pictures and
bulletin board

40
Performance Goal Area: Student Achievement* Teacher/Administrator Quality* School Climate (Parent Involvement, Safe and Healthy Schools, etc.)* (* required) District Priority Gifted and Talented Requires Gifted and Talented: Academic Gifted and Talented: Artistic Gifted and Talented: Social and Emotional 1 Academic Goal and 1 Additional Goal Gifted and Talented: Other
PERFORMANCE GOAL: 6 The school will create and sustain an environment that supports mental and social/emotional health, as indicated by an annual decrease in the percent of elementary students who, on the AdvancED Climate and Culture Survey, report feeling afraid, lonely, or angry while they are at school.
INTERIM PERFORMANCE GOAL: Meet annual targets below.
DATA SOURCE(s):
AVERAGE BASELINE
2018–19 2019–20 2020–21 2021–22 2022–23
AdvancED Culture & Climate Surveys
Afraid – 2% Lonely –
13% Angry –
10%
School Projected
Afraid ≤ Lonely ≤ Angry ≤
Afraid ≤ Lonely ≤ Angry ≤
Afraid ≤ Lonely ≤ Angry ≤
Afraid ≤ Lonely ≤ Angry ≤
Afraid ≤ Lonely ≤ Angry ≤
School Actual
Afraid ≤ Lonely ≤ Angry ≤
Afraid ≤ Lonely ≤ Angry ≤
Afraid ≤ Lonely ≤ Angry ≤
Afraid ≤ Lonely ≤ Angry ≤
Afraid ≤ Lonely ≤ Angry ≤
AdvancED Culture & Climate Surveys
Afraid – 5% Lonely –
10% Angry – 8%
District Projected
Afraid ≤ 5 Lonely ≤
9 Angry ≤ 7
Afraid ≤ 5
Lonely ≤ 9
Angry ≤ 7
Afraid ≤ 5
Lonely ≤ 8
Angry ≤ 6
Afraid ≤ 5
Lonely ≤ 8
Angry ≤ 6
Afraid ≤ 5
Lonely ≤ 7
Angry ≤ 5
District Actual
Afraid ≤ Lonely ≤ Angry ≤
Afraid ≤ Lonely ≤ Angry ≤
Afraid ≤ Lonely ≤ Angry ≤
Afraid ≤ Lonely ≤ Angry ≤
Afraid ≤ Lonely ≤ Angry ≤
ACTION PLAN FOR STRATEGY #1: EVALUATION

41
ACTIVITY
TIMELINE (Start and End Dates)
PERSON RESPONSIBLE
ESTIMATED COST
FUNDING SOURCE
INDICATORS OF IMPLEMENTATION
1. Employ Love and
Logic
July
2018-
October
2018
All Staff No Cost N/A Observations and
discipline reports
2. Provide whole
group and small
group guidance
lessons
July
2018-
October
2018
Guidance
Counselor
No Cost N/A Observations,
lesson plans, and
survey results
3. Provide small
group and individual
guidance sessions
targeting specific
needs
July
2018-
October
2018
Guidance
Counselor
No Cost N/A Observations,
lesson plans, and
survey results