Strategic Plan - Greenville County School District
101
STERLING SCHOOL CHARLES TOWNES CENTER STERLING ELEMENTARY PROGRAM 99 JOHN MCCARROLL WAY GREENVILLE, SOUTH CAROLINA 29607 864.355.4480 864.355.4490 www.greenville.k12.sc.us/sterling Serving students in grades 4k-8 th Grade David M. Johnstone, Principal School District of Greenville County Dr. Phinnize Fisher, Superintendent 2008-2013 Revised Spring 2012
Transcript of Strategic Plan - Greenville County School District
STERLING SCHOOL CHARLES TOWNES CENTER
STERLING ELEMENTARY PROGRAM
99 JOHN MCCARROLL WAY GREENVILLE, SOUTH CAROLINA 29607
864.355.4480 864.355.4490
www.greenville.k12.sc.us/sterling
Serving students in grades 4k-8th Grade David M. Johnstone, Principal
School District of Greenville County Dr. Phinnize Fisher, Superintendent
2008-2013
Revised Spring 2012
SCHOOL RENEWAL PLANS
School Name Sterling School School Telephone 864-355-4480
School Address 99 John McCarroll Way
Greenville, South Carolina 29607
District Contact Jason McCreary Telephone 864-355-3368
E-mail: [email protected]
Assurances
The school renewal plan, or annual update of the of the school renewal plan, includes
components required by the Early Childhood Development and Academic Assistance Act of
1993 (Act 135) and the Education Accountability Act of 1998 (EAA) (S.C. Code Ann.
§§59-18-1300 and 59-139-10 et seq. (Supp. 2004)). The signatures of the chairperson of
the board of trustees, the superintendent, the principal, and the chairperson of the School
Improvement Council are affirmation of active participation of key stakeholders and
alignment with Act 135 and EAA requirements.
Required Printed Names and Signatures
Chairperson, Board of Trustees
Roger Meek ___________ ____________________ _______________
Printed Name Signature Date
Superintendent
Dr. Phinnize Fisher _____ ____________________ _______________
Printed Name Signature Date
School Principal
David Johnstone _______ ____________________ _______________
Printed Name Signature Date
Chairperson, School Improvement Council
Terrell Mills ___________ ____________________ _______________
Printed Name Signature Date

STAKEHOLDER INVOLVEMENT FOR SCHOOL PLANS
List the names of persons who were involved in the development of the
school renewal plan. A participant for each numbered category is required.
Position Name
1. Principal David M. Johnstone
2. Teacher Connie Gordon
3. Parent/Guardian Maurie Lawrence
4. Community Member Yvonne Reeder
5. School Improvement Council Terrell Mills
6. Others* (May include school board members, administrators School Improvement Council members, students, PTO
members, agency representatives, university partners,
etc.)
Position Name
Parent ________________ Kim Gibson ________________
Parent ________________ Carol Beard _______________
Parent ________________ Jeff Dishner _______________
Community Member _____ Jane Snyder _______________
Teacher _______________ Ashleigh Hambright _________
Teacher _______________ Linda Reynolds _____________
* REMINDER: If state or federal grant applications require representation by other stakeholder groups, it is appropriate to include additional
stakeholders to meet those requirements and to ensure that the plans are
aligned.
ASSURANCES FOR SCHOOL RENEWAL PLANS
(Mandated Component)
Act 135 Assurances
Assurances checked and signed by the principal, attest that the district complies with
all applicable Act 135 requirements.
Academic Assistance, PreK–3
The school makes special efforts to assist children in PreK–3 who
demonstrate a need for extra or alternative instructional attention (e.g.,
after-school homework help centers, individual tutoring, and group
remediation).
Academic Assistance, Grades 4–12
The school makes special efforts to assist children in grades 4–12 who
demonstrate a need for extra or alternative instructional attention (e.g.,
after-school homework help centers, individual tutoring, and group
remediation).
Parent Involvement
The school encourages and assists parents in becoming more involved in
their children’s education. Some examples of parent involvement initiatives
include making special efforts to meet with parents at times more
convenient for them, providing parents with their child’s individual test
results and an interpretation of the results, providing parents with
information on the district’s curriculum and assessment program, providing
frequent, two way communication between home and school, providing
parents an opportunity to participate on decision making groups, designating space in schools for parents to access educational resource
materials, including parent involvement expectations as part of the
principal’s and superintendent’s evaluations, and providing parents with
information pertaining to expectations held for them by the school system,
such as ensuring attendance and punctuality of their children.
Staff Development
The school provides staff development training for teachers and
administrators in the teaching techniques and strategies needed to
implement the district plan for the improvement of student academic
performance. The staff development program reflects requirements of Act
135, the EAA, and the National Staff Development Council’s revised
Standards for Staff Development.
Technology
The school integrates technology into professional development, curriculum
development, and classroom instruction to improve teaching and learning.
Innovation
The school uses innovation funds for innovative activities to improve student
learning and accelerate the performance of all students. Provide a good
example of the use of innovation funds.
Recruitment
The district makes special and intensive efforts to recruit and give priority
to serving those parents or guardians of children, ages birth through five
years, who are considered at-risk of school failure. “At-risk” children are
defined as those whose school readiness is jeopardized by any of, but not
limited to, the following personal or family situation(s): Educational level of
parent below high school graduation, poverty, limited English proficiency,
significant developmental delays, instability or inadequate basic capacity
within the home and/or family, poor health (physical, mental, emotional),
and/or child abuse and neglect.
Collaboration
The school (regardless of the grades served) collaborates with health and
human services agencies (e.g., county health departments, social services
departments, mental health departments, First Steps, and the family court
system).
Developmental Screening
The school ensures that the young child receives all services necessary for
growth and development. Instruments are used to assess physical, social,
emotional, linguistic, and cognitive developmental levels. This program
normally is appropriate at primary and elementary schools, although
screening efforts could take place at any location.
Half-Day Child Development
The school provides half-day child development programs for four-year-
olds (some districts fund full-day programs). The programs usually function
at primary and elementary schools, although they may be housed at
locations with other grade levels or completely separate from schools.
Developmentally Appropriate Curriculum for PreK–3
The school ensures that the scope and sequence of the curriculum for
PreK-3 are appropriate for the maturation levels of students. Instructional
practices accommodate individual differences in maturation level and take
into account the student's social and cultural context.
Parenting and Family Literacy
The school provides a four component program that integrates all of the
following activities: interactive literacy activities between parents and their
Children (Interactive Literacy Activities); training for parents regarding how
to be the primary teachers for their children and full partners in the
education of their children (parenting skills for adults, parent education);
parent literacy training that leads to economic self-sufficiency (adult
education); and an age-appropriated education to prepare children for
success in school and life experiences (early childhood education). Family
Literacy is not grade specific, but generally is most appropriate for parents
of children at the primary and elementary school levels and below, and for
secondary school students who are parents. Family Literacy program goals
are to strengthen parent involvement in the learning process of preschool
children ages birth through five years; promote school readiness of
preschool children; offer parents special opportunities to improve their
literacy skills and education, a chance to recover from dropping out of
school; and identify potential developmental delays in preschool children by
offering developmental screening.
Coordination of Act 135 Initiatives with Other Federal, State, and
District Programs
The district ensures as much program effectiveness as possible by
developing a district wide/school wide coordinated effort among all
programs and funding. Act 135 initiatives are coordinated with programs
such as Head Start, First Steps, Title I, and programs for students with
disabilities.
____________________________________ ______________________
Signature of Superintendent Date
____________________________________ ______________________
Signature of Principal Date
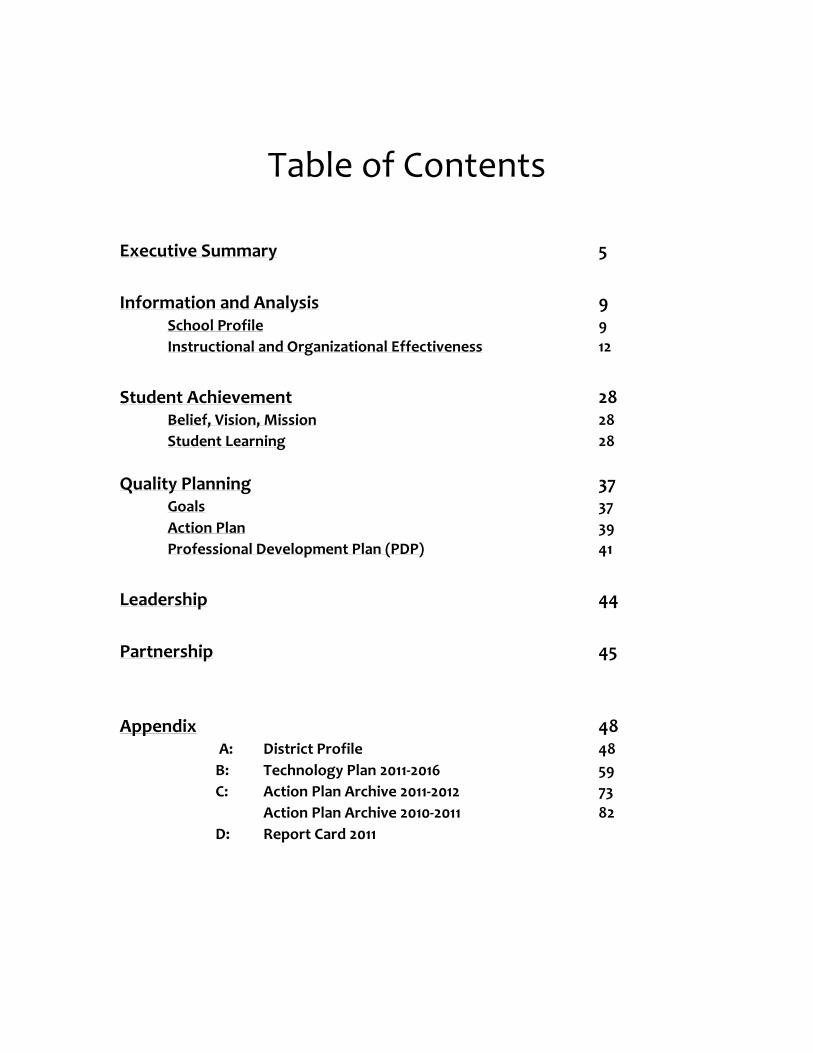
Table of Contents
Executive Summary 5
Information and Analysis 9 School Profile 9
Instructional and Organizational Effectiveness 12 Student Achievement 28 Belief, Vision, Mission 28
Student Learning 28
Quality Planning 37 Goals 37
Action Plan 39 Professional Development Plan (PDP) 41
Leadership 44
Partnership 45
Appendix 48
A: District Profile 48
B: Technology Plan 2011-2016 59
C: Action Plan Archive 2011-2012 73
Action Plan Archive 2010-2011 82
D: Report Card 2011
Strategic Planning Guide Page-5 Sterling School Portfolio
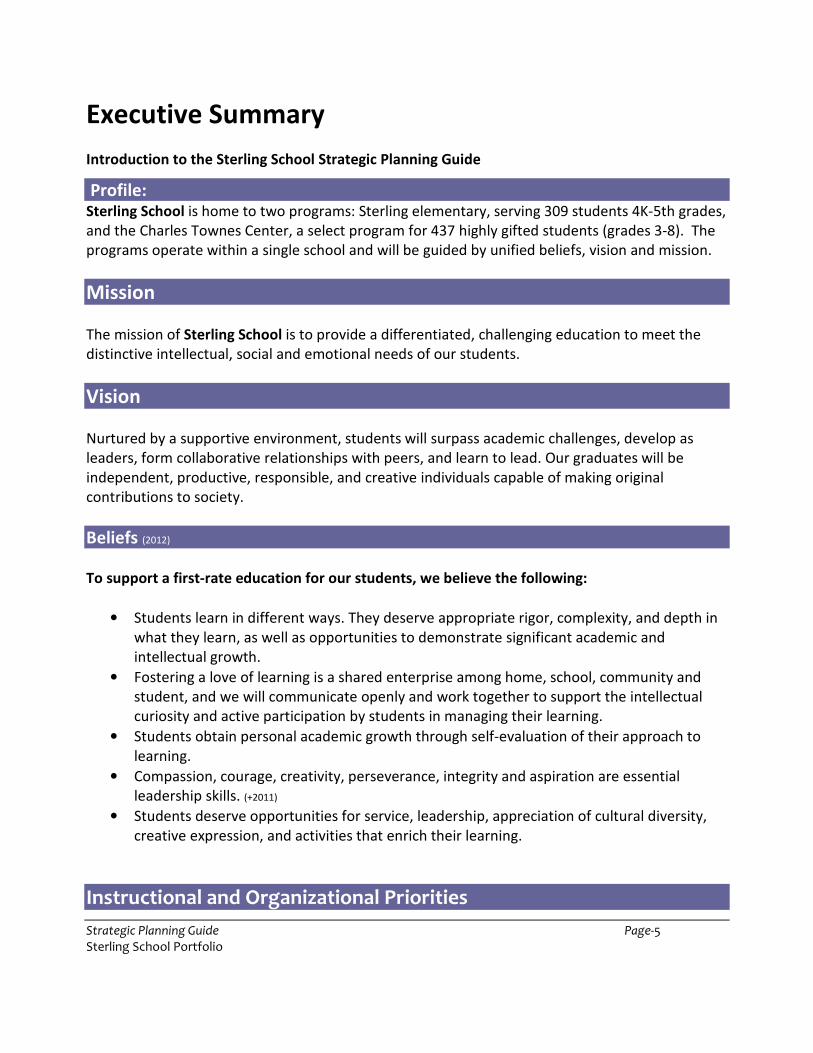
Executive Summary
Introduction to the Sterling School Strategic Planning Guide Profile: Sterling School is home to two programs: Sterling elementary, serving 309 students 4K-5th grades,
and the Charles Townes Center, a select program for 437 highly gifted students (grades 3-8). The
programs operate within a single school and will be guided by unified beliefs, vision and mission.
Mission
The mission of Sterling School is to provide a differentiated, challenging education to meet the
distinctive intellectual, social and emotional needs of our students.
Vision
Nurtured by a supportive environment, students will surpass academic challenges, develop as
leaders, form collaborative relationships with peers, and learn to lead. Our graduates will be
independent, productive, responsible, and creative individuals capable of making original
contributions to society.
Beliefs (2012) To support a first-rate education for our students, we believe the following:
• Students learn in different ways. They deserve appropriate rigor, complexity, and depth in
what they learn, as well as opportunities to demonstrate significant academic and
intellectual growth.
• Fostering a love of learning is a shared enterprise among home, school, community and
student, and we will communicate openly and work together to support the intellectual
curiosity and active participation by students in managing their learning.
• Students obtain personal academic growth through self-evaluation of their approach to
learning.
• Compassion, courage, creativity, perseverance, integrity and aspiration are essential
leadership skills. (+2011)
• Students deserve opportunities for service, leadership, appreciation of cultural diversity,
creative expression, and activities that enrich their learning.
Instructional and Organizational Priorities
Strategic Planning Guide Page-6 Sterling School Portfolio
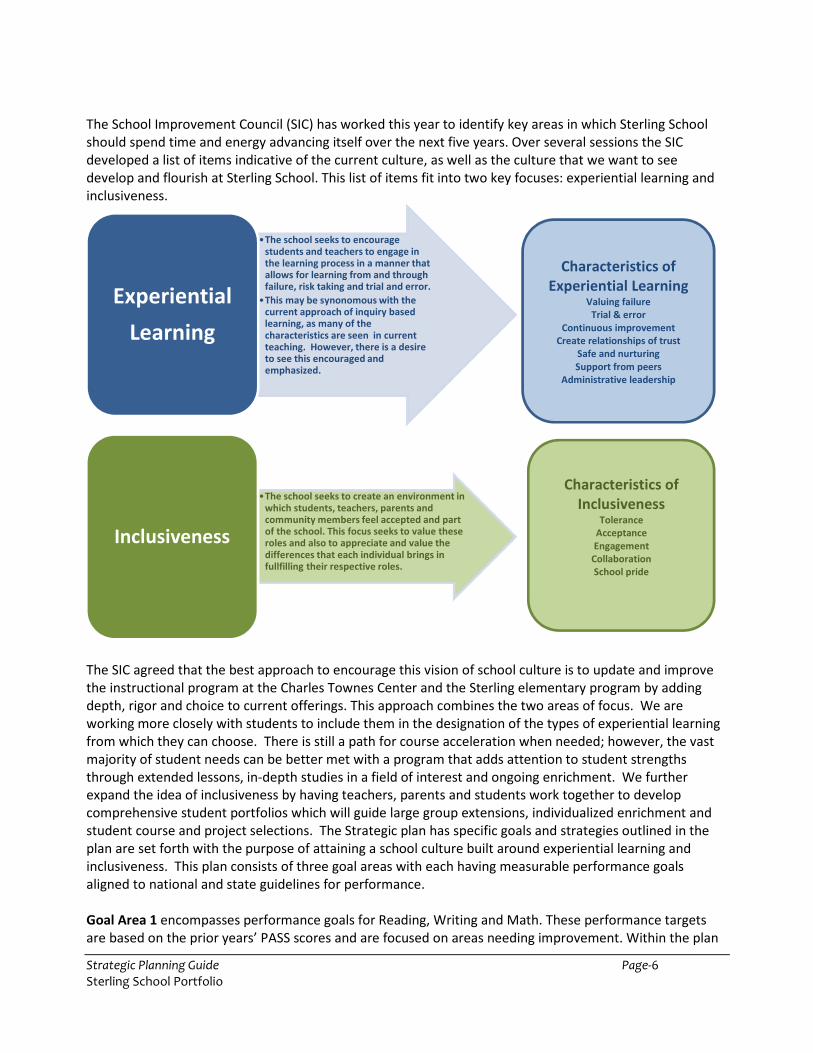
The School Improvement Council (SIC) has worked this year to identify key areas in which Sterling School
should spend time and energy advancing itself over the next five years. Over several sessions the SIC
developed a list of items indicative of the current culture, as well as the culture that we want to see
develop and flourish at Sterling School. This list of items fit into two key focuses: experiential learning and
inclusiveness.
The SIC agreed that the best approach to encourage this vision of school culture is to update and improve
the instructional program at the Charles Townes Center and the Sterling elementary program by adding
depth, rigor and choice to current offerings. This approach combines the two areas of focus. We are
working more closely with students to include them in the designation of the types of experiential learning
from which they can choose. There is still a path for course acceleration when needed; however, the vast
majority of student needs can be better met with a program that adds attention to student strengths
through extended lessons, in-depth studies in a field of interest and ongoing enrichment. We further
expand the idea of inclusiveness by having teachers, parents and students work together to develop
comprehensive student portfolios which will guide large group extensions, individualized enrichment and
student course and project selections. The Strategic plan has specific goals and strategies outlined in the
plan are set forth with the purpose of attaining a school culture built around experiential learning and
inclusiveness. This plan consists of three goal areas with each having measurable performance goals
aligned to national and state guidelines for performance.
Goal Area 1 encompasses performance goals for Reading, Writing and Math. These performance targets
are based on the prior years’ PASS scores and are focused on areas needing improvement. Within the plan
•The school seeks to encourage students and teachers to engage in the learning process in a manner that allows for learning from and through failure, risk taking and trial and error.
•This may be synonomous with the current approach of inquiry based learning, as many of the characteristics are seen in current teaching. However, there is a desire to see this encouraged and emphasized.
Experiential
Learning
•The school seeks to create an environment in which students, teachers, parents and community members feel accepted and part of the school. This focus seeks to value these roles and also to appreciate and value the differences that each individual brings in fullfilling their respective roles.
Inclusiveness
Characteristics of
Experiential Learning Valuing failure
Trial & error
Continuous improvement
Create relationships of trust
Safe and nurturing
Support from peers
Administrative leadership
Characteristics of
Inclusiveness Tolerance
Acceptance
Engagement
Collaboration
School pride

Strategic Planning Guide Page-7 Sterling School Portfolio
found in this document, interim performance goals further target additional areas of improvement. (See
page 37) You may notice in this goal area that Sterling elementary is designated rather than Sterling
School. Sterling elementary indicates elementary students in grades 3rd-5th not in the Charles Townes
Center. This designation is due to the extremely high number of Charles Townes students who score
exemplary in English Language Arts, Writing and Math.
Strategies:
• Develop periodic school-wide enrichment and extensions for all students based on individual student
interests and aptitude.
• Develop and implement extensions and/or acceleration for identified individual students based on
strengths in subject or concept, regardless of grade.
• Rewrite & modify our current instructional program & assessments: specifically Middle School and Math.
• Continue to develop and review the program of study for the Sterling Elementary Program.
The development of school-wide and individual enrichment and acceleration addresses expanding the
experiential nature and focus of our school at the individual level. Inclusiveness will be addressed as well by
considering individual student interests and addressing them directly. Teachers and administrators will
continue to refine, rewrite and expand the inquiry-based units of the Sterling Program and the course
selections at the middle school level.
Goal Area 2 addresses the need for quality staff. The Sterling School vision requires extensive training for
teachers and staff members. All teachers in both programs have or will have Gifted and Talented
certification and every staff member will receive extensive diversity training. This area defines the school-
wide professional development for the year as well.
Strategies:
• Develop electronic student portfolios.
• Redevelop middle school courses and intermediate to middle math.
• Develop and implement a school-wide enrichment program.
Goal Area 1: Raise the Academic Challenge and Performance of Each
Student. PERFORMANCE GOALS
• The percentage of Sterling elementary students scoring Met and Exemplary on the PASS English
Language Arts test will increase from 71% to 76% in the 2012-2013 school year. The mean score of
Sterling elementary students will increase from 644 to 650.
• The percentage of Sterling elementary students (5th grade) scoring Met and Exemplary on the PASS
Writing test will be 77% in the 2012-2013 school year.
• The percentage of Sterling elementary students scoring Met and Exemplary on the PASS Math test
will increase from 76% to 81% in the 2012-2013 school year. . The mean score of Sterling
elementary students will increase from 642-648.
•
Goal Area 2: Insure Quality Personnel in All Positions PERFORMANCE GOAL:
• All personnel will be highly qualified and specialized through 2012-13.
Strategic Planning Guide Page-8 Sterling School Portfolio
Goal Area 3: Provide a School Environment Supportive of Learning PERFORMANCE GOAL:
• Maintain or exceed 85% approval rating from students, parents and teachers on the State Report Card
Survey.
• Implement and support the CATCH program.
• Continue diversity training.
• Continue intra-staff sharing of best practices.
• Continue cross-grade and cross-program observations by teachers.
The goals in this area are supported by national and state guidelines defining quality personnel. The
strategies in this area are designed to support the two areas of focus in developing the school culture and
are integral to implementing the strategies in Goal Areas 1 and 3.
Goal Area 3 addresses school climate. This goal area is very important at Sterling School and is directly
aligned with the focus of inclusiveness. Sterling School is a diverse school covering a wide range of ages and
student needs. Sterling School plays a critical role in the local community as well creates a community for
our parents from around the county. The strategies for meeting and maintaining this goal are designed to
identify and meet the needs of this diverse population.
Strategies: • Develop and implement parent workshops and orientations to address student developmental and
academic needs.
• Create a new family/student inclusion/orientation program.
• Re-develop parent-teacher conferencing to compliment the developing student portfolio.
• Offer diversity training for SIC and PTA members.
Accomplishments:
During the past four years, Sterling School has made significant progress. Professional development funds and school resources have been spent with school goals and objectives as key criteria. The school staff, PTA and School Improvement Council has been involved in the review and assessment of the Strategic Plan. We continue to make progress in addressing deficiencies and needs by implementing the Gifted Program and successfully developing the Sterling Elementary Program in grades 4K- 5. In 2011, ,Sterling School received the Gold Award for General Academic Performance and the Silver Award for Closing the Achievement Gap.
Strategic Planning Guide Page-9 Sterling School Portfolio
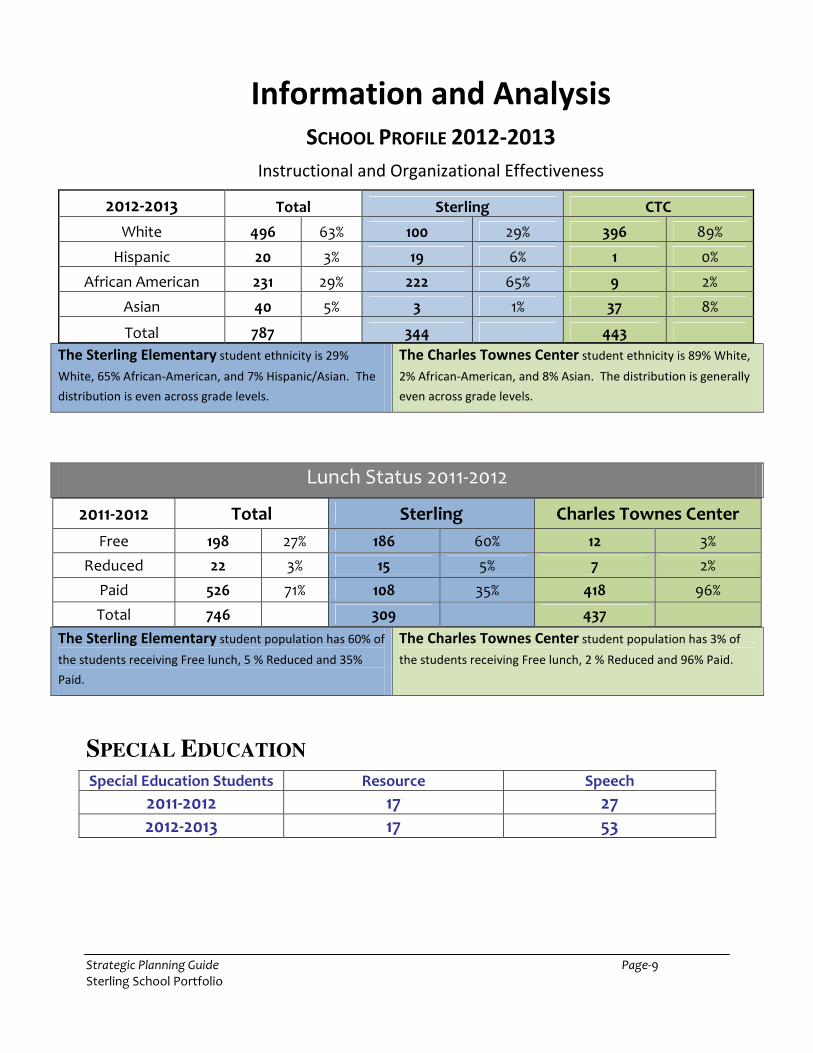
SPECIAL EDUCATION
Special Education Students Resource Speech
2011-2012 17 27
2012-2013 17 53
Information and Analysis
SCHOOL PROFILE 2012-2013
Instructional and Organizational Effectiveness
2012-2013 Total Sterling CTC
White 496 63% 100 29% 396 89%
Hispanic 20 3% 19 6% 1 0%
African American 231 29% 222 65% 9 2%
Asian 40 5% 3 1% 37 8%
Total 787 344 443
The Sterling Elementary student ethnicity is 29%
White, 65% African-American, and 7% Hispanic/Asian. The
distribution is even across grade levels.
The Charles Townes Center student ethnicity is 89% White,
2% African-American, and 8% Asian. The distribution is generally
even across grade levels.
Lunch Status 2011-2012
2011-2012 Total Sterling Charles Townes Center
Free 198 27% 186 60% 12 3%
Reduced 22 3% 15 5% 7 2%
Paid 526 71% 108 35% 418 96%
Total 746
309
437
The Sterling Elementary student population has 60% of
the students receiving Free lunch, 5 % Reduced and 35%
Paid.
The Charles Townes Center student population has 3% of
the students receiving Free lunch, 2 % Reduced and 96% Paid.
Strategic Planning Guide Page-10 Sterling School Portfolio
Attendance and Mobility
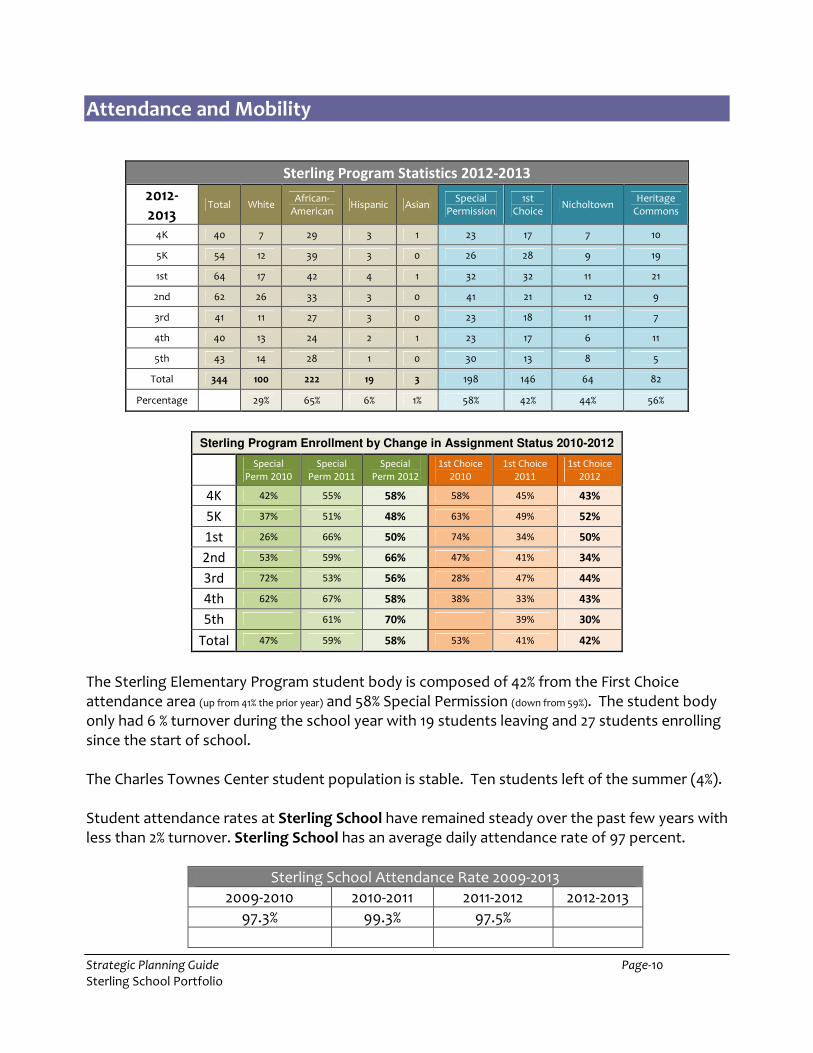
Sterling Program Statistics 2012-2013
2012-2013
Total White African-
American Hispanic Asian
Special Permission
1st Choice
Nicholtown Heritage
Commons
4K 40 7 29 3 1 23 17 7 10
5K 54 12 39 3 0 26 28 9 19
1st 64 17 42 4 1 32 32 11 21
2nd 62 26 33 3 0 41 21 12 9
3rd 41 11 27 3 0 23 18 11 7
4th 40 13 24 2 1 23 17 6 11
5th 43 14 28 1 0 30 13 8 5
Total 344 100 222 19 3 198 146 64 82
Percentage
29% 65% 6% 1% 58% 42% 44% 56%
Sterling Program Enrollment by Change in Assignment Status 2010-2012
Special
Perm 2010
Special
Perm 2011
Special
Perm 2012
1st Choice
2010
1st Choice
2011
1st Choice
2012
4K 42% 55% 58% 58% 45% 43%
5K 37% 51% 48% 63% 49% 52%
1st 26% 66% 50% 74% 34% 50%
2nd 53% 59% 66% 47% 41% 34%
3rd 72% 53% 56% 28% 47% 44%
4th 62% 67% 58% 38% 33% 43%
5th 61% 70% 39% 30%
Total 47% 59% 58% 53% 41% 42%
The Sterling Elementary Program student body is composed of 42% from the First Choice attendance area (up from 41% the prior year) and 58% Special Permission (down from 59%). The student body only had 6 % turnover during the school year with 19 students leaving and 27 students enrolling since the start of school. The Charles Townes Center student population is stable. Ten students left of the summer (4%). Student attendance rates at Sterling School have remained steady over the past few years with less than 2% turnover. Sterling School has an average daily attendance rate of 97 percent.
Sterling School Attendance Rate 2009-2013
2009-2010 2010-2011 2011-2012 2012-2013
97.3% 99.3% 97.5%
Strategic Planning Guide Page-11 Sterling School Portfolio
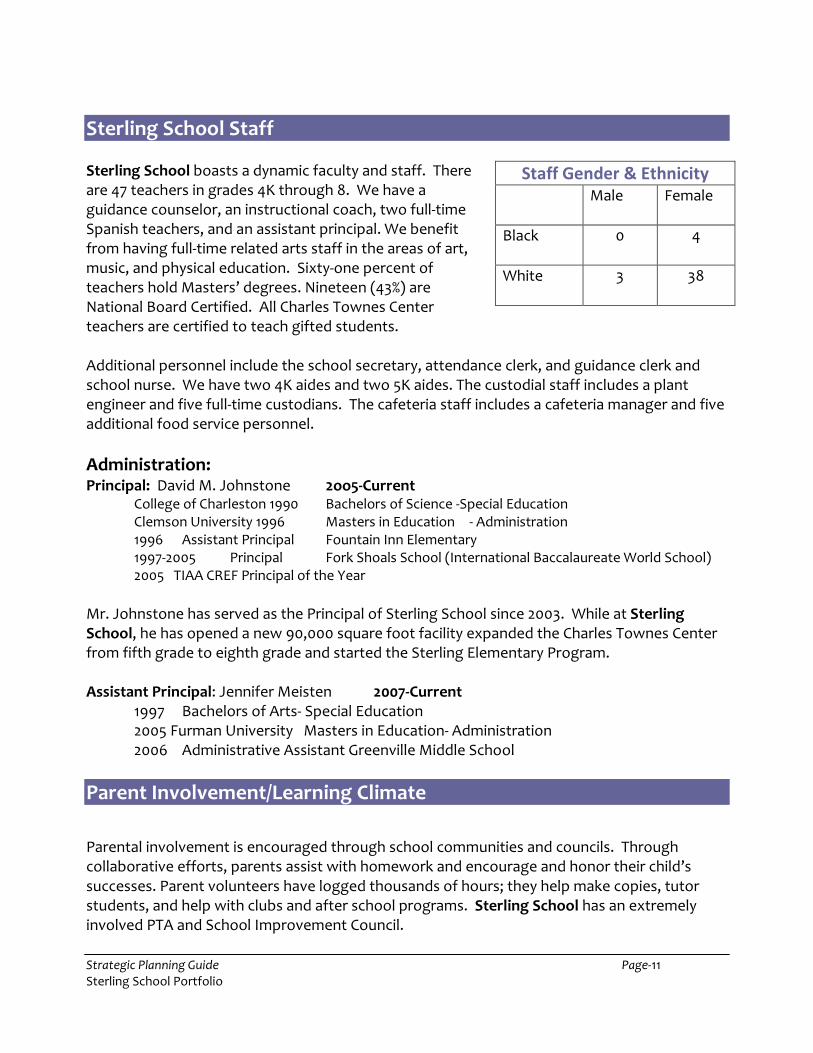
Sterling School Staff Sterling School boasts a dynamic faculty and staff. There are 47 teachers in grades 4K through 8. We have a guidance counselor, an instructional coach, two full-time Spanish teachers, and an assistant principal. We benefit from having full-time related arts staff in the areas of art, music, and physical education. Sixty-one percent of teachers hold Masters’ degrees. Nineteen (43%) are National Board Certified. All Charles Townes Center teachers are certified to teach gifted students. Additional personnel include the school secretary, attendance clerk, and guidance clerk and school nurse. We have two 4K aides and two 5K aides. The custodial staff includes a plant engineer and five full-time custodians. The cafeteria staff includes a cafeteria manager and five additional food service personnel.
Administration: Principal: David M. Johnstone 2oo5-Current
College of Charleston 1990 Bachelors of Science -Special Education Clemson University 1996 Masters in Education - Administration 1996 Assistant Principal Fountain Inn Elementary 1997-2005 Principal Fork Shoals School (International Baccalaureate World School) 2005 TIAA CREF Principal of the Year
Mr. Johnstone has served as the Principal of Sterling School since 2003. While at Sterling School, he has opened a new 90,000 square foot facility expanded the Charles Townes Center from fifth grade to eighth grade and started the Sterling Elementary Program. Assistant Principal: Jennifer Meisten 2007-Current
1997 Bachelors of Arts- Special Education 2005 Furman University Masters in Education- Administration 2006 Administrative Assistant Greenville Middle School
Parent Involvement/Learning Climate
Parental involvement is encouraged through school communities and councils. Through collaborative efforts, parents assist with homework and encourage and honor their child’s successes. Parent volunteers have logged thousands of hours; they help make copies, tutor students, and help with clubs and after school programs. Sterling School has an extremely involved PTA and School Improvement Council.
Staff Gender & Ethnicity Male Female
Black 0 4
White 3 38
Strategic Planning Guide Page-12 Sterling School Portfolio
Volunteer Hours: 2009-2010 7,235 2010-2011 11, 034 2011-2012 12,403
Philosophy All students have a right to educational experiences that are engaging, worthwhile and that enable them to develop unique gifts, pursue natural talents and interests, and become motivated, lifelong learners. Parents, teachers, and administrators at Sterling School work cooperatively and share the responsibility to provide advanced learning opportunities at school and at home these opportunities teach students to communicate effectively, solve problems competently, think critically and creatively, and act responsibly.
Counseling and Other Student Support Services (2011)
Students at Sterling School receive quality support services from an outstanding staff. Support personnel include 1.5 guidance counselors, a guidance clerk, an instructional coach, a media specialist, a speech pathologist, a resource teacher, and a related arts team in art, music, and physical education. The addition of an assistant principal and creation of a school-wide Student Council and Mentoring Program have been instrumental in this area. The guidance department at Sterling has a unique opportunity to overlay the Gifted Programming Standards from the National Association for Gifted Children with the South Carolina Guidance and Counseling Standards from the South Carolina State Department of Education. Recognizing the learning and developmental differences of all students, Sterling’s counselors promote self-understanding, awareness, and both the cognitive and affective growth of our students. Counselors use the State Department’s three broad student development areas of Learning to Learn, Learning to Live, and Learning to Work as the basis for Sterling’s comprehensive program which incorporates classroom guidance lessons, small group guidance and counseling groups, and individual counseling sessions. Through a vertical articulation process, the counselors ensure that the Gifted Standards are infused throughout the entire spectrum of the guidance program.
After-School Program
Sterling School supports students through a number of after-school programs. There is a daily after-school program that provides homework help and academic support for 60 students each day. This is a fee-based program. There are also after-school enrichment programs such as: Running Club, Creative Writing Club, Robotics Club, Spanish Club, Model United Nations, Film Club, Youth in Government, Beta Club, Lego Robotics, Speech and Debate and other activities to help students receive an array of integrated learning.
Strategic Planning Guide Page-13 Sterling School Portfolio
Instructional and Organizational Effectiveness:
Primary Educational Models:
Sterling School has a strong academic tradition. With the growth of the Charles Townes Center and an array of leaders, emphasis on instructional models has varied. Regardless of the variety of approaches, academic achievement has improved every year of the school’s existence. Improvement spans grade levels, cohort grade level groups of students and comparisons to gifted students across the district. These models are also being used to develop the inquiry-based program of the Sterling ElementaryProgram. Educational Models Used: • Renzulli – The Enrichment Triad (scaffolding), focusing on Type III activities • William and Mary Units • Bloom’s Revised Taxonomy • Gardner & Taylor – Multiple Intelligences & Talents • Cooperative Learning • Differentiated Instruction (McTighe) • Treffinger’s – Self-Directed Learning • Kohlberg – Moral Dilemmas • Inquiry-based education • Learning Focus based units • M3: Math Curriculum (3rd-5th Grade)
Primary Assessment Tools: • Rubrics to assess writing and performance • Teacher Observations • Self and peer evaluations/reflections by students • Teacher-student conferencing • Anecdotal records • Individual writing portfolios with annual goals-based conferences • Performance assessments • Quizzes & tests
Sterling School uses the South Carolina State and Greenville County District Academic Standards as foundations to build integrated, inquiry/problem-based units of instruction. In English Language Arts, students are taught through a balanced literacy model, which includes reading, writing, spelling and independent reading. English Lanuage Arts is closely tied with Social Studies through the use of integrated units. Students read historical fiction and use the content, skills and strategies to synthesize information in order to apply new knowledge to other areas. In Science, the students use the District-provided science kits to develop a strong understanding of the science process skills. Students actively research and apply these skills through the use of scientific journals, written lab reports, science fair projects and research projects.
Strategic Planning Guide Page-14 Sterling School Portfolio
English Language Arts: (2011) Students benefit from an enriched language arts curriculum which includes creative, challenging, and developmentally appropriate skills in language usage, writing, integration of social studies and literature-based instruction culminating in authentic learning experiences. Each grade level strives to use innovative and active learning techniques that enhance student learning, while complementing and extending skills and knowledge previously acquired. Teachers work collaboratively on a regular basis and utilize shared information taken from individual learning styles, multiple intelligences, and learning profiles to best teach to each student’s strengths. The department designs and extends lessons and units based on the state ELA Standards. In middle grades, student preparation to excel in rigorous high school coursework is a focus. Reading:
Strengths: Most students read on or above grade level (CTC) Response to Intervention Program for struggling readers (5K-2nd) (+2011) Differentiated reading groups to serve varied student abilites. (+2011)
Writing: Strengths:
Good base knowledge Proficiency in creative writing (CTC) Emphasis on Vertically articulate the writing process (+2011) Scaffolding for reluctant writers Practice in technical, research, and expository writing (2011) Publishing opportunities and materials/supplies, computers (2011)
Spelling, Grammar, and Capitalization: Strengths:
Good base knowledge Able to write complete sentences (CTC) Word Walls and vocabulary displayed in all grades Rigorous grammar instruction through vertical articulation (CTC) Teachers modle the wiritng process
Reading Comprehension: Strengths:
Most students read on or above grade level (CTC) Shared reading includes a variety of genres and topics
Math: (2011) The math curricula at Sterling School are designed to promote problem solving skills which can be utilized across all curriculum areas, including the related arts. Problem solving is collaborative and real world applications demonstrate relevance to students. Rigor is provided through vertical articulation, higher level thinking skills, as well as fluidity in class placement.
Strategic Planning Guide Page-15 Sterling School Portfolio
Students are expected to demonstrate appropriate levels of accuracy based on developmental levels and the task at hand. Strengths:
Strong problem solving abilities Stretch to abstract concepts Desire to learn Solid understanding of basic concepts Differentiated instruction Use of a variety of instructional strategies (best practices) Integration of technology Utilization of manipulatives
Science: (2011) Inquiry-based learning is the cornerstone of the science curricula at Sterling School. Hands-on science experiences are practiced in both the classroom and science lab settings. Students participate in research projects, lab experiments, and the technological design process for which teachers hold high expectations of accuracy and understanding. Real world application opportunities are provided through experiences such as the District-sponsored Science Fair and Invention Convention. Students are also expected to show a comprehensive knowledge of science content as well. Integration across the curriculum is an important aspect of the science curricula. Vertical articulation, higher-level questioning and thinking skills, expert speakers, independent labs, and technological aids promote a rigorous science experience at Sterling School. Strengths:
Strong technology backgrounds Students are creative thinkers, problem solvers Ability to differentiate lessons for a variety of student abilities and interests High interest in reading non-fiction material. Inquiry based learning.
Social Studies:(2011)
The Social Studies curricula at Sterling School are founded on state and district standards and focus on three important education models. First, students are expected to solve inquiry-based problems. Second, teachers utilize a variety of mediums to present to and provide experiences for students in the Inter-related Arts model. Mediums include drama, writing, collage, painting, sculpture, pottery and music. Third, students experience cultural, economic, governmental, and societal differences between cultures with the simulation model. Within these models, technology and writing skills are integrated as students conduct research and create authentic assessments. Reading is emphasized in both the genres of fiction and nonfiction through independent reading as well as literature circles. Students apply these skills through extensive research reports, National History Day projects, and other inquiry-based projects.
Strategic Planning Guide Page-16 Sterling School Portfolio
Strengths:
Strong reading comprehension skills Critical thinking Thinking from multiple perspectives Guest speakers and historical presentations are used to enhance the curriculum Content is integrated well with other curriculum areas and arts Real world application
Modern Languages Program: (Spanish) The Modern Languages Program at Sterling School offers articulated instruction in Spanish to all third through eight grade students. All levels of modern language instruction support national and state standards for modern languages. The curricula are made up of thematic units designed to address the “5 C’s”: Culture, Comparisons, Connections, Communication, and Communities. Each unit ends with an integrated performance assessment (IPA) which addresses the three components of the Communication standard: the Interpersonal, Presentational and Interpretive modes. The elementary program provides content-based instruction one day per week for a total of 50 minutes in the target language. All instruction is conducted in the target language. The middle school program provides Spanish I and Spanish II for high school credit in 7th and 8th grades, while the 6th grade curriculum supports and prepares students for this transition. Students in the 7th and 8th grades attend Spanish daily for both semesters as part of their core classes. Strengths:
Daily exposure to the target language Demonstrations of perseverance and courage Curricula follow national and state standards Use of backwards design Vertical articulation
Media Center: The purpose of the library media program is to ensure that students and teachers can locate, evaluate and use information effectively. The library media specialist and classroom teacher collaborate to teach information and media literacy skills to students in the context of their classroom instruction and at the point of instructional need. The library media center provides programs and access to information in a variety of formats to foster a love of reading and create lifelong learners who are able to use their information skills to pursue their personal and academic interests.
Media Center Usage Statistics:
Strategic Planning Guide Page-17 Sterling School Portfolio
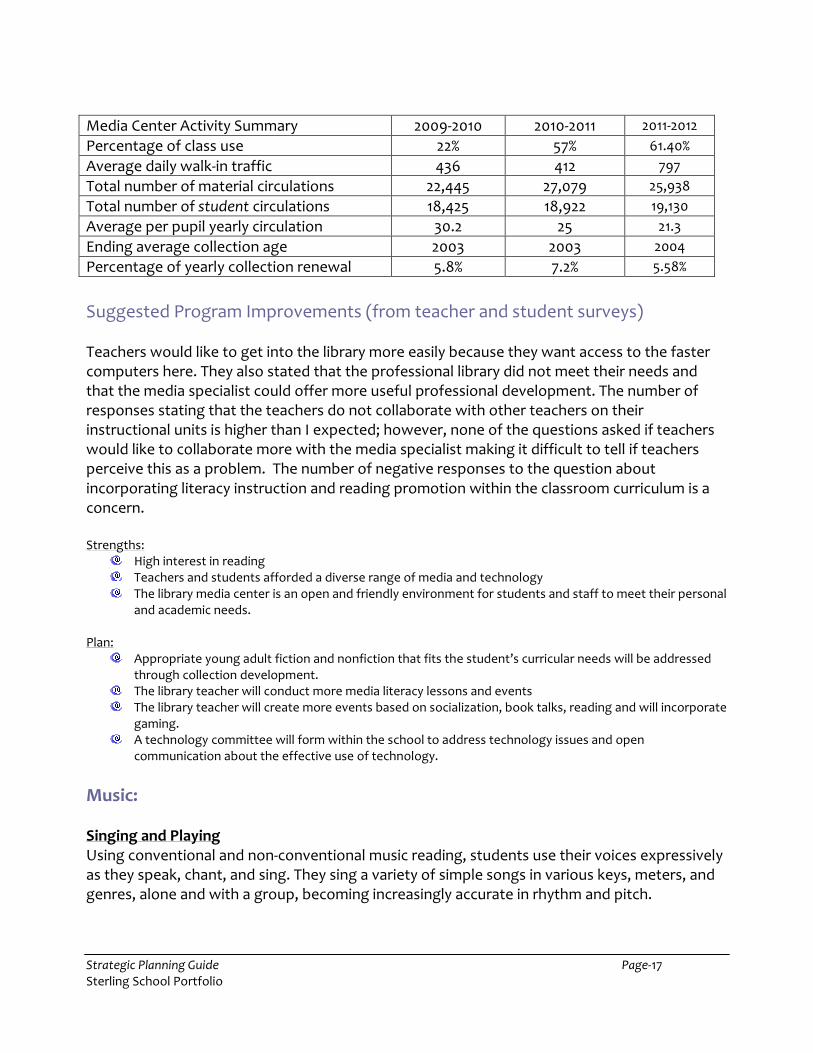
Media Center Activity Summary 2009-2010 2010-2011 2011-2012
Percentage of class use 22% 57% 61.40%
Average daily walk-in traffic 436 412 797
Total number of material circulations 22,445 27,079 25,938
Total number of student circulations 18,425 18,922 19,130
Average per pupil yearly circulation 30.2 25 21.3
Ending average collection age 2003 2003 2004
Percentage of yearly collection renewal 5.8% 7.2% 5.58%
Suggested Program Improvements (from teacher and student surveys) Teachers would like to get into the library more easily because they want access to the faster computers here. They also stated that the professional library did not meet their needs and that the media specialist could offer more useful professional development. The number of responses stating that the teachers do not collaborate with other teachers on their instructional units is higher than I expected; however, none of the questions asked if teachers would like to collaborate more with the media specialist making it difficult to tell if teachers perceive this as a problem. The number of negative responses to the question about incorporating literacy instruction and reading promotion within the classroom curriculum is a concern. Strengths:
High interest in reading Teachers and students afforded a diverse range of media and technology The library media center is an open and friendly environment for students and staff to meet their personal
and academic needs. Plan:
Appropriate young adult fiction and nonfiction that fits the student’s curricular needs will be addressed through collection development.
The library teacher will conduct more media literacy lessons and events The library teacher will create more events based on socialization, book talks, reading and will incorporate
gaming. A technology committee will form within the school to address technology issues and open
communication about the effective use of technology.
Music: Singing and Playing Using conventional and non-conventional music reading, students use their voices expressively as they speak, chant, and sing. They sing a variety of simple songs in various keys, meters, and genres, alone and with a group, becoming increasingly accurate in rhythm and pitch.
Strategic Planning Guide Page-18 Sterling School Portfolio
Students learn tecniques to properly play their chosen instrument and master it through the disciplines of personal practice and participation in group instrumental settings. Creating Music Students improvise songs to accompany activities. They improvise instrumental accompaniments to songs, recorded selections, stories, poems, and create short pieces of music, using voices, instruments, and other sound sources. Students invent and use original graphic or symbolic systems to represent vocal and instrumental sounds and musical ideas. Responding To Music Students identify the sources of a wide variety of sounds. They respond through movement to music of various tempos, meters, dynamics, modes, genres, and styles to express what they hear and feel in works of music. Students are given many opportunities to participate freely in music activities. Understanding Music Students use their own vocabulary and standard music vocabulary to describe voices, instruments, music notation, and music of various genres, styles, and periods from diverse cultures. They sing, play instruments, move, and verbalize to demonstrate awareness of the elements of music and changes in their usage. Students are able to demonstrate an awareness of music as a part of daily life.
Arts Integration: (2011) Arts integration would not be possible in the absence of a strong “Arts for Art’s Sake” program. Arts integration naturally allows students with strengths in the arts to take leadership roles. The areas of perserverance, courage and creativity are directly tapped by arts integration. Strengths:
Strong arts program Arts specialists have extensive training in Arts Integration Some success in implementing integrated units Three grade levels & related arts have had Arts Integration training;
(SmartArts) Strong parent support
Visual Arts: (2011) Strengths:
Out –of- the- box approach Interesting materials School-wide focus on art Integration with classroom teachers Focus on Thinking Ideas behind art Focus on art history and contemporary artists Real-life art applications (2011)

Strategic Planning Guide Page-19 Sterling School Portfolio
Physical Education: (2011) Strengths:
Variety of content Integration with classroom teachers Assisting in incorporation of movement strategies in the regular classroom Students willing to try new things Strong parent support Focus on student leadership and character education
Technology: (2011)
STRATEGIC VISION for TECHNOLOGY
From The National Education Technology Plan 2010 (NETP) – U.S. Department of Education. Available online at
http://www.ed.gov/technology/netp-2010.
The challenge for our education system is to leverage the learning sciences and modern technology to
create engaging, relevant, and personalized learning experiences for all learners that mirror students’
daily lives and the reality of their futures.
Technology should be leveraged to provide access to more learning resources than are available in
classrooms and connections to a wider set of “educators,” including teachers, parents, experts, and
mentors outside the classroom. It also should be used to enable 24/7 and lifelong learning.
Whether the domain is English language arts, mathematics, sciences, social studies, history, art, or music,
21st-century competencies and such expertise as critical thinking, complex problem solving, collaboration,
and multimedia communication should be woven into all content areas. These competencies are necessary
to become expert learners, which we all must be if we are to adapt to our rapidly changing world over the
course of our lives.
In a connected teaching model, classroom educators are fully connected to learning data and tools for
using the data; to content, resources, and systems that empower them to create, manage, and assess
engaging and relevant learning experiences; and directly to their students in support of learning both in
and out of school.
To reach this vision, we must:
� Expand opportunities for educators to have access to technology-based content, resources, and
tools where and when they need them. � Provide access to technology-based resources that inspire educators to provide more engaging and
effective learning opportunities for each and every student. � Provide … in-service…with professional learning experiences powered by technology to increase
[educators’] digital literacy and enable them to create compelling assignments for students that
improve learning, assessment, and instructional practices. � Ensure that every student and educator has at least one Internet access device and appropriate
software and resources for research, communication, multimedia content creation, and
Strategic Planning Guide Page-20 Sterling School Portfolio
collaboration for use in and out of school.
Current data on the use of educational and information technology in our system consists of records of
purchases and numbers of computers and Internet connections. Only by shifting our focus to collecting
data on how and when technology is used will we be able to determine the difference it makes and use
that knowledge to improve outcomes and the productivity of our education system.
Our hope is that Sterling's teachers will experiment with such resources as online learning, online tutoring
and mentoring, games, cognitive tutors, immersive environments, and participatory communities and
social networks both within and across education institutions to give students guidance and information
about their own learning progress and strategies for seamless completion of a comprehensive P–16
education.
We include three categories:
� information literacy, the ability to identify, retrieve, evaluate, and use information for a variety of
purposes; � media literacy, the ability to consume and understand media, as well as communicate effectively
using a variety of media types; � and digital citizenship, the ability to evaluate and use technologies appropriately, behave in socially
acceptable ways within online communities, and develop a healthy understanding of issues
surrounding online privacy and safety.
Answers to questions about 21st-century learning also must take into account that people no longer
can learn everything there is to know in a lifetime, and the economic reality is that most people will
change jobs throughout their lives. Therefore, we need adaptive learning skills that blend content
knowledge with the ability to learn new things.
Items we must address as a school and a district:
Low-income and minority learners. [Students who are]… less likely to have computers and Internet access
and have fewer people in their social circles with the skills to support technology-based learning at home.
Potential Solution(s): extended hours for use of networked computers in schools, libraries, community
centers, etc., 1 to 1 computing equipment accessible for home use. Allow use of devices owned by the
student or family, owned by the school, or some combination of the two. The use of devices owned by
students will require advances in network filtering and improved support systems.
Early childhood: To keep pace with their peers, these children especially need intervention that augments
the linguistic, visual, and symbolic worlds that learners experience and seek to emulate.
Solution(s): Computer-based activities and resources
Broadband: “Adequate” means enough bandwidth to support simultaneous use by all students and
educators anywhere in the building and the surrounding campus to routinely use the Web, multimedia,
and collaboration software.

Strategic Planning Guide Page-21 Sterling School Portfolio
Accessible Devices for Every Student and Educator
Because an infrastructure for learning should support learning in and out of the classroom, students and
educators need Internet-access devices for around-the-clock use from any location. Internet access devices
are continually evolving and today include desktop computers, laptops, net books, public access kiosks,
mobile phones, portable digital players, and wireless readers.
In the past, districts were reluctant to allow students to use their own devices in school because of
concerns about the unfair advantage of affluent students who are more likely to have the latest devices
and the risk of students accessing inappropriate Internet content or using their connectivity to cheat on
tests. However, districts are finding that a combination of acceptable use policies and staff training makes
student use of personal digital devices both feasible and safe. Purchasing devices for students who need
such financial support is more cost-effective than purchasing devices for every student. Districts can think
about providing an access device and Internet access at home for those students who need them in the
same way they provide a free or reduced-price hot lunch for students who could not otherwise afford it. In
choosing the devices to provide for students who otherwise would not have them, districts need to make
sure that all their students have devices that support writing, analysis, and the creation of digital content
related to their courses, not just consumption of content created by others.
We at Sterling School support the creation of an acceptable-use policy that would allow students to use
personal cell phones and other computing devices in school.
We understand that each educator should have a discussion with his or her students to set ground rules for
usage.
We agree that
� Cell phones could be used in class for working on assignments only. � Text or video should be sent only with the educator’s permission. � No photographing or video- or audio-recording of people is to be allowed without their permission. � No posting to websites is to be allowed without permission, � Online safety precautions are to be taken when publishing from a mobile phone.
Technology ideas: Teachers could use cell phone applications for polling and to set up an online text
messaging board to discuss homework. Teachers could use cell phones while teaching, asking students to
answer questions via text messaging rather than out loud. As student answers came in, they were
displayed on a screen at the front of the class, identified by the student’s cell phone screen name. English
teachers, in particular, found the cell phones useful as they started using blogs to engage students in
writing. One class used Twitter to collaborate in generating stories in class.
Specific examples of individual and collaborative learning with technology may include the following:
• Inquiry and adventure environments with games and activities that foster learning.
• Online “collaboratories” (National Science Foundation 2008a) in which scientists establish protocols
for collecting data with sensors from local environments across the planet. Learners and teachers learn
science by doing science as they capture, upload, and then visualize and analyze geospatial and temporal
Strategic Planning Guide Page-22 Sterling School Portfolio
data patterns from the data contributed by the globally networked community.
• Earth- and sky-mapping Web resources with data from the sciences and other fields of scholarly
inquiry that anyone can use to develop virtual travel tours to be applied in learning and teaching activities.
• Augmented reality platforms and games that bring locally relevant learning resources into view for
users of mobile devices with a GPS (Johnson et al. 2010).
• Use of the power of collective intelligence and crowd sourcing to tackle complex interdisciplinary
problems.
• Powerful learning applications for mobile Internet access devices, such as musical instrument simulators,
language-learning tools, and mathematical games.
Student Support Systems Recognizing that some students need support beyond that which is available in the classroom, Sterling School has developed, with the District, a variety of special services:
• We have one part-time special education resource teacher who works with students with learning disabilities.
• We have a part-time audiologist who teaches speech and language skills to students with those areas of difficulty.
When a teacher determines that a student has a need requiring special attention, the student is referred to the A- Team Child Assistance Team. The purpose of the team referral is three fold:
• To assist and advise the regular classroom teacher of potential interventions.
• To recommend screening for possible areas of difficulty.
• If needed, to recommend formal testing of student for a disability.
Certified Staff Evaluation Measures
Principal: Performance Assessment System for Administrators (PAS-A)
Greenville County Schools’ Performance Assessment System for Administrators (PAS-A) is a process for collecting and presenting data to document performance that is based on well-defined job expectations. PAS-A is a modified form of the South Carolina Assisting, Developing, and Evaluating Principal Performance (ADEPP) requirements.
Instructional Coach: Performance Assessment System for Instructional Coaches (PAS-IC) Greenville County Schools’ Performance Assessment System for Instructional Coaches (PAS-IC) is also a process for collecting and presenting data to document performance that is based on well-defined job expectations.
Teachers Performance Assessment System for Teachers (PAS-T)
Strategic Planning Guide Page-23 Sterling School Portfolio
Greenville County Schools’ Performance Assessment System for Teachers (PAS-T) is a process for collecting and presenting data to document performance that is based on well-defined job expectations. PAS-T is a modified form of the South Carolina ADEPT requirements.
Perception and Survey Data Since the inception of Sterling School several surveys conducted by the School Improvement Council, the District and the state have been completed. For example, the School Improvement Council conducted a survey of parents in the school. The survey assessed many areas, including satisfaction level, and perceived weaknesses. The survey is currently being evaluated and reviewed by parent committees as well as the School Improvement Council to be used in developing key action steps. Teachers also give surveys to all of their students. These surveys have been collected and analyzed by the staff.
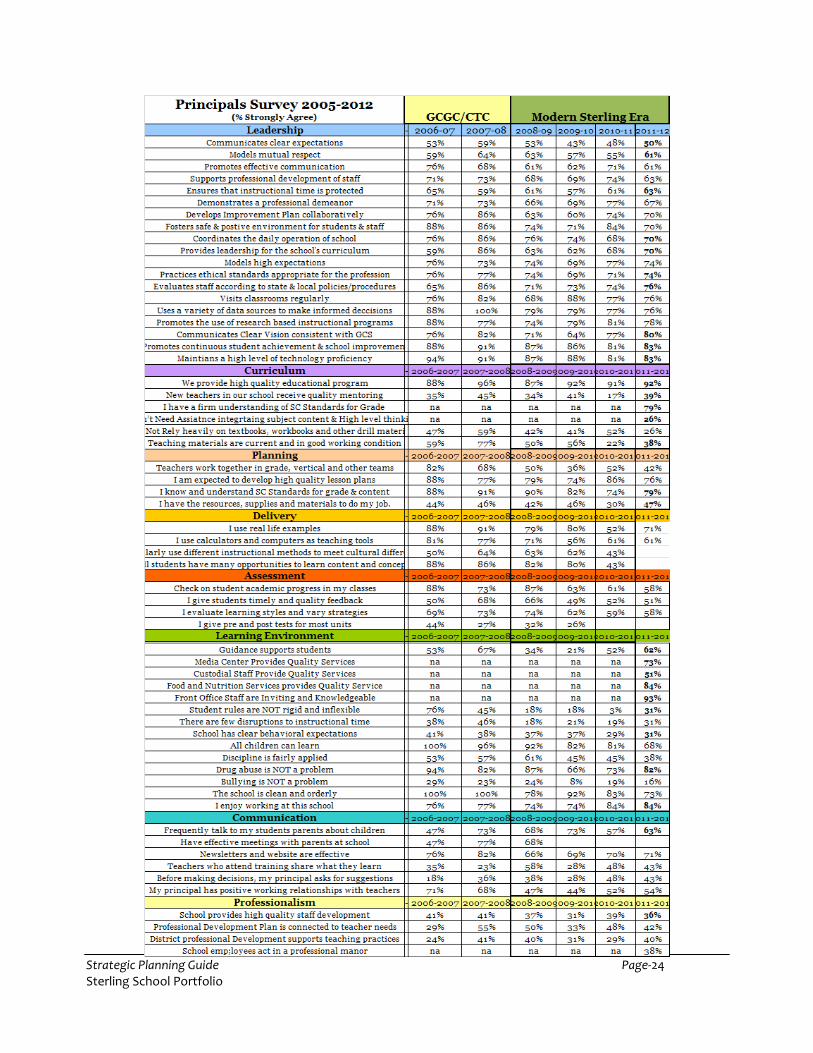
Principal’s Survey The first area of questions in the Prinicpal’s Survey centered on the performance of the principal. Among the strongest areas noted were communication of the mission and vision of the school, a safe school environment, use of data to make decisions, and general instructional support.
The second section reviewed as part of the principal’s survey relates to school climate and instructional practices. The area of need includes professional development. The area of meeting the teachers’ needs showed the lowest level of strongly agree. This was followed by the subsequent sharing of what teachers learned at various professional development opportunities. Reaching students who are unmotivated was the largest area of weakness noted by the teaching staff. The results below are based on the percentage of staff who indicated Strongly Agree.
Strategic Planning Guide Page-24 Sterling School Portfolio
Strategic Planning Guide Page-25 Sterling School Portfolio
Middle School Surveys % Agree/Strongly Agree
2010 2011
My teacher creates a classroom environment that allows me to learn
91% 93%
My teachers encourages me to evaluate my own learning 87% 85%
My teacher allows me to demonstrate my learning in a variety of ways
89% 82%
My teacher gives Clear instructions 85% 85%
My teacher shows respect to all students 86% 97%
My teacher Is available to help outside of class 77% 83%
My teacher grades my work in a timely manner 89% 85%
My teacher relates lessons to other subjects or the real world
84% 86%
My teacher respects different opinions 86% 86%
My teacher uses a variety of activities in class 90% 83%
My teacher encourages all students to learn 94% 94%
My teacher expects me to be successful 94% 96%
My teacher is knowledgeable about his/her subject 87% 99%
My teacher gives helpful feedback 88% 87%
Elementary Survey (Grades 3-5) 2010 2011
Listens to me 83% 94%
Gives me help when I need it 82% 96%
Shows us how to do new things 92% 98%
Evaluate my own learning 77% 93%
Do work in class 73% 94%
Learn new things 88% 98%
Safe in class 95% 95%
Uses many ways to teach 79% 93%
Explains how my learning can be used outside of school 55% 86%
Explains why I get things wrong 57% 87%
Shows respect to all students 85% 97%
Demonstrates helpful strategies 79% 95%
Opportunities to reflect on learning 77% 92%
Allows me to make some choices about my learning 65% 87%
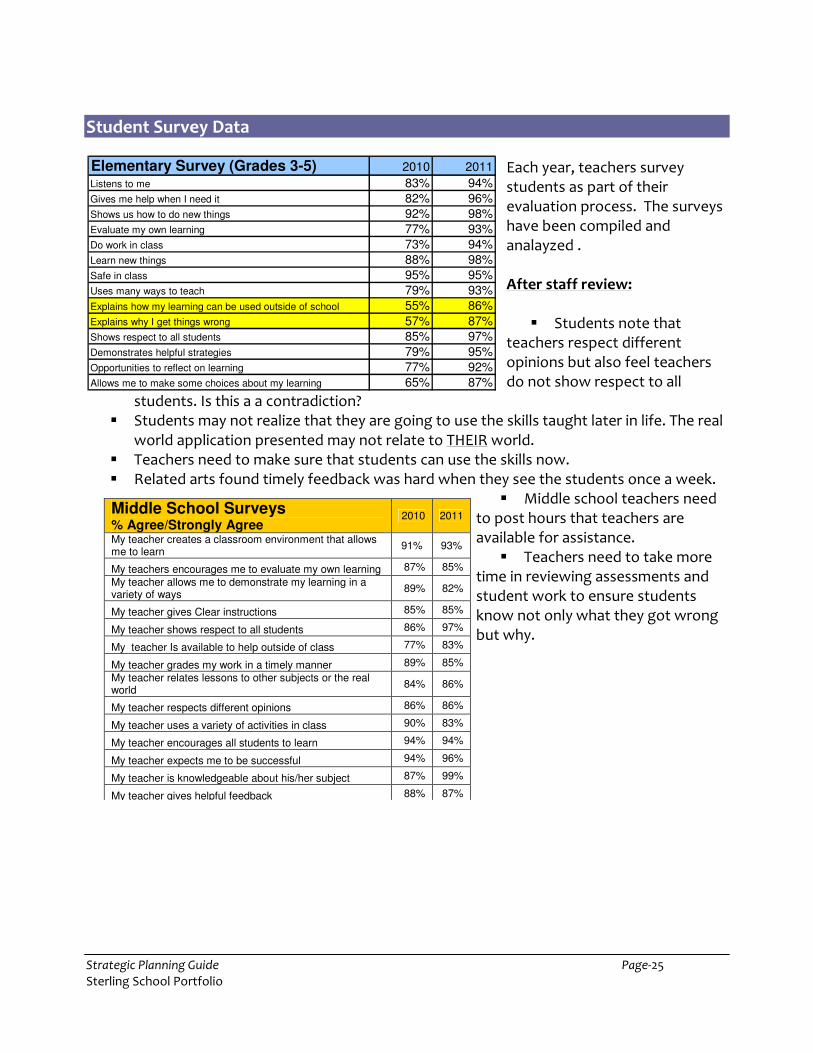
Student Survey Data Each year, teachers survey students as part of their evaluation process. The surveys have been compiled and analayzed . After staff review:
� Students note that teachers respect different opinions but also feel teachers do not show respect to all
students. Is this a a contradiction? � Students may not realize that they are going to use the skills taught later in life. The real
world application presented may not relate to THEIR world. � Teachers need to make sure that students can use the skills now. � Related arts found timely feedback was hard when they see the students once a week.
� Middle school teachers need to post hours that teachers are available for assistance.
� Teachers need to take more time in reviewing assessments and student work to ensure students know not only what they got wrong but why.
Strategic Planning Guide Page-26 Sterling School Portfolio
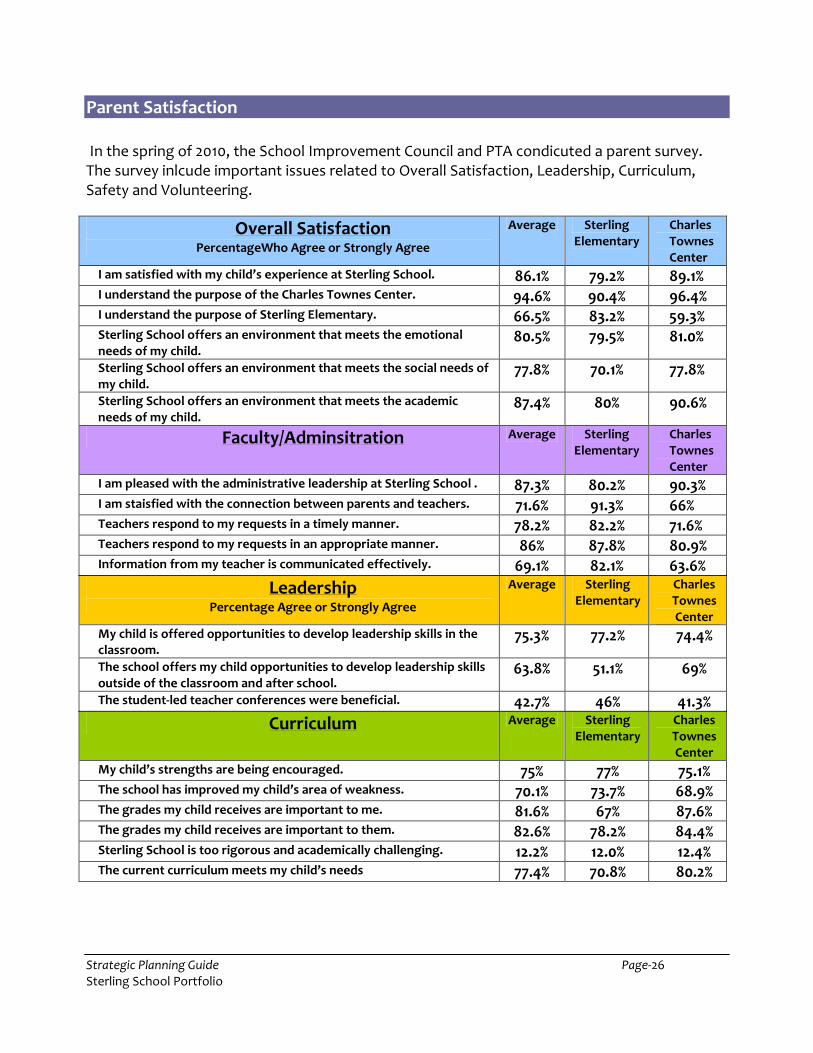
Parent Satisfaction In the spring of 2010, the School Improvement Council and PTA condicuted a parent survey. The survey inlcude important issues related to Overall Satisfaction, Leadership, Curriculum, Safety and Volunteering.
Overall Satisfaction PercentageWho Agree or Strongly Agree
Average Sterling Elementary
Charles Townes Center
I am satisfied with my child’s experience at Sterling School. 86.1% 79.2% 89.1% I understand the purpose of the Charles Townes Center. 94.6% 90.4% 96.4% I understand the purpose of Sterling Elementary. 66.5% 83.2% 59.3% Sterling School offers an environment that meets the emotional needs of my child.
80.5% 79.5% 81.0%
Sterling School offers an environment that meets the social needs of my child.
77.8% 70.1% 77.8%
Sterling School offers an environment that meets the academic needs of my child.
87.4% 80% 90.6%
Faculty/Adminsitration Average Sterling Elementary
Charles Townes Center
I am pleased with the administrative leadership at Sterling School . 87.3% 80.2% 90.3% I am staisfied with the connection between parents and teachers. 71.6% 91.3% 66% Teachers respond to my requests in a timely manner. 78.2% 82.2% 71.6% Teachers respond to my requests in an appropriate manner. 86% 87.8% 80.9% Information from my teacher is communicated effectively. 69.1% 82.1% 63.6%
Leadership Percentage Agree or Strongly Agree
Average Sterling Elementary
Charles Townes Center
My child is offered opportunities to develop leadership skills in the classroom.
75.3% 77.2% 74.4%
The school offers my child opportunities to develop leadership skills outside of the classroom and after school.
63.8% 51.1% 69%
The student-led teacher conferences were beneficial. 42.7% 46% 41.3%
Curriculum Average Sterling Elementary
Charles Townes Center
My child’s strengths are being encouraged. 75% 77% 75.1% The school has improved my child’s area of weakness. 70.1% 73.7% 68.9% The grades my child receives are important to me. 81.6% 67% 87.6% The grades my child receives are important to them. 82.6% 78.2% 84.4% Sterling School is too rigorous and academically challenging. 12.2% 12.0% 12.4% The current curriculum meets my child’s needs 77.4% 70.8% 80.2%

Strategic Planning Guide Page-27 Sterling School Portfolio
Areas of Importance: After reviewing the all survey results and the parent commments in the comment portion of the surveys, concerns were in the following areas.
Parent & Student Survey Results
Sterling Elementary Charles Townes Center All Discipline code Admissions policy Academic Programming
Communication Homework Academic Programming
Campus Safety
Safety Average Sterling Elementary
Charles Townes Center
My child is safe on our school campus inside the building. 87.6% 80% 91.1% My child is safe outside the building when on recess or during PE. 73.8% 68% 76.5% My child is safe during carpool. 81.3% 85.5% 81.3% School traffic control measures are adequate. 75% 70.8% 76.9%
Volunteering Average Sterling Elementary
Charles Townes Center
I am aware of volunteer opportunities at Sterling 93% 98.2% 90.9%
I know whom to contact to learn about volunteer opportunities. 83.4% 83.9% 83.2%
I would like to volunteer more often. 35.7% 46.2% 30.9%
Strategic Planning Guide Page-28 Sterling School Portfolio
Student Achievement
Mission Provide a differentiated; challenging education to meet the distinctive intellectual, social and emotional needs of our students
Vision Nurtured by a supportive environment, students will surpass academic challenges, develop as leaders, form collaborative relationships with peers and learn to lead. Our graduates will be independent, productive, responsible and creative individuals capable of making original contributions to society.
Beliefs: (2011) To support a first-rate education for our students, we believe the following:
• Students of exceptionally high intellectual potential do not simply learn faster, they often learn in a
qualitatively different way; they deserve appropriate rigor, complexity, and depth in what they
learn, as well as opportunities to demonstrate significant academic and intellectual growth.
• Fostering a love of learning is a shared enterprise among home, school, community and student,
and we will communicate openly and work together to support the intellectual curiosity and active
participation by students in managing their learning.
• Students obtain personal academic growth through self-evaluation of their approach to learning.
• Compassion, courage, creativity, perseverance, integrity and aspiration are essential leadership
skills.
• Students deserve opportunities for service, leadership, appreciation of cultural diversity, creative
expression, and activities that enrich their learning.
Student Learning Sterling School relies on test scores from the PASS, MAP tests, Cognitive Abilities Test and the Iowa Basic Skills Test to assess student achievement. Setting the highest achievement expectations for students, we are committed to meeting Adequate Yearly Progress standards set by NCLB guidelines. We strive to continually improve student performance on standardized tests. We also use MAP testing to measure student progress over time.
Strategic Planning Guide Page-29 Sterling School Portfolio
2nd
2008
2nd
2009
2nd
2010
2nd
2011
2nd
2012
Vocabulary 84 82 73
Reading Comprehension 80 78 71 65 70
Reading Total 85 82 74
Spelling 80 77 74
Language Total 75 83 72
Concepts & Estimation 61 81 68 58 51
Problem Solving 69 80 74 56 61
Computation 57 75 54
Math 66 82 71 56 56
Core 76 82 72
CoGAT 78 84 72 66 61
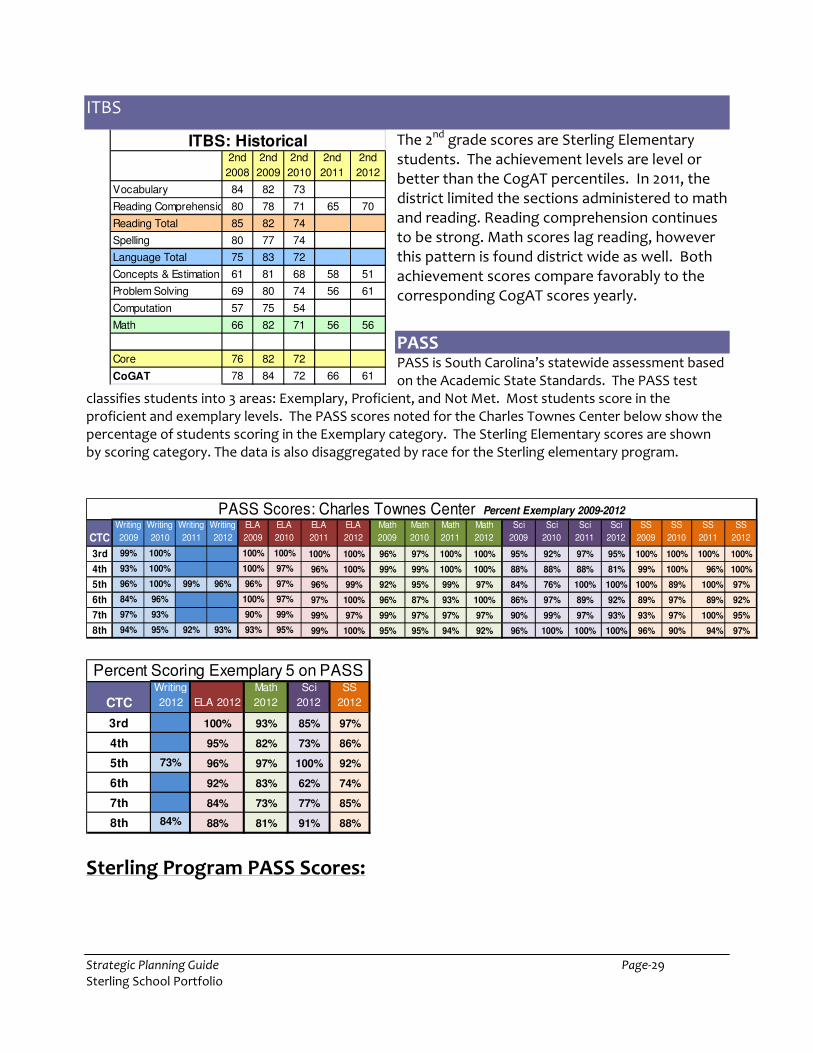
ITBS: Historical
ITBS
The 2nd grade scores are Sterling Elementary students. The achievement levels are level or better than the CogAT percentiles. In 2011, the district limited the sections administered to math and reading. Reading comprehension continues to be strong. Math scores lag reading, however this pattern is found district wide as well. Both achievement scores compare favorably to the corresponding CogAT scores yearly.
PASS PASS is South Carolina’s statewide assessment based on the Academic State Standards. The PASS test
classifies students into 3 areas: Exemplary, Proficient, and Not Met. Most students score in the proficient and exemplary levels. The PASS scores noted for the Charles Townes Center below show the percentage of students scoring in the Exemplary category. The Sterling Elementary scores are shown by scoring category. The data is also disaggregated by race for the Sterling elementary program.
Sterling Program PASS Scores:
CTC
Writing
2009
Writing
2010
Writing
2011
Writing
2012
ELA
2009
ELA
2010
ELA
2011
ELA
2012
Math
2009
Math
2010
Math
2011
Math
2012
Sci
2009
Sci
2010
Sci
2011
Sci
2012
SS
2009
SS
2010
SS
2011
SS
2012
3rd 99% 100% 100% 100% 100% 100% 96% 97% 100% 100% 95% 92% 97% 95% 100% 100% 100% 100%
4th 93% 100% 100% 97% 96% 100% 99% 99% 100% 100% 88% 88% 88% 81% 99% 100% 96% 100%
5th 96% 100% 99% 96% 96% 97% 96% 99% 92% 95% 99% 97% 84% 76% 100% 100% 100% 89% 100% 97%
6th 84% 96% 100% 97% 97% 100% 96% 87% 93% 100% 86% 97% 89% 92% 89% 97% 89% 92%
7th 97% 93% 90% 99% 99% 97% 99% 97% 97% 97% 90% 99% 97% 93% 93% 97% 100% 95%
8th 94% 95% 92% 93% 93% 95% 99% 100% 95% 95% 94% 92% 96% 100% 100% 100% 96% 90% 94% 97%
PASS Scores: Charles Townes Center Percent Exemplary 2009-2012
CTC
Writing
2012 ELA 2012
Math
2012
Sci
2012
SS
2012
3rd 100% 93% 85% 97%
4th 95% 82% 73% 86%
5th 73% 96% 97% 100% 92%
6th 92% 83% 62% 74%
7th 84% 73% 77% 85%
8th 84% 88% 81% 91% 88%
Percent Scoring Exemplary 5 on PASS
Strategic Planning Guide Page-30 Sterling School Portfolio
ELA
2010
ELA
2011
ELA
2012
Math
2010
Math
2011
Math
2012
Sci
2010
Sci
2011
Sci
2012
SS
2010SS 2011 SS
2012
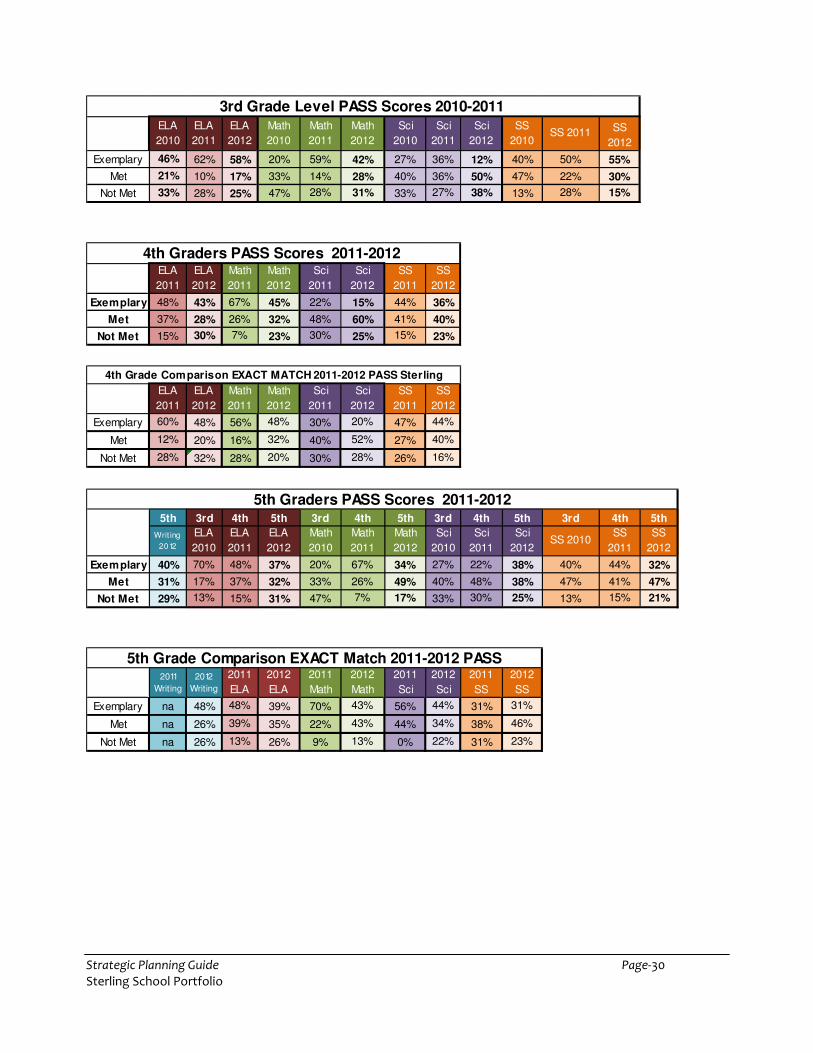
Exemplary 46% 62% 58% 20% 59% 42% 27% 36% 12% 40% 50% 55%
Met 21% 10% 17% 33% 14% 28% 40% 36% 50% 47% 22% 30%
Not Met 33% 28% 25% 47% 28% 31% 33% 27% 38% 13% 28% 15%
3rd Grade Level PASS Scores 2010-2011
ELA
2011
ELA
2012
Math
2011
Math
2012
Sci
2011
Sci
2012
SS
2011
SS
2012
Exemplary 48% 43% 67% 45% 22% 15% 44% 36%
Met 37% 28% 26% 32% 48% 60% 41% 40%
Not Met 15% 30% 7% 23% 30% 25% 15% 23%
4th Graders PASS Scores 2011-2012
ELA
2011
ELA
2012
Math
2011
Math
2012
Sci
2011
Sci
2012
SS
2011
SS
2012
Exemplary 60% 48% 56% 48% 30% 20% 47% 44%
Met 12% 20% 16% 32% 40% 52% 27% 40%
Not Met 28% 32% 28% 20% 30% 28% 26% 16%
4th Grade Comparison EXACT MATCH 2011-2012 PASS Sterling
5th 3rd 4th 5th 3rd 4th 5th 3rd 4th 5th 3rd 4th 5th
Writ ing
2012
ELA
2010
ELA
2011
ELA
2012
Math
2010
Math
2011
Math
2012
Sci
2010
Sci
2011
Sci
2012SS 2010
SS
2011
SS
2012
Exemplary 40% 70% 48% 37% 20% 67% 34% 27% 22% 38% 40% 44% 32%
Met 31% 17% 37% 32% 33% 26% 49% 40% 48% 38% 47% 41% 47%
Not Met 29% 13% 15% 31% 47% 7% 17% 33% 30% 25% 13% 15% 21%
5th Graders PASS Scores 2011-2012
2011
Writing
2012
Writing
2011
ELA
2012
ELA
2011
Math
2012
Math
2011
Sci
2012
Sci
2011
SS
2012
SS
Exemplary na 48% 48% 39% 70% 43% 56% 44% 31% 31%
Met na 26% 39% 35% 22% 43% 44% 34% 38% 46%
Not Met na 26% 13% 26% 9% 13% 0% 22% 31% 23%
5th Grade Comparison EXACT Match 2011-2012 PASS

Strategic Planning Guide Page-31 Sterling School Portfolio

Strategic Planning Guide Page-32 Sterling School Portfolio
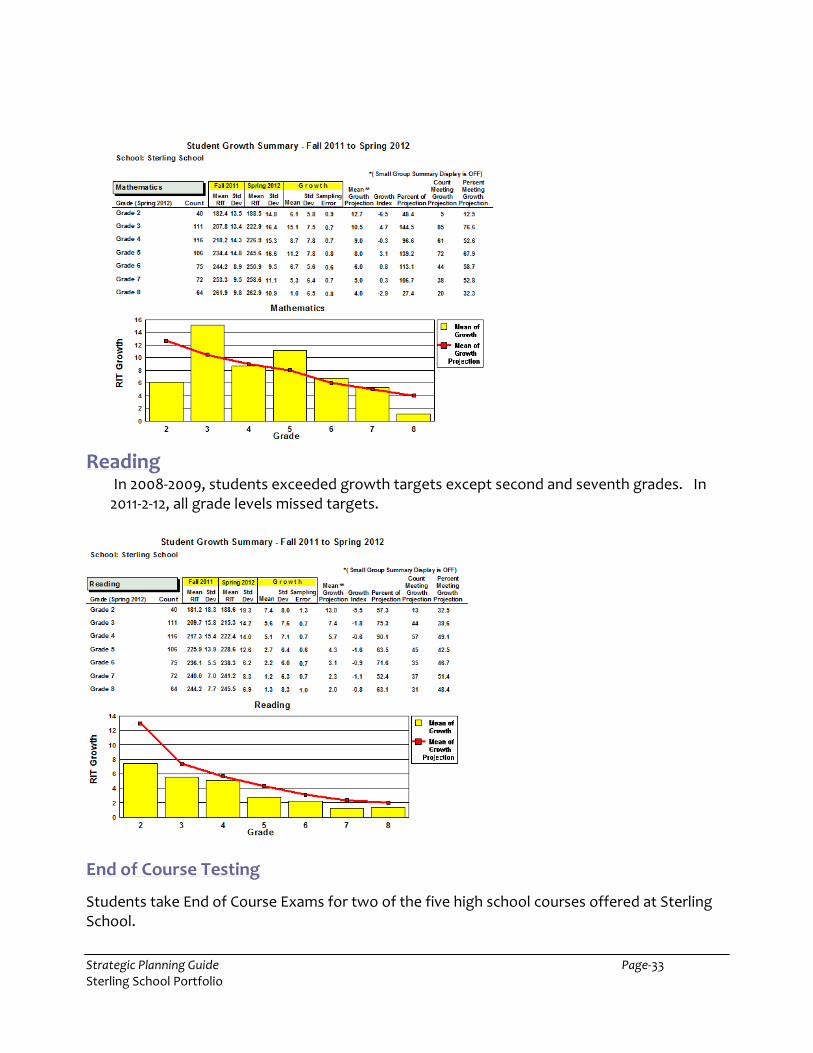
MAP Scores
Each year, all students at Sterling School are administered the MAP Achievement Test in the fall and spring. Student’s scores are identified by a RIT score. Students are then assigned a target growth projection based on typical growth. The graphs below represent the percentage of students who have met their RIT goals each year. This is represented by the gold bar in each graph. The red line is the mean projected growth. The two categories represented are Mathematics and Reading.
Mathematics Students exceeded growth targets in all grade levels in 2008-2009, except second grade. In 2011-2012, all grade levels except 2nd and 8th met their target growth goals.
Strategic Planning Guide Page-33 Sterling School Portfolio
Reading In 2008-2009, students exceeded growth targets except second and seventh grades. In 2011-2-12, all grade levels missed targets.
End of Course Testing
Students take End of Course Exams for two of the five high school courses offered at Sterling School.
Strategic Planning Guide Page-34 Sterling School Portfolio
Honors Algebra I
2008: 98.4 Mean Scale Score (49 students: All 7th grade) 2009: 98.5 Mean Scale Score (67 students: 7th & 8th grade) 2010: 97.9 Mean Scale Score (67 students: 7th & 8th grade) 2011 96.9 Mean Scale Score (69 students 7th & 8th grade) 2012 97.2 Mean scale Score (80 students 7th & 8th grade)
Honors English I
2009: 96.5 Mean Scaled Score (31 students: All 8th grade) 2010: 96.9 Mean Scaled Score (31 students: All 8th grade) 2011: 96.4 Mean Scaled Score (51 students: All 8th grade)
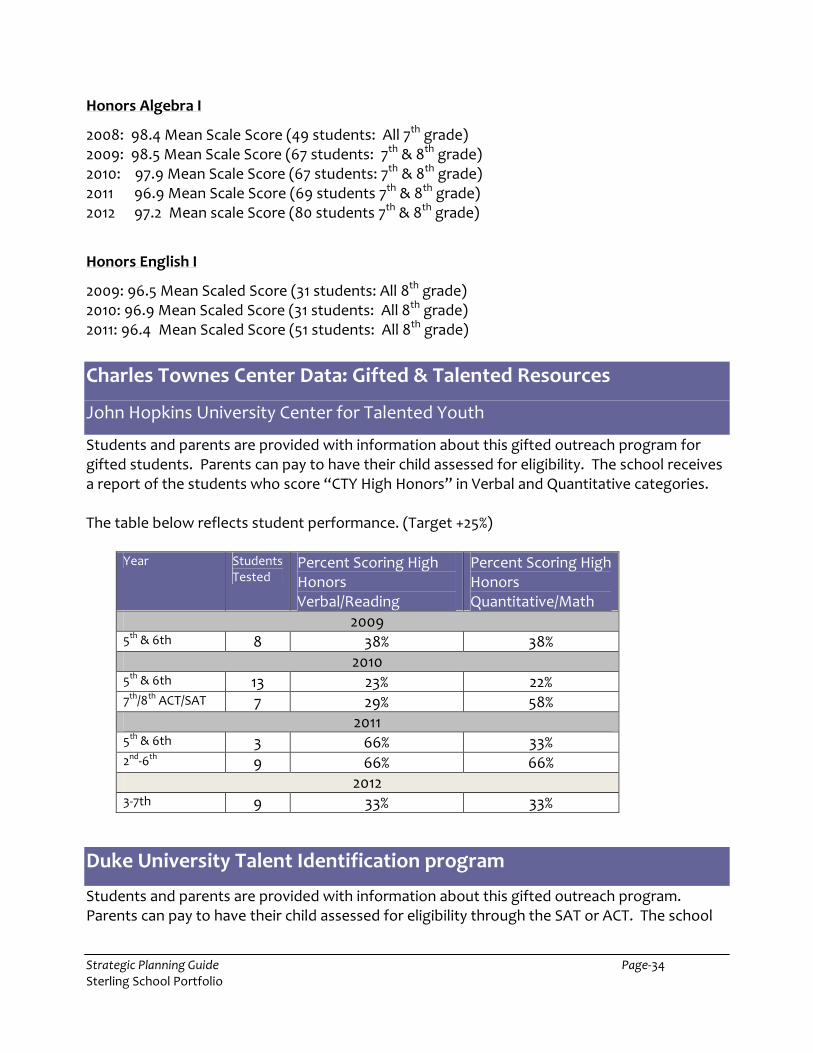
Charles Townes Center Data: Gifted & Talented Resources
John Hopkins University Center for Talented Youth
Students and parents are provided with information about this gifted outreach program for gifted students. Parents can pay to have their child assessed for eligibility. The school receives a report of the students who score “CTY High Honors” in Verbal and Quantitative categories. The table below reflects student performance. (Target +25%)
Year Students Tested
Percent Scoring High Honors Verbal/Reading
Percent Scoring High Honors Quantitative/Math
2009 5th & 6th 8 38% 38%
2010 5th & 6th 13 23% 22% 7th/8th ACT/SAT 7 29% 58%
2011 5th & 6th 3 66% 33% 2nd-6th 9 66% 66%
2012 3-7th 9 33% 33%
Duke University Talent Identification program
Students and parents are provided with information about this gifted outreach program. Parents can pay to have their child assessed for eligibility through the SAT or ACT. The school
Strategic Planning Guide Page-35 Sterling School Portfolio
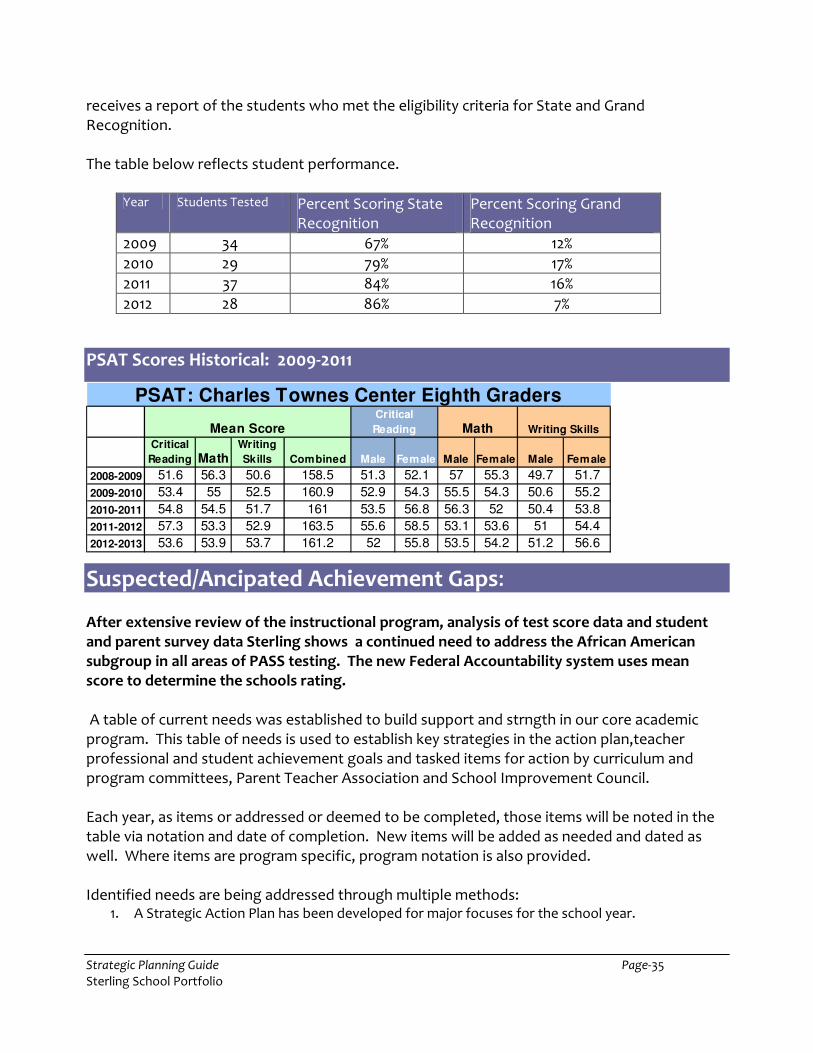
receives a report of the students who met the eligibility criteria for State and Grand Recognition. The table below reflects student performance.
Year Students Tested Percent Scoring State Recognition
Percent Scoring Grand Recognition
2009 34 67% 12%
2010 29 79% 17%
2011 37 84% 16%
2012 28 86% 7%
PSAT Scores Historical: 2009-2011
Suspected/Ancipated Achievement Gaps: After extensive review of the instructional program, analysis of test score data and student and parent survey data Sterling shows a continued need to address the African American subgroup in all areas of PASS testing. The new Federal Accountability system uses mean score to determine the schools rating. A table of current needs was established to build support and strngth in our core academic program. This table of needs is used to establish key strategies in the action plan,teacher professional and student achievement goals and tasked items for action by curriculum and program committees, Parent Teacher Association and School Improvement Council. Each year, as items or addressed or deemed to be completed, those items will be noted in the table via notation and date of completion. New items will be added as needed and dated as well. Where items are program specific, program notation is also provided. Identified needs are being addressed through multiple methods:
1. A Strategic Action Plan has been developed for major focuses for the school year.
Critical
Reading MathWriting
Skills Combined Male Female Male Female Male Female
2008-2009 51.6 56.3 50.6 158.5 51.3 52.1 57 55.3 49.7 51.7
2009-2010 53.4 55 52.5 160.9 52.9 54.3 55.5 54.3 50.6 55.2
2010-2011 54.8 54.5 51.7 161 53.5 56.8 56.3 52 50.4 53.8
2011-2012 57.3 53.3 52.9 163.5 55.6 58.5 53.1 53.6 51 54.4
2012-2013 53.6 53.9 53.7 161.2 52 55.8 53.5 54.2 51.2 56.6
PSAT: Charles Townes Center Eighth Graders
Mean Score Math Writing Skills
Critical
Reading

Strategic Planning Guide Page-36 Sterling School Portfolio
2. Curriculum Vertical (cross grade level) Teams and Program Committees will be responsible for tasks in the plan and addressing other issues.
3. Indiviudal teachers may include needs in their professional goal setting yearly.
As new needs are discovered, they will be added and dated to the needs list. As needs are resolved, they will be dated and marked as complete. Sterling also finished a comprehensive review of our overall instructional progarm and after careful review, we decided that the best approach to update and improve the instructional program at the Charles Townes Center and the Sterling Program was to add depth, rigor and choice to our current offerings. There is still a path for course acceleration where needed, however, the vast majority of student needs would be better met with a program that added attention to student strengths through extensions, in-depth studies in a field of interest and ongoing enrichment. These enrichments and extensions would also be supported through a partnership with The Children’s Museum of the Upstate (in initial talks). Students would use the museum and its staff as a resource for curriculum development and field experiences. Teachers, parents and students will work together to develop a comprehensive student portfolio which guide large group extensions, individualized enrichment and student course and project selection. This new approach would include a Program Facilitator (both programs) and a 1.0 related arts allocation.
Strategic Plan Table of Needs Information & Analysis: � Use MAP Data to drill down
to strands
� Share instructional
practices between teachers
CTC:
� More cross curricular
integration
� Vertical alignment
� Examine social and
emotional needs of gifted
students
� Attend Conferences
Sterling
� Develop No Failure Policy
� Give student information to
teacher at enrollment
Student Achievement: � Managing Homework
� Organizational skills of students
CTC:
� Teacher release time to visit/observe peer
classrooms both on and off site
� Allow students to self evaluate / reflect
using pre and post assessments
� Need vertical teaming including related arts
� Self-tracking
Sterling
� Build consistency in analysis
� Analyze student behavior to minimize
disruptions
� More training on poverty and its effect on
learning.
� Study effective grouping strategies
� School-wide focus on vision and sharing
strategies
� Intra-grade meetings to review achievement
� Develop portfolios
Professional Development � Program specific training
CTC:
� Math/science integration training
� In-house sharing / professional development
� Coverage for collaboration
� Differentiate professional development vs. staff wide
(what individuals need)
� Required to share experiences with the rest of the
staff
� What are the student’s weaknesses?
� What are our weaknesses? And interests?
� Best practices training sessions – taught by teachers!
� Forum- school wide to brainstorm, share, and follow-
up
� Peer / in-house collaboration
� Based on individual teacher interests
Partnerships: � Define school goals
� Define tools needed
� Focus parent involvement including
training
� Define school events and traditions to lure
partners
� Develop needs assessment and match
with needs of partners
� Develop a partnership plan
� Partnership handbook to identify and
Evaluation: � Overall expectations, strategies and
goals should be shared by all
� A-Team process more defined with
designated teams
� Define common beliefs
� Focus meetings during planning time
� Review Understanding by Design
model (Start with the Assessment 1st
� Review long-range plans and make
adjustments as needed
Leadership: � Mentor/tutor Older students-younger
CTC:
� Follow-up on budget information
� Time to plan by grade and school-wide to
discuss needs, materials available, etc.
� Mentoring needed for teachers new to the
district not just “new” teachers – What
resources are available? What materials does
the school have and where are they stored?
Etc.

Strategic Planning Guide Page-37 Sterling School Portfolio
utilize resources
� Integration within core academic subjects.
� Develop new and maintain existing
business partnerships
� Develop and maintain student leadership
and mentoring opportunities
� Develop student portfolios
� Maintenance, food services, etc. on
board with vision of the school
� Narrative report card
� Faculty Council – meet during the Wed.
vertical team meeting days or during lunch.
Consider separating elementary and middle.
Sterling
� Deeper analysis of classroom practice
� Program-wide behavior plan school-wide
(+2012)
English Language Arts: � Larger selection in novel sets
and literature resources
� Need Age appropriate yet
challenging books (+2011)
� Students need to read more
non-fiction (+2011)
� Leveled Library (2011)
� Take home reading packets
(2011)(primary)
� Each grade level needs to
teach with increasing rigor in
mind. (2011)
Reading Comprehension:
� Students rush when reading
and miss main ideas and
themes (2012)
� Need age appropriate, yet
challenging books (2012)
� Students need to read more
nonfiction (Build media center
collection)(2012)
Writing: � Staying on topic (-2012)
� School-wide terminology(-
2012)
� Publishing opportunities and
materials/supplies,
computers (+2011)(-2012)
� Practice in technical,
research, and expository
writing (+2011)
� New electronic format for
portfolio needed (3-8) Spelling, Grammar, and
Capitalization: � Students need help applying
their knowledge (-2012)
� School newspaper (-2012)
� Spelling (2011)
� Resources to teach
grammar(2011) (-2012)
� Writing across the curriculum
(-2011)
Math: � Work on persistence, attention to detail, and ability to explain the
problem solving process (communicate mathematical thinking)
� Abstract and quantitative reasoning (Common Core)
� Look for and make use of structure (-2012)
� Look for and express regularity in repeated reasoning(-2012)
� Adequate quantities and effective use of manipulative for student
use.
� Student leadership opportunities. such as student mentors (math
buddies) to nourish compassion.
� Community mentors to encourage aspiration, courage and
perseverance. (+2012)
� Positive, school-wide celebration of math as an ongoing effort.
For example: Math buddies (mentoring), projects, math clubs
(Math Counts, Math Olympiad), special theme days (pi day,
metric day, 100th day of school)
� Continue to build the vertical articulation
� Advanced teacher training f :effective use of manipulatives,
implementation of resources like creative problem solving activity
books and math “story books”, NCTM Navigations series
activities, and Mentoring Mathematical Minds (M3)
� Integrate Common Core Standards
� Resources: creative problem solving, math “story books”
Science: � K-8 benchmarks (-2012)
� Supplemental science
resources (elem)
� Interdisciplinary integration
of topics (2011)
� Development of student
expository writing skills and
research
� Community connections (i.e.
Greenville Hospital System)
to develop long-term
projects to benefit the
community and provide
more real world science
experiences. (-2012)
� Develop CATCH initiative
within school and local
community (+2011)
� Vertical articulation of
science standards and how
they are taught (standard 1)
� Plan to utilize outside areas
for study ecosystems &
creek
� More professional
development for
elementary teachers
(+2011)
� Intra subject cooperation
(2011)
Social Studies � Additional Teaching
Resources:
� Trade Books
� Reference Books
� Primary Resources
� Correlate writing format
terminology across all
grade levels (added
2011-2012)
� Physical Maps (2011)
� Incorporate Leadership
and Character Education
through evaluation of
civilizations’ leaders.
(2011)
� Common Core
implementation (+2012)
� Weekly Readers or
scholastic readers
(+2012)
Technology: � Power Teacher Training (-
2012)
� Promethean Training
(-2012)
� Active Inspire
� Managing student work
� Integration of Moodle
and website
� Develop staff resource
list
� E-Portfolios
� Student email use
� Keyboarding
� Using web based
programs to enhance
instruction (You tube,
Moodle etc…)
� At least 1 tech based
project per year
� Provide parent training
� Support tech divide
among students
� Develop Student Skills
checklist
� Reliable laptops
� More training for
technology
� Basic Computer skills
(1st&2
nd) (+2012)
Media Center: � Increased collaboration between the
library teacher and the classroom
teacher
� Information ethics and responsibility
training is lacking for students(-2012)
� Infrastructure cannot support
technology
� Locate & Purchase reading materials
written on a high lexile level for
students in the CTC program
� Middle school teacher’s suggestions of
appropriate curriculum driven and
recreational adult level reading
materials suited to their students’ age,
maturity, interests and reading level.
� More library books about math (-2012)
� More library programming and
advertising including reading
initiatives, media literacy and social
activities to promote library use
� Improve scheduling method for library
facilities and materials to promote
equitable use, equipment security and
appropriate treatment of the
collection and furniture before, during
and afterschool
Spanish: � Define curriculum goals at the
beginning of each year for elementary
� Support for students who are not
ready to enter Spanish One and Two
(-2012)
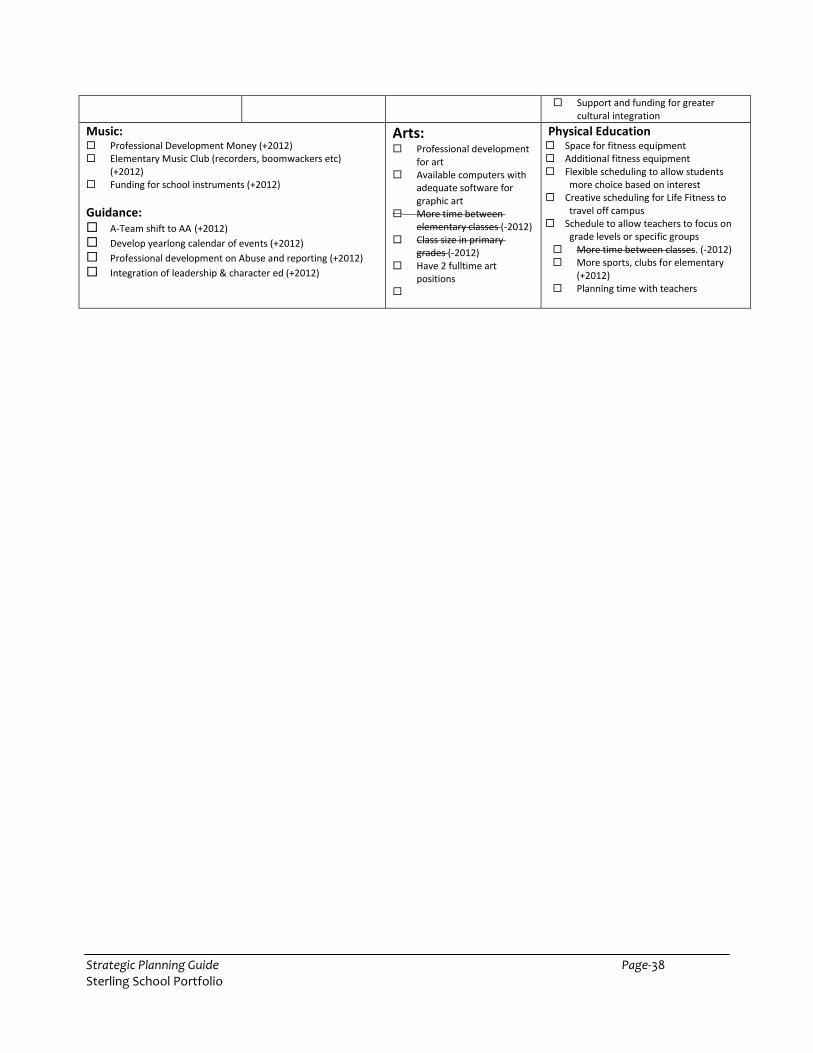
Strategic Planning Guide Page-38 Sterling School Portfolio
� Support and funding for greater
cultural integration
Music: � Professional Development Money (+2012)
� Elementary Music Club (recorders, boomwackers etc)
(+2012)
� Funding for school instruments (+2012)
Guidance:
� A-Team shift to AA (+2012) � Develop yearlong calendar of events (+2012) � Professional development on Abuse and reporting (+2012) � Integration of leadership & character ed (+2012)
Arts: � Professional development
for art
� Available computers with
adequate software for
graphic art
� More time between
elementary classes (-2012)
� Class size in primary
grades (-2012)
� Have 2 fulltime art
positions
�
Physical Education � Space for fitness equipment
� Additional fitness equipment
� Flexible scheduling to allow students
more choice based on interest
� Creative scheduling for Life Fitness to
travel off campus
� Schedule to allow teachers to focus on
grade levels or specific groups
� More time between classes. (-2012)
� More sports, clubs for elementary
(+2012)
� Planning time with teachers
Strategic Planning Guide Page-39 Sterling School Portfolio
Quality Planning Performance Goals & Action Plan Professional Development Plan
Goals
PERFORMANCE GOAL 1: ENGLISH LANGUAGE ARTS
The percentage of Sterling elementary students scoring Met and Exemplary on the PASS English Language Arts test
will increase from 71% to 76% in the 2012-2013 school year.
The mean score of Sterling elementary students will increase from 644 to 650 for the 2012-2013 school year.
PERFORMANCE GOAL 2: WRITING
The percentage of Sterling elementary students (5th grade) scoring Met and Exemplary on the PASS Writing test will
increase form 72% to 77% in the 2012-2013 school year.
PERFORMANCE GOAL 3: MATH
The percentage of Sterling elementary students scoring Met and Exemplary on the PASS Math test will increase from
76% to 81% in the 2012-2013 school year.
The mean score of Sterling elementary students will increase from 642 to 648 for the 2012-2013 school year.
PERFORMANCE GOAL 4:
All personnel will be highly qualified and specialized through 2012-13.
PERFORMANCE GOAL 5: Maintain or exceed 85% approval rating from students, parents and teachers on the State Report Card Survey.

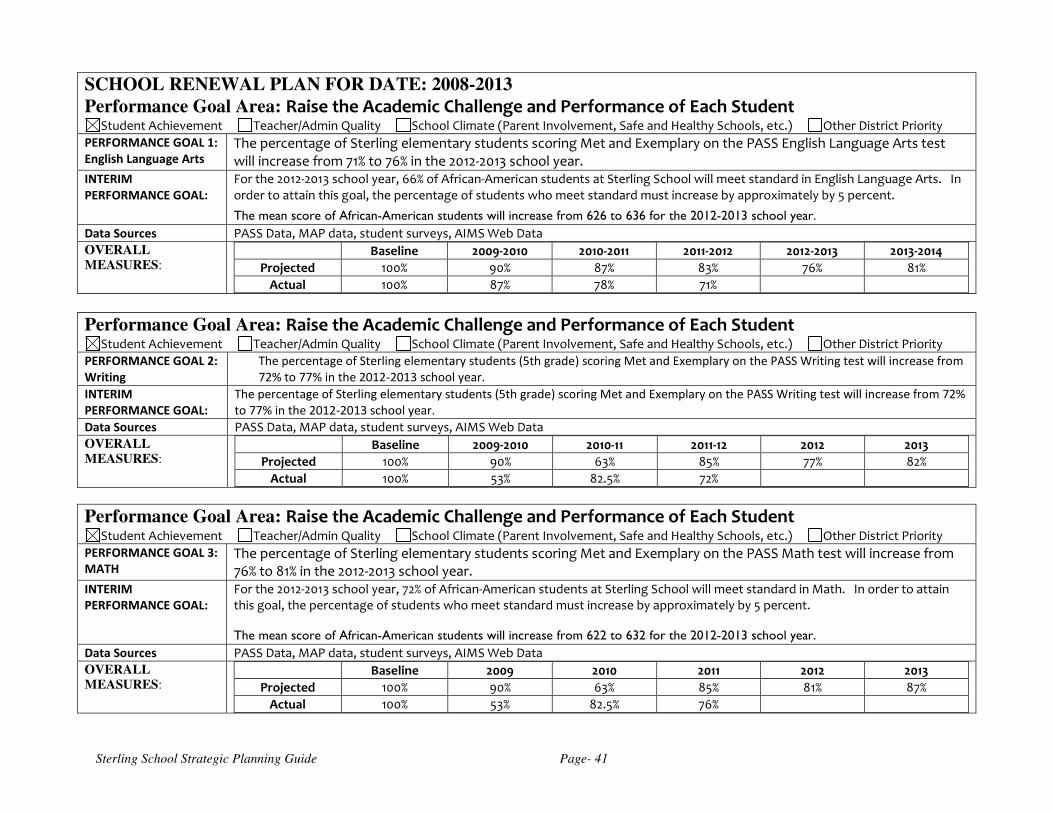
Sterling School Strategic Planning Guide Page- 41
SCHOOL RENEWAL PLAN FOR DATE: 2008-2013 Performance Goal Area: Raise the Academic Challenge and Performance of Each Student
Student Achievement Teacher/Admin Quality School Climate (Parent Involvement, Safe and Healthy Schools, etc.) Other District Priority
PERFORMANCE GOAL 1:
English Language Arts The percentage of Sterling elementary students scoring Met and Exemplary on the PASS English Language Arts test will increase from 71% to 76% in the 2012-2013 school year.
INTERIM
PERFORMANCE GOAL:
For the 2012-2013 school year, 66% of African-American students at Sterling School will meet standard in English Language Arts. In order to attain this goal, the percentage of students who meet standard must increase by approximately by 5 percent.
The mean score of African-American students will increase from 626 to 636 for the 2012-2013 school year.
Data Sources PASS Data, MAP data, student surveys, AIMS Web Data
OVERALL MEASURES:
Baseline 2009-2010 2010-2011 2011-2012 2012-2013 2013-2014
Projected 100% 90% 87% 83% 76% 81%
Actual 100% 87% 78% 71%
Performance Goal Area: Raise the Academic Challenge and Performance of Each Student Student Achievement Teacher/Admin Quality School Climate (Parent Involvement, Safe and Healthy Schools, etc.) Other District Priority
PERFORMANCE GOAL 2:
Writing
The percentage of Sterling elementary students (5th grade) scoring Met and Exemplary on the PASS Writing test will increase from
72% to 77% in the 2012-2013 school year.
INTERIM
PERFORMANCE GOAL:
The percentage of Sterling elementary students (5th grade) scoring Met and Exemplary on the PASS Writing test will increase from 72%
to 77% in the 2012-2013 school year.
Data Sources PASS Data, MAP data, student surveys, AIMS Web Data
OVERALL MEASURES:
Baseline 2009-2010 2010-11 2011-12 2012 2013
Projected 100% 90% 63% 85% 77% 82%
Actual 100% 53% 82.5% 72%
Performance Goal Area: Raise the Academic Challenge and Performance of Each Student Student Achievement Teacher/Admin Quality School Climate (Parent Involvement, Safe and Healthy Schools, etc.) Other District Priority
PERFORMANCE GOAL 3:
MATH The percentage of Sterling elementary students scoring Met and Exemplary on the PASS Math test will increase from 76% to 81% in the 2012-2013 school year.
INTERIM
PERFORMANCE GOAL:
For the 2012-2013 school year, 72% of African-American students at Sterling School will meet standard in Math. In order to attain this goal, the percentage of students who meet standard must increase by approximately by 5 percent. The mean score of African-American students will increase from 622 to 632 for the 2012-2013 school year.
Data Sources PASS Data, MAP data, student surveys, AIMS Web Data
OVERALL MEASURES:
Baseline 2009 2010 2011 2012 2013
Projected 100% 90% 63% 85% 81% 87%
Actual 100% 53% 82.5% 76%
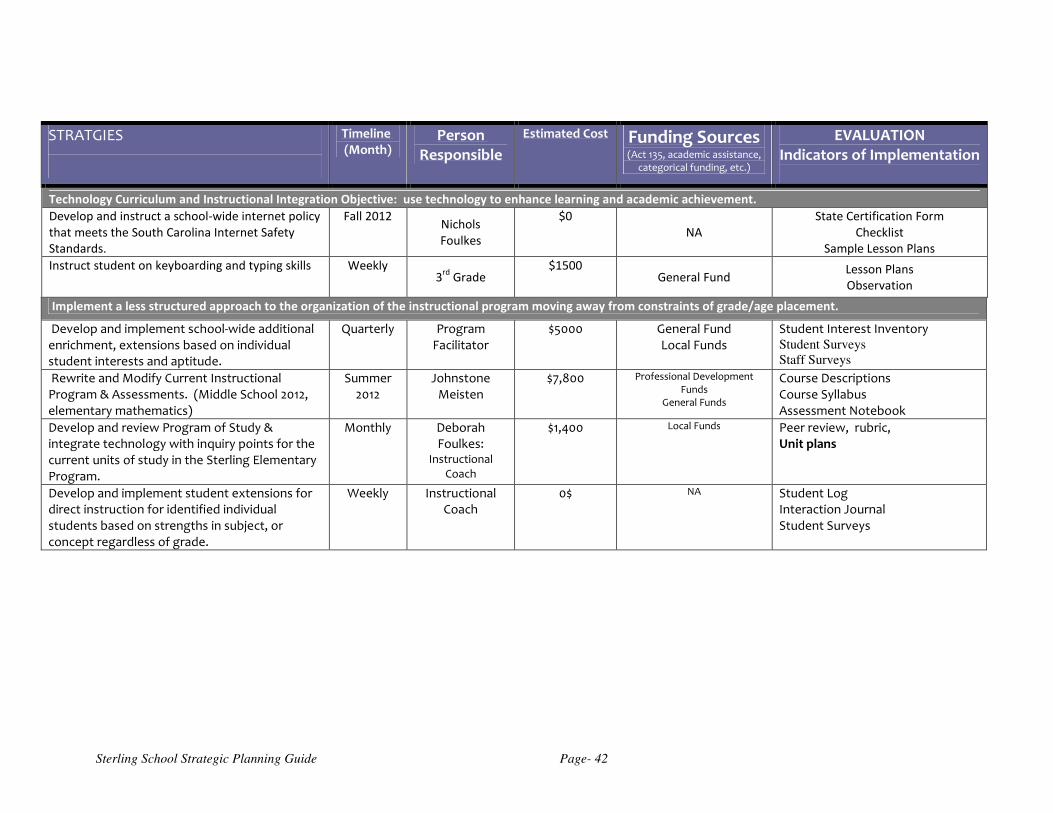
Sterling School Strategic Planning Guide Page- 42
STRATGIES
Timeline (Month)
Person Responsible
Estimated Cost Funding Sources (Act 135, academic assistance,
categorical funding, etc.)
EVALUATION Indicators of Implementation
Technology Curriculum and Instructional Integration Objective: use technology to enhance learning and academic achievement.
Develop and instruct a school-wide internet policy
that meets the South Carolina Internet Safety
Standards.
Fall 2012 Nichols
Foulkes
$0
NA
State Certification Form
Checklist
Sample Lesson Plans
Instruct student on keyboarding and typing skills Weekly 3
rd Grade
$1500 General Fund
Lesson Plans
Observation
Implement a less structured approach to the organization of the instructional program moving away from constraints of grade/age placement.
Develop and implement school-wide additional enrichment, extensions based on individual student interests and aptitude.
Quarterly Program Facilitator
$5000 General Fund Local Funds
Student Interest Inventory Student Surveys Staff Surveys
Rewrite and Modify Current Instructional Program & Assessments. (Middle School 2012, elementary mathematics)
Summer 2012
Johnstone Meisten
$7,800 Professional Development Funds
General Funds
Course Descriptions Course Syllabus Assessment Notebook
Develop and review Program of Study & integrate technology with inquiry points for the current units of study in the Sterling Elementary Program.
Monthly Deborah Foulkes:
Instructional Coach
$1,400 Local Funds Peer review, rubric, Unit plans
Develop and implement student extensions for direct instruction for identified individual students based on strengths in subject, or concept regardless of grade.
Weekly Instructional Coach
0$ NA Student Log Interaction Journal Student Surveys

Sterling School Strategic Planning Guide Page- 43
SCHOOL RENEWAL PLAN FOR DATE: 2008-2013 Performance Goal Area: Ensure Quality Personnel in All Positions
Student Achievement Teacher/Admin Quality School Climate (Parent Involvement, Safe and Healthy Schools, etc.) Other District Priority
PERFORMANCE
GOAL 3: All personnel will be highly qualified and specialized through 2012-13.
INTERIM
PERFORMANCE
GOAL:
(Specialized) Attract and retain teachers of high quality and preparation with teaching methods tailored to highly gifted students and/or inquiry based learning. The number of teachers with their gifted and Talented endorsement from 67% to 75%.
Data Sources Teacher certification data
OVERALL
MEASURES:
Baseline 2009 2010 2011 2012 2013
Projected 100% 100% 100% 100% 100% 100%
Actual 100% 100% 100% 100%
STRATGIES
Timeline (Month)
Person Responsible
Estimated Cost Funding Sources (Act 135, academic assistance,
categorical funding, etc.)
EVALUATION Indicators of Implementation
Technology Curriculum and Instructional Integration Objective: use technology to enhance learning and academic achievement.
Training to develop and instruct a school-wide
internet policy that meets the South Carolina
Internet Safety Standards.
Fall 2012 Nichols
Foulkes
$0
NA
State Certification Form
Checklist
Sample Lesson Plans
Training to develop electronic student portfolio
and identified technology to be used to document
student learning.
Quarterly
Johnstone
$5,000 General Funds
Local Funds
PTA
Lesson Plans
Observation
Objective: Implement a less structured approach to the organization of the instructional program moving away from constraints of grade/age placement.
Training to develop and implement school-wide additional enrichment, extensions based on individual student interests and aptitude.
Quarterly Program Facilitator
$5000 General Fund Local Funds
Student Interest Inventory Student Surveys Staff Surveys
Rewrite and Modify Current Instructional Program & Assessments. (Middle School 2012, elementary mathematics)
Summer 2012
Johnstone 12,000 Professional Development Funds
General Funds
Course Descriptions Course Syllabus Assessment Notebook
Continued training on inquiry based instructional strategies to develop and review Program of Study & integrate technology with inquiry points
Monthly Deborah Foulkes:
Instructional
$1,400 Local Funds Peer review, rubric, Unit plans
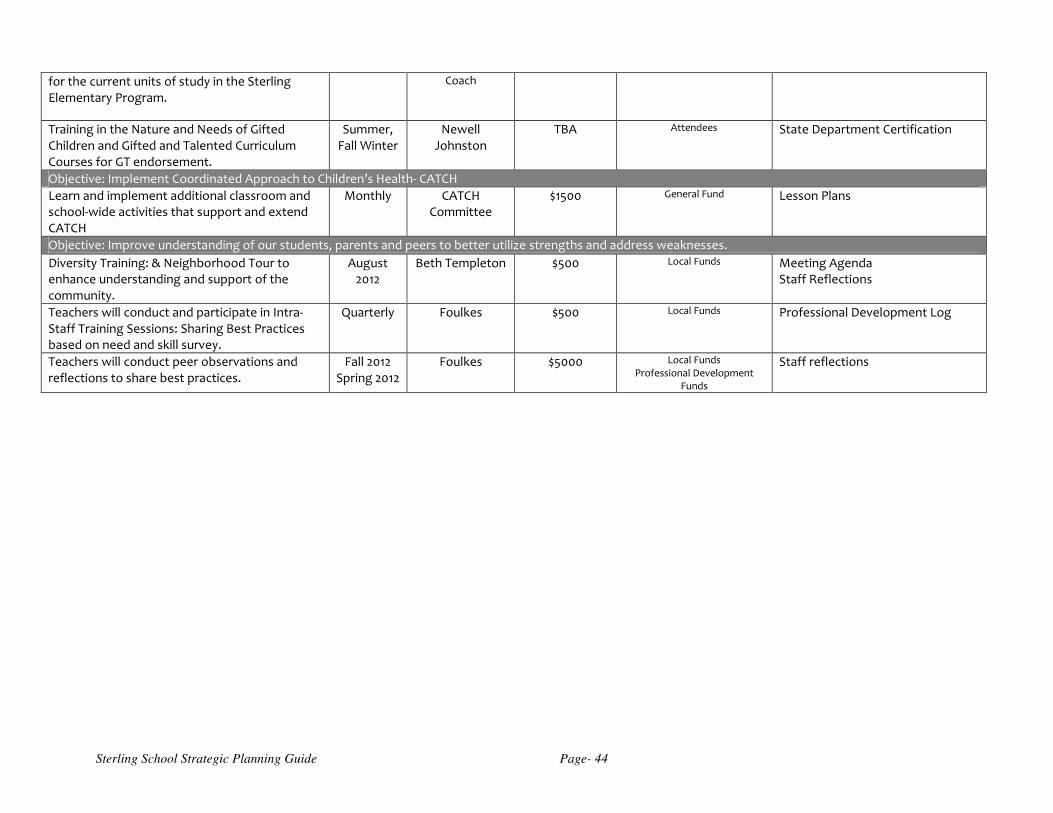
Sterling School Strategic Planning Guide Page- 44
for the current units of study in the Sterling Elementary Program.
Coach
Training in the Nature and Needs of Gifted Children and Gifted and Talented Curriculum Courses for GT endorsement.
Summer, Fall Winter
Newell Johnston
TBA Attendees State Department Certification
Objective: Implement Coordinated Approach to Children’s Health- CATCH
Learn and implement additional classroom and school-wide activities that support and extend CATCH
Monthly CATCH Committee
$1500 General Fund Lesson Plans
Objective: Improve understanding of our students, parents and peers to better utilize strengths and address weaknesses.
Diversity Training: & Neighborhood Tour to enhance understanding and support of the community.
August 2012
Beth Templeton $500 Local Funds Meeting Agenda Staff Reflections
Teachers will conduct and participate in Intra-Staff Training Sessions: Sharing Best Practices based on need and skill survey.
Quarterly Foulkes $500 Local Funds Professional Development Log
Teachers will conduct peer observations and reflections to share best practices.
Fall 2012 Spring 2012
Foulkes $5000 Local Funds Professional Development
Funds
Staff reflections
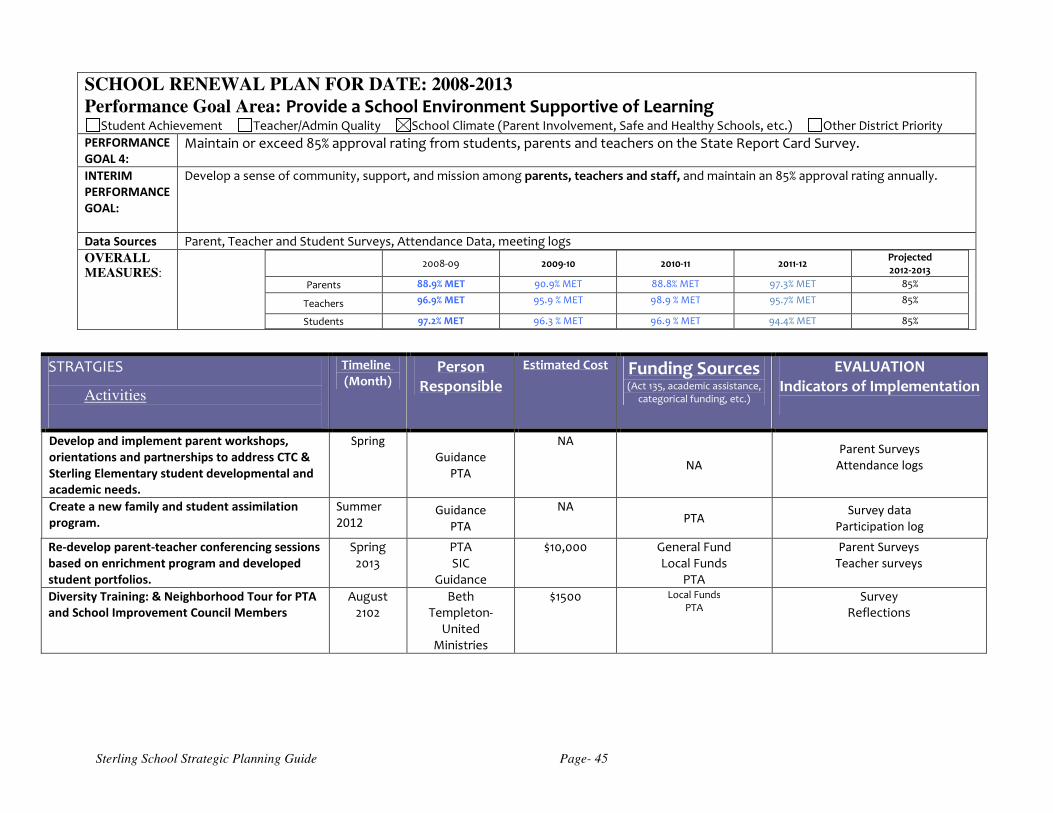
Sterling School Strategic Planning Guide Page- 45
SCHOOL RENEWAL PLAN FOR DATE: 2008-2013 Performance Goal Area: Provide a School Environment Supportive of Learning
Student Achievement Teacher/Admin Quality School Climate (Parent Involvement, Safe and Healthy Schools, etc.) Other District Priority
PERFORMANCE
GOAL 4: Maintain or exceed 85% approval rating from students, parents and teachers on the State Report Card Survey.
INTERIM
PERFORMANCE
GOAL:
Develop a sense of community, support, and mission among parents, teachers and staff, and maintain an 85% approval rating annually.
Data Sources Parent, Teacher and Student Surveys, Attendance Data, meeting logs
OVERALL MEASURES:
2008-09 2009-10 2010-11 2011-12 Projected 2012-2013
Parents 88.9% MET 90.9% MET 88.8% MET 97.3% MET 85%
Teachers 96.9% MET 95.9 % MET 98.9 % MET 95.7% MET 85%
Students 97.2% MET 96.3 % MET 96.9 % MET 94.4% MET 85%
STRATGIES
Activities
Timeline (Month)
Person Responsible
Estimated Cost Funding Sources (Act 135, academic assistance,
categorical funding, etc.)
EVALUATION Indicators of Implementation
Develop and implement parent workshops,
orientations and partnerships to address CTC &
Sterling Elementary student developmental and
academic needs.
Spring
Guidance
PTA
NA
NA
Parent Surveys
Attendance logs
Create a new family and student assimilation
program.
Summer
2012 Guidance
PTA
NA PTA
Survey data
Participation log
Re-develop parent-teacher conferencing sessions
based on enrichment program and developed
student portfolios.
Spring 2013
PTA SIC
Guidance
$10,000 General Fund Local Funds
PTA
Parent Surveys
Teacher surveys
Diversity Training: & Neighborhood Tour for PTA
and School Improvement Council Members
August 2102
Beth Templeton-
United Ministries
$1500 Local Funds PTA
Survey Reflections
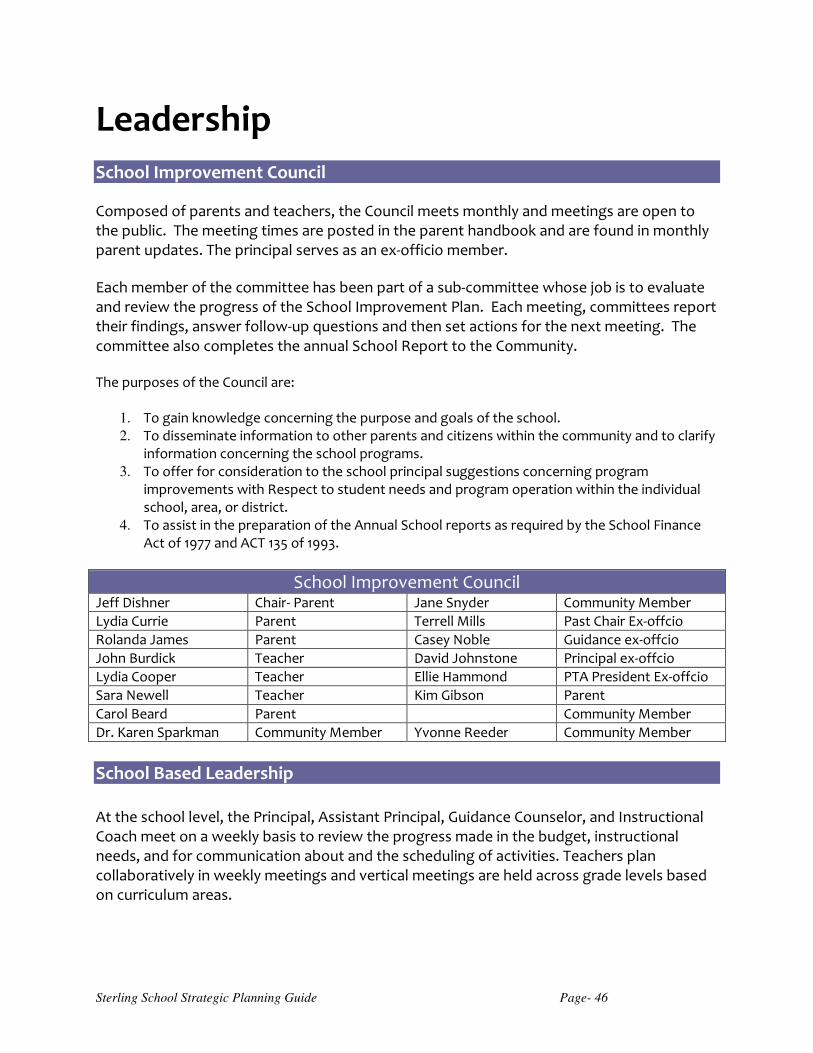
Sterling School Strategic Planning Guide Page- 46
Leadership
School Improvement Council
Composed of parents and teachers, the Council meets monthly and meetings are open to the public. The meeting times are posted in the parent handbook and are found in monthly parent updates. The principal serves as an ex-officio member.
Each member of the committee has been part of a sub-committee whose job is to evaluate and review the progress of the School Improvement Plan. Each meeting, committees report their findings, answer follow-up questions and then set actions for the next meeting. The committee also completes the annual School Report to the Community. The purposes of the Council are:
1. To gain knowledge concerning the purpose and goals of the school. 2. To disseminate information to other parents and citizens within the community and to clarify
information concerning the school programs. 3. To offer for consideration to the school principal suggestions concerning program
improvements with Respect to student needs and program operation within the individual school, area, or district.
4. To assist in the preparation of the Annual School reports as required by the School Finance Act of 1977 and ACT 135 of 1993.
School Improvement Council Jeff Dishner Chair- Parent Jane Snyder Community Member
Lydia Currie Parent Terrell Mills Past Chair Ex-offcio
Rolanda James Parent Casey Noble Guidance ex-offcio
John Burdick Teacher David Johnstone Principal ex-offcio
Lydia Cooper Teacher Ellie Hammond PTA President Ex-offcio
Sara Newell Teacher Kim Gibson Parent
Carol Beard Parent Community Member
Dr. Karen Sparkman Community Member Yvonne Reeder Community Member
School Based Leadership At the school level, the Principal, Assistant Principal, Guidance Counselor, and Instructional Coach meet on a weekly basis to review the progress made in the budget, instructional needs, and for communication about and the scheduling of activities. Teachers plan collaboratively in weekly meetings and vertical meetings are held across grade levels based on curriculum areas.
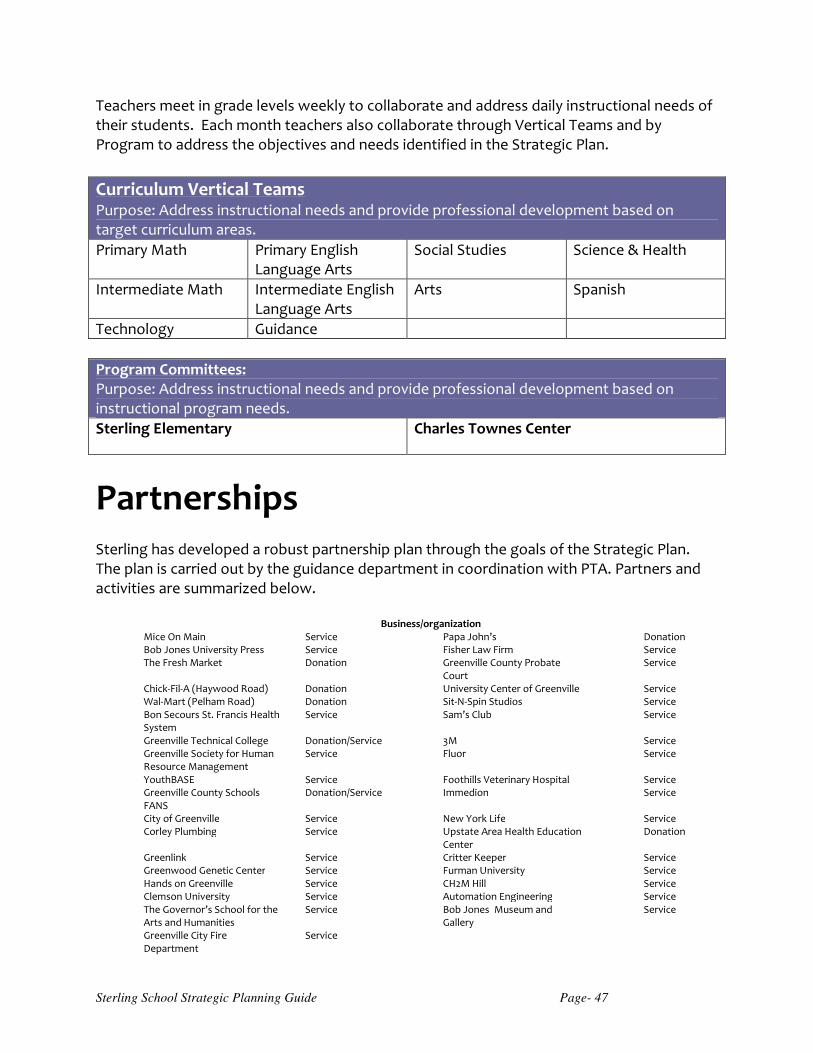
Sterling School Strategic Planning Guide Page- 47
Teachers meet in grade levels weekly to collaborate and address daily instructional needs of their students. Each month teachers also collaborate through Vertical Teams and by Program to address the objectives and needs identified in the Strategic Plan.
Curriculum Vertical Teams Purpose: Address instructional needs and provide professional development based on target curriculum areas.
Primary Math Primary English Language Arts
Social Studies Science & Health
Intermediate Math Intermediate English Language Arts
Arts Spanish
Technology Guidance
Program Committees: Purpose: Address instructional needs and provide professional development based on instructional program needs.
Sterling Elementary
Charles Townes Center
Partnerships Sterling has developed a robust partnership plan through the goals of the Strategic Plan. The plan is carried out by the guidance department in coordination with PTA. Partners and activities are summarized below.
Business/organization
Mice On Main Service Papa John’s Donation Bob Jones University Press Service Fisher Law Firm Service The Fresh Market Donation Greenville County Probate
Court Service
Chick-Fil-A (Haywood Road) Donation University Center of Greenville Service Wal-Mart (Pelham Road) Donation Sit-N-Spin Studios Service Bon Secours St. Francis Health System
Service Sam’s Club Service
Greenville Technical College Donation/Service 3M Service Greenville Society for Human Resource Management
Service Fluor Service
YouthBASE Service Foothills Veterinary Hospital Service Greenville County Schools FANS
Donation/Service Immedion Service
City of Greenville Service New York Life Service Corley Plumbing Service Upstate Area Health Education
Center Donation
Greenlink Service Critter Keeper Service Greenwood Genetic Center Service Furman University Service Hands on Greenville Service CH2M Hill Service Clemson University Service Automation Engineering Service The Governor’s School for the Arts and Humanities
Service Bob Jones Museum and Gallery
Service
Greenville City Fire Department
Service
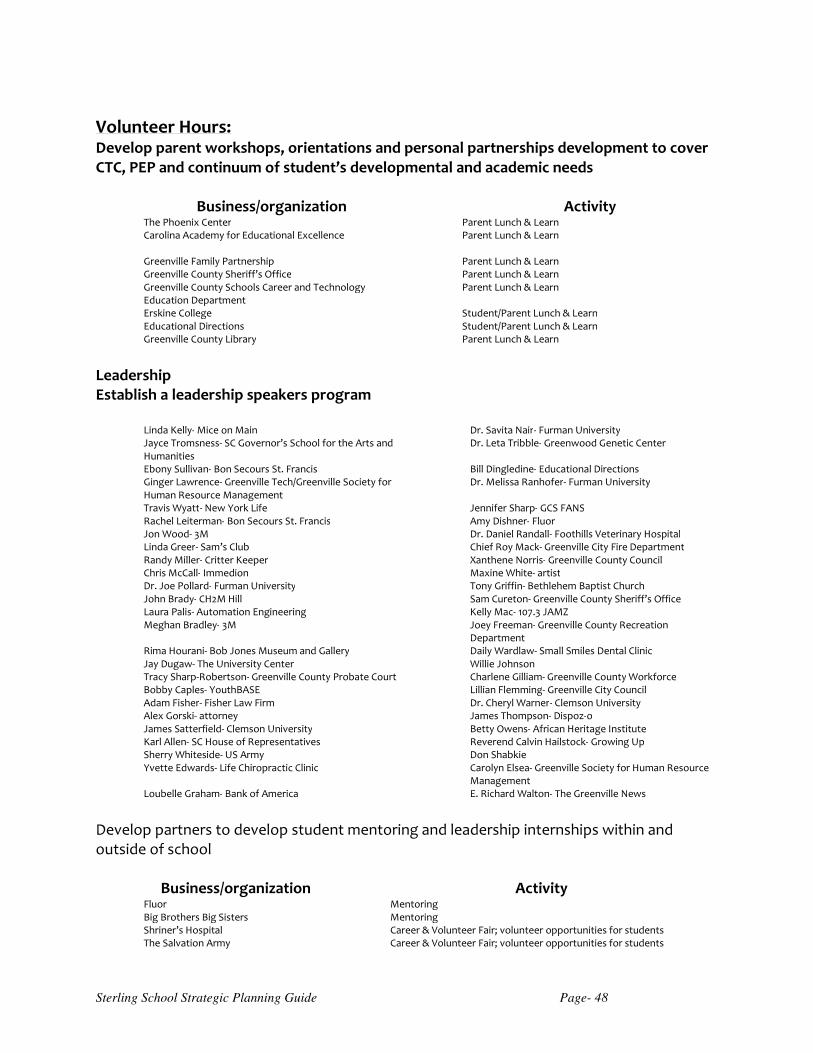
Sterling School Strategic Planning Guide Page- 48
Volunteer Hours: Develop parent workshops, orientations and personal partnerships development to cover CTC, PEP and continuum of student’s developmental and academic needs
Business/organization Activity The Phoenix Center Parent Lunch & Learn Carolina Academy for Educational Excellence
Parent Lunch & Learn
Greenville Family Partnership Parent Lunch & Learn Greenville County Sheriff’s Office Parent Lunch & Learn Greenville County Schools Career and Technology Education Department
Parent Lunch & Learn
Erskine College Student/Parent Lunch & Learn Educational Directions Student/Parent Lunch & Learn Greenville County Library Parent Lunch & Learn
Leadership Establish a leadership speakers program
Linda Kelly- Mice on Main Dr. Savita Nair- Furman University Jayce Tromsness- SC Governor’s School for the Arts and Humanities
Dr. Leta Tribble- Greenwood Genetic Center
Ebony Sullivan- Bon Secours St. Francis Bill Dingledine- Educational Directions Ginger Lawrence- Greenville Tech/Greenville Society for Human Resource Management
Dr. Melissa Ranhofer- Furman University
Travis Wyatt- New York Life Jennifer Sharp- GCS FANS Rachel Leiterman- Bon Secours St. Francis Amy Dishner- Fluor Jon Wood- 3M Dr. Daniel Randall- Foothills Veterinary Hospital Linda Greer- Sam’s Club Chief Roy Mack- Greenville City Fire Department Randy Miller- Critter Keeper Xanthene Norris- Greenville County Council Chris McCall- Immedion Maxine White- artist Dr. Joe Pollard- Furman University Tony Griffin- Bethlehem Baptist Church John Brady- CH2M Hill Sam Cureton- Greenville County Sheriff’s Office Laura Palis- Automation Engineering Kelly Mac- 107.3 JAMZ Meghan Bradley- 3M Joey Freeman- Greenville County Recreation
Department Rima Hourani- Bob Jones Museum and Gallery Daily Wardlaw- Small Smiles Dental Clinic Jay Dugaw- The University Center Willie Johnson Tracy Sharp-Robertson- Greenville County Probate Court Charlene Gilliam- Greenville County Workforce Bobby Caples- YouthBASE Lillian Flemming- Greenville City Council Adam Fisher- Fisher Law Firm Dr. Cheryl Warner- Clemson University Alex Gorski- attorney James Thompson- Dispoz-o James Satterfield- Clemson University Betty Owens- African Heritage Institute Karl Allen- SC House of Representatives Reverend Calvin Hailstock- Growing Up Sherry Whiteside- US Army Don Shabkie Yvette Edwards- Life Chiropractic Clinic Carolyn Elsea- Greenville Society for Human Resource
Management Loubelle Graham- Bank of America E. Richard Walton- The Greenville News
Develop partners to develop student mentoring and leadership internships within and outside of school
Business/organization Activity
Fluor Mentoring Big Brothers Big Sisters Mentoring Shriner’s Hospital Career & Volunteer Fair; volunteer opportunities for students The Salvation Army Career & Volunteer Fair; volunteer opportunities for students
Sterling School Strategic Planning Guide Page- 49
The Children’s Museum Career & Volunteer Fair; volunteer opportunities for students United Way Career & Volunteer Fair; volunteer opportunities for students Loaves and Fishes Career & Volunteer Fair; volunteer opportunities for students Miracle Hill Career & Volunteer Fair; volunteer opportunities for students SC Vocational Rehabilitation Career & Volunteer Fair; volunteer opportunities for students Greenville Humane Society Career & Volunteer Fair; volunteer opportunities for students A Child’s Haven Career & Volunteer Fair; volunteer opportunities for students United Ministries Career & Volunteer Fair; volunteer opportunities for students Boy Scouts of America Blue Ridge Council
Career & Volunteer Fair; volunteer opportunities for students
Ronald McDonald House Career & Volunteer Fair; volunteer opportunities for students Hands on Greenville Career & Volunteer Fair; volunteer opportunities for students
8th grade job shadowing hosts Ronald S. Wilson, DMD Hubbell Inc. The Reynolds Company- Adhesives and Coatings Cupcake Couture and Catering Roper Mountain Science Center Simpsonville Dental Associates Florence + Hutcheson O-Cha Tea Bar Furman University Sit N' Spin Family Practice Associates of Easley Downtown Coffee House and Creamery The Children's Clinic DP3 Architects Pediatric and Adolescent Dentistry Chldren's Hospital Outpatient Center Cancer Center of the Carolinas Smith Moore Leatherwood, LLP Fine Arts Center Justin's Annette Duncan (self-employed) Beck Academy The Greenville Zoo Fluor Pazdan-Smith Group Architects Plain Elementary Greenville Humane Society Greenville Forward Simpsonville City Hall Eastside Guitars and Drums Team Greenville Clemson University Genetics Dept. Urban and Coastal Renovations Pinnacle Interior Design Studios Automation Engineering The City of Geenville O'Neal Foothills Pediatric Hubbell Inc.
Page 50
Appendix A
DISTRICT PROFILE
Greenville County Schools (GCS) is widely recognized as a leader in public education. Serving over 70,900 students, GCS is the largest public school system in South Carolina. According to the latest publication from the National Center of Education Statistics, GCS is the 54th largest school district in the nation. The area served by GCS covers over 800 square miles and includes almost all of Greenville County and portions of Laurens and Spartanburg Counties. The District facilities include 6 child development centers, 49 elementary schools, 18 middle schools, 14 high schools, 4 career centers, and 7 special focus centers. Among the elementary, middle, and high schools, 12 International Baccalaureate programs and 11 magnet academics operate, providing unique educational opportunities, including concentrations in foreign language, communication arts, pre-engineering, and science and technology. GCS has 17 schools receiving federal funding from Title I. Title I funds allow schools to provide opportunities for children to acquire the knowledge and skills contained in the challenging state content standards. The GCS Title I program provides enriched and accelerated educational programs. These programs include school-wide programs that provide additional staffing, professional development, and parent involvement programs to help parents participate in the education of their children at home and at school. GCS serves a culturally diverse population of students. The racial/ethnic make-up of students in GCS in 2009-2010 was 59.4% white, 26.0% African-American, 10.9% Hispanic, 2.6% Asian, and 0.3% Native American. Dedicated to meeting the educational needs of all students, GCS serves over 10,251 (14.4%) students with disabilities. Of those, over 7,955 are students with disabilities more severe than speech and an additional 2,296 are students with speech disabilities. Additionally, 14,176 (20.0%) GCS students participate in the District’s gifted and talented program. GCS also serves over 5,800 (8.2%) K-12 students who meet the state specifications for English for Speakers of Other Languages (ESOL). GCS stresses the importance of daily attendance for all students and teachers. As reported in the 2009-2010 annual District Report Card, GCS had an average student attendance rate of 95.9% and a teacher attendance rate of 97.5%. The annual student dropout rate was 3.6%. There are 5,074 teachers in the District; 63.5% hold Master’s degrees or higher and 605 are National Board Certified. The average teacher salary in 2009-2010 was $46,593. Thirteen Greenville County schools have been named National Blue Ribbon Schools of Excellence. Over the last thirty years, 20 Greenville County schools have been designated Palmetto’s Finest Schools, our state’s highest honor for schools. In May 2010, 15 Greenville County schools were identified as Red Carpet Schools for their efforts to provide the highest level of customer service to their parents and school community. Forty-eight Greenville County schools have received the honor at least once. Twenty-nine schools are part of the PTA National Schools of Excellence, and 34 schools have been identified as Baldrige Model Schools. Additionally, GCS staff have garnered several prestigious state awards in the last year, including SC Teacher of the Year, SC Secondary Principal of the Year, and SC Superintendent of the Year. Finally, 88% of our 2010 graduates went on to pursue higher education and earned approximately $82.7 million in academic scholarships, including 12 seniors who earned National Merit Scholarships.
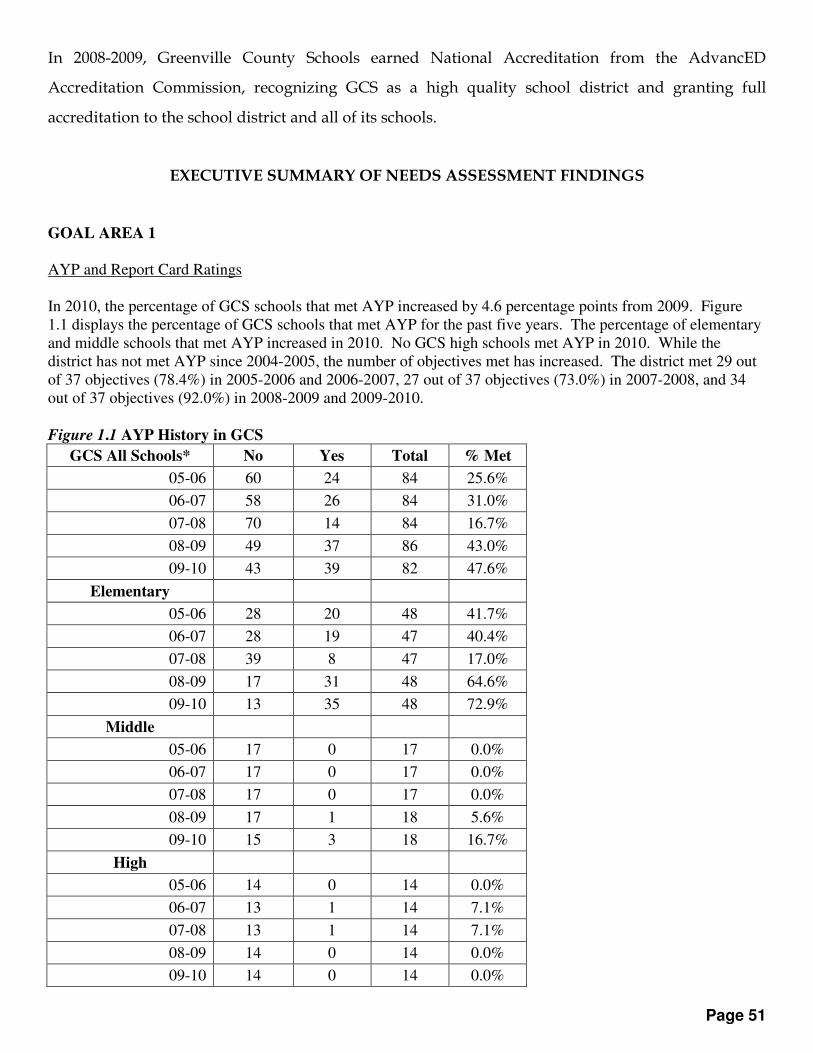
Page 51
In 2008-2009, Greenville County Schools earned National Accreditation from the AdvancED
Accreditation Commission, recognizing GCS as a high quality school district and granting full
accreditation to the school district and all of its schools.
EXECUTIVE SUMMARY OF NEEDS ASSESSMENT FINDINGS
GOAL AREA 1 AYP and Report Card Ratings In 2010, the percentage of GCS schools that met AYP increased by 4.6 percentage points from 2009. Figure 1.1 displays the percentage of GCS schools that met AYP for the past five years. The percentage of elementary and middle schools that met AYP increased in 2010. No GCS high schools met AYP in 2010. While the district has not met AYP since 2004-2005, the number of objectives met has increased. The district met 29 out of 37 objectives (78.4%) in 2005-2006 and 2006-2007, 27 out of 37 objectives (73.0%) in 2007-2008, and 34 out of 37 objectives (92.0%) in 2008-2009 and 2009-2010.
Figure 1.1 AYP History in GCS
GCS All Schools* No Yes Total % Met
05-06 60 24 84 25.6%
06-07 58 26 84 31.0%
07-08 70 14 84 16.7%
08-09 49 37 86 43.0%
09-10 43 39 82 47.6%
Elementary
05-06 28 20 48 41.7%
06-07 28 19 47 40.4%
07-08 39 8 47 17.0%
08-09 17 31 48 64.6%
09-10 13 35 48 72.9%
Middle
05-06 17 0 17 0.0%
06-07 17 0 17 0.0%
07-08 17 0 17 0.0%
08-09 17 1 18 5.6%
09-10 15 3 18 16.7%
High
05-06 14 0 14 0.0%
06-07 13 1 14 7.1%
07-08 13 1 14 7.1%
08-09 14 0 14 0.0%
09-10 14 0 14 0.0%
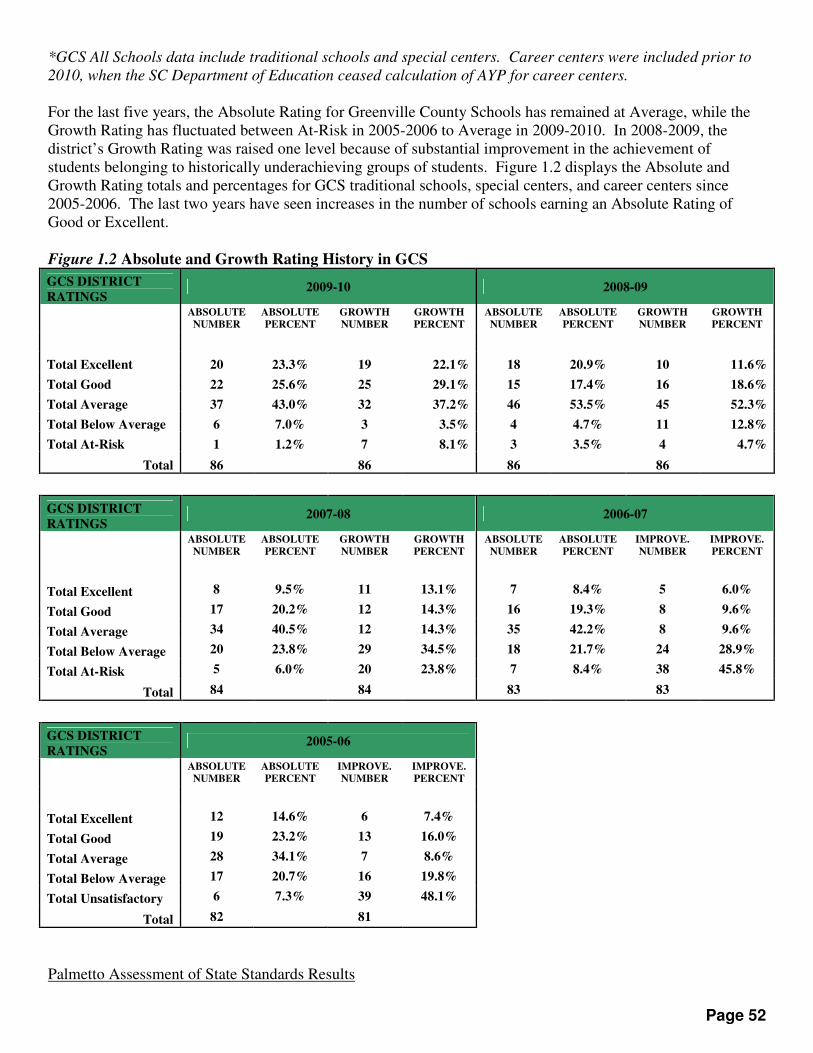
Page 52
*GCS All Schools data include traditional schools and special centers. Career centers were included prior to
2010, when the SC Department of Education ceased calculation of AYP for career centers.
For the last five years, the Absolute Rating for Greenville County Schools has remained at Average, while the Growth Rating has fluctuated between At-Risk in 2005-2006 to Average in 2009-2010. In 2008-2009, the district’s Growth Rating was raised one level because of substantial improvement in the achievement of students belonging to historically underachieving groups of students. Figure 1.2 displays the Absolute and Growth Rating totals and percentages for GCS traditional schools, special centers, and career centers since 2005-2006. The last two years have seen increases in the number of schools earning an Absolute Rating of Good or Excellent. Figure 1.2 Absolute and Growth Rating History in GCS
GCS DISTRICT
RATINGS 2009-10 2008-09
ABSOLUTE
NUMBER
ABSOLUTE
PERCENT
GROWTH
NUMBER
GROWTH
PERCENT
ABSOLUTE
NUMBER
ABSOLUTE
PERCENT
GROWTH
NUMBER
GROWTH
PERCENT
Total Excellent 20 23.3% 19 22.1% 18 20.9% 10 11.6%
Total Good 22 25.6% 25 29.1% 15 17.4% 16 18.6%
Total Average 37 43.0% 32 37.2% 46 53.5% 45 52.3%
Total Below Average 6 7.0% 3 3.5% 4 4.7% 11 12.8%
Total At-Risk 1 1.2% 7 8.1% 3 3.5% 4 4.7%
Total 86 86 86 86
GCS DISTRICT
RATINGS 2007-08 2006-07
ABSOLUTE
NUMBER
ABSOLUTE
PERCENT
GROWTH
NUMBER
GROWTH
PERCENT
ABSOLUTE
NUMBER
ABSOLUTE
PERCENT
IMPROVE.
NUMBER
IMPROVE.
PERCENT
Total Excellent 8 9.5% 11 13.1% 7 8.4% 5 6.0%
Total Good 17 20.2% 12 14.3% 16 19.3% 8 9.6%
Total Average 34 40.5% 12 14.3% 35 42.2% 8 9.6%
Total Below Average 20 23.8% 29 34.5% 18 21.7% 24 28.9%
Total At-Risk 5 6.0% 20 23.8% 7 8.4% 38 45.8%
Total 84 84 83 83
GCS DISTRICT
RATINGS 2005-06
ABSOLUTE
NUMBER
ABSOLUTE
PERCENT
IMPROVE.
NUMBER
IMPROVE.
PERCENT
Total Excellent 12 14.6% 6 7.4%
Total Good 19 23.2% 13 16.0%
Total Average 28 34.1% 7 8.6%
Total Below Average 17 20.7% 16 19.8%
Total Unsatisfactory 6 7.3% 39 48.1%
Total 82 81
Palmetto Assessment of State Standards Results
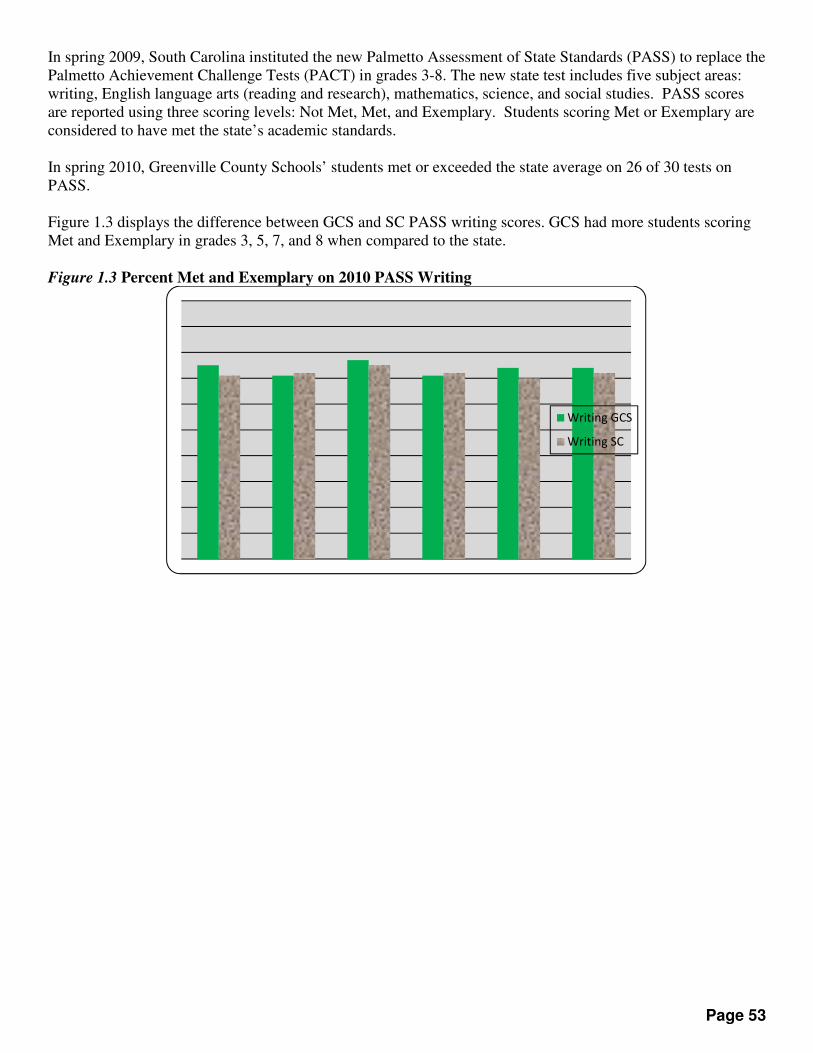
Page 53
In spring 2009, South Carolina instituted the new Palmetto Assessment of State Standards (PASS) to replace the Palmetto Achievement Challenge Tests (PACT) in grades 3-8. The new state test includes five subject areas: writing, English language arts (reading and research), mathematics, science, and social studies. PASS scores are reported using three scoring levels: Not Met, Met, and Exemplary. Students scoring Met or Exemplary are considered to have met the state’s academic standards. In spring 2010, Greenville County Schools’ students met or exceeded the state average on 26 of 30 tests on PASS. Figure 1.3 displays the difference between GCS and SC PASS writing scores. GCS had more students scoring Met and Exemplary in grades 3, 5, 7, and 8 when compared to the state.
Figure 1.3 Percent Met and Exemplary on 2010 PASS Writing
Writing GCS
Writing SC

Page 54
ELA GCS
ELA SC
Figure 1.4 displays the difference between GCS and SC PASS ELA (Reading/Research) scores. GCS had more students scoring Met and Exemplary in grades 3, 4, 5 and 8 when compared to the state.
Figure 1.4 Percent Met and Exemplary on 2010 PASS ELA (Reading and Research)
Figure 1.5 displays the difference between GCS and SC PASS math scores. GCS had more students scoring
Met and Exemplary in grades 3, 4, 5 and 8 when compared to the state. Figure 1.5 Percent Met and Exemplary on 2010 PASS Math
Math GCS
Math SC

Page 55
Figure 1.6 displays the difference between GCS and SC PASS science scores. GCS had more students scoring Met and Exemplary in grades 3, 4, 5, 6, and 8 when compared to the state.
Figure 1.6 Percent Met and Exemplary on 2010 PASS Science
Figure 1.7 displays the difference between GCS and SC PASS social studies scores. GCS had more students scoring Met and Exemplary in grades 3, 4, 5, and 8 when compared to the state. Figure 1.7 Percent Met and Exemplary on 2010 PASS Social Studies
Science GCS
Science SC
Social Studies GCS
Social Studies SC
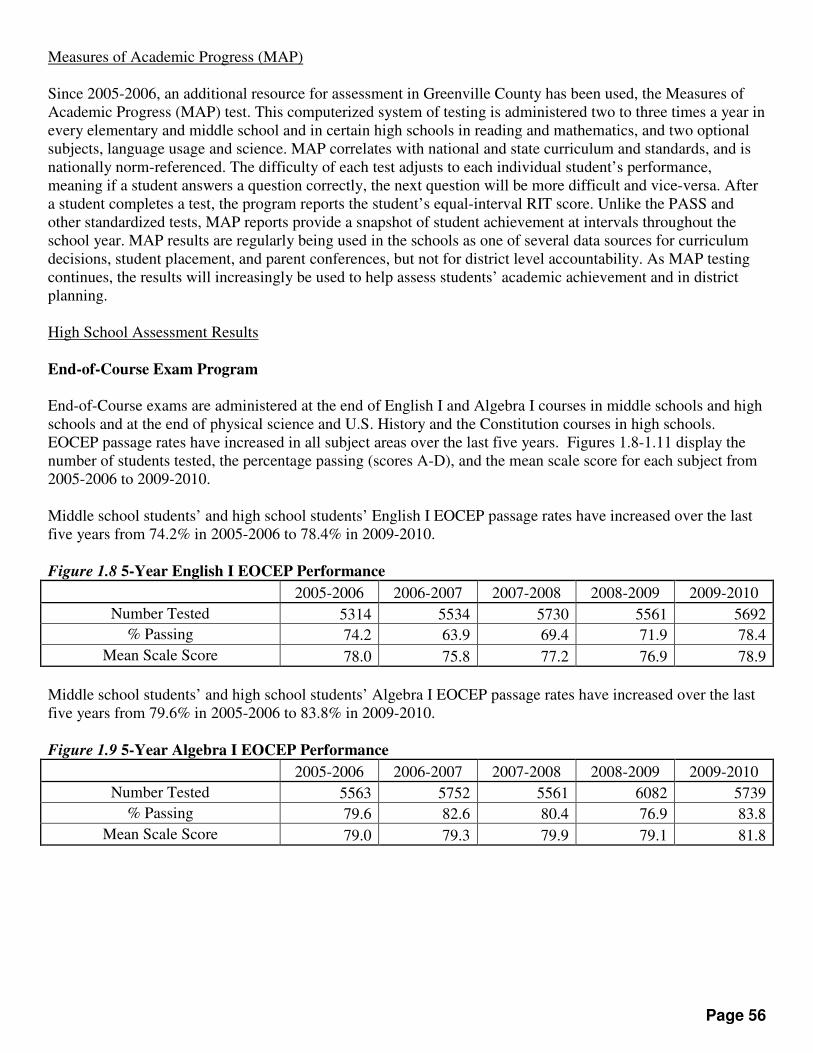
Page 56
Measures of Academic Progress (MAP) Since 2005-2006, an additional resource for assessment in Greenville County has been used, the Measures of Academic Progress (MAP) test. This computerized system of testing is administered two to three times a year in every elementary and middle school and in certain high schools in reading and mathematics, and two optional subjects, language usage and science. MAP correlates with national and state curriculum and standards, and is nationally norm-referenced. The difficulty of each test adjusts to each individual student’s performance, meaning if a student answers a question correctly, the next question will be more difficult and vice-versa. After a student completes a test, the program reports the student’s equal-interval RIT score. Unlike the PASS and other standardized tests, MAP reports provide a snapshot of student achievement at intervals throughout the school year. MAP results are regularly being used in the schools as one of several data sources for curriculum decisions, student placement, and parent conferences, but not for district level accountability. As MAP testing continues, the results will increasingly be used to help assess students’ academic achievement and in district planning. High School Assessment Results End-of-Course Exam Program End-of-Course exams are administered at the end of English I and Algebra I courses in middle schools and high schools and at the end of physical science and U.S. History and the Constitution courses in high schools. EOCEP passage rates have increased in all subject areas over the last five years. Figures 1.8-1.11 display the number of students tested, the percentage passing (scores A-D), and the mean scale score for each subject from 2005-2006 to 2009-2010. Middle school students’ and high school students’ English I EOCEP passage rates have increased over the last five years from 74.2% in 2005-2006 to 78.4% in 2009-2010. Figure 1.8 5-Year English I EOCEP Performance
2005-2006 2006-2007 2007-2008 2008-2009 2009-2010
Number Tested 5314 5534 5730 5561 5692
% Passing 74.2 63.9 69.4 71.9 78.4
Mean Scale Score 78.0 75.8 77.2 76.9 78.9
Middle school students’ and high school students’ Algebra I EOCEP passage rates have increased over the last five years from 79.6% in 2005-2006 to 83.8% in 2009-2010. Figure 1.9 5-Year Algebra I EOCEP Performance
2005-2006 2006-2007 2007-2008 2008-2009 2009-2010
Number Tested 5563 5752 5561 6082 5739
% Passing 79.6 82.6 80.4 76.9 83.8
Mean Scale Score 79.0 79.3 79.9 79.1 81.8
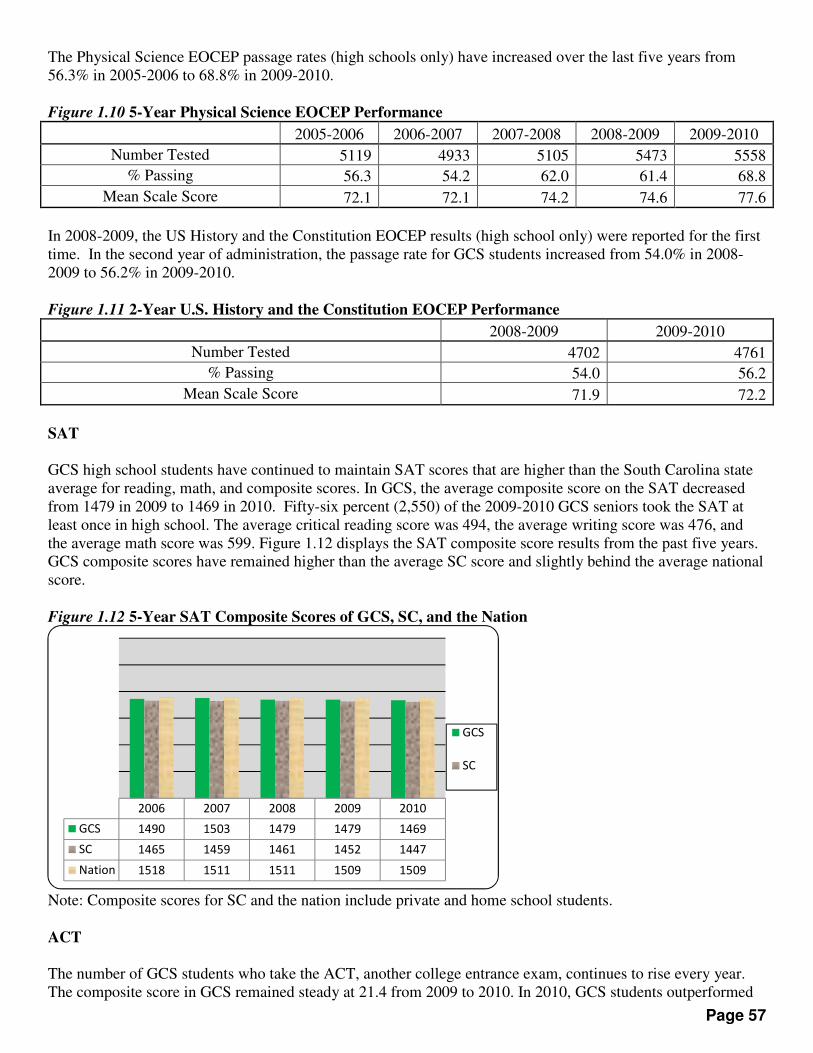
Page 57
The Physical Science EOCEP passage rates (high schools only) have increased over the last five years from 56.3% in 2005-2006 to 68.8% in 2009-2010. Figure 1.10 5-Year Physical Science EOCEP Performance
2005-2006 2006-2007 2007-2008 2008-2009 2009-2010
Number Tested 5119 4933 5105 5473 5558
% Passing 56.3 54.2 62.0 61.4 68.8
Mean Scale Score 72.1 72.1 74.2 74.6 77.6
In 2008-2009, the US History and the Constitution EOCEP results (high school only) were reported for the first time. In the second year of administration, the passage rate for GCS students increased from 54.0% in 2008-2009 to 56.2% in 2009-2010. Figure 1.11 2-Year U.S. History and the Constitution EOCEP Performance
2008-2009 2009-2010
Number Tested 4702 4761
% Passing 54.0 56.2
Mean Scale Score 71.9 72.2
SAT GCS high school students have continued to maintain SAT scores that are higher than the South Carolina state average for reading, math, and composite scores. In GCS, the average composite score on the SAT decreased from 1479 in 2009 to 1469 in 2010. Fifty-six percent (2,550) of the 2009-2010 GCS seniors took the SAT at least once in high school. The average critical reading score was 494, the average writing score was 476, and the average math score was 599. Figure 1.12 displays the SAT composite score results from the past five years. GCS composite scores have remained higher than the average SC score and slightly behind the average national score.
Figure 1.12 5-Year SAT Composite Scores of GCS, SC, and the Nation
Note: Composite scores for SC and the nation include private and home school students.
ACT The number of GCS students who take the ACT, another college entrance exam, continues to rise every year. The composite score in GCS remained steady at 21.4 from 2009 to 2010. In 2010, GCS students outperformed
2006 2007 2008 2009 2010
GCS 1490 1503 1479 1479 1469
SC 1465 1459 1461 1452 1447
Nation 1518 1511 1511 1509 1509
GCS
SC
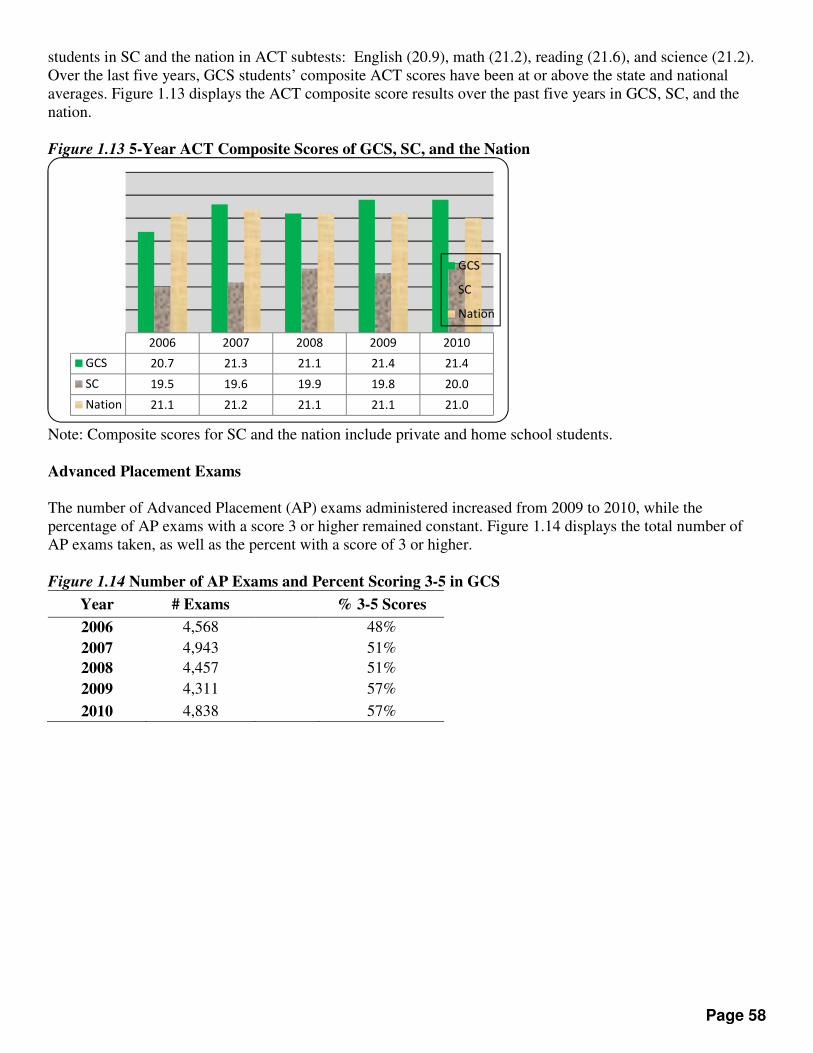
Page 58
students in SC and the nation in ACT subtests: English (20.9), math (21.2), reading (21.6), and science (21.2). Over the last five years, GCS students’ composite ACT scores have been at or above the state and national averages. Figure 1.13 displays the ACT composite score results over the past five years in GCS, SC, and the nation. Figure 1.13 5-Year ACT Composite Scores of GCS, SC, and the Nation
Note: Composite scores for SC and the nation include private and home school students. Advanced Placement Exams The number of Advanced Placement (AP) exams administered increased from 2009 to 2010, while the percentage of AP exams with a score 3 or higher remained constant. Figure 1.14 displays the total number of AP exams taken, as well as the percent with a score of 3 or higher.
Figure 1.14 Number of AP Exams and Percent Scoring 3-5 in GCS
Year # Exams % 3-5 Scores
2006 4,568 48%
2007 4,943 51%
2008 4,457 51%
2009 4,311 57%
2010 4,838 57%
2006 2007 2008 2009 2010
GCS 20.7 21.3 21.1 21.4 21.4
SC 19.5 19.6 19.9 19.8 20.0
Nation 21.1 21.2 21.1 21.1 21.0
GCS
SC
Nation

Page 59
High School Assessment Program South Carolina students take participate in the High School Assessment Program (HSAP) in their second year in high school and must pass both the ELA and math portions in order to receive a state high school diploma. HSAP scores are reported using four scoring levels: Level 1, Level 2, Level 3, and Level 4. A score of Level 2 is considered passing. The last five years of data for HSAP are shown in Figure 1.15. Over the last several years, GCS first attempt HSAP passage rates have remained above the state’s passage rates.
Figure 1.15 Percent of Students Passing Both Sections of HSAP on 1st Attempt
Note: The SC Dept. of Education began reporting scores for all students tested in 2009. The Achievement Gap
The achievement gap for students receiving free or reduced-priced meals and students paying full-price for meals must continue to be a high priority need for improvement in Greenville County Schools. Figure 1.16 displays the difference in PASS scores in 2009 and 2010 between students paying full price for meals and students receiving free or reduced-priced meals (FARM). The gap between full-pay and FARM students exists in all subjects and has not significantly decreased over the last two years. The gap for all subjects ranged from 22.5% to 25.7% in 2010.
Figure 1.16 % of Students by Lunch Status Scoring Met and Exemplary on PASS
ELA Math Science Social Studies
2009 2010 2009 2010 2009 2010 2009 2010
FARMS 61.2 63.1 57.5 58.9 55.9 56.7 62.3 61.1
Full-Pay 85.0 86.3 81.8 83.0 80.9 82.4 83.8 83.6
Difference 23.8 23.2 24.4 24.0 25.1 25.7 21.4 22.5
Students in Greenville County Schools receiving free or reduced priced lunch also have lower first-attempt HSAP exam scores than full-pay lunch students, as shown in Figure 1.17 below. The gap is larger for math than ELA. While the gap has been reduced over the last two years, it still ranged from16.8% to 19.4%. Figure 1.17 % of Students by Lunch Status Scoring at or Above Level 2 on HSAP 1
st Attempt
ELA Math
2009 2010 2009 2010
GCS
SC

Page 60
FARMS 74.5 77.9 67.2 71.2
Full-Pay 92.8 94.7 87.5 90.6
Difference 18.3 16.8 20.3 19.4
The gap is also evident in passing rates for end-of-course exams, as show in Figure 1.18 below. The largest gaps in 2010 were seen in Physical Science and U.S. History. The achievement gap decreased from 2009 to 2010 in both Algebra I and English I. Figure 1.18 % of Students by Lunch Status Scoring Passing End-Of-Course Examinations
Algebra I English I Physical Science US History
2009 2010 2009 2010 2009 2010 2009 2010
FARMS 56.9 74.6 55.3 65.4 59.2 54.8 33.1 38.4
Full-Pay 85.0 89.4 81.5 86.3 65.8 77.0 63.2 65.3
Difference 28.1 14.8 26.2 20.9 6.6 22.2 30.1 26.9
Graduation rates in 2009-2010, as reported on the GCS AYP report, illustrate the achievement gaps
that currently exist in Greenville County Schools. The graduation rate for students receiving free or
reduced-priced lunch was 60.9% and the graduation rate for full-pay students was 81.9%.
Page 61
Appendix B
Technology Committee Members David Johnstone Principal Katie Watts- 2
nd Grade Nathan Deese 3
rd Grade
Deborah Foulkes Instructional Coach Stacey Merritt- 3rd
Grade Maria Cohen 4th
Grade
Stephanie Nichols Media Specialist Connie Gordon- 5th
Grade Jennifer Johnston 6th
/7th
Grade
Barbara Booth – Middle School Martha Bohnenberger- 7th
& 8th
Grade
Technology Plan
2011-2016
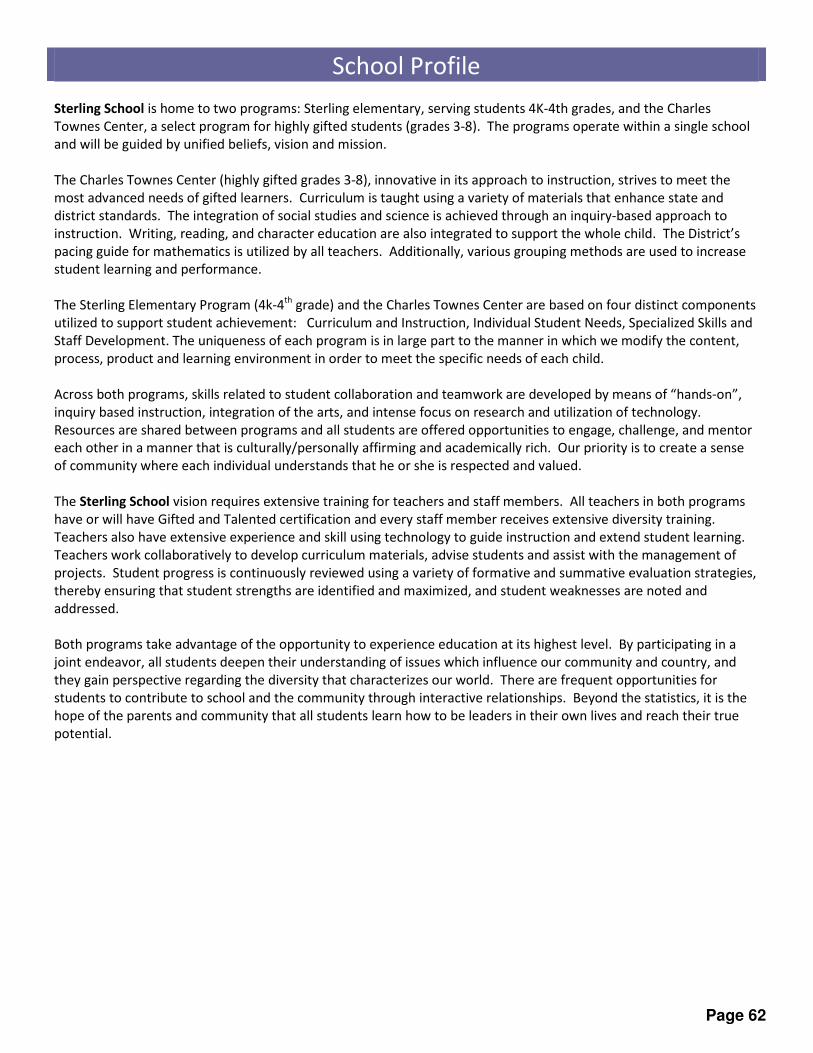
Page 62
School Profile
Sterling School is home to two programs: Sterling elementary, serving students 4K-4th grades, and the Charles
Townes Center, a select program for highly gifted students (grades 3-8). The programs operate within a single school
and will be guided by unified beliefs, vision and mission.
The Charles Townes Center (highly gifted grades 3-8), innovative in its approach to instruction, strives to meet the
most advanced needs of gifted learners. Curriculum is taught using a variety of materials that enhance state and
district standards. The integration of social studies and science is achieved through an inquiry-based approach to
instruction. Writing, reading, and character education are also integrated to support the whole child. The District’s
pacing guide for mathematics is utilized by all teachers. Additionally, various grouping methods are used to increase
student learning and performance.
The Sterling Elementary Program (4k-4th grade) and the Charles Townes Center are based on four distinct components
utilized to support student achievement: Curriculum and Instruction, Individual Student Needs, Specialized Skills and
Staff Development. The uniqueness of each program is in large part to the manner in which we modify the content,
process, product and learning environment in order to meet the specific needs of each child.
Across both programs, skills related to student collaboration and teamwork are developed by means of “hands-on”,
inquiry based instruction, integration of the arts, and intense focus on research and utilization of technology.
Resources are shared between programs and all students are offered opportunities to engage, challenge, and mentor
each other in a manner that is culturally/personally affirming and academically rich. Our priority is to create a sense
of community where each individual understands that he or she is respected and valued.
The Sterling School vision requires extensive training for teachers and staff members. All teachers in both programs
have or will have Gifted and Talented certification and every staff member receives extensive diversity training.
Teachers also have extensive experience and skill using technology to guide instruction and extend student learning.
Teachers work collaboratively to develop curriculum materials, advise students and assist with the management of
projects. Student progress is continuously reviewed using a variety of formative and summative evaluation strategies,
thereby ensuring that student strengths are identified and maximized, and student weaknesses are noted and
addressed.
Both programs take advantage of the opportunity to experience education at its highest level. By participating in a
joint endeavor, all students deepen their understanding of issues which influence our community and country, and
they gain perspective regarding the diversity that characterizes our world. There are frequent opportunities for
students to contribute to school and the community through interactive relationships. Beyond the statistics, it is the
hope of the parents and community that all students learn how to be leaders in their own lives and reach their true
potential.

Page 63
STRATEGIC VISION for TECHNOLOGY
From The National Education Technology Plan 2010 (NETP) – U.S. Department of Education. Available online at http://www.ed.gov/technology/netp-2010.
The challenge for our education system is to leverage the learning sciences and modern technology to create
engaging, relevant, and personalized learning experiences for all learners that mirror students’ daily lives and the
reality of their futures.
Technology should be leveraged to provide access to more learning resources than are available in classrooms and
connections to a wider set of “educators,” including teachers, parents, experts, and mentors outside the classroom.
It also should be used to enable 24/7 and lifelong learning.
Whether the domain is English language arts, mathematics, sciences, social studies, history, art, or music, 21st-century
competencies and such expertise as critical thinking, complex problem solving, collaboration, and multimedia
communication should be woven into all content areas. These competencies are necessary to become expert learners,
which we all must be if we are to adapt to our rapidly changing world over the course of our lives.
In a connected teaching model, classroom educators are fully connected to learning data and tools for using the data;
to content, resources, and systems that empower them to create, manage, and assess engaging and relevant learning
experiences; and directly to their students in support of learning both in and out of school.
To reach this vision, we must:
� Expand opportunities for educators to have access to technology-based content, resources, and tools where
and when they need them. � Provide access to technology-based resources that inspire educators to provide more engaging and effective
learning opportunities for each and every student. � Provide … in-service…with professional learning experiences powered by technology to increase [educators’]
digital literacy and enable them to create compelling assignments for students that improve learning,
assessment, and instructional practices. � Ensure that every student and educator has at least one Internet access device and appropriate software and
resources for research, communication, multimedia content creation, and collaboration for use in and out of
school.
Current data on the use of educational and information technology in our system consists of records of purchases
and numbers of computers and Internet connections. Only by shifting our focus to collecting data on how and when
technology is used will we be able to determine the difference it makes and use that knowledge to improve
outcomes and the productivity of our education system.
Our hope is that Sterling's teachers will experiment with such resources as online learning, online tutoring and
mentoring, games, cognitive tutors, immersive environments, and participatory communities and social networks
both within and across education institutions to give students guidance and information about their own learning
progress and strategies for seamless completion of a comprehensive P–16 education.
We include three categories:
� information literacy, the ability to identify, retrieve, evaluate, and use information for a variety of purposes; � media literacy, the ability to consume and understand media, as well as communicate effectively using a
variety of media types; � and digital citizenship, the ability to evaluate and use technologies appropriately, behave in socially
acceptable ways within online communities, and develop a healthy understanding of issues surrounding
online privacy and safety.
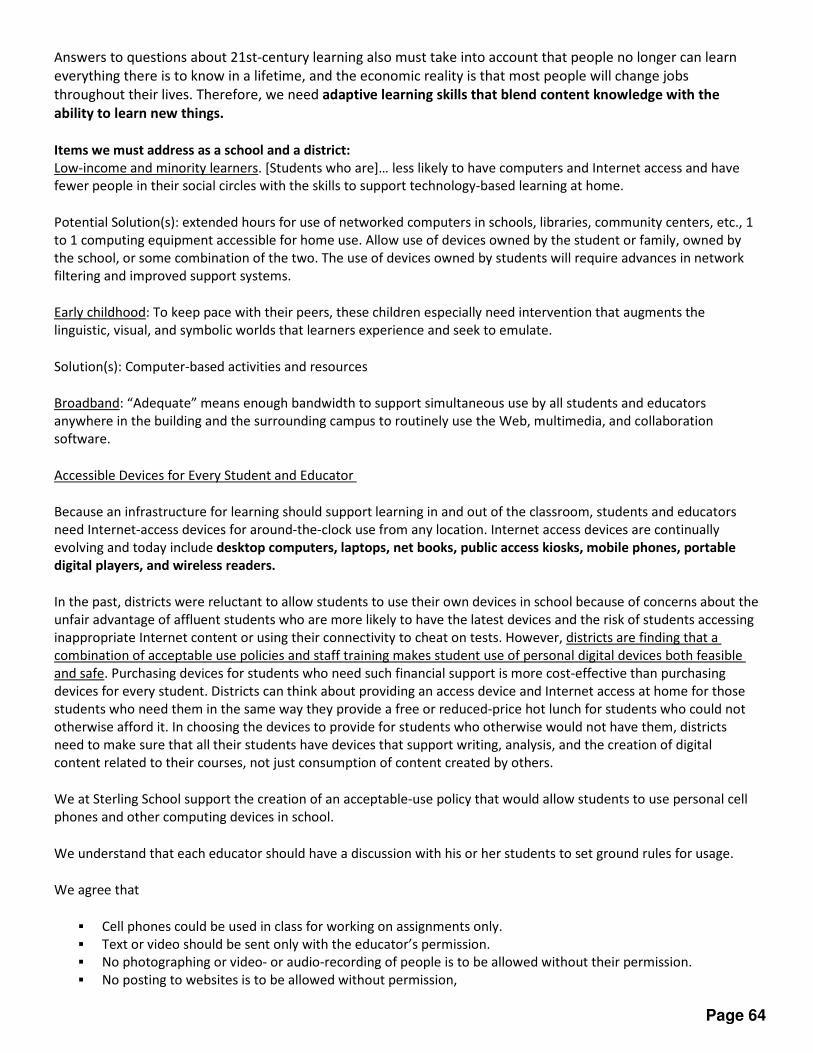
Page 64
Answers to questions about 21st-century learning also must take into account that people no longer can learn
everything there is to know in a lifetime, and the economic reality is that most people will change jobs
throughout their lives. Therefore, we need adaptive learning skills that blend content knowledge with the
ability to learn new things.
Items we must address as a school and a district:
Low-income and minority learners. [Students who are]… less likely to have computers and Internet access and have
fewer people in their social circles with the skills to support technology-based learning at home.
Potential Solution(s): extended hours for use of networked computers in schools, libraries, community centers, etc., 1
to 1 computing equipment accessible for home use. Allow use of devices owned by the student or family, owned by
the school, or some combination of the two. The use of devices owned by students will require advances in network
filtering and improved support systems.
Early childhood: To keep pace with their peers, these children especially need intervention that augments the
linguistic, visual, and symbolic worlds that learners experience and seek to emulate.
Solution(s): Computer-based activities and resources
Broadband: “Adequate” means enough bandwidth to support simultaneous use by all students and educators
anywhere in the building and the surrounding campus to routinely use the Web, multimedia, and collaboration
software.
Accessible Devices for Every Student and Educator
Because an infrastructure for learning should support learning in and out of the classroom, students and educators
need Internet-access devices for around-the-clock use from any location. Internet access devices are continually
evolving and today include desktop computers, laptops, net books, public access kiosks, mobile phones, portable
digital players, and wireless readers.
In the past, districts were reluctant to allow students to use their own devices in school because of concerns about the
unfair advantage of affluent students who are more likely to have the latest devices and the risk of students accessing
inappropriate Internet content or using their connectivity to cheat on tests. However, districts are finding that a
combination of acceptable use policies and staff training makes student use of personal digital devices both feasible
and safe. Purchasing devices for students who need such financial support is more cost-effective than purchasing
devices for every student. Districts can think about providing an access device and Internet access at home for those
students who need them in the same way they provide a free or reduced-price hot lunch for students who could not
otherwise afford it. In choosing the devices to provide for students who otherwise would not have them, districts
need to make sure that all their students have devices that support writing, analysis, and the creation of digital
content related to their courses, not just consumption of content created by others.
We at Sterling School support the creation of an acceptable-use policy that would allow students to use personal cell
phones and other computing devices in school.
We understand that each educator should have a discussion with his or her students to set ground rules for usage.
We agree that
� Cell phones could be used in class for working on assignments only. � Text or video should be sent only with the educator’s permission. � No photographing or video- or audio-recording of people is to be allowed without their permission. � No posting to websites is to be allowed without permission,

Page 65
� Online safety precautions are to be taken when publishing from a mobile phone.
Technology ideas: Teachers could use cell phone applications for polling and to set up an online text messaging board
to discuss homework. Teachers could use cell phones while teaching, asking students to answer questions via text
messaging rather than out loud. As student answers came in, they were displayed on a screen at the front of the class,
identified by the student’s cell phone screen name. English teachers, in particular, found the cell phones useful as they
started using blogs to engage students in writing. One class used Twitter to collaborate in generating stories in class.
Specific examples of individual and collaborative learning with technology may include the following:
• Inquiry and adventure environments with games and activities that foster learning.
• Online “collaboratories” (National Science Foundation 2008a) in which scientists establish protocols for collecting
data with sensors from local environments across the planet. Learners and teachers learn science by doing science as
they capture, upload, and then visualize and analyze geospatial and temporal data patterns from the data contributed
by the globally networked community.
• Earth- and sky-mapping Web resources with data from the sciences and other fields of scholarly inquiry that
anyone can use to develop virtual travel tours to be applied in learning and teaching activities.
• Augmented reality platforms and games that bring locally relevant learning resources into view for users of
mobile devices with a GPS (Johnson et al. 2010).
• Use of the power of collective intelligence and crowd sourcing to tackle complex interdisciplinary problems.
• Powerful learning applications for mobile Internet access devices, such as musical instrument simulators, language-
learning tools, and mathematical games.
The Three Dimensions Professional Development
Professional Development: This dimension emphasizes strategies to develop ongoing and sustained
professional development programs for all educators—teachers, principals, administrators, and school library
media personnel. This dimension focuses on the educator learning to integrate technology into their
curriculum. Professional Development is essential in this process.
Curriculum and Instructional Integration Curriculum and Instructional Integration: This dimension is the South Carolina’s “Instructional Capacity”
dimension and specifically targets the development of strategies to integrate technology into curricula and
teaching and also explores ways to promote teaching methods that are based on solid and relevant scientific
research. This dimension focuses on teachers’ use of technology to enhance instruction.
Learners and their Environment
Learners and Their Environment: This dimension emphasizes helping students use technology in ways that
advance their understanding of the content in the state curriculum standards while improving their real-life
problem-solving and inquiry skills. The environment should be one of shared learning and should be designed
to enhance student academic achievement through scientifically based learning practices and modern
technologies. This dimension focuses on students’ use of technology and how it is used to enhance their
learning process.
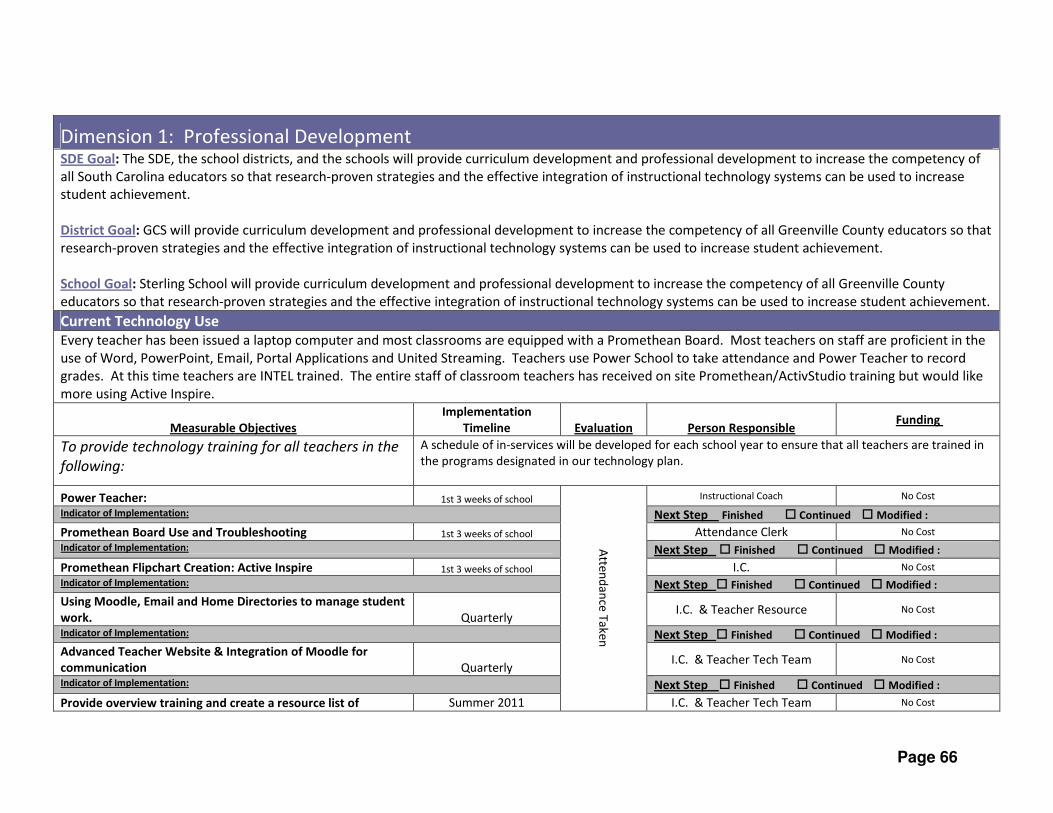
Page 66
Dimension 1: Professional Development
SDE Goal: The SDE, the school districts, and the schools will provide curriculum development and professional development to increase the competency of
all South Carolina educators so that research-proven strategies and the effective integration of instructional technology systems can be used to increase
student achievement.
District Goal: GCS will provide curriculum development and professional development to increase the competency of all Greenville County educators so that
research-proven strategies and the effective integration of instructional technology systems can be used to increase student achievement.
School Goal: Sterling School will provide curriculum development and professional development to increase the competency of all Greenville County
educators so that research-proven strategies and the effective integration of instructional technology systems can be used to increase student achievement.
Current Technology Use
Every teacher has been issued a laptop computer and most classrooms are equipped with a Promethean Board. Most teachers on staff are proficient in the
use of Word, PowerPoint, Email, Portal Applications and United Streaming. Teachers use Power School to take attendance and Power Teacher to record
grades. At this time teachers are INTEL trained. The entire staff of classroom teachers has received on site Promethean/ActivStudio training but would like
more using Active Inspire.
Measurable Objectives
Implementation
Timeline Evaluation Person Responsible Funding
To provide technology training for all teachers in the
following:
A schedule of in-services will be developed for each school year to ensure that all teachers are trained in
the programs designated in our technology plan.
Power Teacher: 1st 3 weeks of school
Atte
nd
an
ce T
ake
n
Instructional Coach No Cost
Indicator of Implementation: Next Step Finished � Continued � Modified :
Promethean Board Use and Troubleshooting 1st 3 weeks of school Attendance Clerk No Cost
Indicator of Implementation: Next Step � Finished � Continued � Modified :
Promethean Flipchart Creation: Active Inspire 1st 3 weeks of school I.C. No Cost
Indicator of Implementation: Next Step � Finished � Continued � Modified :
Using Moodle, Email and Home Directories to manage student
work. Quarterly I.C. & Teacher Resource No Cost
Indicator of Implementation: Next Step � Finished � Continued � Modified :
Advanced Teacher Website & Integration of Moodle for
communication Quarterly I.C. & Teacher Tech Team No Cost
Indicator of Implementation: Next Step � Finished � Continued � Modified :
Provide overview training and create a resource list of Summer 2011 I.C. & Teacher Tech Team No Cost
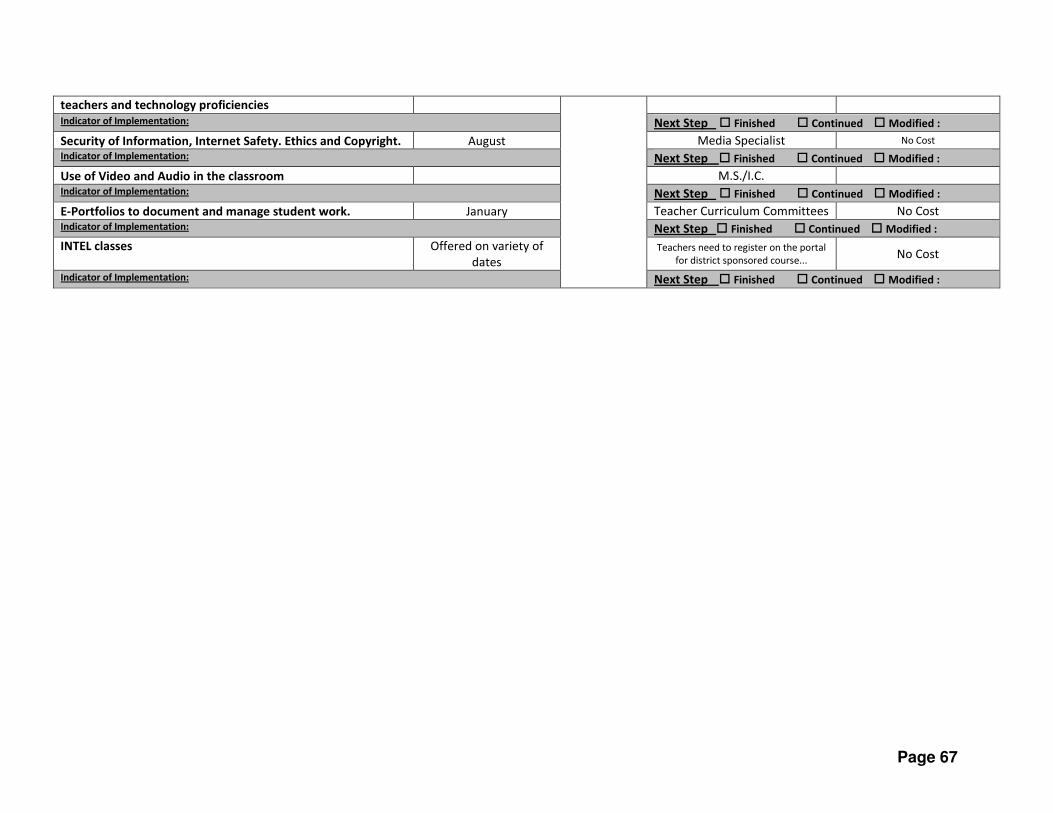
Page 67
teachers and technology proficiencies Indicator of Implementation: Next Step � Finished � Continued � Modified :
Security of Information, Internet Safety. Ethics and Copyright. August Media Specialist No Cost
Indicator of Implementation: Next Step � Finished � Continued � Modified :
Use of Video and Audio in the classroom M.S./I.C. Indicator of Implementation: Next Step � Finished � Continued � Modified :
E-Portfolios to document and manage student work. January Teacher Curriculum Committees No Cost Indicator of Implementation: Next Step � Finished � Continued � Modified :
INTEL classes Offered on variety of
dates
Teachers need to register on the portal
for district sponsored course... No Cost
Indicator of Implementation: Next Step � Finished � Continued � Modified :

Page 68
Dimension 2: Curriculum and Instructional Integration
SDE Goal: The SDE, the school districts, and the schools will use current and emerging technology to create learner-centered instructional environments that
enhance academic achievement.
District Goal: GCS will use current and emerging technology to create learner-centered instructional environments that enhance academic achievement.
School Goal: Sterling School will use current and emerging technology to create learner-centered instructional environments that enhance academic
achievement.
Current Technology Use
The teachers use current and emerging technology throughout the curriculum as a tool to provide differentiated, higher-order learning. Student’s complete
standards based technology activities and projects which address diverse learning needs and interests and allow for demonstration of technological
competency. The Promethean Board, Activotes, ActiSlates, laptop computers, scanners, microscopes, cameras, video cameras, Venier and TI technology
provide for differentiated instruction. Teachers from 4th-8th grade use Moodle to manage student work and support learning in the classroom. Wikis, blogs,
animation software is used across the school by teachers and students to enhance instruction and learning. These technology tools facilitate a student centered
environment that fosters academic achievement and allows for documentation of learning/progress.
Measurable Objective: The teacher will use technology to enhance learning and academic achievement.
Strategy/Action Time Frame for
Implementation Evaluation Person Responsible Funding
Teacher will: • Promethean boards will be used to integrate technology into
the classroom through the use of interactive lessons Ongoing Lesson Plans,
Observations
Teachers, students Refresh funding One
time board cost. Bulb
replacements every 1-2
years
Indicator of Implementation:
Next Step: � Finished � Continued �Modified :
• Create and share unit promethean flipcharts with peers through
the staff drive and teacher meetings. Ongoing
Staff drive and
Teacher Meeting
agenda
Teachers, IC
No cost
Indicator of Implementation: Next Step: � Finished � Continued �Modified :
• Incorporate ethics and copyright issues into lessons where
applicable Ongoing Lesson Plans Teachers, Media
Specialist No Cost
Indicator of Implementation: Next Step: � Finished � Continued �Modified :
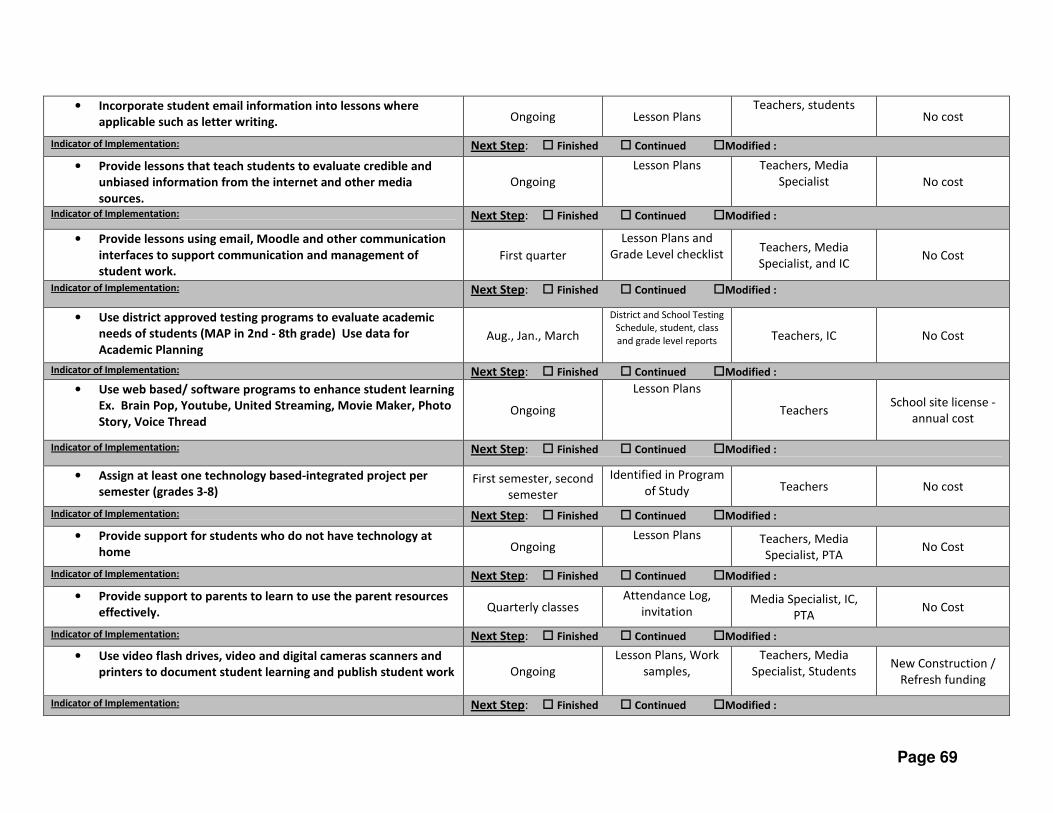
Page 69
• Incorporate student email information into lessons where
applicable such as letter writing. Ongoing Lesson Plans Teachers, students
No cost
Indicator of Implementation: Next Step: � Finished � Continued �Modified :
• Provide lessons that teach students to evaluate credible and
unbiased information from the internet and other media
sources.
Ongoing
Lesson Plans Teachers, Media
Specialist No cost
Indicator of Implementation: Next Step: � Finished � Continued �Modified :
• Provide lessons using email, Moodle and other communication
interfaces to support communication and management of
student work.
First quarter
Lesson Plans and
Grade Level checklist Teachers, Media
Specialist, and IC No Cost
Indicator of Implementation: Next Step: � Finished � Continued �Modified :
• Use district approved testing programs to evaluate academic
needs of students (MAP in 2nd - 8th grade) Use data for
Academic Planning Aug., Jan., March
District and School Testing
Schedule, student, class
and grade level reports Teachers, IC No Cost
Indicator of Implementation: Next Step: � Finished � Continued �Modified :
• Use web based/ software programs to enhance student learning
Ex. Brain Pop, Youtube, United Streaming, Movie Maker, Photo
Story, Voice Thread Ongoing
Lesson Plans
Teachers School site license -
annual cost
Indicator of Implementation: Next Step: � Finished � Continued �Modified :
• Assign at least one technology based-integrated project per
semester (grades 3-8) First semester, second
semester
Identified in Program
of Study Teachers No cost
Indicator of Implementation: Next Step: � Finished � Continued �Modified :
• Provide support for students who do not have technology at
home Ongoing Lesson Plans Teachers, Media
Specialist, PTA No Cost
Indicator of Implementation: Next Step: � Finished � Continued �Modified :
• Provide support to parents to learn to use the parent resources
effectively. Quarterly classes Attendance Log,
invitation Media Specialist, IC,
PTA No Cost
Indicator of Implementation: Next Step: � Finished � Continued �Modified :
• Use video flash drives, video and digital cameras scanners and
printers to document student learning and publish student work Ongoing
Lesson Plans, Work
samples,
Teachers, Media
Specialist, Students New Construction /
Refresh funding
Indicator of Implementation: Next Step: � Finished � Continued �Modified :
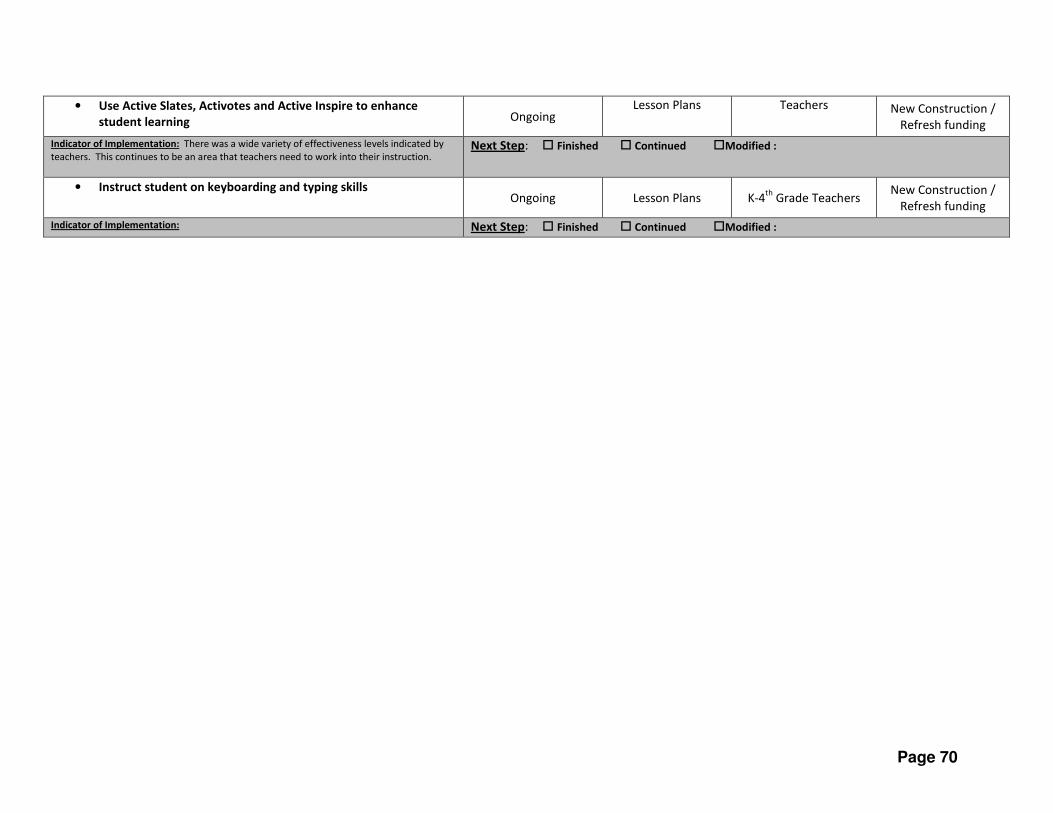
Page 70
• Use Active Slates, Activotes and Active Inspire to enhance
student learning Ongoing Lesson Plans Teachers New Construction /
Refresh funding
Indicator of Implementation: There was a wide variety of effectiveness levels indicated by
teachers. This continues to be an area that teachers need to work into their instruction. Next Step: � Finished � Continued �Modified :
• Instruct student on keyboarding and typing skills Ongoing Lesson Plans K-4
th Grade Teachers
New Construction /
Refresh funding
Indicator of Implementation: Next Step: � Finished � Continued �Modified :
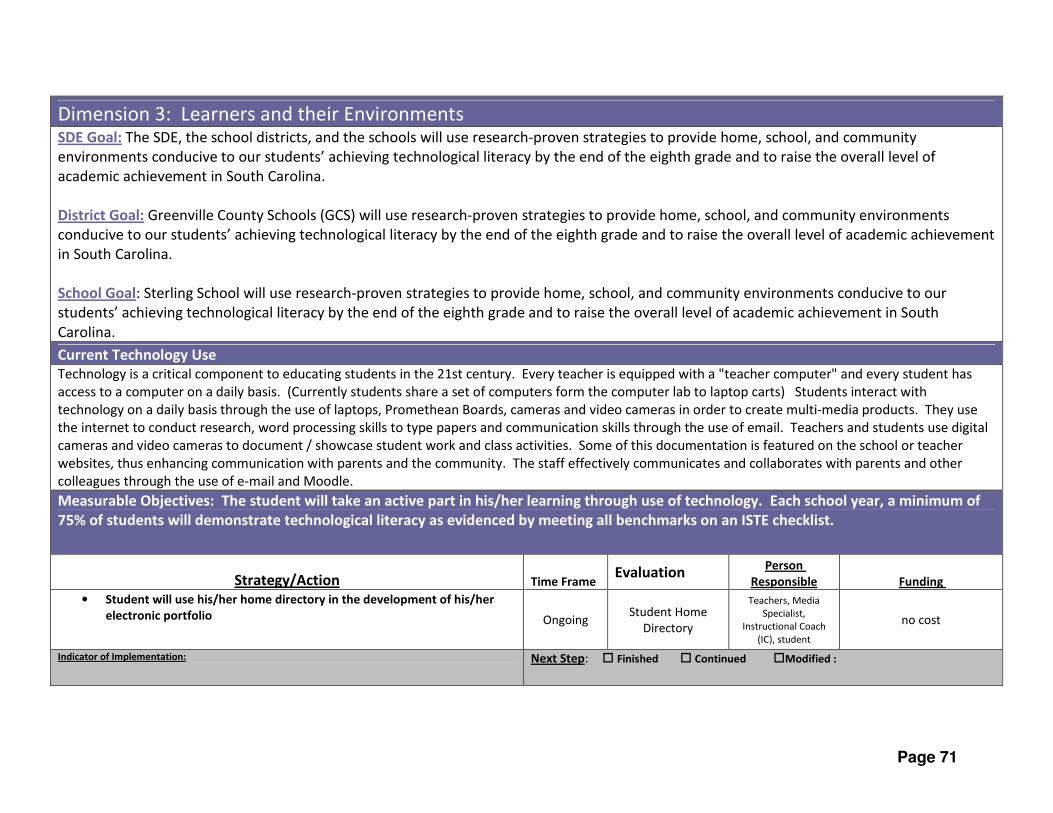
Page 71
Dimension 3: Learners and their Environments
SDE Goal: The SDE, the school districts, and the schools will use research-proven strategies to provide home, school, and community
environments conducive to our students’ achieving technological literacy by the end of the eighth grade and to raise the overall level of
academic achievement in South Carolina.
District Goal: Greenville County Schools (GCS) will use research-proven strategies to provide home, school, and community environments
conducive to our students’ achieving technological literacy by the end of the eighth grade and to raise the overall level of academic achievement
in South Carolina.
School Goal: Sterling School will use research-proven strategies to provide home, school, and community environments conducive to our
students’ achieving technological literacy by the end of the eighth grade and to raise the overall level of academic achievement in South
Carolina.
Current Technology Use Technology is a critical component to educating students in the 21st century. Every teacher is equipped with a "teacher computer" and every student has
access to a computer on a daily basis. (Currently students share a set of computers form the computer lab to laptop carts) Students interact with
technology on a daily basis through the use of laptops, Promethean Boards, cameras and video cameras in order to create multi-media products. They use
the internet to conduct research, word processing skills to type papers and communication skills through the use of email. Teachers and students use digital
cameras and video cameras to document / showcase student work and class activities. Some of this documentation is featured on the school or teacher
websites, thus enhancing communication with parents and the community. The staff effectively communicates and collaborates with parents and other
colleagues through the use of e-mail and Moodle. Measurable Objectives: The student will take an active part in his/her learning through use of technology. Each school year, a minimum of
75% of students will demonstrate technological literacy as evidenced by meeting all benchmarks on an ISTE checklist.
Strategy/Action Time Frame Evaluation
Person
Responsible Funding
• Student will use his/her home directory in the development of his/her
electronic portfolio Ongoing Student Home
Directory
Teachers, Media
Specialist,
Instructional Coach
(IC), student
no cost
Indicator of Implementation: Next Step: � Finished � Continued �Modified :
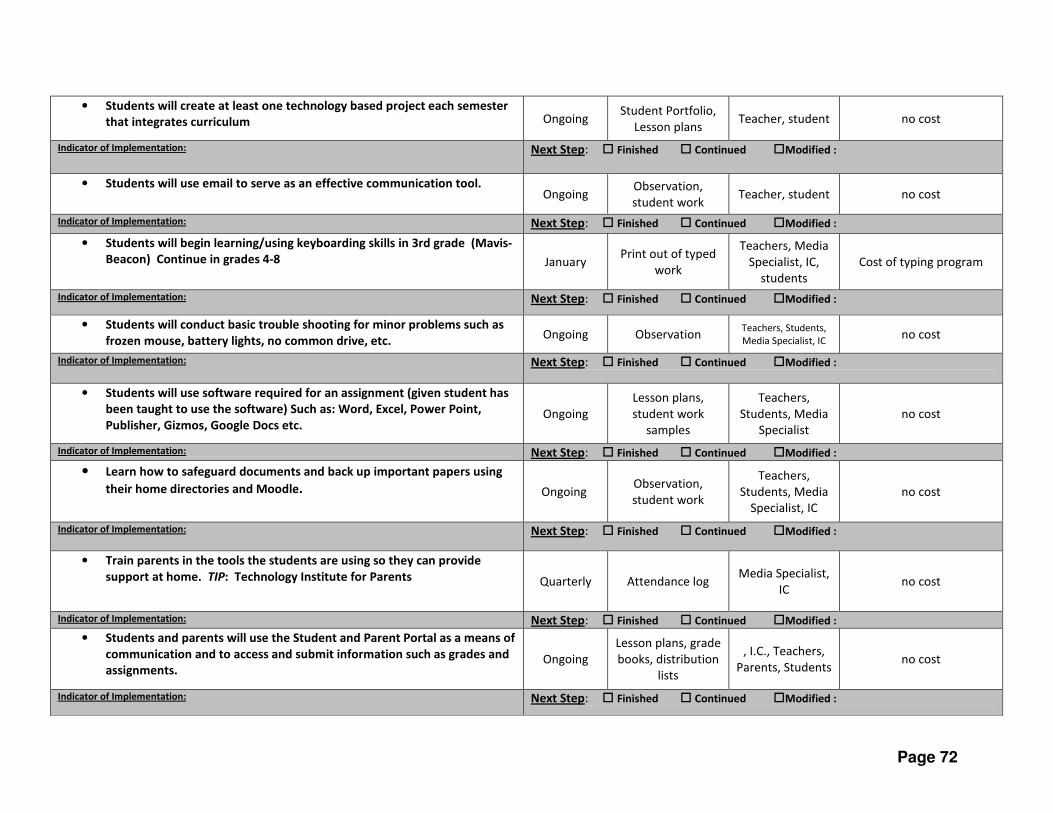
Page 72
• Students will create at least one technology based project each semester
that integrates curriculum Ongoing Student Portfolio,
Lesson plans Teacher, student no cost
Indicator of Implementation: Next Step: � Finished � Continued �Modified :
• Students will use email to serve as an effective communication tool. Ongoing
Observation,
student work Teacher, student no cost
Indicator of Implementation: Next Step: � Finished � Continued �Modified :
• Students will begin learning/using keyboarding skills in 3rd grade (Mavis-
Beacon) Continue in grades 4-8 January Print out of typed
work
Teachers, Media
Specialist, IC,
students
Cost of typing program
Indicator of Implementation: Next Step: � Finished � Continued �Modified :
• Students will conduct basic trouble shooting for minor problems such as
frozen mouse, battery lights, no common drive, etc. Ongoing Observation
Teachers, Students,
Media Specialist, IC no cost
Indicator of Implementation: Next Step: � Finished � Continued �Modified :
• Students will use software required for an assignment (given student has
been taught to use the software) Such as: Word, Excel, Power Point,
Publisher, Gizmos, Google Docs etc. Ongoing
Lesson plans,
student work
samples
Teachers,
Students, Media
Specialist
no cost
Indicator of Implementation: Next Step: � Finished � Continued �Modified :
• Learn how to safeguard documents and back up important papers using
their home directories and Moodle. Ongoing Observation,
student work
Teachers,
Students, Media
Specialist, IC
no cost
Indicator of Implementation: Next Step: � Finished � Continued �Modified :
• Train parents in the tools the students are using so they can provide
support at home. TIP: Technology Institute for Parents Quarterly Attendance log Media Specialist,
IC no cost
Indicator of Implementation: Next Step: � Finished � Continued �Modified :
• Students and parents will use the Student and Parent Portal as a means of
communication and to access and submit information such as grades and
assignments. Ongoing
Lesson plans, grade
books, distribution
lists
, I.C., Teachers,
Parents, Students no cost
Indicator of Implementation: Next Step: � Finished � Continued �Modified :
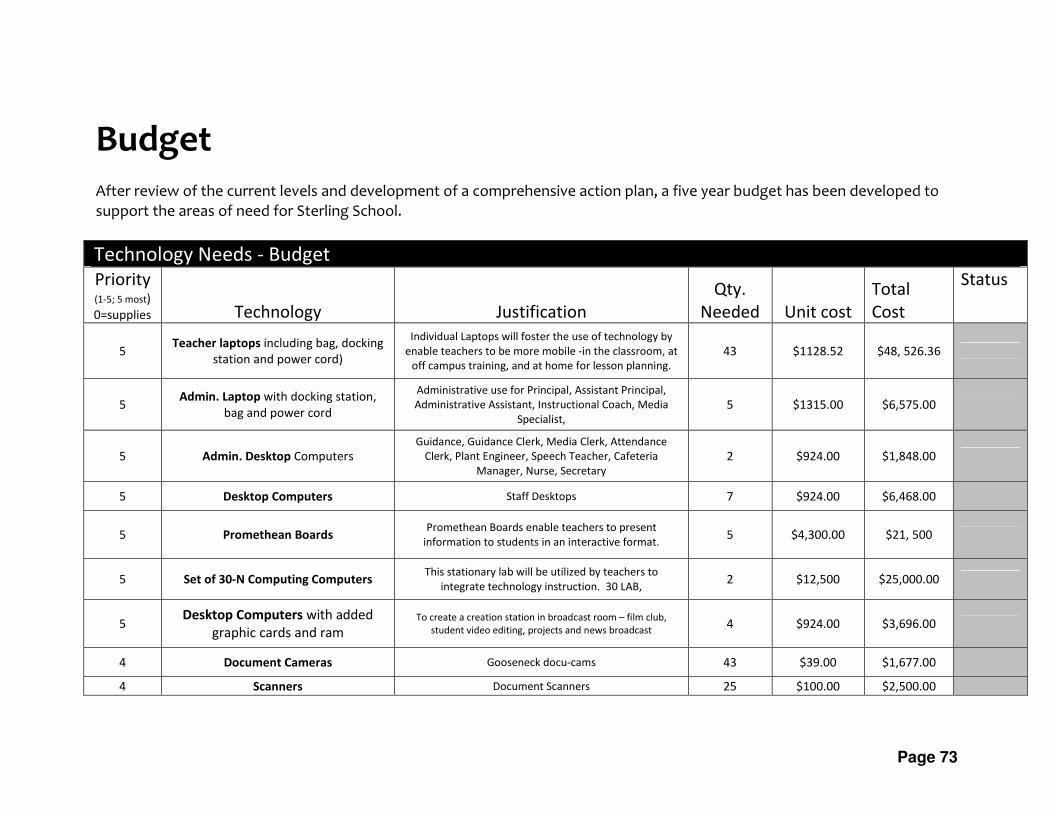
Page 73
Budget
After review of the current levels and development of a comprehensive action plan, a five year budget has been developed to
support the areas of need for Sterling School.
Technology Needs - Budget
Priority (1-5; 5 most)
0=supplies Technology Justification
Qty.
Needed Unit cost
Total
Cost
Status
5 Teacher laptops including bag, docking
station and power cord)
Individual Laptops will foster the use of technology by
enable teachers to be more mobile -in the classroom, at
off campus training, and at home for lesson planning.
43 $1128.52 $48, 526.36
5 Admin. Laptop with docking station,
bag and power cord
Administrative use for Principal, Assistant Principal,
Administrative Assistant, Instructional Coach, Media
Specialist,
5 $1315.00 $6,575.00
5 Admin. Desktop Computers Guidance, Guidance Clerk, Media Clerk, Attendance
Clerk, Plant Engineer, Speech Teacher, Cafeteria
Manager, Nurse, Secretary
2 $924.00 $1,848.00
5 Desktop Computers Staff Desktops 7 $924.00 $6,468.00
5 Promethean Boards Promethean Boards enable teachers to present
information to students in an interactive format. 5 $4,300.00 $21, 500
5 Set of 30-N Computing Computers This stationary lab will be utilized by teachers to
integrate technology instruction. 30 LAB, 2 $12,500 $25,000.00
5 Desktop Computers with added
graphic cards and ram
To create a creation station in broadcast room – film club,
student video editing, projects and news broadcast 4 $924.00 $3,696.00
4 Document Cameras Gooseneck docu-cams 43 $39.00 $1,677.00
4 Scanners Document Scanners 25 $100.00 $2,500.00
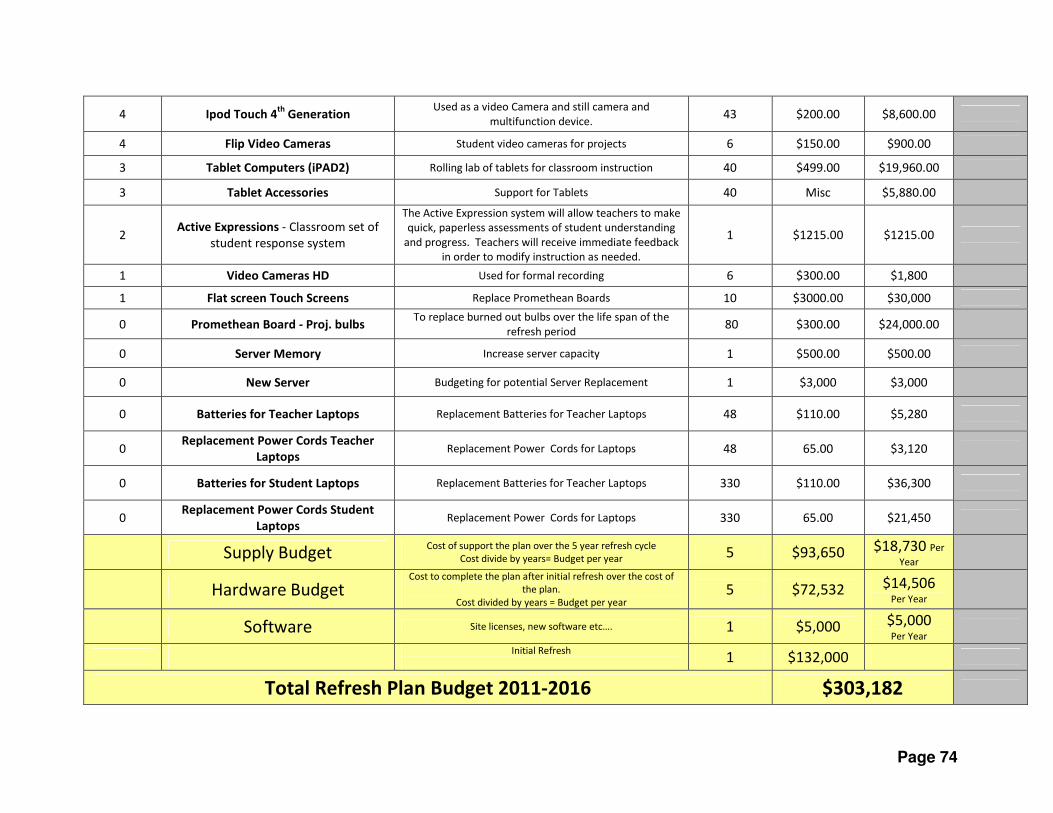
Page 74
4 Ipod Touch 4th
Generation Used as a video Camera and still camera and
multifunction device. 43 $200.00 $8,600.00
4 Flip Video Cameras Student video cameras for projects 6 $150.00 $900.00
3 Tablet Computers (iPAD2) Rolling lab of tablets for classroom instruction 40 $499.00 $19,960.00
3 Tablet Accessories Support for Tablets 40 Misc $5,880.00
2 Active Expressions - Classroom set of
student response system
The Active Expression system will allow teachers to make
quick, paperless assessments of student understanding
and progress. Teachers will receive immediate feedback
in order to modify instruction as needed.
1 $1215.00 $1215.00
1 Video Cameras HD Used for formal recording 6 $300.00 $1,800
1 Flat screen Touch Screens Replace Promethean Boards 10 $3000.00 $30,000
0 Promethean Board - Proj. bulbs To replace burned out bulbs over the life span of the
refresh period 80 $300.00 $24,000.00
0 Server Memory Increase server capacity 1 $500.00 $500.00
0 New Server Budgeting for potential Server Replacement 1 $3,000 $3,000
0 Batteries for Teacher Laptops Replacement Batteries for Teacher Laptops 48 $110.00 $5,280
0 Replacement Power Cords Teacher
Laptops Replacement Power Cords for Laptops 48 65.00 $3,120
0 Batteries for Student Laptops Replacement Batteries for Teacher Laptops 330 $110.00 $36,300
0 Replacement Power Cords Student
Laptops Replacement Power Cords for Laptops 330 65.00 $21,450
Supply Budget Cost of support the plan over the 5 year refresh cycle
Cost divide by years= Budget per year 5 $93,650 $18,730 Per
Year
Hardware Budget Cost to complete the plan after initial refresh over the cost of
the plan.
Cost divided by years = Budget per year 5 $72,532 $14,506
Per Year
Software Site licenses, new software etc…. 1 $5,000 $5,000 Per Year
Initial Refresh
1 $132,000
Total Refresh Plan Budget 2011-2016 $303,182
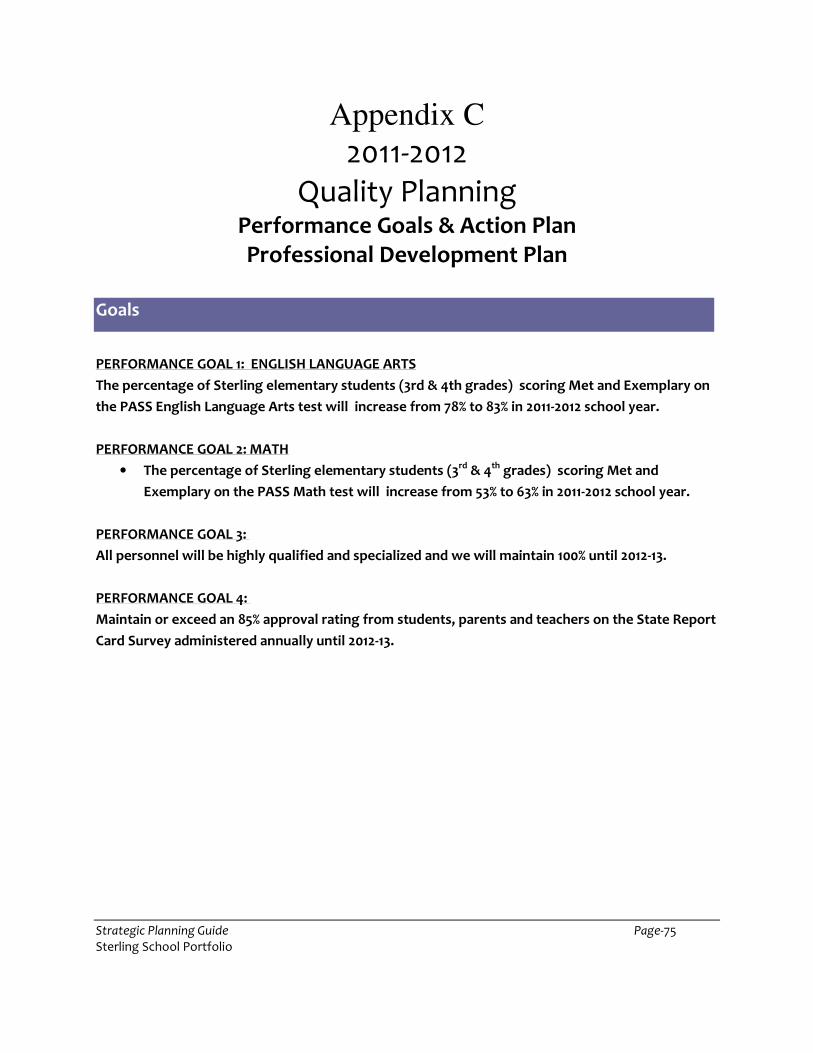
Strategic Planning Guide Page-75 Sterling School Portfolio
Appendix C
2011-2012 Quality Planning
Performance Goals & Action Plan Professional Development Plan
Goals
PERFORMANCE GOAL 1: ENGLISH LANGUAGE ARTS
The percentage of Sterling elementary students (3rd & 4th grades) scoring Met and Exemplary on
the PASS English Language Arts test will increase from 78% to 83% in 2011-2012 school year.
PERFORMANCE GOAL 2: MATH
• The percentage of Sterling elementary students (3rd & 4th grades) scoring Met and
Exemplary on the PASS Math test will increase from 53% to 63% in 2011-2012 school year.
PERFORMANCE GOAL 3:
All personnel will be highly qualified and specialized and we will maintain 100% until 2012-13.
PERFORMANCE GOAL 4:
Maintain or exceed an 85% approval rating from students, parents and teachers on the State Report
Card Survey administered annually until 2012-13.
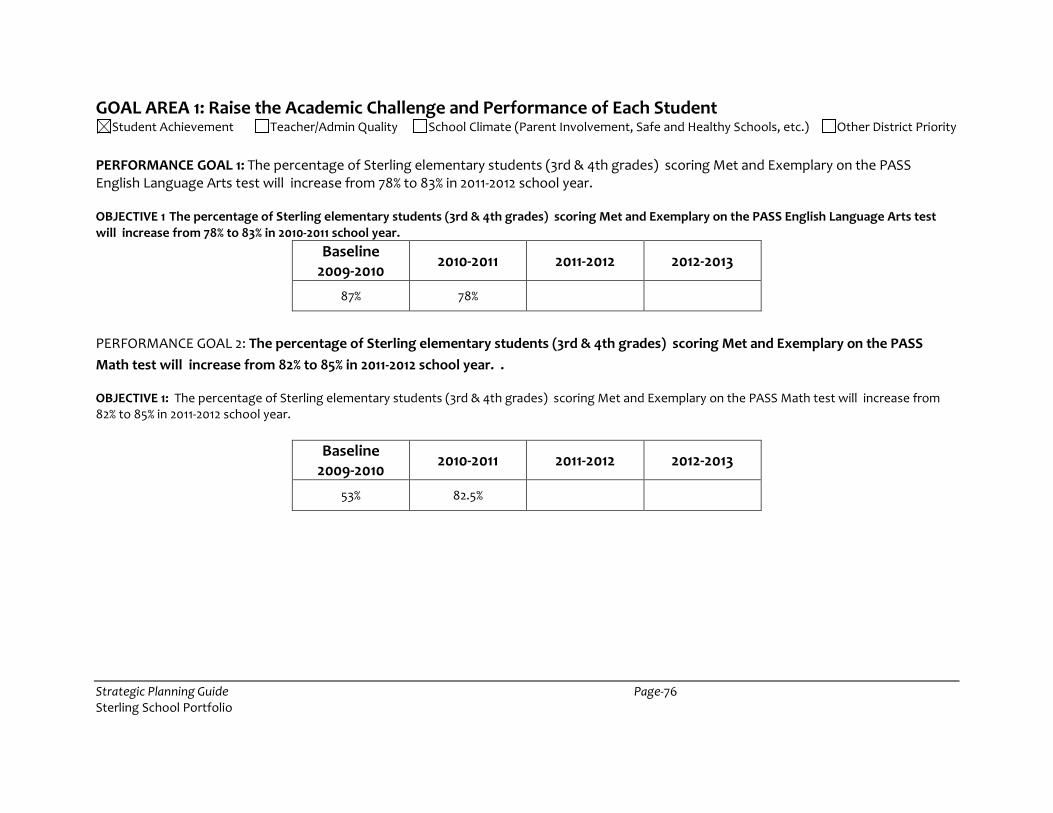
Strategic Planning Guide Page-76 Sterling School Portfolio
GOAL AREA 1: Raise the Academic Challenge and Performance of Each Student Student Achievement Teacher/Admin Quality School Climate (Parent Involvement, Safe and Healthy Schools, etc.) Other District Priority
PERFORMANCE GOAL 1: The percentage of Sterling elementary students (3rd & 4th grades) scoring Met and Exemplary on the PASS English Language Arts test will increase from 78% to 83% in 2011-2012 school year. OBJECTIVE 1 The percentage of Sterling elementary students (3rd & 4th grades) scoring Met and Exemplary on the PASS English Language Arts test will increase from 78% to 83% in 2010-2011 school year.
Baseline 2009-2010
2010-2011 2011-2012 2012-2013
87% 78%
PERFORMANCE GOAL 2: The percentage of Sterling elementary students (3rd & 4th grades) scoring Met and Exemplary on the PASS
Math test will increase from 82% to 85% in 2011-2012 school year. . OBJECTIVE 1: The percentage of Sterling elementary students (3rd & 4th grades) scoring Met and Exemplary on the PASS Math test will increase from 82% to 85% in 2011-2012 school year.
Baseline 2009-2010
2010-2011 2011-2012 2012-2013
53% 82.5%
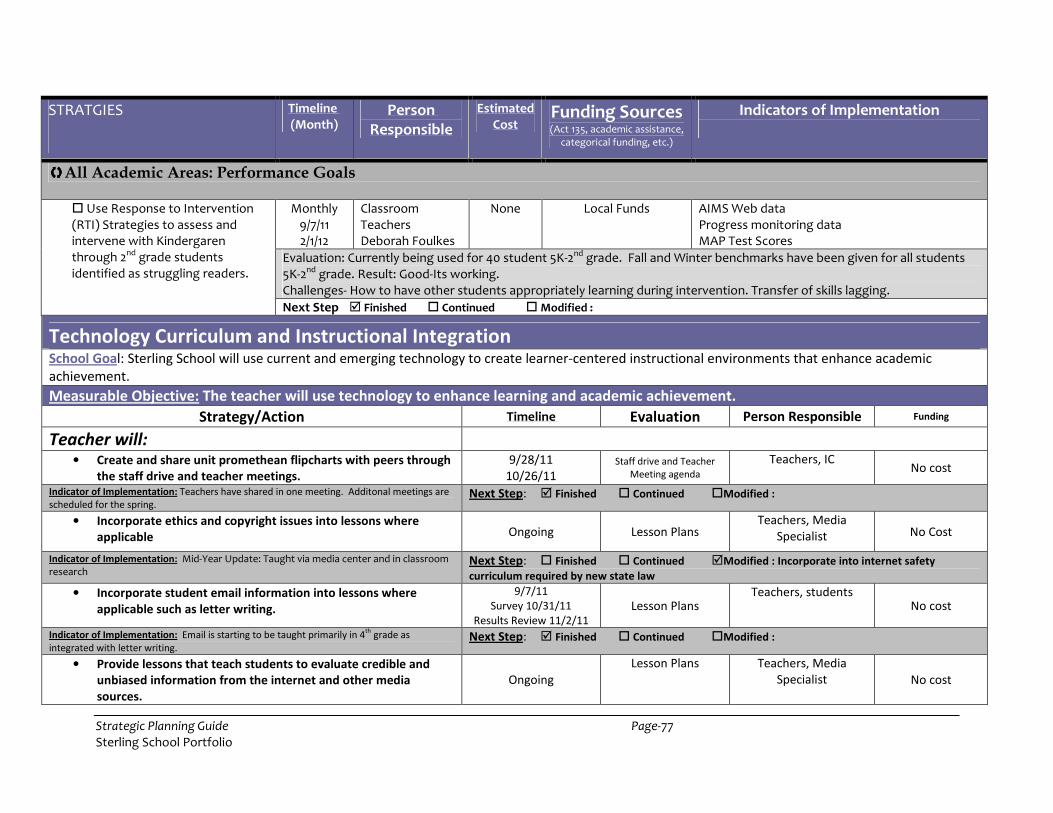
Strategic Planning Guide Page-77 Sterling School Portfolio
STRATGIES
Timeline (Month)
Person Responsible
Estimated Cost
Funding Sources (Act 135, academic assistance,
categorical funding, etc.)
Indicators of Implementation
����All Academic Areas: Performance Goals
� Use Response to Intervention (RTI) Strategies to assess and intervene with Kindergaren through 2nd grade students identified as struggling readers.
Monthly 9/7/11 2/1/12
Classroom Teachers Deborah Foulkes
None Local Funds AIMS Web data Progress monitoring data MAP Test Scores
Evaluation: Currently being used for 40 student 5K-2nd grade. Fall and Winter benchmarks have been given for all students 5K-2nd grade. Result: Good-Its working. Challenges- How to have other students appropriately learning during intervention. Transfer of skills lagging.
Next Step � Finished � Continued � Modified :
Technology Curriculum and Instructional Integration
School Goal: Sterling School will use current and emerging technology to create learner-centered instructional environments that enhance academic
achievement.
Measurable Objective: The teacher will use technology to enhance learning and academic achievement.
Strategy/Action Timeline Evaluation Person Responsible Funding
Teacher will: • Create and share unit promethean flipcharts with peers through
the staff drive and teacher meetings.
9/28/11
10/26/11
Staff drive and Teacher
Meeting agenda
Teachers, IC No cost
Indicator of Implementation: Teachers have shared in one meeting. Additonal meetings are
scheduled for the spring. Next Step: � Finished � Continued �Modified :
• Incorporate ethics and copyright issues into lessons where
applicable Ongoing Lesson Plans Teachers, Media
Specialist No Cost
Indicator of Implementation: Mid-Year Update: Taught via media center and in classroom research
Next Step: � Finished � Continued �Modified : Incorporate into internet safety
curriculum required by new state law
• Incorporate student email information into lessons where
applicable such as letter writing.
9/7/11
Survey 10/31/11
Results Review 11/2/11 Lesson Plans
Teachers, students
No cost
Indicator of Implementation: Email is starting to be taught primarily in 4th
grade as
integrated with letter writing. Next Step: � Finished � Continued �Modified :
• Provide lessons that teach students to evaluate credible and
unbiased information from the internet and other media
sources.
Ongoing
Lesson Plans Teachers, Media
Specialist No cost
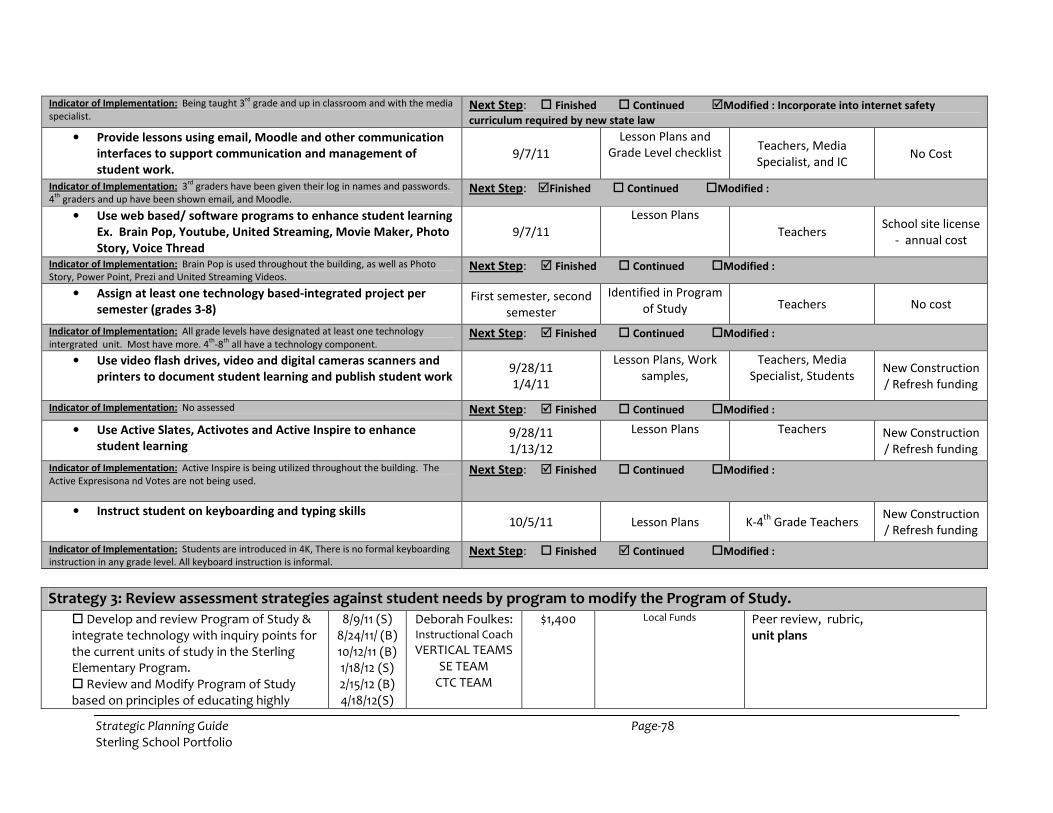
Strategic Planning Guide Page-78 Sterling School Portfolio
Indicator of Implementation: Being taught 3rd
grade and up in classroom and with the media
specialist. Next Step: � Finished � Continued �Modified : Incorporate into internet safety
curriculum required by new state law
• Provide lessons using email, Moodle and other communication
interfaces to support communication and management of
student work.
9/7/11
Lesson Plans and
Grade Level checklist Teachers, Media
Specialist, and IC No Cost
Indicator of Implementation: 3rd
graders have been given their log in names and passwords.
4th
graders and up have been shown email, and Moodle. Next Step: �Finished � Continued �Modified :
• Use web based/ software programs to enhance student learning
Ex. Brain Pop, Youtube, United Streaming, Movie Maker, Photo
Story, Voice Thread
9/7/11
Lesson Plans
Teachers School site license
- annual cost
Indicator of Implementation: Brain Pop is used throughout the building, as well as Photo
Story, Power Point, Prezi and United Streaming Videos. Next Step: � Finished � Continued �Modified :
• Assign at least one technology based-integrated project per
semester (grades 3-8) First semester, second
semester
Identified in Program
of Study Teachers No cost
Indicator of Implementation: All grade levels have designated at least one technology
intergrated unit. Most have more. 4th
-8th
all have a technology component. Next Step: � Finished � Continued �Modified :
• Use video flash drives, video and digital cameras scanners and
printers to document student learning and publish student work 9/28/11
1/4/11
Lesson Plans, Work
samples,
Teachers, Media
Specialist, Students New Construction
/ Refresh funding
Indicator of Implementation: No assessed Next Step: � Finished � Continued �Modified :
• Use Active Slates, Activotes and Active Inspire to enhance
student learning 9/28/11
1/13/12
Lesson Plans Teachers New Construction
/ Refresh funding
Indicator of Implementation: Active Inspire is being utilized throughout the building. The
Active Expresisona nd Votes are not being used. Next Step: � Finished � Continued �Modified :
• Instruct student on keyboarding and typing skills 10/5/11 Lesson Plans K-4
th Grade Teachers
New Construction
/ Refresh funding
Indicator of Implementation: Students are introduced in 4K, There is no formal keyboarding
instruction in any grade level. All keyboard instruction is informal. Next Step: � Finished � Continued �Modified :
Strategy 3: Review assessment strategies against student needs by program to modify the Program of Study.
� Develop and review Program of Study & integrate technology with inquiry points for the current units of study in the Sterling Elementary Program. � Review and Modify Program of Study based on principles of educating highly
8/9/11 (S) 8/24/11/ (B) 10/12/11 (B) 1/18/12 (S) 2/15/12 (B) 4/18/12(S)
Deborah Foulkes: Instructional Coach
VERTICAL TEAMS SE TEAM
CTC TEAM
$1,400 Local Funds Peer review, rubric, unit plans
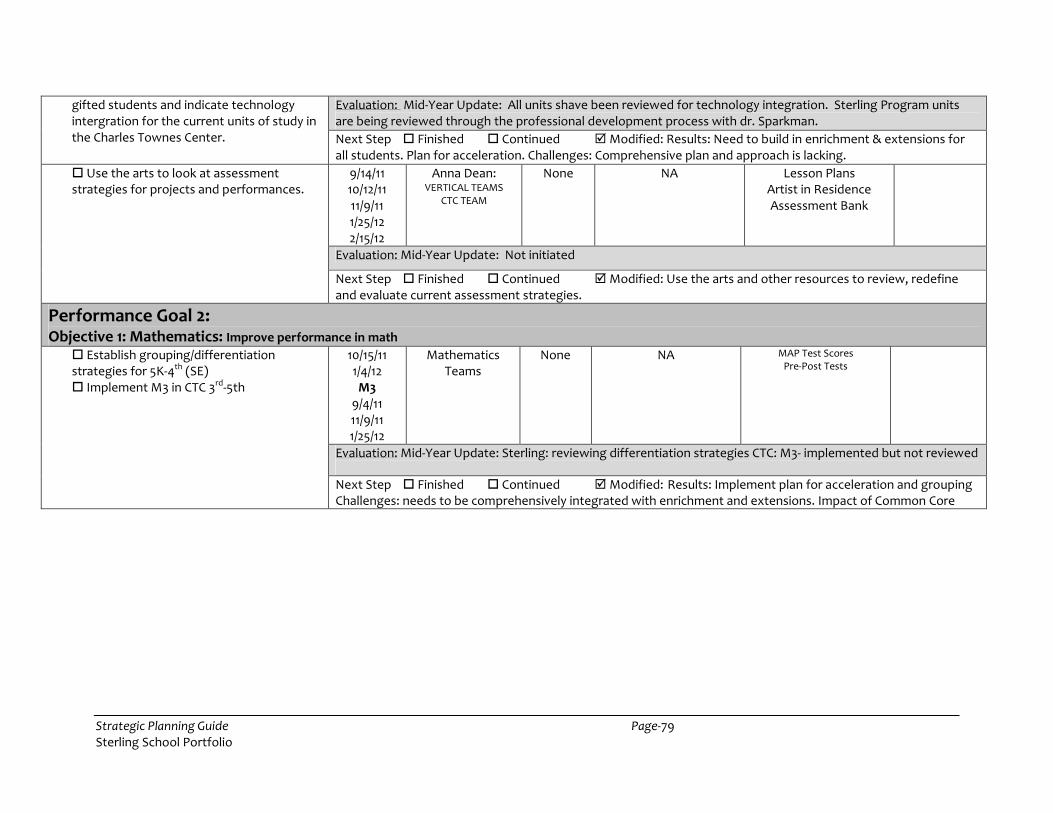
Strategic Planning Guide Page-79 Sterling School Portfolio
gifted students and indicate technology intergration for the current units of study in the Charles Townes Center.
Evaluation: Mid-Year Update: All units shave been reviewed for technology integration. Sterling Program units are being reviewed through the professional development process with dr. Sparkman.
Next Step � Finished � Continued � Modified: Results: Need to build in enrichment & extensions for all students. Plan for acceleration. Challenges: Comprehensive plan and approach is lacking.
� Use the arts to look at assessment strategies for projects and performances.
9/14/11 10/12/11 11/9/11 1/25/12 2/15/12
Anna Dean: VERTICAL TEAMS
CTC TEAM
None NA
Lesson Plans Artist in Residence Assessment Bank
Evaluation: Mid-Year Update: Not initiated
Next Step � Finished � Continued � Modified: Use the arts and other resources to review, redefine and evaluate current assessment strategies.
Performance Goal 2: Objective 1: Mathematics: Improve performance in math
� Establish grouping/differentiation strategies for 5K-4th (SE) � Implement M3 in CTC 3rd-5th
10/15/11 1/4/12
M3 9/4/11 11/9/11 1/25/12
Mathematics Teams
None NA MAP Test Scores Pre-Post Tests
Evaluation: Mid-Year Update: Sterling: reviewing differentiation strategies CTC: M3- implemented but not reviewed
Next Step � Finished � Continued � Modified: Results: Implement plan for acceleration and grouping Challenges: needs to be comprehensively integrated with enrichment and extensions. Impact of Common Core
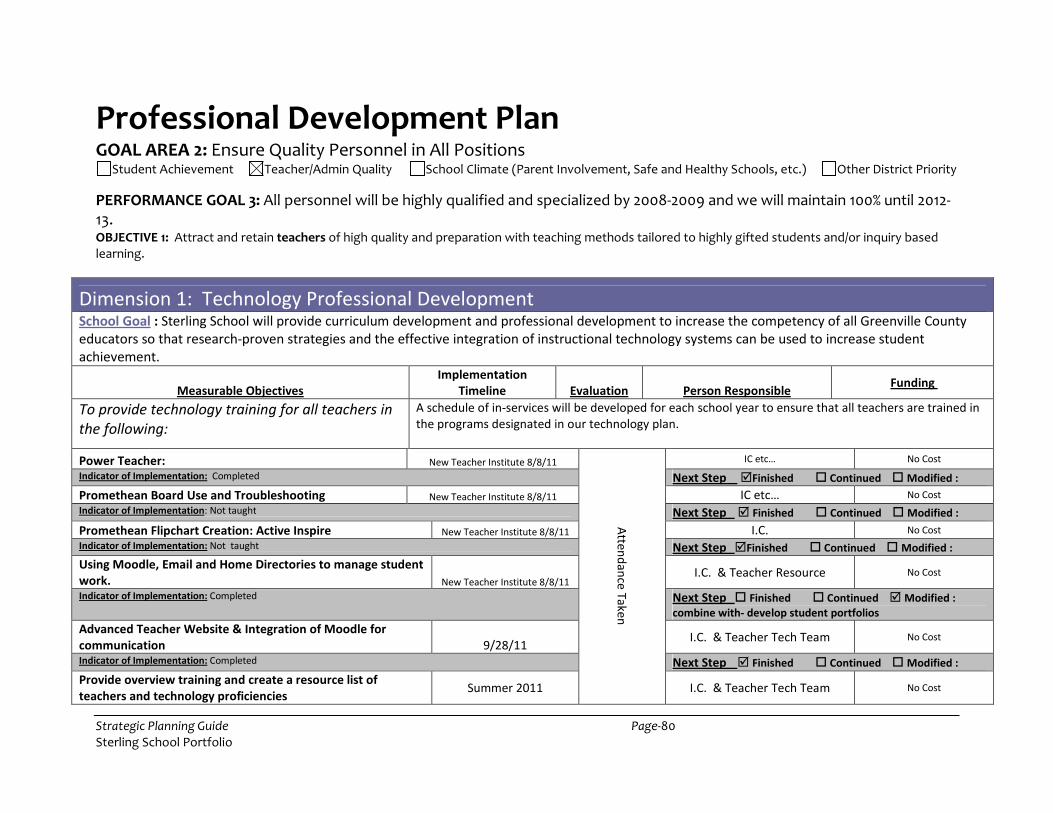
Strategic Planning Guide Page-80 Sterling School Portfolio
Professional Development Plan GOAL AREA 2: Ensure Quality Personnel in All Positions
Student Achievement Teacher/Admin Quality School Climate (Parent Involvement, Safe and Healthy Schools, etc.) Other District Priority
PERFORMANCE GOAL 3: All personnel will be highly qualified and specialized by 2008-2009 and we will maintain 100% until 2012-13. OBJECTIVE 1: Attract and retain teachers of high quality and preparation with teaching methods tailored to highly gifted students and/or inquiry based learning.
Dimension 1: Technology Professional Development
School Goal : Sterling School will provide curriculum development and professional development to increase the competency of all Greenville County
educators so that research-proven strategies and the effective integration of instructional technology systems can be used to increase student
achievement.
Measurable Objectives
Implementation
Timeline Evaluation Person Responsible Funding
To provide technology training for all teachers in
the following:
A schedule of in-services will be developed for each school year to ensure that all teachers are trained in
the programs designated in our technology plan.
Power Teacher: New Teacher Institute 8/8/11
Atte
nd
an
ce T
ake
n
IC etc… No Cost
Indicator of Implementation: Completed Next Step �Finished � Continued � Modified :
Promethean Board Use and Troubleshooting New Teacher Institute 8/8/11 IC etc… No Cost
Indicator of Implementation: Not taught Next Step � Finished � Continued � Modified :
Promethean Flipchart Creation: Active Inspire New Teacher Institute 8/8/11 I.C. No Cost
Indicator of Implementation: Not taught Next Step �Finished � Continued � Modified :
Using Moodle, Email and Home Directories to manage student
work. New Teacher Institute 8/8/11 I.C. & Teacher Resource No Cost
Indicator of Implementation: Completed Next Step � Finished � Continued � Modified :
combine with- develop student portfolios
Advanced Teacher Website & Integration of Moodle for
communication 9/28/11 I.C. & Teacher Tech Team No Cost
Indicator of Implementation: Completed Next Step � Finished � Continued � Modified :
Provide overview training and create a resource list of
teachers and technology proficiencies Summer 2011 I.C. & Teacher Tech Team No Cost
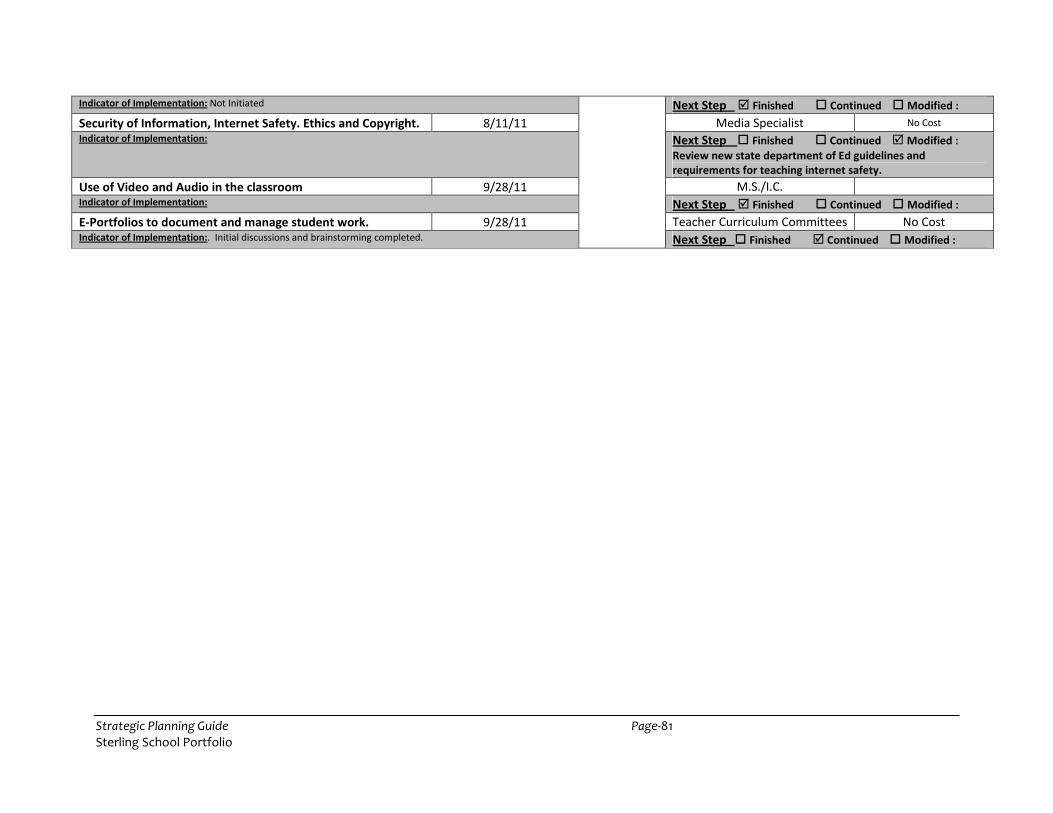
Strategic Planning Guide Page-81 Sterling School Portfolio
Indicator of Implementation: Not Initiated Next Step � Finished � Continued � Modified :
Security of Information, Internet Safety. Ethics and Copyright. 8/11/11 Media Specialist No Cost
Indicator of Implementation: Next Step � Finished � Continued � Modified :
Review new state department of Ed guidelines and
requirements for teaching internet safety.
Use of Video and Audio in the classroom 9/28/11 M.S./I.C. Indicator of Implementation: Next Step � Finished � Continued � Modified :
E-Portfolios to document and manage student work. 9/28/11 Teacher Curriculum Committees No Cost Indicator of Implementation:. Initial discussions and brainstorming completed. Next Step � Finished � Continued � Modified :
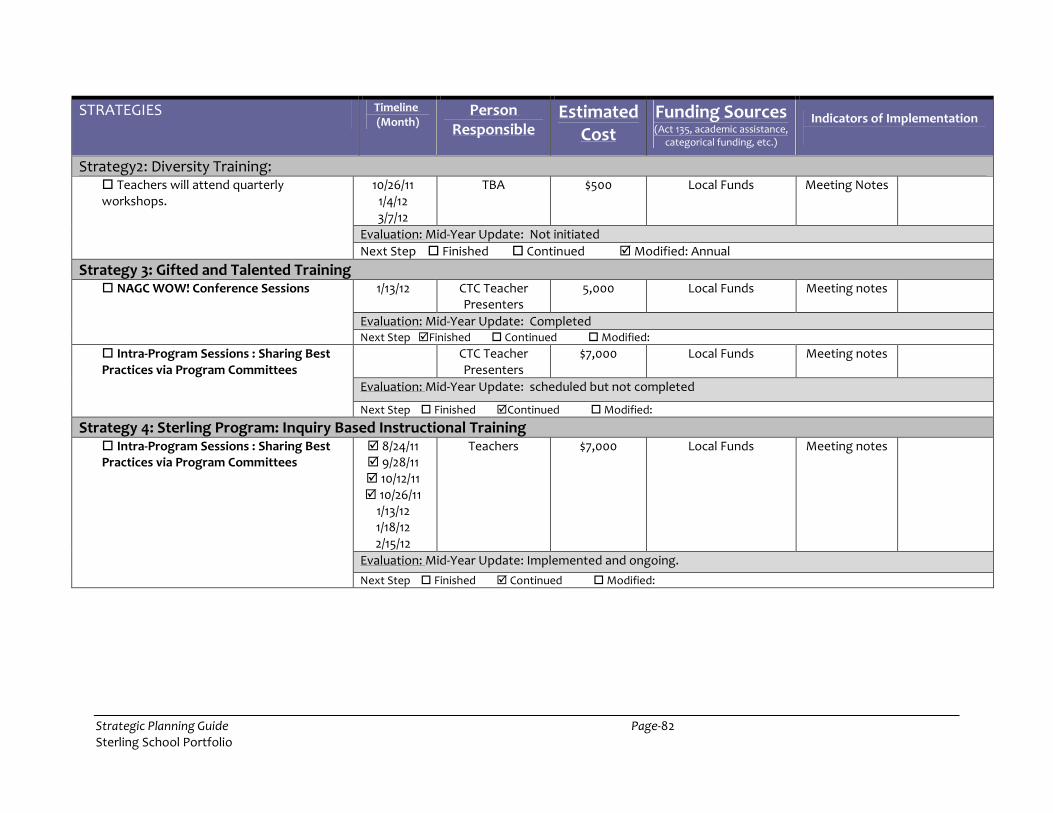
Strategic Planning Guide Page-82 Sterling School Portfolio
STRATEGIES Timeline (Month)
Person Responsible
Estimated Cost
Funding Sources (Act 135, academic assistance,
categorical funding, etc.)
Indicators of Implementation
Strategy2: Diversity Training: � Teachers will attend quarterly workshops.
10/26/11 1/4/12 3/7/12
TBA $500 Local Funds Meeting Notes
Evaluation: Mid-Year Update: Not initiated
Next Step � Finished � Continued � Modified: Annual
Strategy 3: Gifted and Talented Training
� NAGC WOW! Conference Sessions 1/13/12 CTC Teacher Presenters
5,000 Local Funds Meeting notes
Evaluation: Mid-Year Update: Completed Next Step �Finished � Continued � Modified:
� Intra-Program Sessions : Sharing Best Practices via Program Committees
CTC Teacher Presenters
$7,000 Local Funds Meeting notes
Evaluation: Mid-Year Update: scheduled but not completed
Next Step � Finished �Continued � Modified:
Strategy 4: Sterling Program: Inquiry Based Instructional Training � Intra-Program Sessions : Sharing Best Practices via Program Committees
� 8/24/11 � 9/28/11 � 10/12/11 � 10/26/11
1/13/12 1/18/12 2/15/12
Teachers $7,000 Local Funds Meeting notes
Evaluation: Mid-Year Update: Implemented and ongoing.
Next Step � Finished � Continued � Modified:
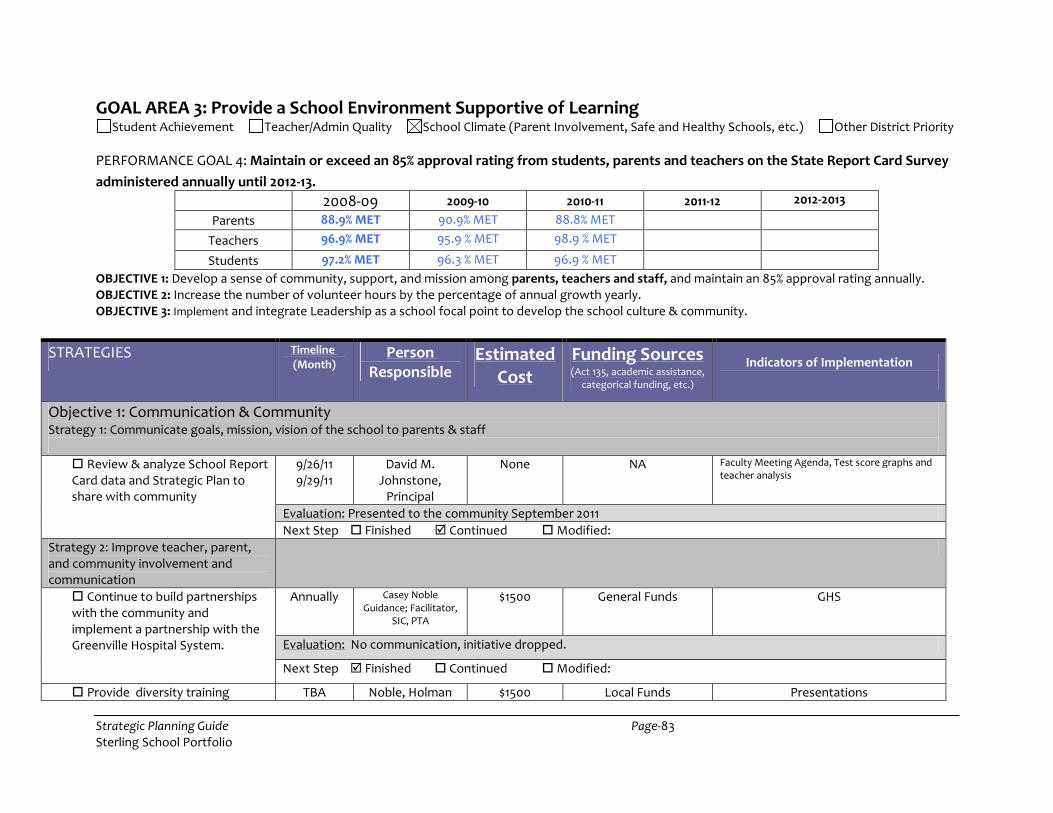
Strategic Planning Guide Page-83 Sterling School Portfolio
GOAL AREA 3: Provide a School Environment Supportive of Learning Student Achievement Teacher/Admin Quality School Climate (Parent Involvement, Safe and Healthy Schools, etc.) Other District Priority
PERFORMANCE GOAL 4: Maintain or exceed an 85% approval rating from students, parents and teachers on the State Report Card Survey
administered annually until 2012-13.
2008-09 2009-10 2010-11 2011-12 2012-2013
Parents 88.9% MET 90.9% MET 88.8% MET
Teachers 96.9% MET 95.9 % MET 98.9 % MET
Students 97.2% MET 96.3 % MET 96.9 % MET OBJECTIVE 1: Develop a sense of community, support, and mission among parents, teachers and staff, and maintain an 85% approval rating annually. OBJECTIVE 2: Increase the number of volunteer hours by the percentage of annual growth yearly. OBJECTIVE 3: Implement and integrate Leadership as a school focal point to develop the school culture & community.
STRATEGIES Timeline (Month)
Person Responsible
Estimated Cost
Funding Sources (Act 135, academic assistance,
categorical funding, etc.)
Indicators of Implementation
Objective 1: Communication & Community Strategy 1: Communicate goals, mission, vision of the school to parents & staff
� Review & analyze School Report Card data and Strategic Plan to share with community
9/26/11 9/29/11
David M. Johnstone,
Principal
None NA Faculty Meeting Agenda, Test score graphs and teacher analysis
Evaluation: Presented to the community September 2011
Next Step � Finished � Continued � Modified:
Strategy 2: Improve teacher, parent, and community involvement and communication
� Continue to build partnerships with the community and implement a partnership with the Greenville Hospital System.
Annually Casey Noble Guidance; Facilitator,
SIC, PTA
$1500 General Funds GHS
Evaluation: No communication, initiative dropped.
Next Step � Finished � Continued � Modified:
� Provide diversity training TBA Noble, Holman $1500 Local Funds Presentations
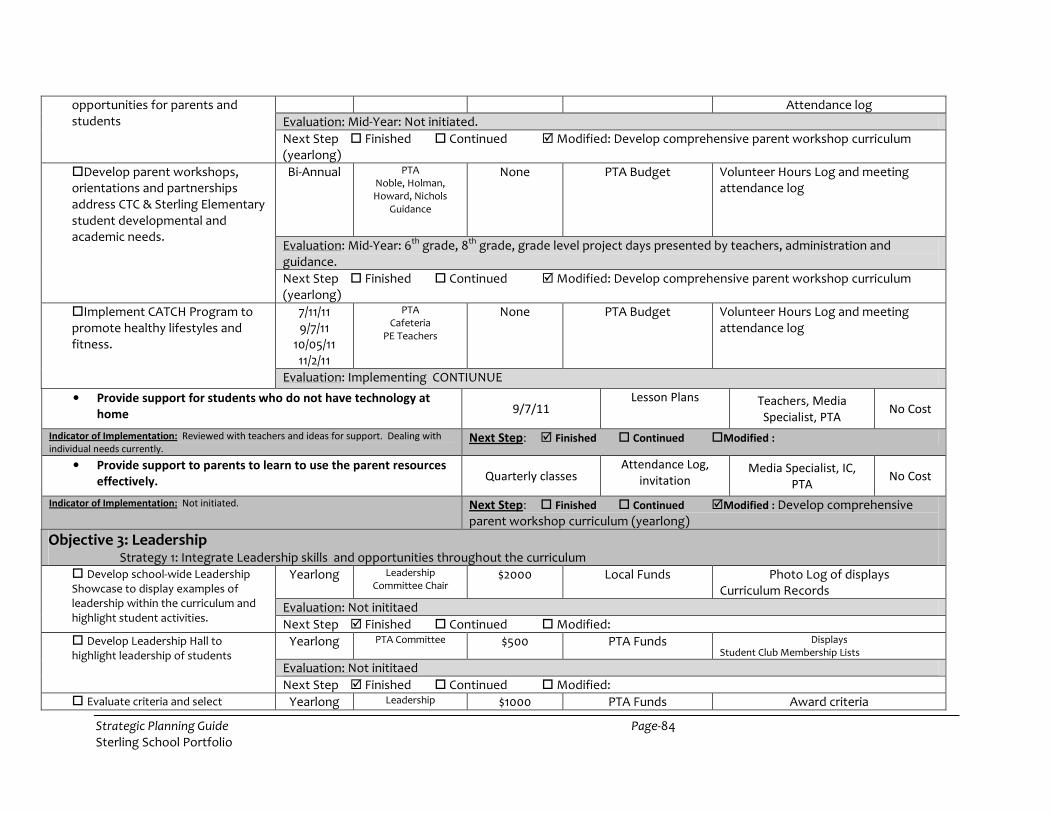
Strategic Planning Guide Page-84 Sterling School Portfolio
opportunities for parents and students
Attendance log
Evaluation: Mid-Year: Not initiated.
Next Step � Finished � Continued � Modified: Develop comprehensive parent workshop curriculum (yearlong)
�Develop parent workshops, orientations and partnerships address CTC & Sterling Elementary student developmental and academic needs.
Bi-Annual PTA Noble, Holman, Howard, Nichols
Guidance
None PTA Budget Volunteer Hours Log and meeting attendance log
Evaluation: Mid-Year: 6th grade, 8th grade, grade level project days presented by teachers, administration and guidance.
Next Step � Finished � Continued � Modified: Develop comprehensive parent workshop curriculum (yearlong)
�Implement CATCH Program to promote healthy lifestyles and fitness.
7/11/11 9/7/11
10/05/11 11/2/11
PTA Cafeteria
PE Teachers
None PTA Budget Volunteer Hours Log and meeting attendance log
Evaluation: Implementing CONTIUNUE
• Provide support for students who do not have technology at
home 9/7/11 Lesson Plans Teachers, Media
Specialist, PTA No Cost
Indicator of Implementation: Reviewed with teachers and ideas for support. Dealing with
individual needs currently. Next Step: � Finished � Continued �Modified :
• Provide support to parents to learn to use the parent resources
effectively. Quarterly classes Attendance Log,
invitation Media Specialist, IC,
PTA No Cost
Indicator of Implementation: Not initiated. Next Step: � Finished � Continued �Modified : Develop comprehensive parent workshop curriculum (yearlong)
Objective 3: Leadership Strategy 1: Integrate Leadership skills and opportunities throughout the curriculum
� Develop school-wide Leadership Showcase to display examples of leadership within the curriculum and highlight student activities.
Yearlong Leadership Committee Chair
$2000 Local Funds Photo Log of displays Curriculum Records
Evaluation: Not inititaed
Next Step � Finished � Continued � Modified: � Develop Leadership Hall to highlight leadership of students
Yearlong PTA Committee $500 PTA Funds Displays Student Club Membership Lists
Evaluation: Not inititaed
Next Step � Finished � Continued � Modified: � Evaluate criteria and select Yearlong Leadership $1000 PTA Funds Award criteria

Strategic Planning Guide Page-85 Sterling School Portfolio
Leadership Award recipients. Committee Foulkes
Local Funds Log of winners
Evaluation: Not inititaed
Next Step � Finished � Continued � Modified:
Dimension 4: Technology Learners and their Environments
School Goal: Sterling School will use research-proven strategies to provide home, school, and community environments conducive to our
students’ achieving technological literacy by the end of the eighth grade and to raise the overall level of academic achievement in South
Carolina.
Measurable Objective 4: The student will take an active part in his/her learning through use of technology. Each school year, a minimum of
75% of students will demonstrate technological literacy as evidenced by meeting all benchmarks on an ISTE checklist.
Strategy/Action Time Frame Evaluation
Person
Responsible Funding
• Students will conduct basic trouble shooting for minor problems such as
frozen mouse, battery lights, no common drive, etc. Ongoing Observation
Teachers,
Students, Media
Specialist, IC
no cost
Indicator of Implementation: Next Step: � Finished � Continued �Modified :
• Students will use software required for an assignment (given student has
been taught to use the software) Such as: Word, Excel, Power Point,
Publisher, Gizmos, Google Docs etc. Ongoing
Lesson plans,
student work
samples
Teachers,
Students, Media
Specialist
no cost
Indicator of Implementation: Next Step: � Finished � Continued �Modified :
• Learn how to safeguard documents and back up important papers using
their home directories and Moodle. Ongoing Observation,
student work
Teachers,
Students, Media
Specialist, IC
no cost
Indicator of Implementation: Next Step: � Finished � Continued �Modified :
• Train parents in the tools the students are using so they can provide
support at home. TIP: Technology Institute for Parents Quarterly Attendance log Media Specialist,
IC no cost
Indicator of Implementation: Next Step: � Finished � Continued �Modified :
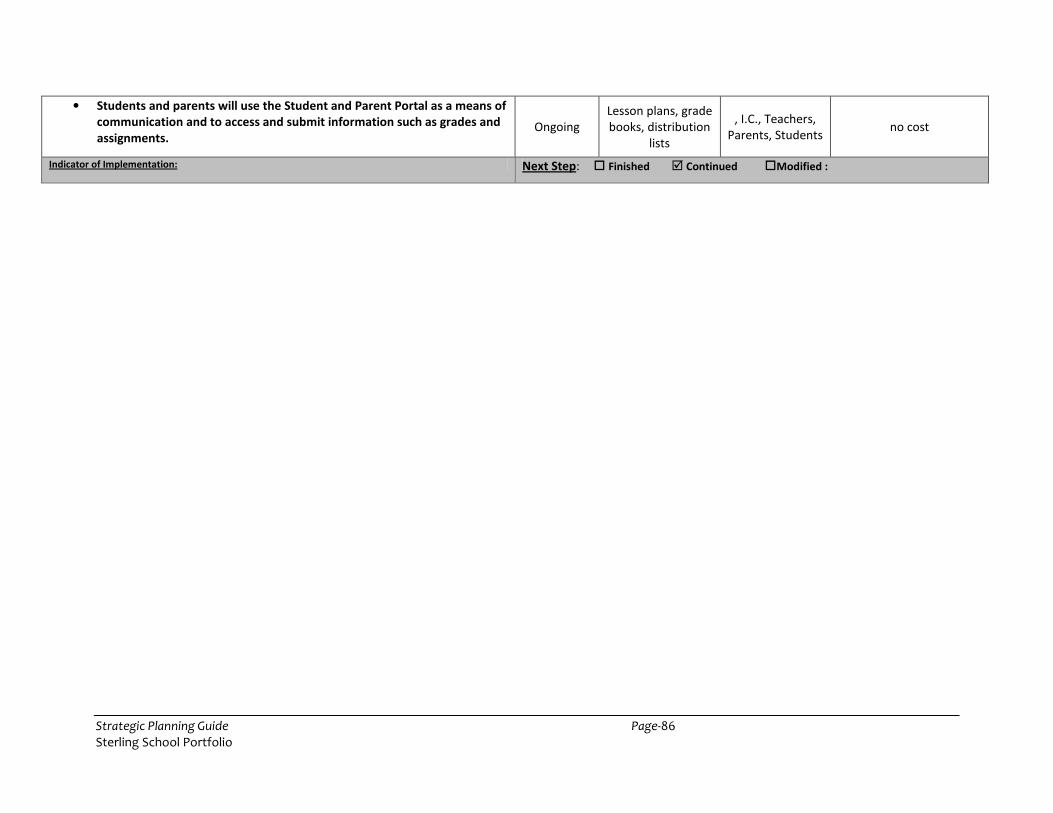
Strategic Planning Guide Page-86 Sterling School Portfolio
• Students and parents will use the Student and Parent Portal as a means of
communication and to access and submit information such as grades and
assignments. Ongoing
Lesson plans, grade
books, distribution
lists
, I.C., Teachers,
Parents, Students no cost
Indicator of Implementation: Next Step: � Finished � Continued �Modified :
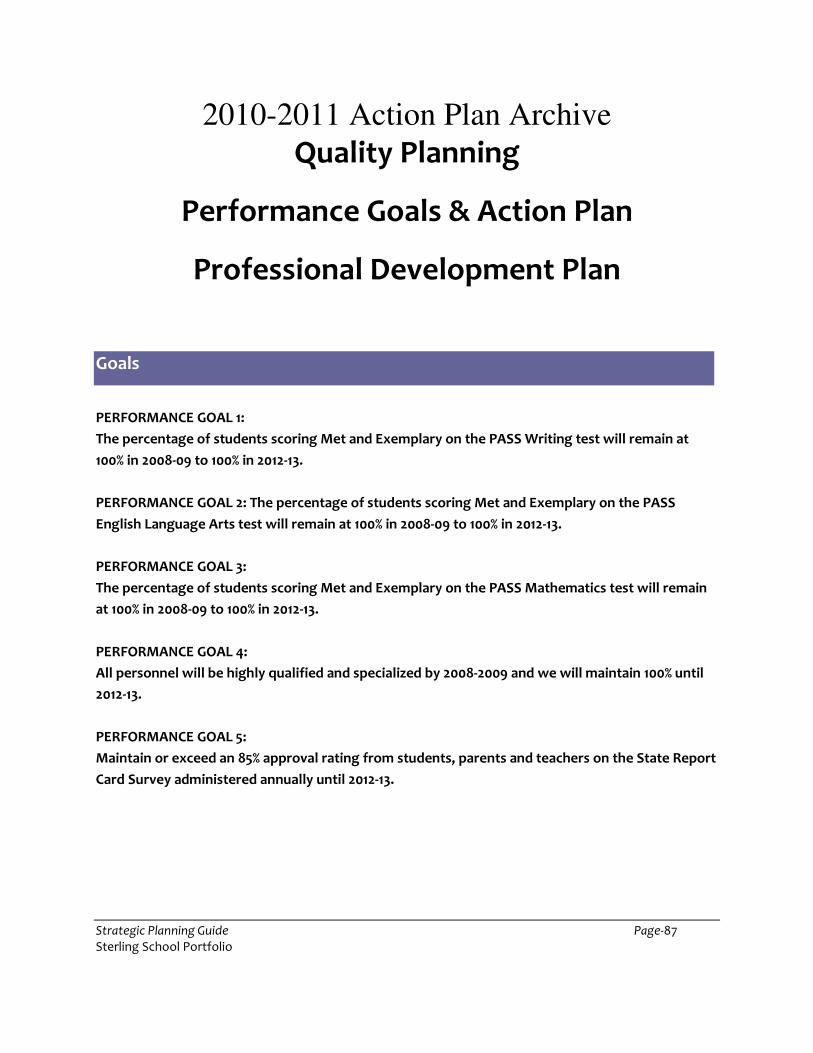
Strategic Planning Guide Page-87 Sterling School Portfolio
2010-2011 Action Plan Archive Quality Planning
Performance Goals & Action Plan
Professional Development Plan
Goals
PERFORMANCE GOAL 1:
The percentage of students scoring Met and Exemplary on the PASS Writing test will remain at
100% in 2008-09 to 100% in 2012-13.
PERFORMANCE GOAL 2: The percentage of students scoring Met and Exemplary on the PASS
English Language Arts test will remain at 100% in 2008-09 to 100% in 2012-13.
PERFORMANCE GOAL 3:
The percentage of students scoring Met and Exemplary on the PASS Mathematics test will remain
at 100% in 2008-09 to 100% in 2012-13.
PERFORMANCE GOAL 4:
All personnel will be highly qualified and specialized by 2008-2009 and we will maintain 100% until
2012-13.
PERFORMANCE GOAL 5:
Maintain or exceed an 85% approval rating from students, parents and teachers on the State Report
Card Survey administered annually until 2012-13.

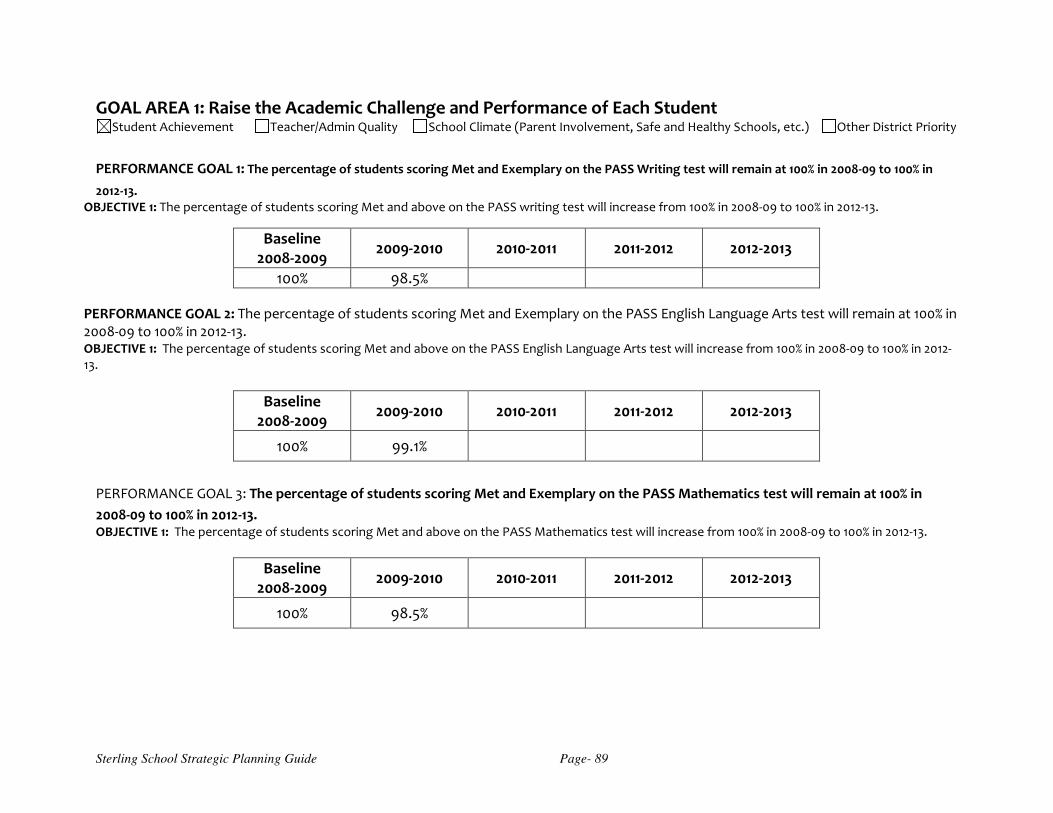
Sterling School Strategic Planning Guide Page- 89
GOAL AREA 1: Raise the Academic Challenge and Performance of Each Student Student Achievement Teacher/Admin Quality School Climate (Parent Involvement, Safe and Healthy Schools, etc.) Other District Priority
PERFORMANCE GOAL 1: The percentage of students scoring Met and Exemplary on the PASS Writing test will remain at 100% in 2008-09 to 100% in
2012-13. OBJECTIVE 1: The percentage of students scoring Met and above on the PASS writing test will increase from 100% in 2008-09 to 100% in 2012-13.
Baseline 2008-2009
2009-2010 2010-2011 2011-2012 2012-2013
100% 98.5%
PERFORMANCE GOAL 2: The percentage of students scoring Met and Exemplary on the PASS English Language Arts test will remain at 100% in 2008-09 to 100% in 2012-13. OBJECTIVE 1: The percentage of students scoring Met and above on the PASS English Language Arts test will increase from 100% in 2008-09 to 100% in 2012-13.
Baseline 2008-2009
2009-2010 2010-2011 2011-2012 2012-2013
100% 99.1%
PERFORMANCE GOAL 3: The percentage of students scoring Met and Exemplary on the PASS Mathematics test will remain at 100% in
2008-09 to 100% in 2012-13. OBJECTIVE 1: The percentage of students scoring Met and above on the PASS Mathematics test will increase from 100% in 2008-09 to 100% in 2012-13.
Baseline 2008-2009
2009-2010 2010-2011 2011-2012 2012-2013
100% 98.5%
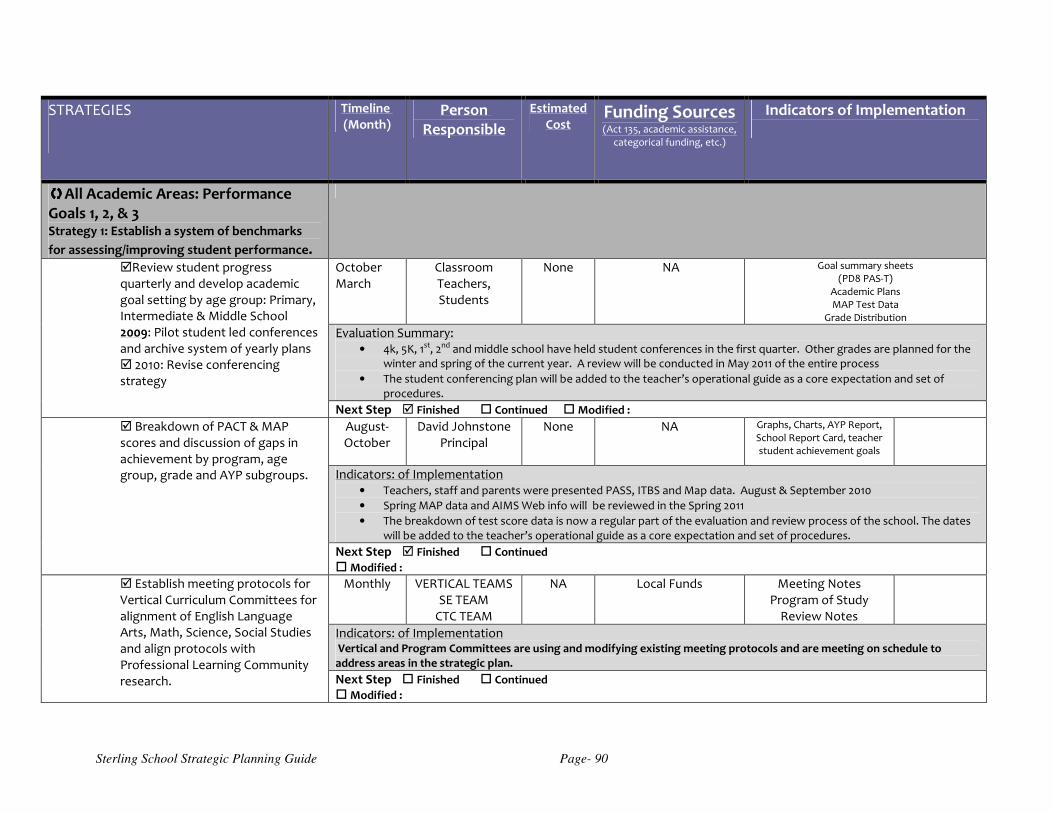
Sterling School Strategic Planning Guide Page- 90
STRATEGIES
Timeline (Month)
Person Responsible
Estimated Cost
Funding Sources (Act 135, academic assistance,
categorical funding, etc.)
Indicators of Implementation
����All Academic Areas: Performance Goals 1, 2, & 3
Strategy 1: Establish a system of benchmarks
for assessing/improving student performance.
�Review student progress quarterly and develop academic goal setting by age group: Primary, Intermediate & Middle School 2009: Pilot student led conferences and archive system of yearly plans � 2010: Revise conferencing strategy
October March
Classroom Teachers, Students
None NA Goal summary sheets (PD8 PAS-T)
Academic Plans MAP Test Data
Grade Distribution Evaluation Summary:
• 4k, 5K, 1st, 2nd and middle school have held student conferences in the first quarter. Other grades are planned for the winter and spring of the current year. A review will be conducted in May 2011 of the entire process
• The student conferencing plan will be added to the teacher’s operational guide as a core expectation and set of procedures.
Next Step � Finished � Continued � Modified :
� Breakdown of PACT & MAP scores and discussion of gaps in achievement by program, age group, grade and AYP subgroups.
August-October
David Johnstone Principal
None NA Graphs, Charts, AYP Report, School Report Card, teacher student achievement goals
Indicators: of Implementation • Teachers, staff and parents were presented PASS, ITBS and Map data. August & September 2010
• Spring MAP data and AIMS Web info will be reviewed in the Spring 2011
• The breakdown of test score data is now a regular part of the evaluation and review process of the school. The dates will be added to the teacher’s operational guide as a core expectation and set of procedures.
Next Step � Finished � Continued
� Modified : � Establish meeting protocols for Vertical Curriculum Committees for alignment of English Language Arts, Math, Science, Social Studies and align protocols with Professional Learning Community research.
Monthly VERTICAL TEAMS SE TEAM
CTC TEAM
NA Local Funds Meeting Notes Program of Study
Review Notes
Indicators: of Implementation Vertical and Program Committees are using and modifying existing meeting protocols and are meeting on schedule to address areas in the strategic plan. Next Step � Finished � Continued
� Modified :

Sterling School Strategic Planning Guide Page- 91
� Use Response to Intervention (RTI) Strategies to assess and intervene with Kindergaren through 2nd grade students
August-May 2010
Classroom Teachers SE TEAM
None Local Funds Peer review, rubric, Unit plans
Indicators: of Implementation RTI has been implemented and reviewed. Student progress is positive. The program will continue next year as part of the core instructional program. Next Step � Finished � Continued
� Modified : � Benchmark the Guidance Program with NAGC program standards.
October 2010
Merrie Clark Guidance
None None Benchmark Report
Indicators: of Implementation
• The guidance standards and NAGC benchmarks have been identified. Standard two is being reviewed. A final document will be complete with recommendations by May 2011.
Next Step � Finished � Continued
� Modified : Strategy 2: Review assessment strategies against student needs by program to modify the Program of Study.
� Develop and review Program of Study based on Focused Learning Principles for the current units of study in the Sterling Elementary Program. � Review and Modify Program of Study based on principles of educating highly gifted students in the Charles Townes Center.
October 2010-May
2011
Deborah Foulkes: Instructional Coach
VERTICAL TEAMS SE TEAM
CTC TEAM
$1,400 Local Funds Peer review, rubric, unit plans
Indicators: of Implementation • Changes in the Social Studies standards have been reviewed across all grade levels.
• Instructional components are being addressed with in vertical and Program, teams.
• Grade levels are modifying existing unit
Next Step � Finished � Continued
���� Modified: Include additional designation of technology integrated opportunities within the Program of Study and monitor effectiveness.
� Use the arts to look at assessment strategies for projects and performances.
July-May 2011
Anna Dean: Coordinator
VERTICAL TEAMS SE TEAM
CTC TEAM
None NA
Lesson Plans Artist in Residence Assessment Bank
Indicators: of Implementation • SmartArts trained teachers are using strategies.
• Across the board review and evaluation is slated for Spring 2011
Next Step � Finished � Continued
���� Modified:
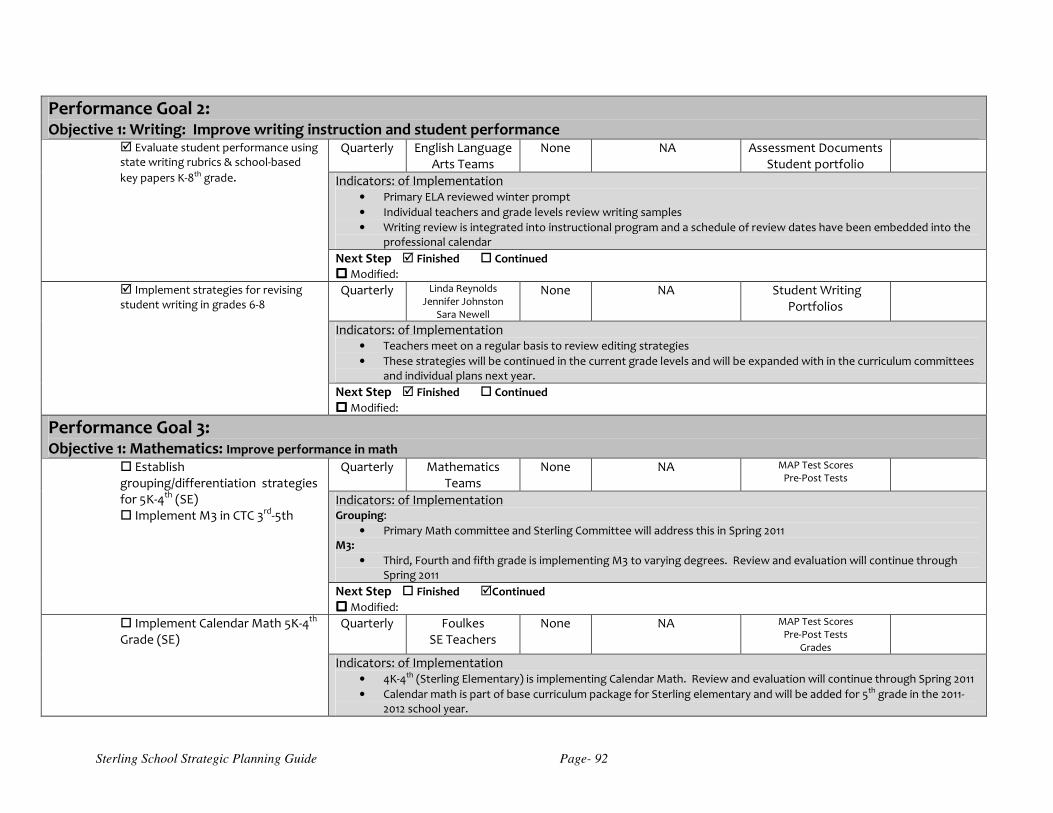
Sterling School Strategic Planning Guide Page- 92
Performance Goal 2: Objective 1: Writing: Improve writing instruction and student performance
� Evaluate student performance using state writing rubrics & school-based
key papers K-8th grade.
Quarterly English Language Arts Teams
None NA Assessment Documents Student portfolio
Indicators: of Implementation • Primary ELA reviewed winter prompt
• Individual teachers and grade levels review writing samples
• Writing review is integrated into instructional program and a schedule of review dates have been embedded into the professional calendar
Next Step � Finished � Continued
���� Modified: � Implement strategies for revising student writing in grades 6-8
Quarterly Linda Reynolds Jennifer Johnston
Sara Newell
None NA Student Writing Portfolios
Indicators: of Implementation • Teachers meet on a regular basis to review editing strategies
• These strategies will be continued in the current grade levels and will be expanded with in the curriculum committees and individual plans next year.
Next Step � Finished � Continued
���� Modified:
Performance Goal 3: Objective 1: Mathematics: Improve performance in math
� Establish grouping/differentiation strategies for 5K-4th (SE) � Implement M3 in CTC 3rd-5th
Quarterly Mathematics Teams
None NA MAP Test Scores Pre-Post Tests
Indicators: of Implementation Grouping:
• Primary Math committee and Sterling Committee will address this in Spring 2011 M3:
• Third, Fourth and fifth grade is implementing M3 to varying degrees. Review and evaluation will continue through Spring 2011
Next Step � Finished �Continued
���� Modified: � Implement Calendar Math 5K-4th Grade (SE)
Quarterly Foulkes SE Teachers
None NA MAP Test Scores Pre-Post Tests
Grades
Indicators: of Implementation • 4K-4th (Sterling Elementary) is implementing Calendar Math. Review and evaluation will continue through Spring 2011
• Calendar math is part of base curriculum package for Sterling elementary and will be added for 5th grade in the 2011-2012 school year.
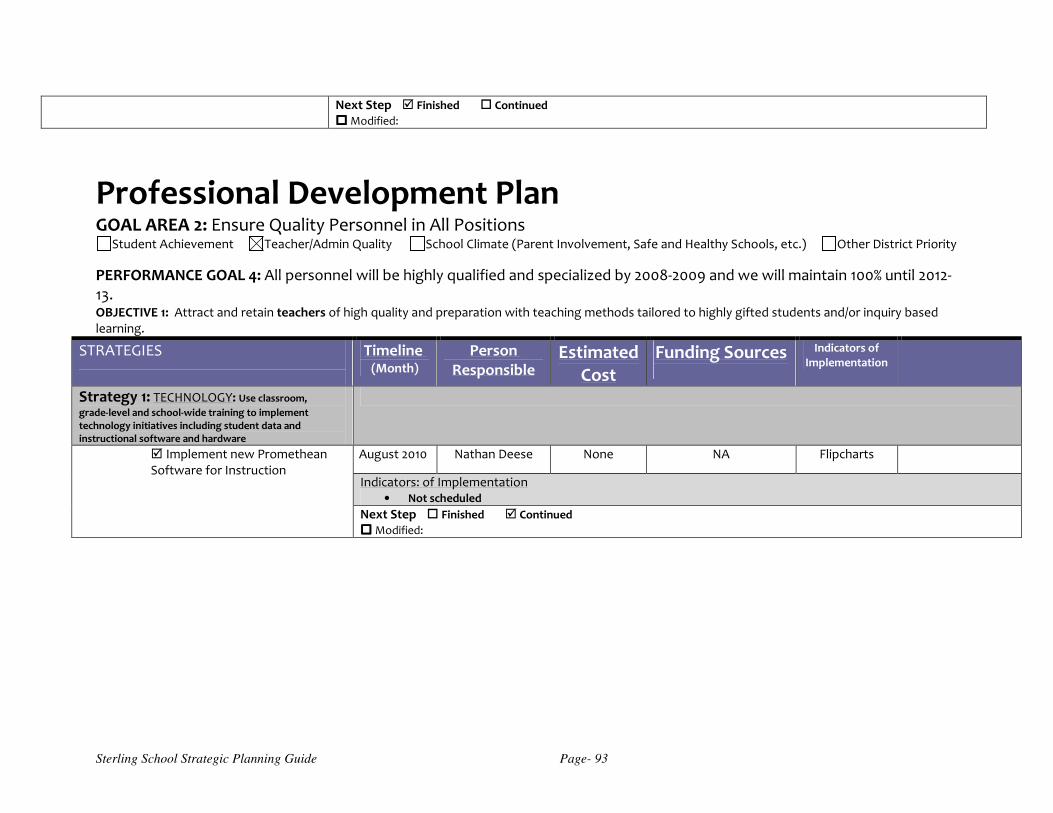
Sterling School Strategic Planning Guide Page- 93
Next Step � Finished � Continued
���� Modified:
Professional Development Plan GOAL AREA 2: Ensure Quality Personnel in All Positions
Student Achievement Teacher/Admin Quality School Climate (Parent Involvement, Safe and Healthy Schools, etc.) Other District Priority
PERFORMANCE GOAL 4: All personnel will be highly qualified and specialized by 2008-2009 and we will maintain 100% until 2012-13. OBJECTIVE 1: Attract and retain teachers of high quality and preparation with teaching methods tailored to highly gifted students and/or inquiry based learning.
STRATEGIES
Timeline (Month)
Person Responsible
Estimated Cost
Funding Sources
Indicators of Implementation
Strategy 1: TECHNOLOGY: Use classroom,
grade-level and school-wide training to implement technology initiatives including student data and instructional software and hardware
� Implement new Promethean Software for Instruction
August 2010 Nathan Deese None NA Flipcharts
Indicators: of Implementation • Not scheduled
Next Step � Finished � Continued
���� Modified:
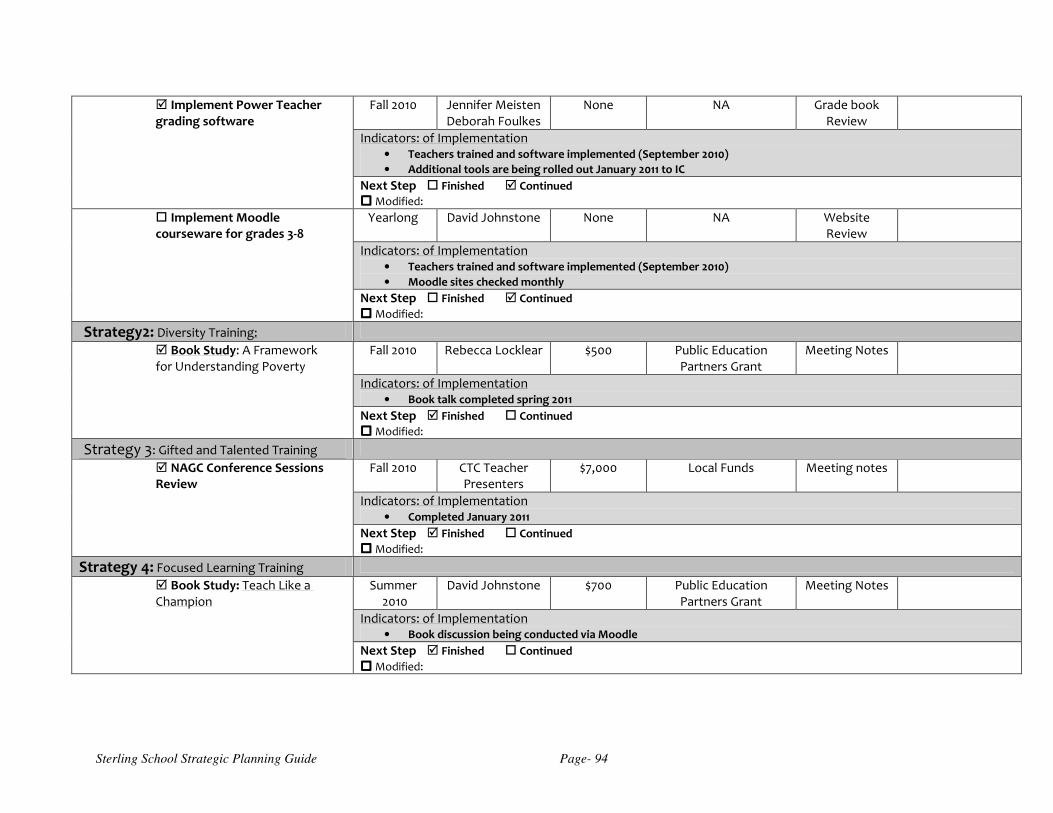
Sterling School Strategic Planning Guide Page- 94
� Implement Power Teacher grading software
Fall 2010 Jennifer Meisten Deborah Foulkes
None NA Grade book Review
Indicators: of Implementation • Teachers trained and software implemented (September 2010)
• Additional tools are being rolled out January 2011 to IC
Next Step � Finished � Continued
���� Modified:
� Implement Moodle courseware for grades 3-8
Yearlong David Johnstone None NA Website Review
Indicators: of Implementation • Teachers trained and software implemented (September 2010)
• Moodle sites checked monthly
Next Step � Finished � Continued
���� Modified:
Strategy2: Diversity Training:
� Book Study: A Framework for Understanding Poverty
Fall 2010 Rebecca Locklear $500 Public Education Partners Grant
Meeting Notes
Indicators: of Implementation • Book talk completed spring 2011
Next Step � Finished � Continued
���� Modified:
Strategy 3: Gifted and Talented Training
� NAGC Conference Sessions Review
Fall 2010 CTC Teacher Presenters
$7,000 Local Funds Meeting notes
Indicators: of Implementation • Completed January 2011
Next Step � Finished � Continued
���� Modified:
Strategy 4: Focused Learning Training
� Book Study: Teach Like a Champion
Summer 2010
David Johnstone $700 Public Education Partners Grant
Meeting Notes
Indicators: of Implementation • Book discussion being conducted via Moodle
Next Step � Finished � Continued
���� Modified:
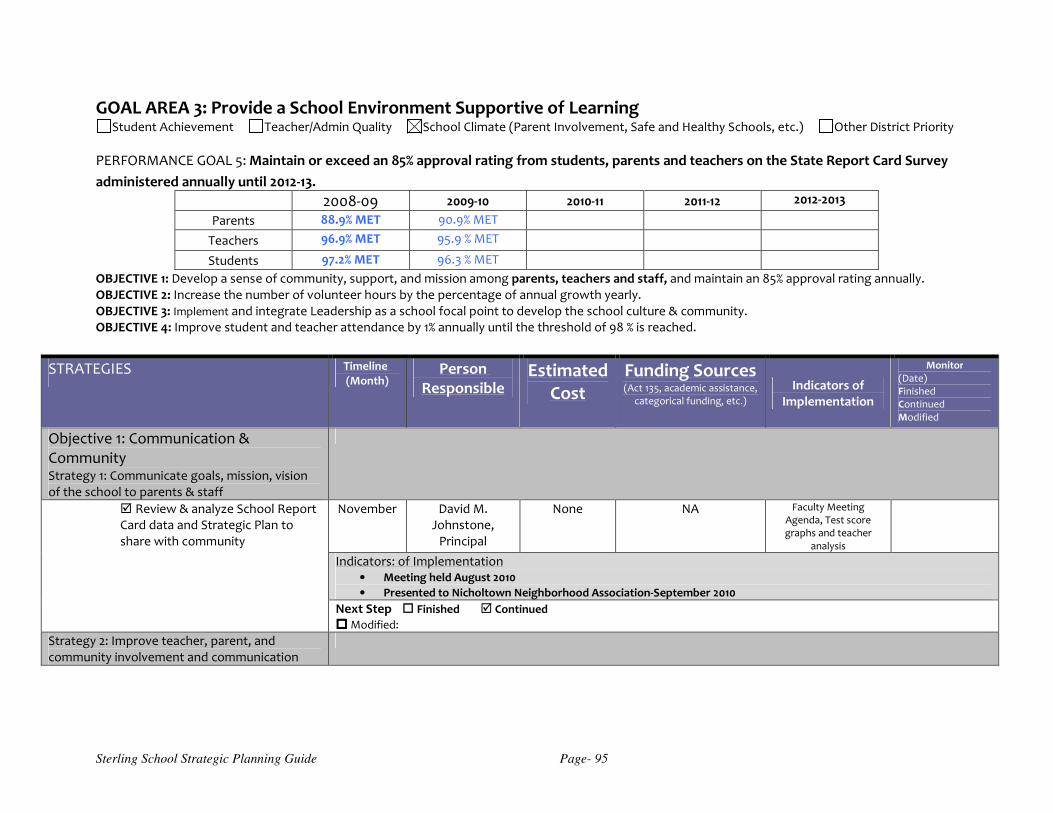
Sterling School Strategic Planning Guide Page- 95
GOAL AREA 3: Provide a School Environment Supportive of Learning Student Achievement Teacher/Admin Quality School Climate (Parent Involvement, Safe and Healthy Schools, etc.) Other District Priority
PERFORMANCE GOAL 5: Maintain or exceed an 85% approval rating from students, parents and teachers on the State Report Card Survey
administered annually until 2012-13.
2008-09 2009-10 2010-11 2011-12 2012-2013
Parents 88.9% MET 90.9% MET
Teachers 96.9% MET 95.9 % MET
Students 97.2% MET 96.3 % MET OBJECTIVE 1: Develop a sense of community, support, and mission among parents, teachers and staff, and maintain an 85% approval rating annually. OBJECTIVE 2: Increase the number of volunteer hours by the percentage of annual growth yearly. OBJECTIVE 3: Implement and integrate Leadership as a school focal point to develop the school culture & community. OBJECTIVE 4: Improve student and teacher attendance by 1% annually until the threshold of 98 % is reached.
STRATEGIES Timeline (Month)
Person Responsible
Estimated Cost
Funding Sources (Act 135, academic assistance,
categorical funding, etc.)
Indicators of Implementation
Monitor (Date) Finished Continued Modified
Objective 1: Communication & Community Strategy 1: Communicate goals, mission, vision of the school to parents & staff
� Review & analyze School Report Card data and Strategic Plan to share with community
November David M. Johnstone,
Principal
None NA Faculty Meeting Agenda, Test score graphs and teacher
analysis
Indicators: of Implementation • Meeting held August 2010
• Presented to Nicholtown Neighborhood Association-September 2010
Next Step � Finished � Continued
���� Modified: Strategy 2: Improve teacher, parent, and community involvement and communication

Sterling School Strategic Planning Guide Page- 96
� Continue to build partnerships with the community and implement a partnership with the Greenville Hospital System.
Annually Merrie Clark Guidance; Facilitator,
SIC, PTA
$1500 General Funds GHS
Indicators: of Implementation • Committee Meetings Held
• Meeting with GHS and stakeholders held
• Units to be written
• Visits & Field trips to be coordinated
Next Step � Finished � Continued
���� Modified: � Provide diversity training opportunities for parents and students
TBA David Johnstone $1500 Local Funds Presentations Attendance log
Indicators: of Implementation • Not scheduled
Next Step � Finished � Continued
���� Modified: �Develop parent workshops, orientations and partnerships address CTC & Sterling Elementary student developmental and academic needs.
Bi-Annual PTA Merrie Clark:
Guidance
None PTA Budget Volunteer Hours Log and meeting attendance log
Indicators: of Implementation • Dr. Shucker
• Media Literacy
• Book talks
Next Step � Finished � Continued
���� Modified:
�Develop and communicate Student Support Plan:
o Discipline o Communication o Academic Assistance
September 2010
David Johnstone None NA Plan
Indicators: of Implementation • Developed and added to the staff operational guide.
Next Step � Finished � Continued
���� Modified:
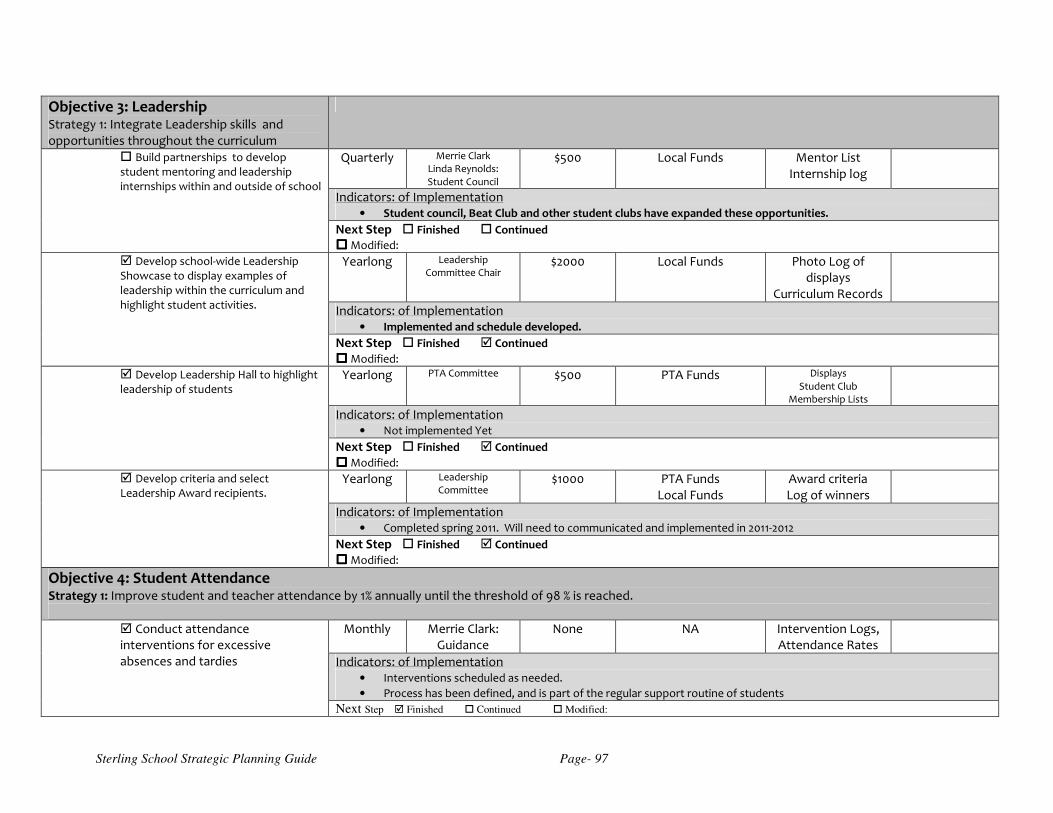
Sterling School Strategic Planning Guide Page- 97
Objective 3: Leadership Strategy 1: Integrate Leadership skills and opportunities throughout the curriculum
� Build partnerships to develop student mentoring and leadership internships within and outside of school
Quarterly Merrie Clark Linda Reynolds: Student Council
$500 Local Funds Mentor List Internship log
Indicators: of Implementation • Student council, Beat Club and other student clubs have expanded these opportunities.
Next Step � Finished � Continued
���� Modified: � Develop school-wide Leadership Showcase to display examples of leadership within the curriculum and highlight student activities.
Yearlong Leadership Committee Chair
$2000 Local Funds Photo Log of displays
Curriculum Records
Indicators: of Implementation • Implemented and schedule developed.
Next Step � Finished � Continued
���� Modified: � Develop Leadership Hall to highlight leadership of students
Yearlong PTA Committee $500 PTA Funds Displays Student Club
Membership Lists
Indicators: of Implementation • Not implemented Yet
Next Step � Finished � Continued
���� Modified: � Develop criteria and select Leadership Award recipients.
Yearlong Leadership Committee
$1000 PTA Funds Local Funds
Award criteria Log of winners
Indicators: of Implementation • Completed spring 2011. Will need to communicated and implemented in 2011-2012
Next Step � Finished � Continued
���� Modified:
Objective 4: Student Attendance Strategy 1: Improve student and teacher attendance by 1% annually until the threshold of 98 % is reached.
� Conduct attendance interventions for excessive absences and tardies
Monthly Merrie Clark: Guidance
None NA Intervention Logs, Attendance Rates
Indicators: of Implementation • Interventions scheduled as needed.
• Process has been defined, and is part of the regular support routine of students
Next Step � Finished � Continued � Modified:
Sterling School Strategic Planning Guide Page- 98
Appendix D Report Card 2011