Greenhouse Gas Analysis for the Crystal View Terrace/ Green
68
Greenhouse Gas Analysis for the Crystal View Terrace/ Green Orchard Place/ Overlook Parkway Project, City of Riverside Prepared for Prepared by City of Riverside RECON Environmental, Inc. Community Development Department 1927 Fifth Avenue Planning Division San Diego, CA 92101-2358 3900 Main Street, Third Floor P 619.308.9333 F 619.308.9334 Riverside, CA 92522 RECON Number 6103 Attn: Diane Jenkins, Principal Planner November 28, 2012
Transcript of Greenhouse Gas Analysis for the Crystal View Terrace/ Green
Greenhouse Gas Analysis for the Crystal View Terrace/
Green Orchard Place/ Overlook Parkway Project,
City of Riverside
Prepared for Prepared by
City of Riverside RECON Environmental, Inc.
Community Development Department 1927 Fifth Avenue
Planning Division San Diego, CA 92101-2358
3900 Main Street, Third Floor P 619.308.9333 F 619.308.9334
Riverside, CA 92522 RECON Number 6103
Attn: Diane Jenkins, Principal Planner November 28, 2012


Greenhouse Gas Analysis for the Crystal View Terrace/Green Orchard Place/Overlook Parkway Project
TABLE OF CONTENTS
Executive Summary 1
1.0 Introduction 2
1.1 Understanding Global Climate Change 2
1.2 Greenhouse Gases of Primary Concern 3
2.0 Project Description 5
2.1 Project Background 9
2.2 Project Baseline 14
3.0 Existing Conditions 15
3.1 Environmental Setting 15
3.1.1 State and Regional GHG Inventories 15 3.1.2 Consequences of Global Climate Change 17
3.2 Regulatory Background 17
3.2.1 International 17 3.2.2 National 20 3.2.3 State 22 3.2.4 Local 34
4.0 Significance Criteria and Analysis Methodologies 36
4.1 Determining Significance 36
4.1.1 SCAQMD Interim GHG Thresholds 36 4.1.2 BAU Analysis 39
5.0 Impact Analysis 40
5.1 GHG Emissions 40
5.1.1 Transportation-related GHG Emissions 40 5.1.2 Construction GHG Emissions 43 5.1.3 Total GHG Emissions 48 5.1.4 Significance of Impacts 54
5.2 Project Consistency with Adopted GHG Plans, Policies, and Regulations 54
5.2.1 Impacts 54 5.2.2 Significance of Impacts 58
6.0 Conclusions and Recommendations 59
7.0 References Cited 60

Greenhouse Gas Analysis for the Crystal View Terrace/Green Orchard Place/Overlook Parkway Project
TABLE OF CONTENTS (CONT.)
FIGURES
1: Regional Location 6 2: Aerial Photograph of Project and Vicinity 7 3a: Scenario 1 10 3b: Scenario 2 11 3c: Scenario 3 12 3d: Scenario 4 13
TABLES
1: Global Warming Potentials and Atmospheric Lifetimes 3 2: California GHG Emissions by Sector in 1990, 2000, 2004 and 2008 15 3: City of Riverside GHG Emissions by Sector 16 4: CARB Scoping Plan Recommended GHG Reduction Measures 25 5a: Existing Annual Vehicle GHG Emissions 42 5b: Year 2020 Annual Vehicle GHG Emissions 43 5c: Buildout Annual Vehicle GHG Emissions 43 6: Bridge and Fill Crossing Construction Equipment Parameters 46 7: Summary of Bridge and Fill Crossing Construction GHG Emissions
for Scenario 3 47 8: Construction Equipment Parameters for the Proposed C Street 48 9: Summary of Scenario 4 Construction GHG Emissions 48 10a: Existing Annual Total GHG Emissions 49 10b: Year 2020 Annual Total GHG Emissions 49 10c: Buildout Annual Total GHG Emissions 50 11: Significance of GHG Impacts 55
ATTACHMENTS
1: Understanding Global Climate Change 2: EMFAC 2007 Output Files 3: EMFAC Emission Factors and GHG Emission Calculations 4: N2O Emission Factor Calculations 5: Pavley I + LCFS Postprocessor Output Files 6: CalEEMod Input/Output – Bridge and Fill-Crossing Construction 7: CalEEMod Input/Output – Proposed C Street Construction
Greenhouse Gas Analysis for the Crystal View Terrace/Green Orchard Place/Overlook Parkway Project
Page 1
Executive Summary The Crystal View Terrace/Green Orchard Place/Overlook Parkway Project (proposed Project) is located in the City of Riverside, California. The proposed Project involves the evaluation of four circulation scenarios associated with Overlook Parkway. Overlook Parkway runs east-west from Washington Street to Alessandro Boulevard; however, Overlook Parkway is not connected between Brittanee Delk Court and Sandtrack Road and over the Alessandro Arroyo between Crystal View Terrace and Via Vista Drive. In addition, Overlook Parkway does not extend west past Washington Street; therefore, a direct connection to State Route 91 does not exist from Overlook Parkway. As a result of the approval of two separate tract maps, gates at Crystal View Terrace and Green Orchard Place were installed to prevent cut-through traffic until Overlook Parkway was completed across the Alessandro Arroyo. Four circulation scenarios are being analyzed in order to provide decision makers with sufficient information to select a preferred scenario. In addition, two baselines representing conditions with the gates closed and the gates open were considered for the analysis.
In summary, when compared to the Gates Closed baseline, greenhouse gas impacts due to Scenarios 1, 2, 3, and 4 would be less than significant. When compared to the Gates Open baseline, Scenarios 1 and 3 would be significant in year 2020 and at buildout. These calculations take into account statewide measures aimed at reducing vehicle greenhouse gas emissions (i.e., Pavley and Low Carbon Fuel Standard). Further reductions in vehicle emissions could only come from additional state and federal measures that would increase vehicle efficiency and would be out of the control of the proposed Project and the City of Riverside. Therefore, Scenarios 1 and 3 would remain significant and unavoidable when compared to the Gates Open baseline.
The proposed Project is consistent with the goals and strategies of state plans, policies, and regulations aimed at reducing GHG emissions. Because Scenario 2 would not result in an increase in vehicle miles traveled or net GHG emissions, impacts due to Scenario 2 would be less than significant. Scenarios 3 and 4 would improve traffic flow and therefore be consistent with the goals behind General Plan 2025 Policy AQ-2.4 of achieving performance goals. Impacts under Scenarios 3 and 4 would be less than significant. Although Scenario 1 would increase vehicle miles traveled, this scenario would not prevent the City from achieving performance goals related to reduced vehicle emissions. Impacts would also be less than significant. Off-site improvements would not conflict with applicable goals and policies related to greenhouse gas emissions, and impacts are less than significant.

Greenhouse Gas Analysis for the Crystal View Terrace/Green Orchard Place/Overlook Parkway Project
Page 2
1.0 Introduction This report evaluates the significance of the proposed Project’s contribution of greenhouse gas (GHG) emissions to statewide GHG emissions and GHG emissions reduction targets. To evaluate the incremental effect of project development on statewide and global climate change, it is important to have a basic understanding of the nature of the global climate change problem.
1.1 Understanding Global Climate Change
Global climate change is a change in the average weather of the earth, which can be measured by wind patterns, storms, precipitation, and temperature. The earth’s climate is in a state of constant flux with periodic warming and cooling cycles. Extreme periods of cooling are termed “ice ages,” which may then be followed by extended periods of warmth. For most of the earth’s geologic history, these periods of warming and cooling have been the result of many complicated, interacting natural factors that include volcanic eruptions which spew gases and particles (dust) into the atmosphere, the amount of water, vegetation, and ice covering the earth’s surface, subtle changes in the earth’s orbit, and the amount of energy released by the sun (sun cycles). However, since the beginning of the Industrial Revolution around 1750, the average temperature of the earth has been increasing at a rate that is faster than can be explained by natural climate cycles alone.
With the Industrial Revolution came an increase in the combustion of carbon-based fuels such as wood, coal, oil, natural gas, and biomass. Industrial processes have also created emissions of substances that are not found in nature. This in turn has led to a marked increase in the emissions of gases that have been shown to influence the world’s climate. These gases, termed “greenhouse” gases, influence the amount of heat that is trapped in the earth’s atmosphere. Because recently observed increased concentrations of GHGs in the atmosphere are related to increased emissions resulting from human activity, the current cycle of “global warming” is generally believed to be largely due to human activity. Of late, the issue of global warming or global climate change has arguably become the most important and widely debated environmental issue in the United States and the world. Because climate change is caused by the collective of human actions taking place throughout the world, it is quintessentially a global or cumulative issue.

Greenhouse Gas Analysis for the Crystal View Terrace/Green Orchard Place/Overlook Parkway Project
Page 3
1.2 Greenhouse Gases of Primary Concern
There are numerous GHGs, both naturally occurring and manmade. Table 1 summarizes some of the most common. Each GHG has variable atmospheric lifetime and global warming potential.
TABLE 1
GLOBAL WARMING POTENTIALS (GWPs) AND ATMOSPHERIC LIFETIMES (YEARS)
Gas
Atmospheric Lifetime 100-year GWP
20-year GWP
500-year GWP
CO2 50-200 1 1 1 CH4
a 12±3 21 56 6.5 N2O 120 310 280 170
HFC-23 264 11,700 9,100 9,800 HFC-125 32.6 2,800 4,600 920 HFC-134a 14.6 1,300 3,400 420 HFC-143a 48.3 3,800 5,000 1,400 HFC-152a 1.5 140 460 42
HFC-227ea 36.5 2,900 4,300 950 HFC-236fa 209 6,300 5,100 4,700
HFC-4310mee 17.1 1,300 3,000 400 CF4 50,000 6,500 4,400 10,000 C2F6 10,000 9,200 6,200 14,000 C4F10 2,600 7,000 4,800 10,100 C6F14 3,200 7,400 5,000 10,700 SF6 3,200 23,900 16,300 34,900
Source: U.S. EPA 2010a, Annex 6. a The CH4 GWP includes the direct effects and those indirect effects due to the production of tropospheric ozone and stratospheric water vapor. The indirect effect due to the production of CO2 is not included.
The atmospheric lifetime of the GHG is the average time the molecule stays stable in the atmosphere. Most GHGs have long atmospheric lifetimes, staying in the atmosphere hundreds or thousands of years. The potential of a gas to trap heat and warm the atmosphere is measured by its global warming potential (GWP). Specifically, GWP is defined as (U.S. Environmental Protection Agency [EPA] 2010a):
the cumulative radiative forcing—both direct and indirect effects—integrated over a period of time from the emission of a unit mass of gas relative to some reference gas.
The reference gas for establishing GWP is carbon dioxide (CO2), which—as shown in Table 1—consequently has a GWP of 1. As an example, methane (CH4), while having a shorter atmospheric lifetime than carbon dioxide, has a 100-year GWP of 21, which means that it has a greater global warming effect than carbon dioxide on a molecule-by-molecule basis.

Greenhouse Gas Analysis for the Crystal View Terrace/Green Orchard Place/Overlook Parkway Project
Page 4
Of the gases listed in Table 1, CO2, CH4, and nitrous oxide (N2O) are produced by both biogenic (natural) and anthropogenic (human) sources. Hydrofluorocarbons (HFCs), perfluorocarbons (PFCs), and sulfur hexafluoride (SF6) occur solely as the result of human processes and are not of primary concern to the proposed Project as explained below. The following is a description of each of these gases:
• Carbon Dioxide (CO2): Carbon dioxide enters the atmosphere through the burning of fossil fuels (oil, natural gas, and coal), solid waste decomposition, trees and wood products, and also as a result of other chemical reactions (e.g., manufacturing of cement). Carbon dioxide is also removed from the atmosphere (or “sequestered”) when it is absorbed by plants as part of the biological carbon cycle.
• Methane (CH4): Methane is emitted during the production and transport of coal, natural gas, and oil. Methane emissions also result from livestock and other agricultural practices and by the decay of organic waste in municipal solid waste landfills.
• Nitrous Oxide (N2O): Nitrous oxide is emitted during agricultural and industrial activities, as well as during combustion of fossil fuels and solid waste decomposition.
• Hydrofluorocarbons (HFCs): HFC’s are used for refrigeration, air conditioning, foam blowing, aerosols and fire extinguishing. The Project does not involve any of these uses.
• Perflurorcarbons (PFCs): PFC’s are used in the medical industry for such things as eye surgery, imaging, liquid breathing, artificial blood, and the treatment of decompression sickness. PFCs are also used in aluminum production. The Project does not involve any of these uses.
• Sulfur Hexaflouride (SF6): SF6 is used in the electrical industry as a gaseous dielectric medium for high-voltage circuit breakers, switchgear, and other electrical equipment, often replacing oil filled circuit breakers that can contain harmful polychlorinated biphenyls (PCBs). The Project does not involve any of these uses.
Because the Project does not involve any uses that would generate HFCs, PFCs, or SF6, CO2, CH4 and N2O are the GHGs of primary concern in this analysis. CO2 would be emitted by the proposed Project during the combustion of fossil fuels in vehicles (including construction). Smaller amounts of CH4 and N2O would be emitted from the same Project operations.

Greenhouse Gas Analysis for the Crystal View Terrace/Green Orchard Place/Overlook Parkway Project
Page 5
More information on the background of global warming and GHGs can be found in Attachment 1: Understanding Global Climate Change.
2.0 Project Description The Crystal View Terrace/Green Orchard Place/Overlook Parkway Project (proposed Project) is located in the City of Riverside, California. The Project area is a large area generally bounded by John F Kennedy Drive and Hermosa Drive to the south, Adams Street and State Route 91 (SR-91) to the west, Arlington Avenue to the north, and Alessandro Boulevard and Trautwein Road to the east. Figure 1 shows the regional location and Figure 2 shows the Project area on an aerial photograph.
The proposed Project involves the evaluation of four circulation scenarios associated with Overlook Parkway. Overlook Parkway runs east-west from Alessandro Boulevard to Washington Street; however, Overlook Parkway is not connected between Brittanee Delk Court and Sandtrack Road and over the Alessandro Arroyo between Crystal View Terrace and Via Vista Drive. In addition, a connection does not extend west past Washington Street; therefore, a direct connection to SR-91 does not exist from Overlook Parkway. As a result of the approval of two separate tract maps, gates at Crystal View Terrace and Green Orchard Place were installed to address cut-through traffic until Overlook Parkway was completed across the Alessandro Arroyo. Four circulation scenarios are being analyzed in order to provide decision makers with sufficient information to select a preferred scenario.
Scenario 1 — Gates closed to through traffic, no connection of Overlook Parkway: Under Scenario 1, both Crystal View Terrace and Green Orchard Place gates would remain in place and be closed until Overlook Parkway is connected to the east across the Alessandro Arroyo, to Alessandro Boulevard, and a connection westerly of Washington Street is built.
Scenario 2 — Gates removed, no connection of Overlook Parkway: Under Scenario 2, the gates at both Crystal View Terrace and Green Orchard Place would be removed, and there would be no connection of Overlook Parkway across the Alessandro Arroyo to Alessandro Boulevard. Overlook Parkway and connection to the SR-91 would remain on the General Plan 2025 Master Plan of Roadways.

FIGURE 1
Regional Location
#*
#*
§̈¦10
§̈¦215
§̈¦15
§̈¦10
§̈¦215
UV60
UV91
UV173
UV30
UV330
UV138
UV18
UV83
UV74
UV71
UV74
UV30
UV173
UV66
UV38
E
l To
ro
Rubidou-MissionBoulevard Station
Riverside-Magnolia StationRiverside
Ontario
Perris
Corona
Fontana
Redlands
Rialto
Moreno Valley
Chino
Yucaipa
Lake Elsinore
Colton
Norco
UplandHighland
Crestline
Hesperia
San Bernardino
Rancho Cucamonga
Chino Hills
Hemet
Rubidoux
Sun City
San Jacinto
Lake Forest
PedleyGlen Avon
Loma Linda
Mira Loma
Montclair
Bloomington
Anaheim
Mission Viejo
Grand Terrace
Rancho Santa Margarita
Foothill Ranch
Beaumont#*
#*
§̈¦10
§̈¦215
§̈¦15
§̈¦10
§̈¦215
UV60
UV91
UV173
UV30
UV330
UV138
UV18
UV83
UV74
UV71
UV74
UV30
UV173
UV66
UV38
E
l To
ro
Rubidou-MissionBoulevard Station
Riverside-Magnolia StationRiverside
Ontario
Perris
Corona
Fontana
Redlands
Rialto
Moreno Valley
Chino
Yucaipa
Lake Elsinore
Colton
Norco
UplandHighland
Crestline
Hesperia
San Bernardino
Rancho Cucamonga
Chino Hills
Hemet
Rubidoux
Sun City
San Jacinto
Lake Forest
PedleyGlen Avon
Loma Linda
Mira Loma
Montclair
Bloomington
Anaheim
Mission Viejo
Grand Terrace
Rancho Santa Margarita
Foothill Ranch
Beaumont
M:\JOBS4\6103\common_gis\Air_fig1.mxd 11/29/2012
0 5Miles [
Riverside City Limit
#* Air Monitoring Station

FIGURE 2
Aerial Photograph of Project and Vicinity
EB 9
1
WB
91
VICTO
RIA
AV
LINC
OLN
AV
AD
AM
S
ARLINGTON AV
JEFFER
SO
N
MA
DIS
ON
MO
NR
OE
WA
SH
ING
TO
N
MA
RY
ALESSANDRO
BL
MA
GN
OLIA
AV
OVERLOOK PKWY
CA
NY
ON
CR
ES
T D
R
DU
FFERIN
AV
TR
AU
TW
EIN
RDJA
CK
SO
N
IND
IAN
A AV
BRADLEY
CA
LIFO
RN
IA A
VCHICAG
O A
V
E ALESSANDRO BL
BR
OC
KTO
N A
V
MISSION GROVE PKWY N
MISSION GROVE PK WY N
DU
FFERIN
AV
AL
ES
SA
ND
RO
BL
VICTO
RIA
AV
TR
AU
TW
EIN
RD
OVER
LOO
K P
KW
Y
MIS
SIO
N G
RO
VE
PKW
Y NIN
DIA
NA A
V
ARLINGTON AV
MA
GN
OLIA
AV
Impage Source: City of Riverside, 2009
0 2,000Feet [
M:\JOBS4\6103\common_gis\Air_fig2.mxd 3/7/2012
Project Boundary

Greenhouse Gas Analysis for the Crystal View Terrace/Green Orchard Place/Overlook Parkway Project
Page 9
Scenario 3 — Gates removed, Overlook Parkway connected: Under Scenario 3, the gates at Crystal View Terrace and Green Orchard Place would be removed, and Overlook Parkway would be connected between Via Vista Drive and Sandtrack Road with the construction of a fill crossing and over the Alessandro Arroyo with a bridge crossing, allowing for a through connection to Alessandro Boulevard. The connection to the SR-91 would not be considered and would be removed from the Master Plan of Roadways in the General Plan 2025.
Scenario 4 — Gates removed, Overlook Parkway connected and the Proposed C Street constructed west of Washington Street: Under Scenario 4, both Crystal View Terrace and Green Orchard Place gates would be removed and Overlook Parkway would be connected east across Alessandro Arroyo and to Alessandro Boulevard. In addition, a roadway (the Proposed C Street) would also be extended west of Washington Street.
The Project area lies within five neighborhoods: the Alessandro Heights (northern portion), Canyon Crest (southwestern portion), Casa Blanca (northern portion), Arlington Heights (northeastern portion), and the Hawarden Hills (western portion). The land uses in the Project area primarily include agricultural, rural residential, hillside residential, and very low density residential. A greater variety and intensity of land uses occurs between Victoria Avenue and State Highway 91, including commercial and higher density residential uses. The residential land uses near Crystal View Terrace and Green Orchard Place are categorized as hillside residential and very low density. The land uses near the new alignment for the Proposed C Street, the westerly connection, also include agricultural, rural residential, hillside residential, and very low density residential.
Figures 3a through 3d depict each of the four scenarios.
2.1 Project Background
In May 2001, the City Council approved a subdivision (TM-29515) that proposed extending a road (Green Orchard Place) to ultimately connect with an existing segment of Green Orchard Place built on what was then unincorporated County land. To avoid having significant volumes of cut-through traffic using this local residential street, the City Council approved a condition of the map and a mitigation measure of the related Mitigated Negative Declaration prohibiting any connection between the two street segments "until the Overlook Parkway extension across the Alessandro Arroyo has been completed".
In February 2006, the City Council approved another subdivision map (TM-29628) that included the extension of Crystal View Terrace from Overlook Parkway to connect with an existing stretch of Crystal View Terrace that extended from Berry Road on what was then unincorporated County land. The City Council also adopted a condition of approval
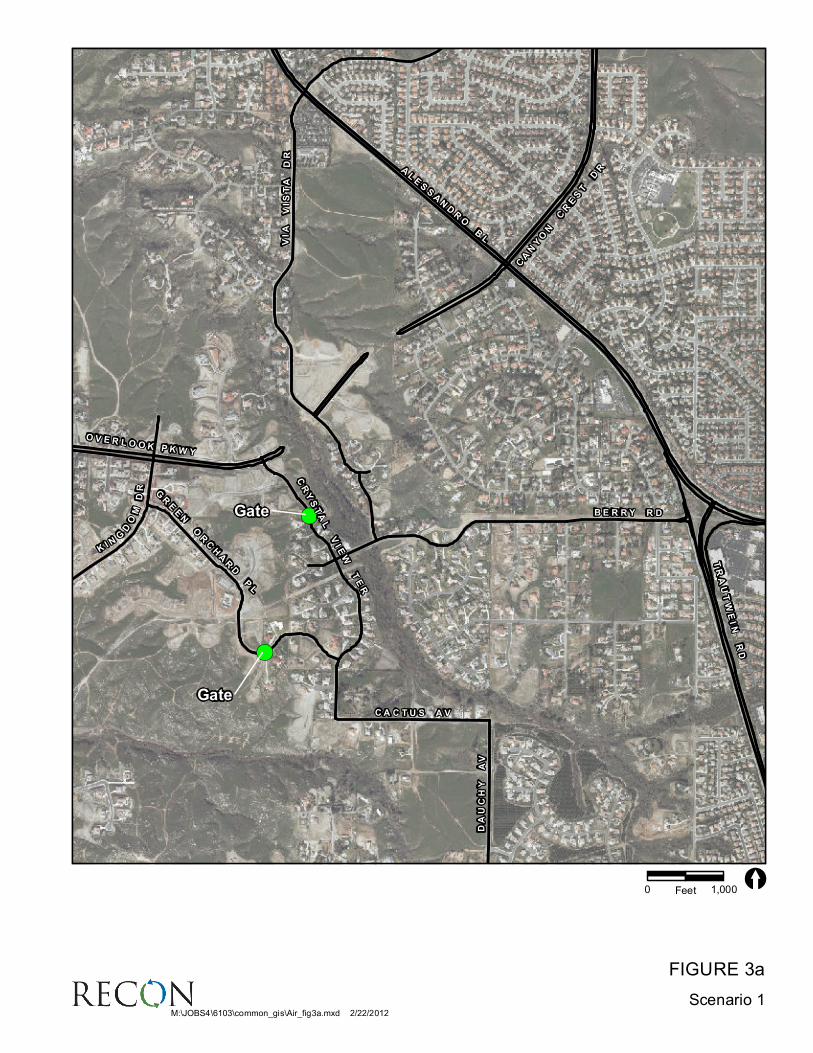
FIGURE 3a
Scenario 1
!(
!(
AL
ES
SA
ND
RO
B
L
B E R R Y R D
VIA
V
IS
TA
D
R
CR
YS
TA
L
VIE
W
TE
R
C A C T U S A V
DA
UC
HY
A
V
CA
NY
ON
C
RE
ST
D
R
GR
EE
N
OR
CH
AR
D
PL
TR
AU
TW
EI
N
RD
KI N
G
DO
M D
R
O V E R L O O K P K W Y
!(
!(
AL
ES
SA
ND
RO
B
L
B E R R Y R D
VIA
V
IS
TA
D
R
CR
YS
TA
L
VIE
W
TE
R
C A C T U S A V
DA
UC
HY
A
V
CA
NY
ON
C
RE
ST
D
R
GR
EE
N
OR
CH
AR
D
PL
TR
AU
TW
EI
N
RD
KI N
G
DO
M D
R
O V E R L O O K P K W Y
M:\JOBS4\6103\common_gis\Air_fig3a.mxd 2/22/2012
0 1,000Feet [
Gate
Gate

FIGURE 3b
Scenario 2
AL
ES
SA
ND
RO
B
L
B E R R Y R D
VIA
V
IS
TA
D
R
CR
YS
TA
L
VIE
W
TE
R
C A C T U S A V
DA
UC
HY
A
V
CA
NY
ON
C
RE
ST
D
R
GR
EE
N
OR
CH
AR
D
PL
TR
AU
TW
EI
N
RD
KI N
G
DO
M D
R
O V E R L O O K P K W Y
AL
ES
SA
ND
RO
B
L
B E R R Y R D
VIA
V
IS
TA
D
R
CR
YS
TA
L
VIE
W
TE
R
C A C T U S A V
DA
UC
HY
A
V
CA
NY
ON
C
RE
ST
D
R
GR
EE
N
OR
CH
AR
D
PL
TR
AU
TW
EI
N
RD
KI N
G
DO
M D
R
O V E R L O O K P K W Y
M:\JOBS4\6103\common_gis\Air_fig3b.mxd 2/22/2012
0 1,000Feet [
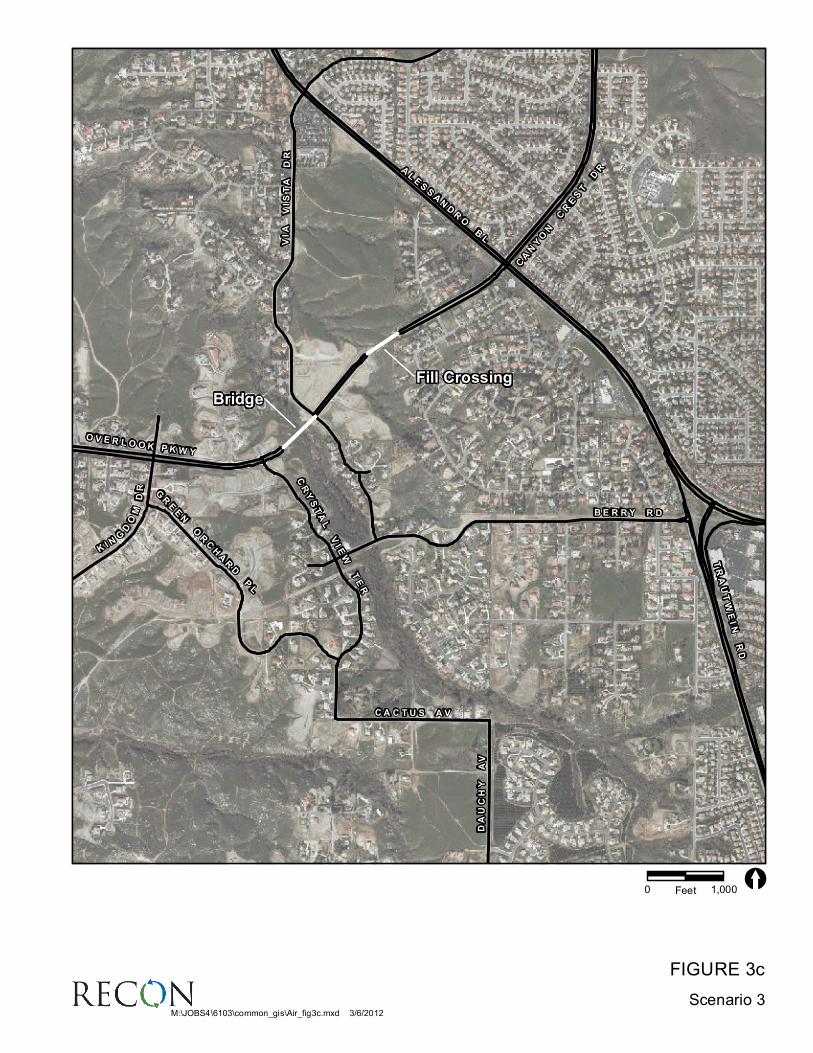
FIGURE 3c
Scenario 3
AL
ES
SA
ND
RO
B
L
B E R R Y R D
VIA
V
IS
TA
D
R
CR
YS
TA
L
VI E
W
TE
R
C A C T U S A V
DA
UC
HY
A
V
CA
NY
ON
C
RE
ST
D
R
GR
EE
N
OR
CH
AR
D
PL
TR
AU
TW
EI
N
RD
KI N
G
DO
M D
R
O V E R L O O K P K W Y
AL
ES
SA
ND
RO
B
L
B E R R Y R D
VIA
V
IS
TA
D
R
CR
YS
TA
L
VI E
W
TE
R
C A C T U S A V
DA
UC
HY
A
V
CA
NY
ON
C
RE
ST
D
R
GR
EE
N
OR
CH
AR
D
PL
TR
AU
TW
EI
N
RD
KI N
G
DO
M D
R
O V E R L O O K P K W Y
M:\JOBS4\6103\common_gis\Air_fig3c.mxd 3/6/2012
0 1,000Feet [
Bridge
Fill Crossing

FIGURE 3d
Scenario 4
WA
SH
I NG
TO
N
A R L I N G T O N A V AL
ES
SA
ND
RO
B
L
B E R R Y R D
TR
AU
TW
EIN
R
D
DA
UC
HY
A
V
C E N T R A L A V
WA
SH
I NG
TO
N
A R L I N G T O N A V AL
ES
SA
ND
RO
B
L
B E R R Y R D
TR
AU
TW
EIN
R
D
DA
UC
HY
A
V
C E N T R A L A V
M:\JOBS4\6103\common_gis\Air_fig3d.mxd 4/25/2012
0 2,500Feet [
O
VE R L O O K P K W Y
V
I A V I S
T
A D R
CA
NY
ON
C
RE
ST
D
R
KIN
GD O
M D
R
|ÿ91Bridge
|ÿ91
Study Area
Proposed C Street
FillCrossing

Greenhouse Gas Analysis for the Crystal View Terrace/Green Orchard Place/Overlook Parkway Project
Page 14
and a mitigation measure of the accompanying Environmental Impact Report (EIR) requiring "a barrier strip at the [then] City limits along Crystal View Terrace be installed until Overlook Parkway is connected to the east across the Alessandro Arroyo and to Alessandro Boulevard.” This condition was expanded by a mitigation measure in the EIR that required that a gate be installed to allow for emergency vehicle access, but otherwise prohibit through traffic.
Additionally, the Riverside General Plan 2025 includes a policy to "prohibit the removal of the Crystal View Terrace barrier prior to the connection of Overlook Parkway across the Alessandro Arroyo.” General Plan 2025 Objective CCM-4 and the four related policies are detailed as follows:
Objective CCM-4: Provide a connection between Washington Street and SR-91 via an extension of Overlook Parkway.
Policy CCM-4.1: Limit the Overlook Parkway completion over the arroyo to a two-lane roadway within a 110-foot right-of-way.
Policy CCM-4.2: The connection of Overlook Parkway across the Alessandro Arroyo shall not be completed until a detailed specific plan analyzing potential connection routes between Washington Street and the SR-91 has been adopted. Analysis of the fore mentioned connection route should, at a minimum, include the area bounded by Mary Street, Adams Street, Dufferin Street, and SR-91.
Policy CCM-4.3: Ensure that Level of Service D or better is maintained along Victoria Avenue for intersections related to the Overlook Parkway extension.
Policy CCM-4.4: Prohibit the removal of the Crystal View Terrace barrier prior to the connection of Overlook Parkway across the Alessandro Arroyo.
2.2 Project Baseline
The gates are required to be closed by General Plan 2025 policy, consistent with the project conditions for two tract map projects as discussed above. The gates are regularly opened and closed by local residents at undetermined intervals without City permission or knowledge. At the time of preparation of the Notice of Preparation for the proposed Project, gates were in place, but open on both Green Orchard Place and Crystal View Terrace. Therefore, primarily for traffic conditions, it is necessary to establish two environmental baselines for the Project:
• Gates Closed (also referred to as the “legal” condition) – The legal condition refers to existing mitigation measures and General Plan 2025 policies that

Greenhouse Gas Analysis for the Crystal View Terrace/Green Orchard Place/Overlook Parkway Project
Page 15
require the gates to remain in place until such time that Overlook Parkway is connected.
• Gates Open (also referred to as the “existing” condition) – On the Notice of Preparation release date, the gates were open.
This report analyzes the four circulation scenarios against both Gates Closed and Gates Open.
3.0 Existing Conditions
3.1 Environmental Setting
3.1.1 State and Regional GHG Inventories The California Air Resources Board (CARB) performed statewide inventories. The inventory is divided into nine broad sectors of economic activity: agriculture, commercial, electricity generation, forestry, high GWP emitters, industrial, recycling, residential, and transportation. Emissions are quantified in million metric tons of CO2 equivalent (MMTCO2E). Table 2 shows the estimated statewide GHG emissions for the years 1990, 2000, 2004, and 2008.
TABLE 2 CALIFORNIA GHG EMISSIONS BY SECTOR IN 1990, 2000, 2004, AND 2008
Sector
1990 Emissions in MMTCO2E (% total)1
2000 Emissions in MMTCO2E (% total)1
2004 Emissions in MMTCO2E (% total)1
2008 Emissions in MMTCO2E (% total)1
Sources Agriculture 23.4 (5%) 25.44 (6%) 28.82 (6%) 28.06 (6%) Commercial 14.4 (3%) 12.80 (3%) 13.20 (3%) 14.68 (3%) Electricity Generation 110.6 (26%) 103.92 (23%) 119.96 (25%) 116.35 (24%) Forestry (excluding sinks) 0.2 (<1%) 0.19 (<1%) 0.19 (<1%) 0.19 (<1%) High GWP -- 10.95 (2%) 13.57 (3%) 15.65 (3%) Industrial 103.0 (24%) 97.27 (21%) 90.87 (19%) 92.66 (19%) Recycling and Waste -- 6.20 (1%) 6.23 (1%) 6.71 (1%) Residential 29.7 (7%) 30.13 (7%) 29.34 (6%) 28.45 (6%) Transportation 150.7 (35%) 171.13 (37%) 181.71 (38%) 174.99 (37%) Unspecified Remaining2 1.3 (<1%) -- -- -- Subtotal 433.3 458.03 483.89 477.74 Sinks Forestry Sinks -6.7 (--) -4.72 (--) -4.32 (--) -3.98 (--) Total 426.6 453.31 479.57 473.76 Source: CARB 2007, 2010a 1 Percentages may not total 100 due to rounding. 2 Unspecified fuel combustion and ozone depleting substance (ODS) substitute use, which could
not be attributed to an individual sector.
Greenhouse Gas Analysis for the Crystal View Terrace/Green Orchard Place/Overlook Parkway Project
Page 16
As shown in Table 2, statewide GHG emissions totaled 433 MMTCO2E in 1990,
458 MMTCO2E in 2000, 484 MMTCO2E in 2004, and 478 MMTCO2E in 2008. According
to data from the CARB, it appears that statewide GHG emissions peaked in 2004 and
are now beginning to decrease (CARB 2010a). Transportation-related emissions
consistently contribute the most GHG emissions, followed by electricity generation and
industrial emissions.
The forestry sector is unique because it not only includes emissions associated with
harvest, fire, and land use conversion (sources), but also includes removals of
atmospheric CO2 (sinks) by photosynthesis, which is then bound (sequestered) in plant
tissues. As seen in Table 2, the forestry sector consistently removes more CO2 from the
atmosphere statewide than it emits. As a result, although decreasing over time, this
sector represents a net sink, removing a net 6.5 MMTCO2E from the atmosphere in
1990, a net 4.5 MMTCO2E in 2000, a net 4.1 MMTCO2E in 2004, and a net
3.8 MMTCO2E in 2008.
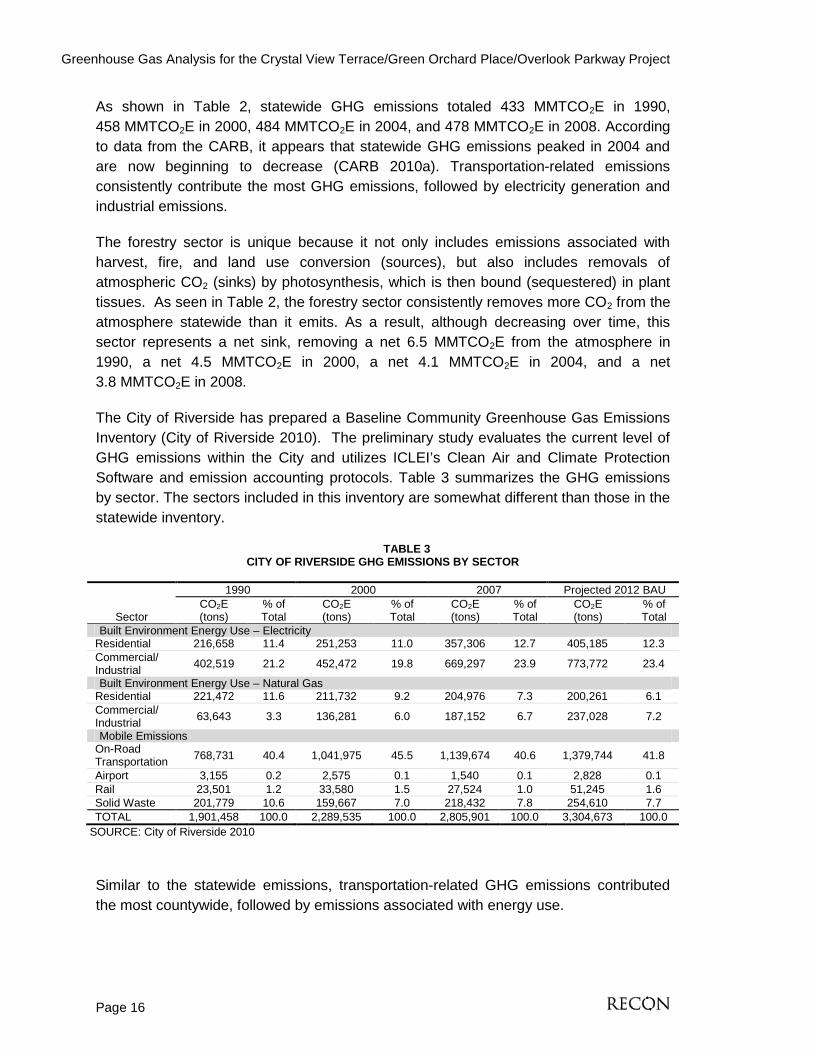
The City of Riverside has prepared a Baseline Community Greenhouse Gas Emissions
Inventory (City of Riverside 2010). The preliminary study evaluates the current level of
GHG emissions within the City and utilizes ICLEI’s Clean Air and Climate Protection
Software and emission accounting protocols. Table 3 summarizes the GHG emissions
by sector. The sectors included in this inventory are somewhat different than those in the
statewide inventory.
TABLE 3CITY OF RIVERSIDE GHG EMISSIONS BY SECTOR
Sector
1990 2000 2007 Projected 2012 BAUCO2E(tons)
% ofTotal
CO2E(tons)
% ofTotal
CO2E(tons)
% ofTotal
CO2E(tons)
% ofTotal
Built Environment Energy Use – ElectricityResidential 216,658 11.4 251,253 11.0 357,306 12.7 405,185 12.3Commercial/Industrial
402,519 21.2 452,472 19.8 669,297 23.9 773,772 23.4
Built Environment Energy Use – Natural GasResidential 221,472 11.6 211,732 9.2 204,976 7.3 200,261 6.1Commercial/Industrial
63,643 3.3 136,281 6.0 187,152 6.7 237,028 7.2
Mobile EmissionsOn-RoadTransportation
768,731 40.4 1,041,975 45.5 1,139,674 40.6 1,379,744 41.8
Airport 3,155 0.2 2,575 0.1 1,540 0.1 2,828 0.1Rail 23,501 1.2 33,580 1.5 27,524 1.0 51,245 1.6Solid Waste 201,779 10.6 159,667 7.0 218,432 7.8 254,610 7.7TOTAL 1,901,458 100.0 2,289,535 100.0 2,805,901 100.0 3,304,673 100.0
SOURCE: City of Riverside 2010
Similar to the statewide emissions, transportation-related GHG emissions contributed
the most countywide, followed by emissions associated with energy use.
Greenhouse Gas Analysis for the Crystal View Terrace/Green Orchard Place/Overlook Parkway Project
Page 17
Similar to the statewide emissions, transportation-related GHG emissions contributed the most countywide, followed by emissions associated with energy use.
3.1.2 Consequences of Global Climate Change CARB projects a future statewide GHG emissions increase of over 23 percent (from 2004) by 2020 given current trends (CARB 2008a). Global GHG emissions forecasts also predict similar substantial increases, given a business-as-usual (BAU) trajectory.
The potential consequences of global climate change on the Riverside region are far reaching. The Climate Scenarios report, published in 2006 by the California Climate Change Center, uses a range of emissions scenarios to project a series of potential warming ranges (low, medium, or high temperature increases) that may occur in California during the 21st century. Throughout the state and the region, global climate and local microclimate changes could cause an increase in extreme heat days; higher concentrations, frequency and duration of air pollutants; an increase in wildfires; more intense coastal storms; sea level rise; impacts to water supply and water quality through reduced snowpack and saltwater influx; public health impacts; impacts to near-shore marine ecosystems; reduced quantity and quality of agricultural products; pest population increases; and altered natural ecosystems and biodiversity.
3.2 Regulatory Background
In response to rising concern associated with increasing GHG emissions and global climate change impacts, several plans and regulations have been adopted at the international, national, and state levels with the aim of reducing GHG emissions.
3.2.1 International
3.2.1.1 Montreal Protocol on Substances that Deplete the Ozone Layer
Human-caused effects on the global atmosphere first became widely known to the public at large in the mid-1970s, when it was discovered that a number of substances, particularly chlorofluorocarbons used in refrigeration, when released into the atmosphere could cause the breakdown of significant quantities of the earth’s protective ozone in the stratosphere (i.e., the “ozone layer”). Somewhat concurrent with this was the discovery of the now well documented “ozone hole” over Antarctica. The ozone layer filters out most of the ultraviolet-B (UV-B) radiation reaching the earth. Therefore, destruction of the ozone layer would allow more UV-B radiation to reach the earth’s surface potentially leading to increases in skin cancer and other effects such as crop damage and adverse effects on marine phytoplankton.
Greenhouse Gas Analysis for the Crystal View Terrace/Green Orchard Place/Overlook Parkway Project
Page 18
In response to these concerns, the Coordinating Committee on the Ozone Layer was established by the United Nations Environment Program (UNEP) in 1977, and UNEP's Governing Council adopted the World Plan of Action on the Ozone Layer. Continuing efforts led to the signing in 1985 of the Vienna Convention on the Protection of the Ozone Layer. This led to the creation of the Montreal Protocol on Substances That Deplete the Ozone Layer (Montreal Protocol), an international treaty designed to protect the stratospheric ozone layer by phasing out production of ozone depleting substances. The Montreal Protocol was adopted on September 16, 1987, and was enacted on January 1, 1989. The Protocol has been amended four times since 1989: the London Amendment in 1990, Copenhagen Amendment in 1992, Montreal Amendment in 1997, and most recently the Beijing Amendment in 1999 (U.S. EPA 2010b).
This treaty is considered one of the most successful international treaties on environmental protection in the world, with ratification by 191 countries including the United States. By the end of 2006, the 191 parties to the treaty had phased out over 95 percent of ozone depleting substances (UNEP 2007). Because of this success, scientists are now predicting that the ozone hole will “heal” later this century.
The elimination of these ozone-depleting substances also has benefits relative to global climate change because most of these substances are also potent GHGs with very high GWPs, ranging from 4,680 to 10,720 (UNEP 2007; Australian Government 2007). However, the phasing out of ozone depleting substances has led to an increase in the use of non-ozone depleting substances such as HFCs which, although not detrimental to the ozone layer, are also potent GHGs. As shown in Table 1, these substances have GWPs ranging from 140 to 11,700.
3.2.1.2 Intergovernmental Panel on Climate Change
In response to growing concern about pollutants in the upper atmosphere and the potential problem of climate change, the World Meteorological Organization and the UNEP established the Intergovernmental Panel on Climate Change (IPCC) in 1988. The IPCC was tasked with assessing the scientific, technical, and socioeconomic information relevant to understanding the scientific basis for human-induced climate change, its potential impacts, and options for adaptation and mitigation. The most recent reports of the IPCC have emphasized the scientific consensus that real and measurable changes to the climate are occurring, that they are caused by human activity, and that significant adverse impacts on the environment, the economy, and human health and welfare are unavoidable.

Greenhouse Gas Analysis for the Crystal View Terrace/Green Orchard Place/Overlook Parkway Project
Page 19
3.2.1.3 United Nations Framework Convention on Climate Change
In 1994, the Unites States joined a number of other nations in signing an international treaty known as the United Nations Framework Convention on Climate Change (UNFCCC). The UNFCCC recognized that global climate is a shared resource that can be affected by industrial and other emissions of GHGs, and set an overall framework for intergovernmental efforts to tackle the challenges posed by global climate change.
As with the Montreal Protocol, this treaty was ratified by 191 countries including the United States. Under this treaty, governments were to (UNFCCC 2007a):
• gather and share information on GHG emissions, national policies, and best practices;
• launch national strategies for addressing GHG emissions and adapting to expected impacts; and
• cooperate with other nations in preparing for adaptation to the impacts of climate change.
The UNFCCC divided countries into three main groups according to differing commitments based on economic strength, vulnerability to adverse climate change impacts, and capacity to respond or adapt to climate change effects. The stronger economic nations, including the United States, were to provide financial and technological support to developing countries to enable them to undertake emissions reduction activities and to help them adapt to adverse effects of climate change.
The UNFCCC was enacted in March 1994; however, it generally lacked powerful, legally binding measures. This led to the development of the Kyoto Protocol.
3.2.1.4 Kyoto Protocol to the UNFCCC
Knowing that the UNFCCC did not contain the legally binding measures that would be required to meaningfully address global climate change, a conference of the UNFCCC signatory nations was held in Berlin in 1995 that launched a new round of discussions to determine more detailed and stronger commitments for industrialized countries (the Berlin Mandate). After 2.5 years of negotiations, the Kyoto Protocol was adopted in December 1997 (UNFCCC 2007b). While the 1997 Kyoto Protocol shared the UNFCCC’s objectives, it committed signatories to individual, legally binding targets to limit or reduce their GHG emissions. By March 1999, 84 countries, including the United States, had signed the Kyoto Protocol (UNFCCC 2009).
Greenhouse Gas Analysis for the Crystal View Terrace/Green Orchard Place/Overlook Parkway Project
Page 20
Only Parties to the UNFCCC that have also become Parties to the Kyoto Protocol are bound by the Kyoto Protocol’s commitments. Governments become Parties to the Protocol by ratifying, accepting, approving, or acceding to it. Because of the complexity of the negotiations and uncertainty associated with the rules or how they would operate, several of the signing countries, including the United States, were reluctant to actually ratify the Protocol. Therefore, a new round of negotiations was undertaken to flesh out the Kyoto Protocol’s rulebook. These negotiations concluded with the adoption of the Marrakesh Accords in 2001. With the adoption of the Marrakesh Accords, the Protocol was enacted in February 2005, and by July 2009, 184 governments had become Parties to the Protocol (UNFCCC 2007b, 2009). In December 2009, a Copenhagen Accord was held to address global climate change issues in the future; however, no further measures were adopted. The 2010 UN Climate Change Conference occurred in Cancun, Mexico from November 29 to December 10, 2010, and resulted in 26 agreements related to GHG emission reductions (Cancun Accords). The most recent UN Climate Change Conference occurred in Durban, South Africa from November 28 to December 11, 2011, and resulted in the agreement to a legally binding treaty, called the Durban Platform, which will be prepared by 2015 and take effect in 2020. The Durban Platform entails the continuation of the Kyoto protocol in the interim.
As of September 2011, 191 governments had signed and ratified the protocol. Although a signer to the Kyoto Protocol, the U.S. has not ratified the Kyoto Protocol to date because it does not mandate emissions reductions from all countries, including several developing countries whose GHG emissions are expected to exceed emissions from developed countries within the next 25 years (U.S. EPA 2007a). In December 2011, Canada declared its intention to withdraw from the Kyoto Protocol. The Durban Platform includes developing countries, and the United States, which refused to ratify the Kyoto Protocol.
3.2.2 National
3.2.2.1 Clean Air Act, Title VI—Stratospheric Ozone Protection
Similar to the Montreal Protocol discussed above, Title VI of the Clean Air Act was established to protect stratospheric ozone by phasing out the manufacture of ozone-depleting substances, and by restricting their use and distribution (U.S. EPA 2007b). Also similar to the Montreal Protocol, while successful in phasing out ozone depleting substances, Title VI has inadvertently led to an increase in the production and use of non-ozone depleting substitutes such as HFCs that are global warming gases with high GWPs and relatively long atmospheric lifetimes.

Greenhouse Gas Analysis for the Crystal View Terrace/Green Orchard Place/Overlook Parkway Project
Page 21
3.2.2.2 GHG Emissions Intensity Reduction Programs
The GHG Emissions Intensity is the ratio of GHG emissions to economic output. In 2000, the U.S. GHG Emissions Intensity was 722 metric tons per million dollars of gross domestic product (GDP; World Resources Institute 2006). In February 2002, the U.S. set a goal to reduce the 2002 GHG Emissions Intensity by 18 percent by 2012, which would lower emissions from 670 to 553 metric tons per million dollars of GDP, through various reduction programs. A number of ongoing voluntary programs have thus been instituted to reduce nationwide GHG emissions. These include (U.S. EPA 2007c):
• Climate VISION Partnership: In 2003, this program established a partnership between 12 major industries and the U.S. Department of Energy (U.S. DOE), the U.S. EPA, the U.S. Department of Transportation, and the U.S. Department of Agriculture. The involved industries include electric utilities; petroleum refiners and natural gas producers; automobile, iron and steel, chemical and magnesium manufacturers; forest and paper producers; railroads; and cement, mining, aluminum, and semiconductor industries. These industries are working with the four agencies to reduce their GHG emissions by developing cost-effective solutions, measuring and reporting emissions, developing strategies for the adoption of advanced technologies, and implementing voluntary mitigation actions.
• Cleaner Energy–Environment State Partnership: This program established a partnership between federal and state agencies to support states in implementing strategies and policies to promote renewable energy, energy efficiency, and other cost-effective clean energies. States receive technical assistance from the U.S. EPA.
• Climate Leaders: The Climate Leaders program was established in 2002. Climate Leaders is a U.S. EPA voluntary program that establishes partnerships with individual companies. Together they establish individual corporate goals for GHG emissions reduction and monitor their emissions to measure progress. On September 15, 2010, the EPA announced that the Climate Leaders program will phase down the services it offers because climate programs operated by states are now robust enough to service individual companies that wish to continue to advance climate leadership through reporting and reduction goals.
• Energy Star: Energy Star was established in 1992 by the U.S. EPA and became a joint program with the U.S. DOE in 1996. Energy Star is a program that labels energy efficient products with the Energy Star label. Energy Star enables consumers to choose energy-efficient and cost-saving products. More than 1,400 manufacturers use Energy Star labels on their energy-efficient products.

Greenhouse Gas Analysis for the Crystal View Terrace/Green Orchard Place/Overlook Parkway Project
Page 22
• Green Power Partnership: This program establishes partnerships between the U.S. EPA, and companies and organizations that have bought or are considering buying green power, which is power generated from renewable energy sources. The U.S. EPA offers recognition and promotion to organizations that replace electricity consumption with green power.
3.2.2.3 Corporate Average Fuel Economy Standards
The federal Corporate Average Fuel Economy (CAFE) standards determine the fuel efficiency of certain vehicle classes in the U.S. While the standards had not changed since 1990, in 2007, as part of the Energy and Security Act of 2007, the CAFE standards were increased for new light-duty vehicles to 35 miles per gallon (mpg) by 2020. In May 2009, President Obama announced further plans to increase CAFE standards to require light-duty vehicles to meet an average fuel economy of 35.5 mpg by 2016. With improved gas mileage, fewer gallons of transportation fuel would be combusted to travel the same distance, thereby reducing nationwide GHG emissions associated with vehicle travel.
3.2.2.4 Mandatory Reporting of GHGs Rule
Starting January 1, 2010, large emitters of heat-trapping gases began collecting GHG data and reporting their annual GHG emissions to the U.S. EPA. The first reports were generally due March 31, 2011. Under this reporting Rule, approximately 10,000 facilities are covered, accounting for nearly 85 percent of the nation’s GHG emissions. This mandatory reporting applies to fossil fuel and industrial GHG suppliers, motor vehicle and engine manufacturers, and facilities that emit 25,000 MTCO2E or more per year. Vehicle and engine manufacturers outside of the light-duty sector were required to begin phasing in their GHG reporting starting with engine/vehicle model year 2011.
3.2.3 State The State of California has adopted a number of plans and regulations aimed at identifying statewide and regional GHG emissions caps, GHG emissions reduction targets, and actions and timelines to achieve the target GHG reductions.
3.2.3.1 EO S-3-05 – Statewide GHG Emission Targets
This executive order (EO) signed by Governor Schwarzenegger on June 1, 2005, established the following GHG emission reduction targets for the state of California:
• by 2010 reduce GHG emissions to 2000 levels;
• by 2020 reduce GHG emissions to 1990 levels;

Greenhouse Gas Analysis for the Crystal View Terrace/Green Orchard Place/Overlook Parkway Project
Page 23
• by 2050 reduce GHG emissions to 80 percent below 1990 levels.
This executive order also directs the secretary of the California EPA (CalEPA) to oversee the efforts made to reach these targets, and to prepare biannual reports on the progress made toward meeting the targets and on the impacts to California related to global warming, including impacts to water supply, public health, agriculture, the coastline, and forestry. With regard to impacts, the report shall also prepare and report on mitigation and adaptation plans to combat the impacts. The first Climate Action Team Assessment Report was produced in March 2006 and has been updated every two years, most recently in December 2010.
3.2.3.2 AB 32 – California Global Warming Solutions Act
In response to Executive Order S-3-05, the California legislature passed Assembly Bill (AB) 32 (Nuñez), the “California Global Warming Solutions Act of 2006,” which was signed by the governor on September 27, 2006. It requires the CARB to adopt rules and regulations that would reduce GHG emissions to 1990 levels by 2020. The CARB is also required to publish a list of discrete GHG emission reduction measures.
Specifically, AB 32, the California Global Warming Solutions Act of 2006, requires CARB to (State of California 2006a):
• Establish a statewide GHG emissions cap for 2020, based on 1990 emissions by January 1, 2008.
In December 2007, CARB approved a 2020 emission limit of 427 million metric tons of CO2 equivalent.
• Adopt mandatory reporting rules for significant sources of GHGs by January 1, 2009.
In December 2007, CARB adopted regulations requiring the largest industrial sources to report and verify their GHG emissions. Facilities began tracking emissions in 2008 and reports were due June 1, 2009. Emissions reporting for 2008 was allowed to be based on best available data. Beginning in 2010, emissions reports became more rigorous and subject to third-party verification.
This action builds on the earlier Senate Bill (SB) 177 (Sher) enacted in 2000 which established a nonprofit California Climate Action Registry for the purpose of administering a voluntary GHG emissions registry.
• Adopt a plan by January 1, 2009 indicating how emission reductions will be achieved from significant GHG sources via regulations, market mechanisms and other actions.
A Climate Change Scoping Plan (Scoping Plan) was approved on December 12, 2008. The Scoping Plan contains the main strategies California will

Greenhouse Gas Analysis for the Crystal View Terrace/Green Orchard Place/Overlook Parkway Project
Page 24
implement to achieve a reduction of 174 million MTCO2E GHG emissions, or approximately 29 percent from the state’s projected 2020 emission level of 596 million MTCO2E under a BAU scenario. The Scoping Plan is discussed in greater detail in Section 3.2.3.3 below.
• Adopt regulations by January 1, 2011 to achieve the maximum technologically feasible and cost-effective reductions in GHG, including provisions for using both market mechanisms and alternative compliance mechanisms.
In December 2010, CARB approved a new regulation establishing a GHG cap-and-trade program. An overall limit on GHG emissions from capped sectors is established by the cap-and-trade program and facilities subject to the cap will be able to trade permits (allowances) to emit GHGs. The program began in 2012.
• Convene an Environmental Justice Advisory Committee and an Economic and Technology Advancement Advisory Committee to advise CARB.
In January 2007, the CARB appointed a ten member Environmental Justice Advisory Committee and appointed members to the Economic and Technology Advancement Advisory Committee.
• Ensure public notice and opportunity for comment for all CARB actions.
A number of CARB documents, including the 2020 Emissions Forecast, the Scoping Plan, and the Draft Recommended Approaches for Setting Interim Significance Thresholds, have been circulated for public review and comment.
• Prior to imposing any mandates or authorizing market mechanisms, CARB must evaluate several factors, including but not limited to impacts on California's economy, the environment and public health; equity between regulated entities; electricity reliability; conformance with other environmental laws; and ensure that the rules do not disproportionately impact low-income communities.
3.2.3.3 Climate Change Scoping Plan
As directed by AB 32, the Climate Change Scoping Plan prepared by CARB in December 2008 includes measures to reduce statewide GHG emissions to 1990 levels by 2020. These reductions are what CARB identified as necessary to reduce forecasted BAU 2020 emissions. CARB will update the Scoping Plan at least once every five years to allow evaluation of progress made and to correct the Plan’s course where necessary.
As indicated in Table 4, the majority of reductions is directed at the sectors with the largest GHG emissions contributions—transportation and electricity generation—and involve statutory mandates affecting vehicle or fuel manufacture, public transit, and public utilities. The two measures most applicable to land use planning and development
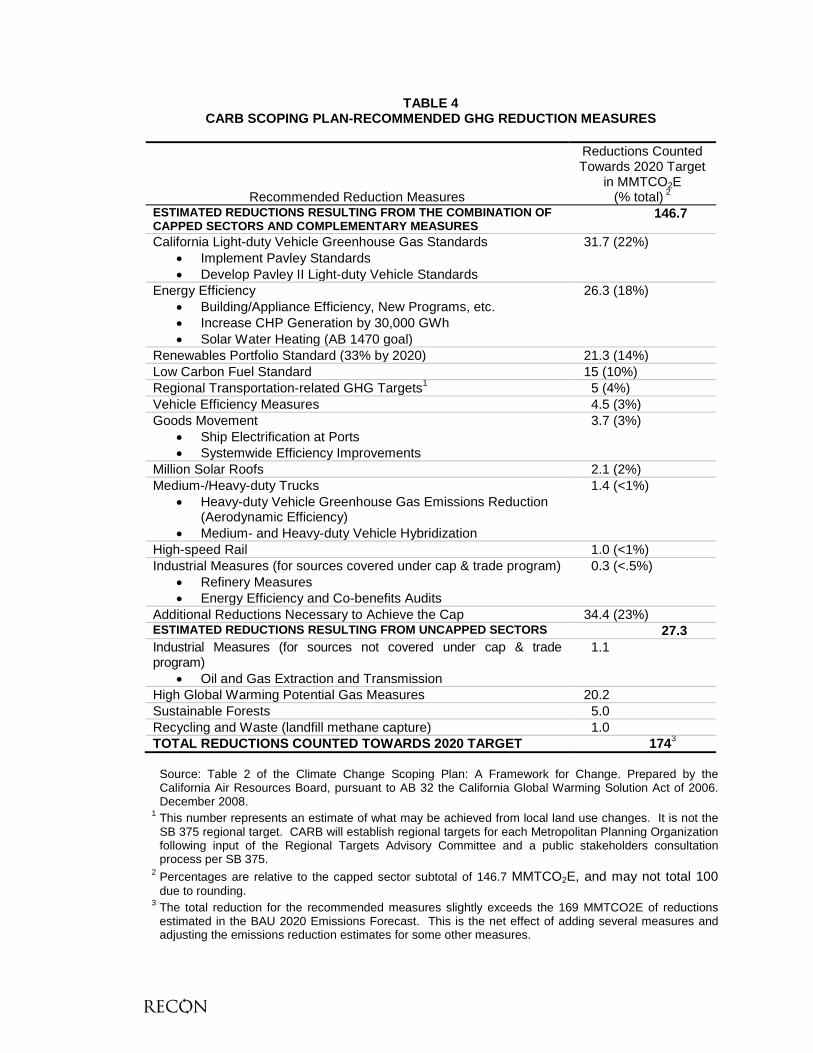
TABLE 4 CARB SCOPING PLAN-RECOMMENDED GHG REDUCTION MEASURES
Recommended Reduction Measures
Reductions Counted Towards 2020 Target
in MMTCO2E (% total) 2
ESTIMATED REDUCTIONS RESULTING FROM THE COMBINATION OF CAPPED SECTORS AND COMPLEMENTARY MEASURES
146.7
California Light-duty Vehicle Greenhouse Gas Standards • Implement Pavley Standards • Develop Pavley II Light-duty Vehicle Standards
31.7 (22%)
Energy Efficiency • Building/Appliance Efficiency, New Programs, etc. • Increase CHP Generation by 30,000 GWh • Solar Water Heating (AB 1470 goal)
26.3 (18%)
Renewables Portfolio Standard (33% by 2020) 21.3 (14%) Low Carbon Fuel Standard 15 (10%) Regional Transportation-related GHG Targets1 5 (4%) Vehicle Efficiency Measures 4.5 (3%) Goods Movement
• Ship Electrification at Ports • Systemwide Efficiency Improvements
3.7 (3%)
Million Solar Roofs 2.1 (2%) Medium-/Heavy-duty Trucks
• Heavy-duty Vehicle Greenhouse Gas Emissions Reduction (Aerodynamic Efficiency)
• Medium- and Heavy-duty Vehicle Hybridization
1.4 (<1%)
High-speed Rail 1.0 (<1%) Industrial Measures (for sources covered under cap & trade program)
• Refinery Measures • Energy Efficiency and Co-benefits Audits
0.3 (<.5%)
Additional Reductions Necessary to Achieve the Cap 34.4 (23%) ESTIMATED REDUCTIONS RESULTING FROM UNCAPPED SECTORS 27.3 Industrial Measures (for sources not covered under cap & trade program)
• Oil and Gas Extraction and Transmission
1.1
High Global Warming Potential Gas Measures 20.2 Sustainable Forests 5.0 Recycling and Waste (landfill methane capture) 1.0 TOTAL REDUCTIONS COUNTED TOWARDS 2020 TARGET 1743
Source: Table 2 of the Climate Change Scoping Plan: A Framework for Change. Prepared by the California Air Resources Board, pursuant to AB 32 the California Global Warming Solution Act of 2006. December 2008.
1 This number represents an estimate of what may be achieved from local land use changes. It is not the SB 375 regional target. CARB will establish regional targets for each Metropolitan Planning Organization following input of the Regional Targets Advisory Committee and a public stakeholders consultation process per SB 375.
2 Percentages are relative to the capped sector subtotal of 146.7 MMTCO2E, and may not total 100 due to rounding.
3 The total reduction for the recommended measures slightly exceeds the 169 MMTCO2E of reductions estimated in the BAU 2020 Emissions Forecast. This is the net effect of adding several measures and adjusting the emissions reduction estimates for some other measures.

Greenhouse Gas Analysis for the Crystal View Terrace/Green Orchard Place/Overlook Parkway Project
Page 26
are the Regional Transportation Related GHG Targets and the Energy Efficiency measures. Implementing these two measures accounts for reduction of 31.3 MMTCO2E emissions, or 22 percent, of the total 146.7 MMTCO2E in reductions needed for capped sectors.
CARB also lists several other recommended measures which will contribute toward achieving the 2020 statewide reduction goal, but whose reductions are not (for various reasons, including the potential for double counting) additive with the measures listed in Table 4. These include state and local government operations measures, green building, mandatory commercial recycling and other additional waste and recycling measures, water sector measures, and CH4 capture at large dairies.
The Scoping Plan reduction measures and complementary regulations are described further in the following sections, and are grouped under the two headings of Transportation-related Measures and Non-transportation-related Measures as representative of the sectors to which they apply.
3.2.3.4 Transportation-related Emissions Reductions
Transportation accounts for the largest share of the state’s GHG emissions. Accordingly, a large share of the reduction of GHG emissions from the recommended measures comes from this sector. To address emissions from vehicles, CARB is proposing a comprehensive three-prong strategy: reducing GHG emissions from vehicles, reducing the carbon content of the fuel these vehicles burn, and reducing the miles these vehicles travel.
a. AB 1493—Pavley Greenhouse Gas Vehicle Standards
AB 1493 (Pavley) enacted July 2002, directed CARB to adopt vehicle standards that lowered GHG emissions from passenger vehicles and light duty trucks to the maximum extent technologically feasible, beginning with the 2009 model year. CARB adopted regulations in 2004 and applied to the U.S. EPA for a waiver under the federal Clean Air Act to implement them. Termed “Pavley I,” these regulations cover Model Years 2009 to 2016.
Under federal law, California is the only state allowed to adopt its own vehicle standards, but it cannot implement them until the U.S. EPA grants an administrative waiver. In December 2004, the Alliance of Automobile Manufacturers sued CARB to block implementation of the new regulations and ultimately, in December 2007, a federal judge decided the case in favor of the CARB (Sacramento Bee 2007). Despite this ruling, on December 19, 2007, the U.S. EPA announced that it would deny CARB’s waiver request. In January 2008, the State of California sued the U.S. EPA in an attempt to overturn the U.S. EPA’s denial (Marten Law Group 2008).

Greenhouse Gas Analysis for the Crystal View Terrace/Green Orchard Place/Overlook Parkway Project
Page 27
On June 30, 2009, the U.S. EPA rejected its earlier waiver denial reasoning and granted California the authority to implement these GHG emissions reduction standards for new passenger cars, pickup trucks, and sport utility vehicles. CARB adopted amendments to its new regulations in September 2009 that would enforce AB 1493, but provide vehicle manufacturers with new compliance flexibility.
With these actions, it is expected that the new regulations (Pavley I) will reduce GHG emissions from California passenger vehicles by about 22 percent in 2012 and about 30 percent in 2016 (CARB 2010a), for a total reduction of 31.7 MMTCO2E counted toward the total statewide reduction target (CARB 2008b) (see Table 4). These reductions are to come from improved vehicle technologies such as small engines with superchargers, continuously variable transmissions, and hybrid electric drives.
CARB planned to adopt sometime in 2010 a second, more stringent, phase of the Pavley regulations, termed “Pavley II” [now known as “Low Emission Vehicle (LEV) III”], that would cover Model Years 2017 to 2025. Several public workshops on LEV III have been held by the CARB, but to date new regulations have not been adopted. Adoption of the new standards is now anticipated sometime in 2012.
b. EO S-01-07 – Low Carbon Fuel Standard
This executive order, signed by Governor Schwarzenegger in January 2007, directed that a statewide goal be established to reduce the carbon intensity of California’s transportation fuels by at least 10 percent by 2020 through a Low Carbon Fuel Standard (LCFS). CARB adopted the LCFS as a discrete early action measure pursuant to AB 32 in April 2009 and includes it as a reduction measure in its Scoping Plan (see Table 4).
The LCFS is a performance standard with flexible compliance mechanisms intended to incentivize the development of a diverse set of clean, low-carbon transportation fuel options. Its aim is to accelerate the availability and diversity of low-carbon fuels such as biofuels, electricity, and hydrogen by taking into consideration the full life-cycle of GHG emissions. A 10 percent reduction in the intensity of transportation fuels is expected to equate to a reduction of 16.5 MMTCO2E in 2020. However, in order to account for possible overlap of benefits between LCFS and the Pavley GHG standards, CARB has discounted the contribution of LCFS to 15 MMTCO2E (CARB 2008b).
c. Regional Transportation-related GHG Targets
The Regional Transportation-related GHG Targets measure included in the Scoping Plan identifies policies to reduce transportation emissions through changes in future land use patterns and community design, as well as through improvements in public transportation, that reduce vehicle miles travelled (VMT). By reducing the miles vehicles travel, vehicle emissions will be reduced. Improved planning and the resulting development are seen as essential for meeting the 2050 emissions target (CARB 2008b, p. 20). CARB expects that this measure will reduce transportation-related GHG

Greenhouse Gas Analysis for the Crystal View Terrace/Green Orchard Place/Overlook Parkway Project
Page 28
emissions by about 5 MMTCO2E, or 4 percent of the total statewide reductions attributed to the capped sectors (see Table 4). Specific regional reduction targets established through Senate Bill (SB) 375 (see discussion below) will determine more accurately what reductions can be achieved through this measure.
d. SB 375 – Regional Emissions Targets
SB 375 was signed in September 2008 and requires CARB to set regional targets for reducing passenger vehicle GHG emissions in accordance with the Scoping Plan measure described above. Its purpose is to align regional transportation planning efforts, regional GHG reduction targets, and land use and housing allocation to reduce GHG emissions by promoting high-density, mixed-use developments around mass transit hubs.
CARB, in consultation with the Metropolitan Planning Organizations (MPOs), was required to provide each affected region with passenger vehicle GHG emissions reduction targets for 2020 and 2035 by September 30, 2010. The Southern California Association of Governments (SCAG) is the region’s MPO. On August 9, 2010, CARB released the staff report on the proposed reduction target, which was subsequently approved by CARB on September 23, 2010. The SCAG region will be required to reduce GHG emissions from cars and light trucks by 8 percent per capita by 2020 and 13 percent by 2035 (CARB 2010a).
The reduction targets are to be updated every eight years, but can be updated every four years if advancements in emissions technologies affect the reduction strategies to achieve the targets.
Once reduction targets are established, each of California’s MPOs must prepare and adopt a Sustainable Communities Strategy (SCS) that demonstrates how the region will meet its GHG reduction targets through integrated land use and housing and transportation planning. Enhanced public transit service combined with incentives for land use development that provides a better market for public transit will play an important role in the SCS. After the SCS is adopted by the MPO, the SCS will be incorporated into that region's federally enforceable regional transportation plan (RTP). SCAG is currently working on the 2012 RTP (CARB 2010b, SCAG 2011).
CARB is also required to review each final SCS to determine whether it would, if implemented, achieve the GHG emission reduction target for its region. If the combination of measures in the SCS will not meet the region’s target, the MPO must prepare a separate “alternative planning strategy (APS)” to meet the target. The APS is not a part of the RTP.

Greenhouse Gas Analysis for the Crystal View Terrace/Green Orchard Place/Overlook Parkway Project
Page 29
As an incentive to encourage implementation of the SCS and APS, developers can obtain relief from certain requirements under the California Environmental Quality Act (CEQA) for those projects that are consistent with either the SCS or APS (CARB 2010b).
e. EO S-7-04/SB 1505—California Hydrogen Highway Network
This executive order, signed in 2004, designated California’s 21 interstate freeways as the “California Hydrogen Highway Network,” and directed the CalEPA and all other relevant state agencies to plan and build a network of hydrogen fueling stations along these roadways and in the urban centers. This EO also called for the CalEPA and others to develop a California Hydrogen Economy Blueprint Plan (Blueprint Plan) by January 1, 2005 for the rapid transition to a hydrogen economy in California (CalEPA 2005). The Blueprint Plan was delivered to the Governor in May 2005.
In response to this EO, SB 1505 (Lowenthal), chaptered on September 20, 2006, required the CARB to adopt regulations to ensure that the production and use of hydrogen for transportation purposes contributes to the reduction of GHGs and other air contaminants (Union of Concerned Scientists 2007). The regulation, referenced as the Environmental and Energy Standards for Hydrogen Production, is currently in the development process and was expected to be approved by the Board before the end of 2010. To date this has not occurred.
3.2.3.5 Non-transportation-related Emissions Reductions
In the energy sector, Scoping Plan measures aim to provide better information and overcome institutional barriers that slow the adoption of cost-effective energy efficiency technologies. They include enhanced energy efficiency programs to provide incentives for customers to purchase and install more efficient products and processes; and building and appliance standards to ensure that manufacturers and builders bring improved products to market. Over the long term, the recommended measures will increase the amount of electricity from renewable energy sources and improve the energy efficiency of industries, homes, and buildings. While energy efficiency accounts for the largest emissions reductions from this sector, other applicable land development measures, such as water conservation, materials use and waste reduction, and green building design and development practices, achieve additional emissions reduction.
a. Renewables Portfolio Standard
The Renewables Portfolio Standard (RPS) promotes diversification of the state’s electricity supply. Originally adopted in 2002 with a goal to achieve a 20 percent renewable energy mix by 2020, the goal has been accelerated and increased, most recently by EOs S-14-08 and S-21-09, to a goal of 33 percent by 2020. Its purpose is to achieve a 33 percent renewable energy mix statewide; providing 33 percent of the state’s electricity needs met by renewable resources by 2020 (CARB 2008b). The RPS

Greenhouse Gas Analysis for the Crystal View Terrace/Green Orchard Place/Overlook Parkway Project
Page 30
is included in CARB’s Scoping Plan list of reduction measures (see Table 4). Increasing the RPS to 33 percent is designed to accelerate the transformation of the electricity sector, including investment in the transmission infrastructure and systems changes to allow integration of large quantities of intermittent wind and solar generation. Renewable energy includes (but is not limited to) wind, solar, geothermal, small hydroelectric, biomass, anaerobic digestion, and landfill gas. Increased use of renewables would decrease California’s reliance on fossil fuels, thus reducing emissions of GHGs from the electricity sector. CARB estimates that full achievement of the RPS would decrease statewide GHG emissions by 21.3 MMTCO2E (CARB 2008b).
b. Million Solar Roofs Program
The Million Solar Roofs Program was created by SB 1 in 2006 and includes the California Public Utilities Commission’s (CPUC) California Solar Initiative and the California Energy Commission’s (CEC’s) New Solar Homes Partnership. It requires publicly owned utilities to adopt, implement, and finance solar incentive programs to lower the cost of solar systems and help achieve the goal of installing 3,000 megawatts of new solar capacity by 2020. The Million Solar Roofs Program is one of CARB’s GHG reduction measures identified in the 2008 Scoping Plan (see Table 4). Achievement of the program’s goal is expected to equate to a reduction of 2.1 MMTCO2E in 2020 statewide BAU emissions, as counted toward the total; statewide reduction of 173 MMTCO2E (CARB 2008b).
c. SB 1368 – Public Utility Emission Standards
SB 1368 (Parata), passed in 2006, requires the CEC to set GHG emission standards for entities providing electricity in the state. The bill further requires that the CPUC prohibit electricity providers and corporations from entering into long-term contracts if those providers and corporations do not meet the CEC’s standards (Union of Concerned Scientists 2007).
d. Title 24, Part 6 - California Energy Code
The California Code of Regulations, Title 24, Part 6 is the California Energy Code. This code, originally enacted in 1978 in response to legislative mandates, establishes energy efficiency standards for residential and non-residential buildings in order to reduce California’s energy consumption. The Code is updated periodically to incorporate and consider new energy efficiency technologies and methodologies as they become available. The most recent amendments to the Code, known as Title 24 2008, or the 2008 Energy Code, became effective January 1, 2010. Title 24 2008 requires energy savings of 15-35 percent above the former Title 24 2005 energy code. At a minimum, residential buildings must achieve a 15 percent reduction in their combined space heating, cooling, and water heating energy compared to the Title 24 2005 standards. Incentives in the form of rebates and tax breaks are provided on a sliding scale for

Greenhouse Gas Analysis for the Crystal View Terrace/Green Orchard Place/Overlook Parkway Project
Page 31
buildings achieving energy efficiency above the minimum 15 percent reduction over
Title 24 2005. The reference to Title 24 2005 is relevant in that many of the State’s long-
term energy and GHG reduction goals identify energy saving targets relative to Title 24
2005. By reducing California’s energy consumption, emissions of statewide GHGs may
also be reduced.
e. Title 24, Part 11 – California Green Building Standards
In 2007, Governor Schwarzenegger directed the California Building Standards
Commission to work with state agencies on the adoption of green building standards for
residential, commercial, and public building construction for the 2010 code adoption
process. A voluntary version of the California Green Building Standards Code, referred
to as CalGreen, was added to Title 24 as Part 11 in 2009. The 2010 version of CalGreen
took effect January 1, 2011, and instituted mandatory minimum environmental
performance standards for all ground-up new construction of commercial and low-rise
residential buildings, state-owned buildings, schools, and hospitals. It also includes
voluntary tiers (I and II) with stricter environmental performance standards for these
same categories of residential and non-residential buildings. Local jurisdictions must
enforce the minimum mandatory requirements and may also adopt the Green Building
Standards with amendments for stricter requirements.
The mandatory standards require:
20 percent mandatory reduction in indoor water use relative to specified baseline
levels;
50-percent construction/demolition waste diverted from landfills;
mandatory inspections of energy systems to ensure optimal working efficiency;
and
requirements for low-pollutant emitting exterior and interior finish materials such
as paints, carpets, vinyl flooring, and particleboards.
The voluntary standards require:
Tier I — 15 percent improvement in energy requirements, stricter water
conservation requirements for specific fixtures, 65 percent reduction in
construction waste, 10 percent recycled content, 20 percent permeable paving,
20 percent cement reduction, cool/solar reflective roof; and
Tier II — 30 percent improvement in energy requirements, stricter water
conservation requirements for specific fixtures, 75 percent reduction in
construction waste, 15 percent recycled content, 30 percent permeable paving,
30 percent cement reduction, cool/solar reflective roof.

Greenhouse Gas Analysis for the Crystal View Terrace/Green Orchard Place/Overlook Parkway Project
Page 32
Similar to the compliance reporting procedure described above for demonstrating energy
code compliance in new buildings and major renovations, compliance with the CalGreen
water reduction requirements must be demonstrated through completion of water use
reporting forms for new low-rise residential and non-residential buildings. The water use
compliance form must demonstrate a 20 percent reduction in indoor water use by either
showing a 20 percent reduction in the overall baseline water use as identified in
CalGreen or a reduced per-plumbing-fixture water use rate.
Related to CalGreen are the earlier 2000 Sustainable Building Goal (EO D-16-00) and
2004 Green Building Initiative (EO S-20-04). The 2000 Sustainable Building Goal
instructed that all state buildings be constructed or renovated and maintained as models
of energy, water, and materials efficiency. The 2004 Green Building Initiative recognized
further that significant reductions in GHG emissions could be achieved through the
design and construction of new green buildings as well as the sustainable operation,
retrofitting, and renovation of existing buildings.
The CARB Scoping Plan includes a Green Building Strategy with the goal of expanding
the use of green building practices to reduce the carbon footprint of new and existing
buildings. Consistent with CalGreen, the Scoping Plan recognized that GHG reductions
would be achieved through buildings that exceed minimum energy-efficiency standards,
decrease consumption of potable water, reduce solid waste during construction and
operation, and incorporate sustainable materials. Green building is thus a vehicle to
achieve the Scoping Plan’s statewide electricity and natural gas efficiency targets, and
lower GHG emissions from waste and water transport sectors.
In the Scoping Plan, CARB projects that an additional 26 MMTCO2E could be reduced
through expanded green building (CARB 2008b, p.17). However, this reduction is not
counted toward the BAU 2020 reduction goal to avoid any double counting, as most of
these reductions are accounted for in the electricity, waste, and water sectors. Because
of this, CARB has assigned all emissions reductions that occur because of green
building strategies to other sectors for meeting AB 32 requirements, but will continue to
evaluate and refine the emissions from this sector.
f. SB 97—CEQA GHG Amendments
Pursuant to SB 97 (Dutton), amendments to the CEQA guidelines (Guidelines) to assist
public agencies in the evaluation and mitigation of GHGs or the effects of GHGs as
required under CEQA, including the effects associated with transportation and energy
consumption were submitted on April 13, 2009, adopted on December 30, 2009, and
became effective March 18, 2010.
Section 15064.4 of the amended Guidelines includes the following requirements for
determining the significance of impacts from GHG emissions:

Greenhouse Gas Analysis for the Crystal View Terrace/Green Orchard Place/Overlook Parkway Project
Page 33
(a) The determination of the significance of greenhouse gas emissions calls for a
careful judgment by the lead agency consistent with the provisions in section
15064. A lead agency should make a good-faith effort, based to the extent
possible on scientific and factual data, to describe, calculate or estimate the
amount of GHG emissions resulting from a project. A lead agency shall have
discretion to determine, in the context of a particular project, whether to:
(1) Use a model or methodology to quantify greenhouse gas emissions
resulting from a project, and which model or methodology to use. The lead
agency has discretion to select the model or methodology it considers most
appropriate provided it supports its decision with substantial evidence. The
lead agency should explain the limitations of the particular model or
methodology selected for use; and/or
(2) Rely on a qualitative analysis or performance based standards.
While the amendments identify the calculation of a project’s contribution to global clime
change as one means of determining significance, they do not establish a numerical
standard by which to judge a significant effect or a means to establish such a standard.
3.2.3.6 Cap-and-Trade Program
As discussed previously, the Scoping Plan was adopted by CARB in 2009. As one of
the alternatives presented in the Scoping Plan, CARB staff was directed to develop a
cap-and-trade regulation, which is a type of market-based compliance mechanism. The
cap-and-trade program establishes the total amount of GHG emissions that major
sources would be permitted to emit. Subsequent litigation challenged certain aspects of
the Scoping Plan.
However, the decision was appealed, and on October 20, 2011, the CARB adopted the
final cap-and-trade regulation. The program took effect on January 1, 2012, the first
auctions will be held in 2012 (see discussion below), and compliance obligation for GHG
emissions begins January 1, 2013. Once implemented, the cap-and-trade regulation will
provide a fixed limit on GHG emissions from the stationary sources responsible for about
85 percent of the state’s total GHG emissions.

Greenhouse Gas Analysis for the Crystal View Terrace/Green Orchard Place/Overlook Parkway Project
Page 34
CARB will distribute allowances to emit GHGs, and the total number of allowances created would be equal to the total amount set for cumulative emissions from all covered entities. Each allowance would permit the holder to emit one MTCO2E of GHG. Starting in 2013, the covered entities include major GHG emitting sources, such as electricity generation (including imports and large stationary sources), that emit more than 25,000 MTCO2E per year. The program will expand in 2015 to cover natural gas and propane fuel providers and transportation fuel providers. The cap is divided into annual budgets that specify the total number of allowances for each year from 2013 to 2020. Those that need additional allowances to cover their emissions can purchase them at regular auction from entities that hold excess allowances (i.e., facilities whose actual emissions are less than the total allowances they hold). Each year, fewer allowances will be issued on an annual basis. The cap in 2020 is set at a level designed to allow California to achieve the AB 32 target in 2020. The program also allows for offset credits. An offset credit represents a reduction or removal of one MTCO2E of GHGs through the modification or replacement of existing covered equipment. This credit, once measured, quantified, and verified, can be sold and used by a covered entity to meet a portion of its compliance obligation. Covered entities can purchase offset credits to satisfy up to 8 percent of the entity’s total compliance obligations during a single compliance period. It is estimated that implementation of the cap and trade regulation will reduce GHG emissions by 18 to 27 million MTCO2E in 2020 (CARB 2011).
3.2.4 Local
3.2.4.1 General Plan 2025
The City of Riverside General Plan 2025 includes several climate change-related policies to ensure that GHG emissions reductions are imposed on future development and City operations.
Sustainable Riverside and Global Warming
Policy AQ-8.1: Support the Sustainable Riverside Policy Statement by developing a Green Plan of Action.
Policy AQ-8.2: Support appropriate initiatives, legislation, and actions for reducing and responding to climate change.
Policy AQ-8.3: Encourage community involvement and public-private partnerships to reduce and respond to global warming.
Policy AQ-8.4: Develop a Climate Action Plan that sets a schedule to complete an inventory of municipal and private GHG emissions, sets targets for reductions and methodologies to reach targets.
Greenhouse Gas Analysis for the Crystal View Terrace/Green Orchard Place/Overlook Parkway Project
Page 35
Transportation
Policy AQ-2.1: Support Transportation Management Associations between large employers and commercial/ industrial complexes.
Policy AQ-2.2: Support programs and educate employers about employee rideshare and transit incentives for employers with more than 250 employees at a single location. The City will provide incentives and programs to encourage alternative methods of transit.
Policy AQ-2.3: Cooperate with local, regional, State, and Federal jurisdictions to reduce VMT and motor vehicle emissions through job creation in job-poor areas.
Policy AQ-2.4: Monitor and strive to achieve performance goals and/or VMT reduction, which are consistent with SCAG’s goals.
Policy AQ-2.5: Consult with the California Air Resources Board to identify ways that it may assist the City (e.g., providing funding, sponsoring programs) with its goal to reduce air pollution by reducing emissions from mobile sources.
Policy AQ-2.6: Develop trip reduction plans that promote alternative work schedules, ridesharing, telecommuting and work-at-home programs, employee education, and preferential parking.
Policy AQ-2.7: Use incentives, regulations, and Transportation Demand Management in cooperation with surrounding jurisdictions to eliminate vehicle trips that would otherwise be made.
Policy AQ-2.8: Work with Riverside Transit Authority (RTA) to establish mass transit mechanisms for the reduction of work-related and non-work-related vehicle trips.
Policy AQ-2.9: Encourage local transit agencies to promote ridership though careful planning of routes, headways, origins and destinations, [and] types of vehicles.
Policy AQ-2.10: Identify and develop non-motorized transportation corridors.

Greenhouse Gas Analysis for the Crystal View Terrace/Green Orchard Place/Overlook Parkway Project
Page 36
3.2.4.2 Green Riverside Action Plan
In 2005, the City of Riverside developed a 38-point Clean and Green Sustainable Riverside Action Plan, or Green Action Plan, with the goal of furthering the City’s commitment to a clean, green, and sustainable future and to ensure sustainable growth while preserving the health of the local environment. The plan highlights the following areas: energy, GHG emissions, waste reduction, urban design, urban nature, transportation, and nature. The City worked with the California Department of Conservation (CDC) to make the plan more robust, and then was appointed as an Emerald City by the CDC. The items applicable to the proposed Project are discussed further in Section 5.2.1 below.
4.0 Significance Criteria and Analysis Methodologies
4.1 Determining Significance
To date, there have been no local, regional, state, or federal regulations establishing a threshold of significance within the Project area for the determination of project-specific impacts of GHG emissions. The CEQA Guidelines require Lead Agencies to adopt GHG thresholds of significance. When adopting these thresholds, the Guidelines allow Lead Agencies to consider thresholds of significance adopted or recommended by other public agencies, or recommended by experts, provided that the thresholds are supported by substantial evidence, and/or to develop their own significance threshold.
4.1.1 SCAQMD Interim GHG Thresholds SCAQMD plans to provide guidance to local lead agencies on determining GHG significance thresholds in their CEQA documents by convening a GHG CEQA Significance Threshold Working Group. The SCAQMD began hosting monthly working group meetings in April 2008. The result of the October 2008 working group meeting was a Draft AQMD Staff CEQA Greenhouse Gas Significance Threshold and the Draft Guidance Document – Interim CEQA Greenhouse Gas (GHG) Significance Threshold (SCAQMD 2008). The Draft Threshold is intended to be interim guidance until statewide significance thresholds or guidance are established. The proposed significance threshold is a tiered approach which allows for flexibility by establishing multiple thresholds to cover a broad range of projects.

Greenhouse Gas Analysis for the Crystal View Terrace/Green Orchard Place/Overlook Parkway Project
Page 37
SCAQMD proposes five tiers of compliance that may lead to a determination that impacts are less than significant (SCAQMD 2008):
(1) Tier 1 – consists of evaluating whether or not the project qualifies for any applicable exemption under CEQA. For example, SB 97 specifically exempt[ed] a limited number of projects until it expire[d] in 2010. If a project does no qualify for an exemption, then it would move to the next tier.
(2) Tier 2 – consists of determining whether or not the project is consistent with a GHG reduction plan that may be part of a local general plan, for example. The concept embodied in this tier is equivalent to the existing concept of consistency in CEQA Guidelines §§15064(h)(3), 15125(d), or 15152(a). The GHG reduction plan must, at a minimum, comply with AB 32 GHG reduction goals; include emissions estimates agreed upon by either CARB or the SCAQMD, have been analyzed under CEQA, and have a certified Final CEQA document. Further, the GHG reduction plan must include a GHG emissions inventory tracking mechanism; process to monitor progress in achieving GHG emission reduction targets, and a commitment to remedy the excess emissions if AB 32 goals are not met (enforcement). If the proposed Project is consistent with the local GHG reduction plan, it is not significant for GHG emissions. If the project is not consistent with a local GHG reduction plan or there is no approved plan, the GHG reduction does not include all of the components described above, or there is no adopted GHG reduction plan, the project would move to Tier 3.
(3) Tier 3 – attempts to identify small projects that would not likely contribute to significant cumulative GHG impacts. However, because of the magnitude of increasing global temperatures from current and future GHG emissions, staff is recommending that all projects must implement some measure or measures to contribute to reducing GHG emissions. Therefore, Tier 3 includes a requirement that all projects with GHG emissions less than the screening level must include efficiency components that reduce a certain percentage beyond the requirements of Title 24 (Part 6, California Code of Regulations), California's energy efficiency standards for residential and nonresidential buildings. Project proponents would also have to reduce by a specified percentage electricity demand from water use, primarily electricity used for water conveyance.
The proposed screening thresholds are as follows:
a. industrial projects with an incremental GHG emissions increase that falls below (or is mitigated to be less than) 10,000 MTCO2E per year; or

Greenhouse Gas Analysis for the Crystal View Terrace/Green Orchard Place/Overlook Parkway Project
Page 38
b. commercial and residential projects with an incremental GHG emissions increase that falls below (or is mitigated to be less than) 3,000 MTCO2E per year, provided that such projects also meet energy efficiency and water conservation performance targets that have yet to be developed;
(4) Tier 4 – Decision Tree Options: consists of three decision tree options to demonstrate that a project is no significant for GHG emissions. The four compliance options are as follows:
a. Option #1: Uniform percent emission reduction target objective (e.g., 30 percent) from BAU1 by incorporating project design features and/or implements emission reduction measures.
b. Option #2: Early implementation of applicable AB 32 Scoping Plan measures.
c. Option #3: Achieve sector-based standards (e.g., pounds per person, pounds per square foot, etc.).
(5) Tier 5 – under this tier, the lead agency would quantify GHG emissions from the project and the project proponent would implement offsite mitigation (GHG reduction projects) or purchase offsets to reduce GHG emission impacts to less than the proposed screening level. In addition, the project proponent would be required to provide offsets for the life of the project, which is defined as 30 years. If the project proponent is unable to obtain sufficient offsets, incorporate design features, or implement GHG reduction mitigation measures to reduce GHG emission impacts to less than the screening level, then GHG emissions from the project would be considered significant.
BAU is based on CARB’s 2020 BAU forecast model developed in 2008, which represents the net GHG emissions that would be expected to occur without any GHG project reducing features or mitigation. BAU emissions are not a hypothetical worst-case development scenario, but rather are the GHG emissions that would be reasonably expected to be generated by a development that would occur in the absence of GHG laws and regulations.
On December 5, 2008, the SCAQMD Governing Board adopted its staff proposal for an interim CEQA GHG significance threshold for evaluating projects where the SCAQMD is the lead agency. Currently, the Board has only adopted screening thresholds relevant to industrial (stationary source) projects (see 3(a) above).
1 See Section 4.1.2 for a definition and discussion of BAU.

Greenhouse Gas Analysis for the Crystal View Terrace/Green Orchard Place/Overlook Parkway Project
Page 39
Since December 2008, the SCAQMD continued hosting the working group meetings and revised the draft threshold proposal several times, although it did not officially provide these proposals in a subsequent document. The most recent working group meeting on September 28, 2010, proposed two options lead agencies can select from to screen thresholds of significance for GHG emissions in residential and commercial projects, and proposes to expand the industrial threshold to other lead agency industrial projects. Option 1 proposes a threshold of 3,000 MTCO2E per year for all residential and commercial projects; Option 2 proposes a threshold value by land use type where the numeric threshold is 3,500 MTCO2E per year for residential projects; 1,400 MTCO2E per year for commercial projects; and 3,000 MTCO2E per year for mixed use projects.
The proposed Project is the evaluation of four circulation scenarios associated with Overlook Parkway, and does not propose any residential, commercial, mixed use, or industrial land use developments. Therefore, none of the proposed thresholds discussed above specifically apply to the proposed Project. In order to identify the least GHG impacting scenario and to be conservative, the City has decided to evaluate the current project scenarios using the most restrictive quantitative threshold proposal discussed above of 1,400 MTCO2E per year. Therefore, for the purposes of this analysis, the net emissions associated with each proposed scenario are compared to a threshold of 1,400 MTCO2E per year for the determination of significance.
4.1.2 BAU Analysis One of SCAQMD’s draft significance thresholds recommended determining a project's significance based on whether a project can demonstrate a targeted reduction compared to a year 2020 BAU scenario, consistent with AB 32’s emission-reduction mandates (see 4(a) above). The reference to BAU 2020 emissions is derived from the CARB’s 2020 BAU forecast model. This approach requires that an analysis must demonstrate that the proposed Project’s net emissions, accounting for GHG-reducing design features and existing site emissions equals a targeted reduction when compared to the GHG emissions that would be generated by the proposed Project without GHG-reducing design features. The GHG-reducing design features accounted for in a BAU analysis include statewide measures aimed at reducing mobile emissions, including Pavley and the LCFS, as well as project design features such as increased energy efficiency, reduced water consumption, and other features associated with the design of buildings and land uses.
Since the proposed Project is the evaluation of four circulation scenarios associated with Overlook Parkway and does not propose development, the only GHG-reducing design features would be those associated with statewide mobile measures which are outside the control of the proposed Project and the City of Riverside. Therefore, a BAU analysis was not considered appropriate for the proposed Project. However, a discussion of the Project’s consistency with statewide mobile measures is also included below. It should
Greenhouse Gas Analysis for the Crystal View Terrace/Green Orchard Place/Overlook Parkway Project
Page 40
be noted that the proposed Project would include features such as signal timing, designated turn lanes, and other traffic mitigation measures that would increase traffic flow. Improved traffic flow would reduce vehicle idling, which would in turn reduce GHG emissions. The analysis presented below is based on posted speed limits.
5.0 Impact Analysis Emission estimates were calculated for the three GHGs that may be emitted by the Project (CO2, CH4, and N2O) and that would be emitted from construction and operation of each proposed scenario. A typical project’s five sources of operational emissions are: on-road vehicular traffic, electricity generation, natural gas consumption, water usage, and solid waste disposal. In the case of this proposed Project, GHG emissions would only result from construction and on-road vehicular traffic. None of the proposed scenarios would result in an increase in electricity consumption, natural gas consumption, water use, or solid waste generation. The electricity required for additional traffic signals was assumed to be negligible. The following is analysis of transportation and construction emissions.
5.1 GHG Emissions
5.1.1 Transportation-related GHG Emissions The study area was defined as the County of Riverside in order to capture the trips produced and attracted, some of which originate from outside the City boundaries and some of which have a destination outside the City boundary. This was especially important because features of the Project could affect traffic flows throughout the entire City circulation system and some of the roads within the Project vicinity include major roads that are near the City boundary or provide direct routes of travel beyond City limits. The total existing traffic volume in Riverside County is 5,531,645 average daily traffic (ADT) and the total projected year 2035 buildout traffic volume in Riverside County is 11,222,346 ADT (Janet Harvey 2012).
The increase in ADT from existing to buildout is due to population growth in the region. The proposed Project is the evaluation of four circulation scenarios associated with Overlook Parkway. The scenarios consider traffic patterns and controls for roadways, but do not propose development that would generate new or additional trips. Therefore, the Project would not result in an increase in ADT to the roadway network. Therefore, the existing and future traffic volumes are the same for each scenario. However, each scenario would affect vehicle traffic patterns and the average trip length in the county. The following is an analysis of the regional VMT under each proposed scenario.
Greenhouse Gas Analysis for the Crystal View Terrace/Green Orchard Place/Overlook Parkway Project
Page 41
The EMFAC 2007 program requires a variety of inputs, including year, ambient air temperature, vehicle mix, percent hot and cold starts, and vehicle speed. EMFAC 2007 generates emission inventories for 15 air basins, 58 counties, and 35 air pollution control districts. For this analysis, emission factors for Riverside County within the SCAB were used. Emission factors were calculated for winter and summer average conditions of 50 °F and 80 °F, respectively, and 50 percent humidity (WRCC 2011). Other default parameters provided by the model for Riverside were used in the calculation of individual emission factors for each type of vehicle in the fleet. The EMFAC 2007 default vehicle mix for Riverside was assumed. EMFAC 2007 output files are contained in Attachment 2. Existing, year 2020, and buildout emission factors in summer and winter conditions are summarized in Attachment 3.
The buildout year for the Project is 2035. Existing and buildout GHG emissions were calculated for each scenario. In addition, for the discussion of the Project’s consistency with AB 32 2020 targets, emissions for each scenario in year 2020 were also calculated. Year 2020 traffic volumes were not provided. However, for a worst-case 2020 analysis, it was assumed that the year 2035 buildout traffic volumes would occur by year 2020.
Existing, year 2020, and buildout vehicle GHG emissions for each scenario were calculated using CO2 and CH4 emission factors calculated by the EMFAC 2007 program (State of California 2006b). The EMFAC 2007 program does not calculate emission factors for N2O. Emission factors for N2O were obtained from the EPA (U.S. EPA 2004). This document provides emission factors for gasoline and diesel passenger cars, light-duty trucks, and heavy-duty trucks, as well as motorcycles. Using the default EMFAC 2007 vehicle population fleet mix and the EPA emission factors for N2O, average N2O emission factors for Riverside County were calculated. The N2O emission factor calculations can be found in Attachment 4.
As discussed above, CARB adopted Pavley clean car standards to reduce GHG emissions from passenger vehicles and adopted the LCFS to reduce the carbon intensity of vehicle fuel. These measures are not included in the EMFAC 2007 program. The Pavley I + LCFS Postprocessor (Version 1.0) was developed to adjust the CO2 emissions from the EMFAC 2007 output to account for the reductions from these measures (CARB 2010c). This postprocessor was used to adjust the year 2020 and buildout emissions for each scenario. Pavley I + LCFS Postprocessor output files are contained in Attachment 5.
Traffic information was obtained from ITERIS, Inc. Traffic speeds, volumes, and segment lengths for each roadway segment in Riverside County were provided for each scenario. The VMT for each scenario was calculated by multiplying the ADT for each segment by the length of each segment. Attachment 3 shows the speed, ADT, and VMT for each roadway segment analyzed in this study for each scenario.
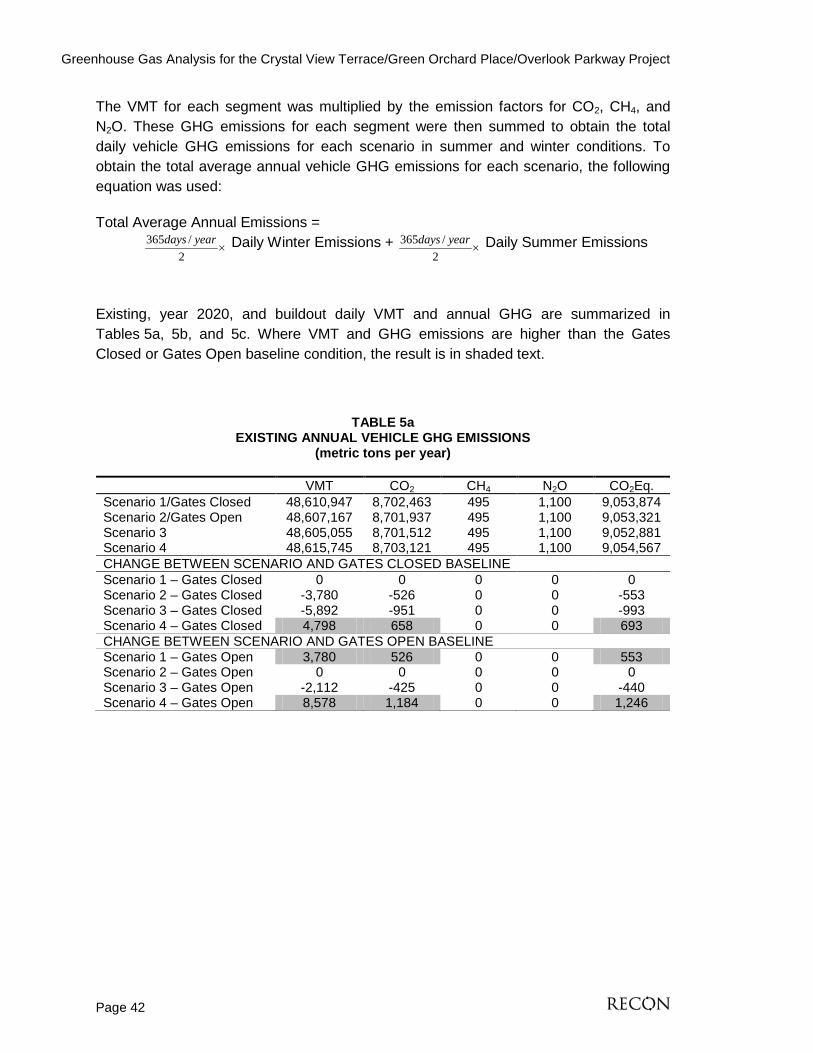
Greenhouse Gas Analysis for the Crystal View Terrace/Green Orchard Place/Overlook Parkway Project
Page 42
The VMT for each segment was multiplied by the emission factors for CO2, CH4, and N2O. These GHG emissions for each segment were then summed to obtain the total daily vehicle GHG emissions for each scenario in summer and winter conditions. To obtain the total average annual vehicle GHG emissions for each scenario, the following equation was used:
Total Average Annual Emissions = ×
2/365 yeardays Daily Winter Emissions + ×
2/365 yeardays Daily Summer Emissions
Existing, year 2020, and buildout daily VMT and annual GHG are summarized in Tables 5a, 5b, and 5c. Where VMT and GHG emissions are higher than the Gates Closed or Gates Open baseline condition, the result is in shaded text.
TABLE 5a EXISTING ANNUAL VEHICLE GHG EMISSIONS
(metric tons per year)
VMT CO2 CH4 N2O CO2Eq. Scenario 1/Gates Closed 48,610,947 8,702,463 495 1,100 9,053,874 Scenario 2/Gates Open 48,607,167 8,701,937 495 1,100 9,053,321 Scenario 3 48,605,055 8,701,512 495 1,100 9,052,881 Scenario 4 48,615,745 8,703,121 495 1,100 9,054,567 CHANGE BETWEEN SCENARIO AND GATES CLOSED BASELINE Scenario 1 – Gates Closed 0 0 0 0 0 Scenario 2 – Gates Closed -3,780 -526 0 0 -553 Scenario 3 – Gates Closed -5,892 -951 0 0 -993 Scenario 4 – Gates Closed 4,798 658 0 0 693 CHANGE BETWEEN SCENARIO AND GATES OPEN BASELINE Scenario 1 – Gates Open 3,780 526 0 0 553 Scenario 2 – Gates Open 0 0 0 0 0 Scenario 3 – Gates Open -2,112 -425 0 0 -440 Scenario 4 – Gates Open 8,578 1,184 0 0 1,246

Greenhouse Gas Analysis for the Crystal View Terrace/Green Orchard Place/Overlook Parkway Project
Page 43
TABLE 5b YEAR 2020 ANNUAL VEHICLE GHG EMISSIONS
(metric tons per year)
VMT CO2 CH4 N2O CO2E Scenario 1/Gates Closed 102,093,231 12,967,904 577 2,348 13,707,798 Scenario 2/Gates Open 102,055,383 12,963,573 577 2,347 13,703,194 Scenario 3 102,089,360 12,967,156 577 2,348 13,707,022 Scenario 4 102,063,715 12,964,378 577 2,347 13,704,059 CHANGE BETWEEN SCENARIO AND GATES CLOSED BASELINE Scenario 1 – Gates Closed 0 0 0 0 0 Scenario 2 – Gates Closed -37,848 -4,331 0 -1 -4,605 Scenario 3 – Gates Closed -3,871 -748 0 0 -776 Scenario 4 – Gates Closed -29,516 -3,526 0 -1 -3,739 CHANGE BETWEEN SCENARIO AND GATES OPEN BASELINE Scenario 1 – Gates Open 37,848 4,331 0 1 4,605 Scenario 2 – Gates Open 0 0 0 0 0 Scenario 3 – Gates Open 33,977 3,583 0 1 3,828 Scenario 4 – Gates Open 8,332 805 0 0 866
TABLE 5c
BUILDOUT ANNUAL VEHICLE GHG EMISSIONS (metric tons per year)
VMT C2O CH4 N2O CO2Eq. Scenario 1/Gates Closed 102,093,231 11,999,908 360 2,422 12,758,332 Scenario 2/Gates Open 102,055,383 11,995,898 360 2,421 12,754,041 Scenario 3 102,089,360 11,999,224 360 2,422 12,757,619 Scenario 4 102,063,715 11,996,654 360 2,421 12,754,859 CHANGE BETWEEN SCENARIO AND GATES CLOSED BASELINE Scenario 1 – Gates Closed 0 0 0 0 0 Scenario 2 – Gates Closed -37,848 -4,010 0 -1 -4,291 Scenario 3 – Gates Closed -3,871 -684 0 0 -713 Scenario 4 – Gates Closed -29,516 -3,254 0 -1 -3,472 CHANGE BETWEEN SCENARIO AND GATES OPEN BASELINE Scenario 1 – Gates Open 37,848 4,010 0 1 4,291 Scenario 2 – Gates Open 0 0 0 0 0 Scenario 3 – Gates Open 33,977 3,326 0 1 3,578 Scenario 4 – Gates Open 8,332 756 0 0 818
These vehicle GHG emissions were added to the construction GHG emissions, calculated as detailed below, and the impacts are discussed further in Section 5.1.3.
5.1.2 Construction GHG Emissions Construction activities emit GHGs primarily though combustion of fuels (mostly diesel) in the engines of off-road construction equipment and through combustion of diesel and gasoline in on-road construction vehicles and in the commute vehicles of the construction workers. Smaller amounts of GHGs are also emitted through the energy use embodied in any water use (for fugitive dust control) and lighting for the construction

Greenhouse Gas Analysis for the Crystal View Terrace/Green Orchard Place/Overlook Parkway Project
Page 44
activity. Every phase of the construction process, including demolition, grading, and paving, emits GHG emissions in volumes proportional to the quantity and type of construction equipment used. The heavier equipment typically emits more GHGs per hour of use than the lighter equipment because of their greater fuel consumption and engine design.
Construction emissions were estimated for each scenario using the California Emissions Estimator Model (CalEEMod) that was released in March 2011 by the CARB (the EMFAC program used above does not calculate construction emissions). This model estimates air emissions from construction and operational emissions sources. In brief, the model estimates criteria air pollutants and GHG emissions by multiplying emission source intensity factors by estimated quantities of emission sources based on the land use information entered by the user in the first module of the model. In the first module, the user defines the specific land uses that will occur at the Project site. The user also selects the appropriate land use setting (urban or rural), operational year, air basin, and utility provider. The input land uses, size features, and population are used throughout CalEEMod in determining default variables and calculations in each of the subsequent modules. The subsequent modules include construction (including off-road vehicle emissions), mobile (on-road vehicle emissions), area sources (woodstoves, fireplaces, consumer products [cleansers, aerosols, solvents], landscape maintenance equipment, architectural coatings), water and wastewater, and solid waste. Each module comprises multiple components including an associated mitigation module to account for further reductions in the reported baseline calculations.
In the case of the proposed Project, only the construction-related portions of the model were utilized. Operational (vehicle) emission calculations are discussed above. Construction inputs to CalEEMod include such items as the air basin containing the Project, duration of construction phases, construction equipment usage, grading areas, season, and ambient temperature, as well as other parameters. Emissions of CO2, CH4, and N2O are calculated.
GHG emissions associated with each phase of project construction are calculated in CalEEMod by multiplying the total fuel consumed by the construction equipment and worker trips by applicable emission factors. CalEEMod estimates construction emissions for each year of construction activity based on the annual construction equipment profile and other factors determined as needed to complete all phases of construction by the target completion year. As such, each year having reported construction emissions has varying quantities of GHG emissions. However, the Association of Environmental Professionals (AEP) has recommended that total construction GHG emissions resulting from a project be amortized over 30 years and added to operational GHG emissions (AEP 2010). Estimates of the total emissions from the entire project construction activities estimated by CalEEMod were thus divided by 30, in accordance with the AEP recommendations.

Greenhouse Gas Analysis for the Crystal View Terrace/Green Orchard Place/Overlook Parkway Project
Page 45
5.1.2.1 Scenario 1
Under Scenario 1, both Crystal View Terrace and Green Orchard Place gates would remain in place and be closed. Because traffic flows would be to the same as those required for the legal condition with the gates in place, no construction would occur under Scenario 1. Therefore, construction GHG emissions under Scenario 1 would be less than significant.
5.1.2.2 Scenario 2
Under Scenario 2, the gates at both Crystal View Terrace and Green Orchard Place would be removed, and there would be no connection of Overlook Parkway across the Alessandro Arroyo and to Alessandro Boulevard. Like Scenario 1, no construction would occur under Scenario 2, as the removal of the gates is a minor procedure. Construction GHG emissions under Scenario 2 would be less than significant.
5.1.2.3 Scenario 3
Under Scenario 3, the gates at Crystal View Terrace and Green Orchard Place would be removed and Overlook Parkway would be connected across the Alessandro Arroyo and eastward to Alessandro Boulevard through construction of a fill crossing and a bridge. In addition, storm drains, water lines, and gas and electric power lines would be extended to tie into existing lines concurrent with roadway construction. Temporary construction activities would occur within a construction easement on either side of the proposed roadways. Construction staging would be accommodated primarily on Overlook Parkway and other existing roadways.
Grading improvements are required to construct the missing section of roadway between Brittanee Court and Sandtrack Road. This fill crossing construction is anticipated to last approximately two months. It was assumed that construction would begin after the avian breeding season in September 2012. Additionally, a bridge is proposed to connect Overlook Parkway from Crystal View Terrace to Via Vista Drive and span the Alessandro Arroyo. The bridge construction is anticipated to last approximately nine months. The bridge construction would be divided into three phases: abutment construction (two months), bent construction (one month), and superstructure construction (six months). It was assumed that these construction phases (i.e., abutment construction, bent construction, superstructure construction, and fill crossing construction) would not overlap. Installation/construction of utilities (water, sewer, electrical) would concurrent with these phases and was taken into account in CalEEMod. Table 6 summarizes the phases of construction, the equipment required for each task, and the default horsepower and load factor for each piece of equipment. It was assumed that each piece of equipment would operate eight hours per day and five days per week.
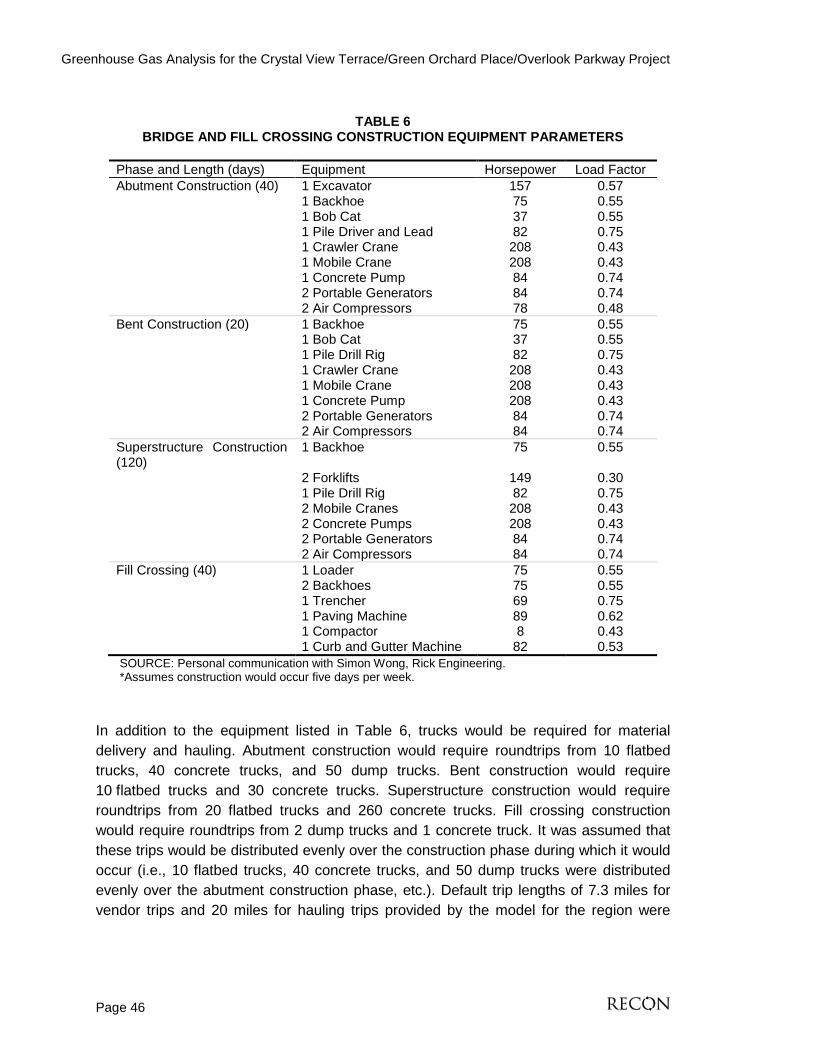
Greenhouse Gas Analysis for the Crystal View Terrace/Green Orchard Place/Overlook Parkway Project
Page 46
TABLE 6
BRIDGE AND FILL CROSSING CONSTRUCTION EQUIPMENT PARAMETERS
Phase and Length (days) Equipment Horsepower Load Factor Abutment Construction (40) 1 Excavator 157 0.57 1 Backhoe 75 0.55 1 Bob Cat 37 0.55 1 Pile Driver and Lead 82 0.75 1 Crawler Crane 208 0.43 1 Mobile Crane 208 0.43 1 Concrete Pump 84 0.74 2 Portable Generators 84 0.74 2 Air Compressors 78 0.48 Bent Construction (20) 1 Backhoe 75 0.55 1 Bob Cat 37 0.55 1 Pile Drill Rig 82 0.75 1 Crawler Crane 208 0.43 1 Mobile Crane 208 0.43 1 Concrete Pump 208 0.43 2 Portable Generators 84 0.74 2 Air Compressors 84 0.74 Superstructure Construction (120)
1 Backhoe 75 0.55
2 Forklifts 149 0.30 1 Pile Drill Rig 82 0.75 2 Mobile Cranes 208 0.43 2 Concrete Pumps 208 0.43 2 Portable Generators 84 0.74 2 Air Compressors 84 0.74 Fill Crossing (40) 1 Loader 75 0.55 2 Backhoes 75 0.55 1 Trencher 69 0.75 1 Paving Machine 89 0.62 1 Compactor 8 0.43 1 Curb and Gutter Machine 82 0.53 SOURCE: Personal communication with Simon Wong, Rick Engineering. *Assumes construction would occur five days per week.
In addition to the equipment listed in Table 6, trucks would be required for material delivery and hauling. Abutment construction would require roundtrips from 10 flatbed trucks, 40 concrete trucks, and 50 dump trucks. Bent construction would require 10 flatbed trucks and 30 concrete trucks. Superstructure construction would require roundtrips from 20 flatbed trucks and 260 concrete trucks. Fill crossing construction would require roundtrips from 2 dump trucks and 1 concrete truck. It was assumed that these trips would be distributed evenly over the construction phase during which it would occur (i.e., 10 flatbed trucks, 40 concrete trucks, and 50 dump trucks were distributed evenly over the abutment construction phase, etc.). Default trip lengths of 7.3 miles for vendor trips and 20 miles for hauling trips provided by the model for the region were

Greenhouse Gas Analysis for the Crystal View Terrace/Green Orchard Place/Overlook Parkway Project
Page 47
assumed. These values are based on construction surveys performed by the SCAQMD and are appropriate for this analysis.
Other construction emissions would be those associated with work commute. Bridge construction would require 15 workers, and fill crossing construction would require 10 workers. It was assumed that each worker would make two trips per day: one in the morning to the site, and one in the afternoon returning home from the site. It was assumed that workers would remain during lunch breaks. This is based on construction surveys performed by the SCAQMD. A default worker trip length of 10.8 miles provided by the model for the region was assumed. This trip rate and length are based on construction surveys performed by the SCAQMD.
Table 7 summarizes the bridge and fill-crossing construction GHG emissions for Scenario 3. CalEEMod input and output files for the bridge and fill-crossing construction are contained in Attachment 6.
TABLE 7
SUMMARY OF BRIDGE AND FILL CROSSING CONSTRUCTION GHG EMISSIONS FOR SCENARIO 3 (metric tons/year)
CO2 CH4 N2O CO2 Eq 2012 232.59 0.03 0.00 233.15 2013 400.03 0.04 0.00 400.95 TOTAL 632.62 0.07 0.00 634.10 Amortized over 30 years 21.09 0.00 0.00 21.14
5.1.2.4 Scenario 4
Under Scenario 4, both Crystal View Terrace and Green Orchard Place gates would be removed and Overlook Parkway would be connected east across the Alessandro Arroyo and eastward to Alessandro Boulevard. In addition, the Proposed C Street would be constructed to form a new alignment for Washington Street to the intersection of Victoria Avenue and Madison Avenue.
Construction GHG emissions due to connecting Overlook Parkway over the Alessandro Arroyo would be the same as those described for the road and bridge crossing discussed above and summarized in Table 7 (see Section 5.1.2.3, Scenario 3). Construction activities would also occur west of Washington Street. This construction would not occur at the same time as the bridge and fill crossing construction.
Construction of the Proposed C Street would include grading and paving. It is anticipated that these construction activities would last up to 90 days and would require the grading of approximately 15.3 acres. It was assumed that construction would begin in 2013 after

Greenhouse Gas Analysis for the Crystal View Terrace/Green Orchard Place/Overlook Parkway Project
Page 48
the bridge and fill crossing construction discussed above. Table 8 summarizes the phases of construction, the equipment required for each task, and the default horsepower and load factor for each piece of equipment. It was assumed that each piece of equipment would operate eight hours per day and five days per week.
TABLE 8
CONSTRUCTION EQUIPMENT PARAMETERS FOR THE PROPOSED C STREET
Phase Length (days) Equipment Horsepower Load Factor Grading 60 2 Excavators 157 0.57 1 Grader 162 0.61 1 Rubber Tired Dozer 358 0.59 2 Scrapers 356 0.72 2 Tractors/Loaders/Backhoes 75 0.55 Paving 30 1 Paver 89 0.62 1 Paving Equipment 82 0.53 1 Roller 84 0.56
In addition, construction emissions associated with work commute were estimated using the model defaults, which were 10 workers for grading and four workers for paving.
Table 9 summarizes the Scenario 4 construction GHG emissions. These include emissions from construction of the Proposed C Street as well as emissions from construction of the bridge and fill-crossing. CalEEMod input and output files for construction of the Proposed C Street are contained in Attachment 7.
TABLE 9
SUMMARY OF SCENARIO 4 CONSTRUCTION GHG EMISSIONS (metric tons/year)
CO2 CH4 N2O CO2 Eq Bridge and Fill Crossing 632.62 0.07 0.00 634.10 Proposed C Street 321.57 0.03 0.00 322.25 TOTAL 954.19 0.10 0.00 956.35 Amortized over 30 years 31.81 0.00 0.00 31.88
5.1.3 Total GHG Emissions Tables 10a, 10b, and 10c summarize the total existing, year 2020, and buildout vehicle and construction emissions under each scenario. Where GHG emissions are higher than the Gates Closed or Gates Open baseline condition, the result is in shaded text.

Greenhouse Gas Analysis for the Crystal View Terrace/Green Orchard Place/Overlook Parkway Project
Page 49
TABLE 10a EXISTING ANNUAL TOTAL GHG EMISSIONS
(metric tons per year)
Vehicle Emissions
(MTCO2E)
Construction Emissions (MTCO2E)
Total Emissions (MTCO2E)
Scenario 1/Gates Closed 9,053,874 0 9,053,874 Scenario 2/Gates Open 9,053,321 0 9,053,321 Scenario 3 9,052,881 21 9,052,902 Scenario 4 9,054,567 32 9,054,599 COMPARISON TO GATES CLOSED BASELINE Scenario 1 – Gates Closed 0 0 0 Scenario 2 – Gates Closed -553 0 -553 Scenario 3 – Gates Closed -993 21 -972 Scenario 4 – Gates Closed 693 32 725 COMPARISON TO GATES OPEN BASELINE Scenario 1 – Gates Open 553 0 553 Scenario 2 – Gates Open 0 0 0 Scenario 3 – Gates Open -440 21 -419 Scenario 4 – Gates Open 1,246 32 1,278
TABLE 10b YEAR 2020 ANNUAL TOTAL GHG EMISSIONS
(metric tons per year)
Vehicle Emissions
(MTCO2E)
Construction Emissions (MTCO2E)
Total Emissions (MTCO2E)
Scenario 1/Gates Closed 13,707,798 0 13,707,798 Scenario 2/Gates Open 13,703,194 0 13,703,194 Scenario 3 13,707,022 21 13,707,043 Scenario 4 13,704,059 32 13,704,091 COMPARISON TO GATES CLOSED BASELINE Scenario 1 – Gates Closed 0 0 0 Scenario 2 – Gates Closed -4,604 0 -4,604 Scenario 3 – Gates Closed -776 21 -755 Scenario 4 – Gates Closed -3,739 32 -3,707 COMPARISON TO GATES OPEN BASELINE Scenario 1 – Gates Open 4,604 0 4,604 Scenario 2 – Gates Open 0 0 0 Scenario 3 – Gates Open 3,828 21 3,849 Scenario 4 – Gates Open 865 32 897

Greenhouse Gas Analysis for the Crystal View Terrace/Green Orchard Place/Overlook Parkway Project
Page 50
TABLE 10c BUILDOUT ANNUAL TOTAL GHG EMISSIONS
(metric tons per year)
Vehicle Emissions
(MTCO2E)
Construction Emissions (MTCO2E)
Total Emissions (MTCO2E)
Scenario 1/Gates Closed 12,758,332 0 12,758,332 Scenario 2/Gates Open 12,754,041 0 12,754,041 Scenario 3 12,757,619 21 12,757,640 Scenario 4 12,754,859 32 12,754,891 COMPARISON TO GATES CLOSED BASELINE Scenario 1 – Gates Closed 0 0 0 Scenario 2 – Gates Closed -4,291 0 -4,291 Scenario 3 – Gates Closed -713 21 -692 Scenario 4 – Gates Closed -3,473 32 -3,441 COMPARISON TO GATES OPEN BASELINE Scenario 1 – Gates Open 4,291 0 4,291 Scenario 2 – Gates Open 0 0 0 Scenario 3 – Gates Open 3,578 21 3,599 Scenario 4 – Gates Open 818 32 850
As discussed in Section 2.2, Project Baseline, two scenarios represent the baseline condition: Gates Closed and Gates Open. Existing traffic counts were made throughout the Project area under both of these scenarios (ITERIS 2012). The following is an analysis of all four scenarios compared to these two baseline conditions.
5.1.3.1 Gates Closed Baseline Comparison
a. Scenario 1
As shown in Tables 5a through 5c, Scenario 1 with the gates closed currently generates 48,610,947 daily VMT and would generate 102,093,231 daily VMT at buildout. This scenario is equivalent to the Gates Closed baseline. Additionally, no construction would occur under Scenario 1. Therefore, there is no difference in VMT or GHG emissions between Scenario 1 and the Gates Closed baseline, and GHG impacts due to operation of Scenario 1 would be less than significant.
b. Scenario 2
As shown in Tables 5a through 5c, Scenario 2 with the gates open currently generates 48,607,167 daily VMT and would generate 102,055,383 daily VMT at buildout. These are decreases in VMT relative to the baseline. When compared to the Gates Closed baseline, this decrease in VMT results in a decrease in vehicle GHG emissions. Additionally, no major construction would occur under Scenario 1. As shown in Tables 10a through 10c, when compared to the Gates Closed baseline, Scenario 2 would result in an annual decrease in GHG emissions of 553 MTCO2E in the existing plus Scenario 2
Greenhouse Gas Analysis for the Crystal View Terrace/Green Orchard Place/Overlook Parkway Project
Page 51
condition, a decrease of 4,604 MTCO2E in year 2020, and a decrease of 4,291 at buildout. Since Scenario 2 would result in a decrease in emissions when compared to the Gates Closed baseline, GHG impacts would be less than significant.
c. Scenario 3
As shown in Tables 5a through 5c, Scenario 3 with the gates open and the Overlook connection made would generate 48,605,055 daily VMT with the existing traffic conditions (i.e., the existing plus project scenario), and would generate 102,089,360 daily VMT at buildout. These are decreases in VMT relative to the baseline. When compared to the Gates Closed baseline, this decrease in VMT results in a decrease in vehicle GHG emissions. Construction of the bridge and fill crossing would result in approximately 21 MTCO2E when amortized over 30 years. As shown in Tables 10a through 10c, when compared to the Gates Closed baseline, Scenario 3 would result in a total annual decrease in GHG emissions of 972 MTCO2E in the existing plus Scenario 3 condition, a decrease of 755 MTCO2E in year 2020, and a decrease of 692 MTCO2E at buildout. Since Scenario 3 would result in a decrease in emissions when compared to the Gates Closed baseline, GHG impacts would be less than significant.
d. Scenario 4
As shown in Tables 5a through 5c, Scenario 4 with the Overlook connection made east to Alessandro Boulevard, and the construction of the Proposed C Street would generate 48,615,745 daily VMT with the existing traffic conditions (i.e., the existing plus project scenario), and would generate 102,063,715 daily VMT at buildout. In the existing condition, the daily VMT under Scenario 4 is greater than the existing Gates Closed baseline daily VMT. Additionally, construction of the bridge and fill crossing and the Proposed C Street would result in approximately 32 MTCO2E when amortized over 30 years. As shown in Table 10a, when compared to the Gates Closed baseline, Scenario 2 would result in a total annual increase in GHG emissions of 725 MTCO2E. This is less than the most restrictive proposed SCAQMD threshold of 1,400 MTCO2E per year. Therefore, impacts would be less than significant.
At buildout, the daily VMT under Scenario 4 is less than the daily VMT under buildout of the Gates Closed baseline. This results in a decrease in GHG emissions. As shown in Tables 10b and 10c, when compared to the Gates Closed baseline, Scenario 4 would result in a total annual decrease in GHG emissions of 3,707 MTCO2E in year 2020 and a decrease of 3,441 MTCO2E at buildout. Since Scenario 4 would result in a decrease in emissions when compared to the Gates Closed baseline, GHG impacts would be less than significant.

Greenhouse Gas Analysis for the Crystal View Terrace/Green Orchard Place/Overlook Parkway Project
Page 52
5.1.3.2 Gates Open Baseline Comparison
a. Scenario 1
As shown in Tables 5a through 5c, the existing and buildout VMTs under Scenario 1 with the gates closed are greater than the existing and buildout VMTs under the Gates Open baseline. As shown in Tables 10a through 10c, when compared to the Gates Open baseline, Scenario 1 would result in a total annual increase in GHG emissions of 553 MTCO2E in the existing plus Scenario 1 condition, an increase of 4,604 MTCO2E in year 2020, and an increase of 4,291 MTCO2E at buildout. The increase of 553 MTCO2E in the existing plus Scenario 1 condition is less than the most restrictive SCAQMD proposed threshold of 1,400 MTCO2E per year and would be considered less than significant. However, the increases in emissions in year 2020 and at buildout would exceed this threshold and would be potentially significant.
It should be noted, however, that these slight increases in GHG emissions are minor when compared to the total GHG emissions due to vehicle travel on the entire Riverside County roadway network. These increases represent only 0.03 percent of the total vehicle GHG emissions of approximately 13,000,000 to 14,000,000 MTCO2E per year. Additionally, these increases are less than the adopted industrial significance threshold of 10,000 MTCO2E per year for a single project. However, because these increases would exceed the most restrictive threshold of 1,400 MTCO2E per year, GHG impacts due to operation of Scenario 1 would be significant when compared to the Gates Open baseline.
b. Scenario 2
Scenario 2 is equivalent to the Gates Open baseline. Therefore, there is no difference in VMT or GHG emissions between Scenario 2 and the Gates Open baseline, and GHG impacts due to operation of Scenario 2 would be less than significant when compared to the Gates Open baseline.
c. Scenario 3
As shown in Tables 5a through 5c, in the existing condition, the daily VMT under Scenario 3 is less than the existing Gates Open baseline daily VMT. This results in a decrease in vehicle GHG emissions. After the addition of construction GHG emissions, Scenario 3 would result in a net decrease of 419 MTCO2E per year in the existing plus Scenario 3 condition when compared to the Gates Open baseline.

Greenhouse Gas Analysis for the Crystal View Terrace/Green Orchard Place/Overlook Parkway Project
Page 53
The buildout VMT under Scenario 3 are greater than the buildout VMT under the Gates Open baseline. This results in an increase in vehicle GHG emissions in year 2020 and at buildout. After the addition of construction GHG emissions, when compared to the Gates Open baseline, Scenario 3 would result in a total annual net increase in GHG emissions of 3,849 MTCO2E in year 2020 and an increase of 3,599 MTCO2E at buildout. These increases in emissions in year 2020 and at buildout would exceed the 1,400 MTCO2E threshold and would be potentially significant.
As with Scenario 1, these slight increases in GHG emissions are minor (0.03 percent) when compared to the total GHG emissions due to vehicle travel on the entire Riverside County roadway network. Additionally, these increases are less than the adopted industrial significance threshold of 10,000 MTCO2E per year for a single project. However, because these increases would exceed the most restrictive threshold of 1,400 MTCO2E per year, GHG impacts due to operation of Scenario 3 would be significant when compared to the Gates Open baseline.
d. Scenario 4
As shown in Tables 5a through 5c, the existing and buildout VMTs under Scenario 4 are greater than the existing and buildout VMTs under the Gates Open baseline. After the addition of construction GHG emissions, Scenario 4 would result in a total annual net increase in GHG emissions of 1,278 MTCO2E in the existing plus Scenario 4 condition, an increase of 897 MTCO2E in year 2020, and an increase of 850 MTCO2E at buildout. These increases are less than the most restrictive SCAQMD proposed threshold of 1,400 MTCO2E per year and would be considered less than significant.
5.1.3.3 Off-site
The Traffic Impact Analysis identifies mitigation measures involving traffic signalization and restriping for new or additional right- or left-turn lanes for all scenarios under both the gates open and gates closed baselines. Additionally, for Scenarios 2, 3, and 4, minor paving would be required at key intersections (e.g., Alessandro Boulevard and Trautwein Road, Victoria Avenue and Madison Street) to allow for additional turn lanes. However, this minor paving would require a minimal amount of construction equipment and would be short in duration. Signalization, restriping, and minor paving would occur after completion of grading associated with roadway improvements described for the proposed Project and would be short in duration. To quantify these emissions it was assumed that these off-site paving activities would be similar to the paving required for construction of Proposed C Street under Scenario 4. This is a conservative assumption, since Proposed C Street would require significantly more paving than what would be required at existing intersections. It was calculated by CalEEMod that the total of all Project paving activities would emit 0.7 MTCO2E when amortized over 30 years. When
Greenhouse Gas Analysis for the Crystal View Terrace/Green Orchard Place/Overlook Parkway Project
Page 54
added to the GHG emissions summarized in Tables 10a through 10c, there would be no change to the significance conclusions in the impact discussion above.
5.1.4 Significance of Impacts Table 11 summarizes the significance of impacts for all four scenarios when compared to the Gates Closed and the Gates Open baselines. As shown, when compared to the Gates Closed baseline, GHG impacts due to all four scenarios would be less than significant. When compared to the Gates Open baseline, Scenarios 1 and 3 would be significant in year 2020 and at buildout. These calculations take into account statewide measures aimed at reducing vehicle GHG emissions (i.e., Pavley and LCFS). Further reductions in the Project area could only come from additional state and federal measures that would increase vehicle efficiency and would be out of the control of the proposed Project. Therefore, Scenarios 1 and 3 would remain significant and unavoidable when compared to the Gates Open baseline. It should also be noted that at buildout (and in year 2020), Scenario 2 would result in the fewest VMT and the lowest GHG emissions. From a GHG perspective, Scenario 2 would be the preferred scenario.
5.2 Project Consistency with Adopted GHG Plans, Policies, and Regulations
Would the proposed Project conflict with an applicable plan, policy, or regulation adopted for the purpose of reducing emissions of GHGs?
5.2.1 Impacts
5.2.1.1 Consistency with the Scoping Plan
The regulatory plans and policies discussed in Section 3.2 above aim to reduce federal, state, and local GHG emissions by primarily targeting the largest emitters of GHGs: the transportation and energy sectors. Plan goals and regulatory standards are thus largely focused on the automobile industry and public utilities. For the transportation sector, the reduction strategy is generally three pronged: to reduce GHG emissions from vehicles by improving engine design; to reduce the carbon content of transportation fuels through research, funding, and incentives to fuel suppliers; and to reduce the miles these vehicles travel through land use change and infrastructure investments.

TABLE 11 SIGNIFICANCE OF GHG IMPACTS
Gate Closed Baseline Gates Open Baseline
Scenario 1 No net increase in emissions. Less than significant.
Existing + Project: Net increase in emissions less than 1,400 MTCO2E per year. Less than significant. Year 2020+Project: Net increase in emissions greater than 1,400 MTCO2E per year. Significant Impact. Buildout + Project: Net increase in emissions greater than 1,400 MTCO2E per year. Significant Impact.
Scenario 2 Decrease in net emissions. Less than significant.
No net increase in emissions. Less than significant.
Scenario 3 Decrease in net emissions. Less than significant.
Existing + Project: Decrease in net emissions. Less than significant. Year 2020 + Project: Net increase in emissions greater than 1,400 MTCO2E per year. Significant Impact. Buildout + Project: Net increase in emissions greater than 1,400 MTCO2E per year. Significant Impact.
Scenario 4
Existing + Project: Net increase in emissions less than 1,400 MTCO2E per year. Less than significant. Year 2020+Project: Decrease in net emissions. Less than significant. Buildout + Project: Decrease in net emissions. Less than significant.
Net increase in emissions less than 1,400 MTCO2E per year. Less than significant.

Greenhouse Gas Analysis for the Crystal View Terrace/Green Orchard Place/Overlook Parkway Project
Page 56
The vehicle GHG emissions calculated above take into account the vehicle emission reductions provided by Pavley and the LCFS. Together, these measures result in an approximate 24 percent reduction in vehicle GHG emissions in Riverside County (see Attachment 3). In addition, none of the proposed scenarios would conflict with the GHG-reducing measures outlined in the Scoping Plan (see Table 4). As indicated in Table 4, the majority of reductions is directed at the sectors with the largest GHG emissions contributions—transportation and electricity generation—and involve statutory mandates affecting vehicle or fuel manufacture, public transit, and public utilities. The proposed scenarios would not conflict with these transportation reduction measures.
The other measures are applicable to land use planning and development. For the energy sector, the reduction strategies aim to reduce energy demand, impose emission caps on energy providers; establish minimum building energy and green building standards, transition to renewable non-fossil fuels, incentivize homeowners and builders, fully recover landfill gas for energy, expand research and development, and so forth. Since the proposed Project is the evaluation of four circulation scenarios, these measures are not applicable to the proposed Project.
5.2.1.2 Consistency with the General Plan 2025
a. General Plan EIR GHG Analysis
The EIR prepared for the General Plan 2025 update estimated GHG emissions due to buildout of the General Plan 2025. The EIR calculated that the annual VMT per person would more than double from 1990 to 2020 in the plan area. It was found that, given that the buildout of the General Plan 2025 would result in GHG emissions of 1.63 million metric tons in 2020 within a region (City of Riverside) that will produce a total of 7.3 million metric tons, and would generate approximately three times the annual level that occurred in 1990 and approximately double the tons of CO2 per person, the increase in GHG was considered significant (City of Riverside 2007).
The General Plan 2025 analysis considered buildout of the City, including the connection of Overlook Parkway. The analysis presented above is consistent with the General Plan 2025 analysis, but with specific emphasis on the scenarios, some of which include the Overlook Parkway connection. Similar to the General Plan 2025 analysis, it was found that VMT would increase under certain scenarios.
b. General Plan 2025 Policies
The City has adopted policies and programs in the General Plan 2025 to promote the use of clean and renewable energy sources, facilitate alternative modes of transportation and reduction in VMT, waste reduction, water conservation, and for the efficient and sustainable use of energy. Scenario 2 would result in a net decrease in VMT at buildout, and impacts would be less than significant. However, Scenarios 1, 3, and 4 would

Greenhouse Gas Analysis for the Crystal View Terrace/Green Orchard Place/Overlook Parkway Project
Page 57
result in a net increase in VMT at buildout. General Plan 2025 Policy AQ-2.4 aims at achieving performance goals and/or reducing regional VMT (see Section 3.2.4.1). The goal behind this policy is to reduce vehicle emissions. Scenarios 3 and 4 would connect Overlook Parkway, as called for in the General Plan 2025, and improve traffic flow, thereby not conflicting with the policy objective of achieving performance goals. Thus, Scenarios 3 and 4 would be consistent with the policy, and impacts would be less than significant. As discussed above, Scenario 1 would increase VMT. The gates at two locations are intended as traffic control devices to prevent cut-through traffic. By keeping the gates in place, this scenario does not allow for the efficient flow of traffic in this area of the City. However, Scenario 1 would not prevent the City from achieving overarching sustainability and performance goals, and impacts would be less than significant. Further reductions of vehicle emissions could also come from state and federal measures which increase standards for vehicle efficiency over time. Off-site improvements require minimal construction equipment and would be short term; these activities would not conflict with any applicable plan, policy, or regulation, and impacts would also be less than significant.
5.2.1.3 Consistency with the Green Action Plan
As discussed above in Section 3.2.4.2, the City has developed a Green Action Plan. The following is a list of the Green Action Plan items that may be applicable to transportation projects:
Item 26: Synchronize traffic signals along primary City arterials by the end of 2008.
Item 27: Implement a program to design, construct, or close at least one of the 26 railroad grade separations each year.
Item 28: Reconstruct at least two freeway/street interchanges by 2012.
Item 29: Increase the number of clean vehicles in the non-emergency City fleet to at least 60 percent by 2010.
Item 30: Encourage the use of bicycles as an alternative form of transportation, not just recreation, by increasing the number of bike trails by 15 miles and bike lanes by 111 miles throughout the City before 2025.
Item 31: Develop programs to reduce mobile sources of pollution, such as encouraging the purchase of alternative fuel vehicles or lower emission hybrids and plug-ins for the residential and business community before 2009.
Item 32: Promote and encourage the use of alternative methods of transportation throughout the community by providing programs to City employees that can be duplicated by local businesses.

Greenhouse Gas Analysis for the Crystal View Terrace/Green Orchard Place/Overlook Parkway Project
Page 58
Item 33: Implement a regional transit program between educational facilities by 2010.
Item 34: Coordinate a plan with local agencies to expand affordable convenient public transit that will assist in reducing the per capita vehicle trips within the City limits by 2009.
Since the proposed Project would only affect vehicle traffic patterns and trip length on road segments in the county, the proposed Project would not conflict with these goals. The proposed Project would further these goals by synchronizing traffic signals, providing new bike lanes, providing designated turn lanes, and implementing other traffic mitigation measures that would increase traffic flow. Off-site improvements are limited to intersection improvements which would also not conflict with applicable goals and policies related to GHG emissions.
5.2.1.4 Consistency with SB 375
SB 375 is discussed in Section 3.2.3.4(d). The proposed Project is not a land use development project. The Project would implement, to varying degrees, the City’s existing General Plan 2025 roadway network and would not expand the footprint of existing development or alter land use designations in a manner that may lead to the “sprawl” that SB 375 was enacted to avoid. Accordingly, the proposed Project, along with off-site improvements, would not conflict with an SCS or with the goals or implementation of SB 375.
5.2.2 Significance of Impacts The proposed Project is consistent with the goals and strategies of state plans, policies, and regulations aimed at reducing GHG emissions. Because Scenario 2 would not result in an increase in VMT or net GHG emissions, impacts due to Scenario 2 would be less than significant. Scenarios 3 and 4 would improve traffic flow and therefore be consistent with the goals behind General Plan 2025 Policy AQ-2.4 of achieving performance goals. Impacts under Scenarios 3 and 4 would be less than significant. Although Scenario 1 would increase VMT, this scenario would not prevent the City from achieving performance goals related to reduced vehicle emissions. Impacts would also be less than significant. Off-site improvements would not conflict with applicable goals and policies related to GHG emissions, and impacts are less than significant.

Greenhouse Gas Analysis for the Crystal View Terrace/Green Orchard Place/Overlook Parkway Project
Page 59
6.0 Conclusions and Recommendations
As discussed above and shown in Table 11, when compared to the Gates Closed baseline, GHG impacts due to all four scenarios would be less than significant. When compared to the Gates Open baseline, Scenarios 1 and 3 would be significant in year 2020 and at buildout. These calculations take into account statewide measures aimed at reducing vehicle GHG emissions (i.e., Pavley and LCFS). Further reductions in vehicle emissions could only come from additional state and federal measures that would increase vehicle efficiency and would be out of the control of the proposed Project and the City of Riverside. Therefore, Scenarios 1 and 3 would remain significant and unavoidable when compared to the Gates Open baseline.
The proposed Project is consistent with the goals and strategies of state plans, policies, and regulations aimed at reducing GHG emissions. Because Scenario 2 would not result in an increase in VMT or net GHG emissions, impacts due to Scenario 2 would be less than significant. Scenarios 3 and 4 would improve traffic flow, and therefore be consistent with the goals behind General Plan 2025 Policy AQ-2.4 of achieving performance goals. Impacts under Scenarios 3 and 4 would be less than significant. Although Scenario 1 would increase VMT, this scenario would not prevent the City from achieving performance goals related to reduced vehicle emissions. Impacts would also be less than significant. Off-site improvements would not conflict with applicable goals and policies related to GHG emissions, and impacts are less than significant.

Greenhouse Gas Analysis for the Crystal View Terrace/Green Orchard Place/Overlook Parkway Project
Page 60
7.0 References Cited Association of Environmental Professionals (AEP) 2010 Spring 2010 Advanced CEQA Workshop. San Diego Chapter. May 13. Australian Government 2007 Montreal Protocol on Substances that Deplete the Ozone Layer. Department
of the Environment and Water Resources (DEWR). Obtained from the DEWR website at http://www.environment.gov.au/atmosphere/ozone/legislation/ montp.html on July 27, 2007.
California Air Resources Board (CARB) 2008a California 2020 GHG Emissions Forecast. Accessed June 1, 2010 from the
CARB website at http://www.arb.ca.gov/cc/inventory/data/forecast.htm. Last updated October 2008; last reviewed May 28, 2010.
2008b Climate Change Scoping Plan: A Framework for Change. Accessed from the
CARB website April 15, 2010 at http://www.arb.ca.gov/cc/scopingplan/ document/adopted_scoping_plan.pdf. December.
2010a Proposed Regional Greenhouse Gas Emission Reduction Targets for
Automobiles and Light Trucks Pursuant to Senate Bill 375. Staff Report. Date of Release: August 9, 2010. Schedule for Consideration: September 23, 2010.
2010b Senate Bill 375 – Regional Targets. Obtained from the CARB website at
http://www.arb.ca.gov/cc/sb375/sb375.htm on October 29. 2010c Pavley I + Low Carbon Fuel Standard Postprocessor. Version 1.0.
http://www.arb.ca.gov/cc/sb375/tools/postprocessor.htm. 2011 Cap and Trade Program. Accessed from the CARB website at
http://arb.ca.gov/cc/capandtrade/capandtrade.htm on November 11. California Environmental Protection Agency (CalEPA) 2005 California Hydrogen Blueprint Plan. Volume 1 Draft Final Report. March. California, State of 2006a Press Release - Gov. Schwarzenegger Signs Landmark Legislation to Reduce
Greenhouse Gas Emissions. Office of the Governor. September 27. Obtained from the Governor’s website at http://gov.ca.gov/index.php?/press-release/4111/ on May 24, 2007.

Greenhouse Gas Analysis for the Crystal View Terrace/Green Orchard Place/Overlook Parkway Project
Page 61
2006b On-Road Emissions Inventory Program. EMFAC2007/Version 2.30 –
Calculating Emission Inventories for Vehicles in California. User’s Guide. November.
Harvey, Janet 2012 Personal communication with Lisa Lind and Jessica Fleming, RECON, via
email. ITERIS, Inc. Senior Transportation Engineering Manager. March 19, 2012.
ITERIS, Inc. 2012 Crystal View Terrace/Green Orchard Place/Overlook Parkway Project TIA,
Riverside, California.16J11-1602. March 28. Marten Law Group 2008 California Sues EPA over Vehicle Emissions Standards. Accessed May 19,
2008 at: http://www.martenlaw.com/news/?20080109-calif-sues-epa. Riverside, City of 2007 City of Riverside General Plan 2025 FEIR. Certified November. 2010 Baseline Community Greenhouse Gas Emissions Inventory. July. Sacramento Bee 2007 California gets a win on emissions-cut law. By Dale Kasler, December 13.
Accessed May 19, 2008 at: http://www.shns.com/shns/g_index2.cfm? action=detail&pk=CAL-EMISSIONSCUT-12-13-07.
South Coast Air Quality Management District (SCAQMD) 2008 Draft Guidance Document—Interim CEQA Greenhouse Gas (GHG)
Significance Threshold. Accessed at http://www.aqmd.gov/ceqa/handbook/ GHG/2008/oct22mtg/GHGguidance.pdf . October.
2011 CalEEMod User’s Tips. Accessed from the SCAQMD website at
http://www.aqmd.gov/caleemod/guide.htm. Released June. Southern California Association of Governments (SCAG) 2011 Regional Transportation Plan 2012 website. Accessed from the SCAG website
at http://www.scag.ca.gov/rtp2012/index.htm. July 6.

Greenhouse Gas Analysis for the Crystal View Terrace/Green Orchard Place/Overlook Parkway Project
Page 62
Union of Concerned Scientists (UCS) 2007 SB 1368 (Perata) Greenhouse Gas Emissions Performance Standard for
Major Power Plant Investments – A Fact Sheet of the Union of Concerned Scientists. Obtained from the UCS web site at http://www.ucsusa.org/assets/ documents/global_warming/SB-1368-Perata-fact-sheet.pdf on June 7, 2007.
United Nations Environment Programme (UNEP) 2007 Achievements in Stratospheric Ozone Protection, The Montreal Protocol on
Substances that Deplete the Ozone Layer, Progress Report 1987–2007. Obtained from the UNEP website at http://ozone.unep.org/ Publications/MP_Acheivements-E.pdf on May 23, 2007.
The United Nations Framework Convention on Climate Change (UNFCCC) 2007a The United Nations Framework Convention on Climate Change. Obtained
from the UNFCCC website at http://unfccc.int/essential_background/ convention/items/2627.php on May 23, 2007.
2007b Kyoto Protocol. Obtained from the UNFCCC website at
http://unfccc.int/kyoto_protocol/items/2830.php on May 24, 2007. 2009 Status of Ratification. Obtained from the UNFCCC website at
http://unfccc.int/kyoto_protocol/background/status_of_ratification/items/2613.php on July 24, 2009.
United States Environmental Protection Agency (U.S. EPA) 2002 Greenhouse Gases and Global Warming Potential Values – Excerpt from the
Inventory of U.S. Greenhouse Emissions and Sinks: 1990-2000. U.S. Greenhouse Gas Inventory Program, Office of Atmospheric Programs. April.
2004 Update of Methane and Nitrous Oxide Emission Factors for On-Highway
Vehicles. Office of Transportation and Air Quality. EPA420-P-04-016. November.
2007a International Cooperation. Obtained from the EPA Climate Change website at
http://www.epa.gov/climatechange/policy/internationalcooperation.html on May 24, 2007.
2007b Ozone Depletion Rule and Regulations. Obtained from the EPA Ozone
Depletion website at http://www.epa.gov/ozone/title6/index.html on May 23, 2007.
Greenhouse Gas Analysis for the Crystal View Terrace/Green Orchard Place/Overlook Parkway Project
Page 63
2007c U.S. Climate Policy and Actions. Obtained from the EPA Climate Change website at http://www.epa.gov/climatechange/policy/index.html on May 25, 2007.
2010a Inventory of U.S. Greenhouse Gas Emissions and Sinks: 1990-2008. U.S.
Greenhouse Gas Inventory Program, Office of Atmospheric Programs. 430-R-10-006. April 15.
2010b Amendments to the Montreal Protocol. Obtained from the EPA website at
http://www.epa.gov/ozone/intpol/history.html on December 28. Western Regional Climate Center (WRCC) 2011 Western U.S. Climate Historical Summaries: http://www.wrcc.dri.edu/cgi-
bin/cliMAIN.pl?ca7470. Accessed March 21.

Greenhouse Gas Analysis for the Crystal View Terrace/Green Orchard Place/Overlook Parkway Project
Page 64
This page is intentionally blank.

ATTACHMENTS
(included in attached CD)