Graduate Demographics
4
2006 through 2010 STUDENT CHARACTERISTICS 2006 2007 2008 2009 2010 GENDER: Female 61% 59% 56% 56% 58% Male 39% 41% 44% 44% 42% Total 100% 100% 100% 100% 100% ETHNICITY: Black 6% 7% 6% 8% 9% Asian/Pacific Islander 1% 3% 4% 2% 4% Native American 1% 1% 1% 0% 0% Hispanic 3% 4% 3% 3% 3% White (non-Hispanic) 82% 77% 72% 77% 75% Other / Unknown 8% 9% 14% 9% 9% Total 100% 100% 100% 100% 100% DISABLING CONDITIONS: Total 7% 5% 4% 3% 4% AGE DISTRIBUTION: 21 and under 39% 35% 36% 48% 57% 22-24 17% 19% 25% 16% 13% 25-29 17% 16% 15% 12% 11% 30-34 9% 6% 5% 6% 6% 35-39 3% 5% 7% 7% 4% 40-49 10% 9% 7% 7% 7% 50-64 5% 7% 5% 4% 2% Over 64 0% <1% 0% <1% <1% Unknown <1% 0% <1% 0% 0% Total 100% 100% 100% 100% 100% AVERAGE AGE (YEARS): Median Age 23.5 23.9 23.5 22.2 21.2 Mean Age 27.8 28.2 27.3 26.6 25.0 COUNTY OF RESIDENCE: Schenectady 55% 55% 58% 56% 57% Saratoga 15% 13% 15% 16% 14% Albany 14% 18% 14% 18% 17% Rensselaer 4% 4% 3% 2% 3% Schoharie 1% 1% 2% 2% <1% Montgomery 4% 5% 3% 4% 4% Fulton 3% 2% 3% <1% 1% Other 4% 2% 3% 2% 4% Total 100% 100% 100% 100% 100% Total Graduates 487 477 479 458 545 Total Degrees/Certificates Conferred 504 502 506 484 571 Note: Through May 2010, SCCC has awarded 15,231 degrees and certificates to 14,009 students since its inception in 1969. 1,136 students have earned multiple degrees/certificates from SCCC. 23 PROFILE OF GRADUATING CLASSES
-
Upload
schenectady-county-community-college -
Category
Documents
-
view
213 -
download
0
description
Demographics and majors of graduates. Graduation, transfer and retention rates.
Transcript of Graduate Demographics

2006 through 2010
STUDENTCHARACTERISTICS 2006 2007 2008 2009 2010
GENDER: Female 61% 59% 56% 56% 58% Male 39% 41% 44% 44% 42%Total 100% 100% 100% 100% 100%
ETHNICITY: Black 6% 7% 6% 8% 9% Asian/Pacific Islander 1% 3% 4% 2% 4% Native American 1% 1% 1% 0% 0% Hispanic 3% 4% 3% 3% 3% White (non-Hispanic) 82% 77% 72% 77% 75% Other / Unknown 8% 9% 14% 9% 9%Total 100% 100% 100% 100% 100%
DISABLING CONDITIONS:Total 7% 5% 4% 3% 4%
AGE DISTRIBUTION: 21 and under 39% 35% 36% 48% 57% 22-24 17% 19% 25% 16% 13% 25-29 17% 16% 15% 12% 11% 30-34 9% 6% 5% 6% 6% 35-39 3% 5% 7% 7% 4% 40-49 10% 9% 7% 7% 7% 50-64 5% 7% 5% 4% 2% Over 64 0% <1% 0% <1% <1% Unknown <1% 0% <1% 0% 0%Total 100% 100% 100% 100% 100%
AVERAGE AGE (YEARS): Median Age 23.5 23.9 23.5 22.2 21.2 Mean Age 27.8 28.2 27.3 26.6 25.0
COUNTY OF RESIDENCE: Schenectady 55% 55% 58% 56% 57% Saratoga 15% 13% 15% 16% 14% Albany 14% 18% 14% 18% 17% Rensselaer 4% 4% 3% 2% 3% Schoharie 1% 1% 2% 2% <1% Montgomery 4% 5% 3% 4% 4% Fulton 3% 2% 3% <1% 1% Other 4% 2% 3% 2% 4%Total 100% 100% 100% 100% 100%
Total Graduates 487 477 479 458 545Total Degrees/Certificates Conferred 504 502 506 484 571
Note: Through May 2010, SCCC has awarded 15,231 degrees and certificates to 14,009 students since its inception in 1969. 1,136 students have earned multiple degrees/certificates from SCCC.
23
PROFILE OF GRADUATING CLASSES

PROGRAM OF STUDY 2006 2007 2008 2009 2010
TRANSFER PROGRAMS: Aviation Science 12 10 2 3 12 Business Administration 21 31 32 40 44 Computer Science 9 5 5 5 9 Human Services 14 13 25 30 30 Humanities and Social Science 54 47 43 37 51 Individual Studies (AA) 1 0 0 0 0 Individual Studies (AS) 2 2 0 0 0 Mathematics and Science 5 3 6 3 5 Performing Arts: Drama 4 5 4 3 3 Performing Arts: Music 16 13 16 12 17 Science 9 12 7 7 7 Teacher Education 36 28 29 25 30Total Transfer Degrees 183 169 169 165 208
CAREER PROGRAMS: Accounting 5 8 6 9 7 Business Administration 36 39 33 36 43 Chemical Dependency Counseling 4 8 7 6 4 Computer Information Systems 9 7 7 11 15 Computer Networking & Systems 4 6 7 10 12 Criminal Justice 42 50 46 52 51 Culinary Arts 60 56 66 61 65 Early Childhood 12 5 14 4 8 Electrical Technology 7 3 3 3 3 Emergency Management N/A N/A 5 6 4 Fire Protection Technology 7 13 9 10 6 Hotel and Restaurant Management 29 25 34 29 27 Human Services 5 10 7 6 7 Music / Business 3 1 2 3 4 Nanoscale Materials Technology N/A N/A N/A 1 2 Paralegal 40 31 27 17 25 Tourism and Hospitality Mgmt 15 15 9 9 10Total Career Degrees* 278 277 283 273 293
CERTIFICATE PROGRAMS: Assistant Chef 3 5 1 3 2 Computer Desktop Support Specialist N/A N/A 2 1 1 Computer Information Systems 0 2 N/A N/A N/A Computer Repair and Networking N/A N/A N/A N/A 2 Computer Support Technology 2 3 3 0 2 Criminal Justice 3 3 1 2 5 Early Childhood 1 1 1 0 1 Fire Science 2 2 0 3 1 General Business 2 1 0 2 4 General Studies 1 4 4 3 3 Health Studies 10 11 20 13 24 Music 15 12 12 10 16 Teaching Assistant 3 8 8 9 8 Tourism, Sales, & Convention Mgmt. 1 4 2 0 1Total Certificates 43 56 54 46 70
Total Degrees & Certificates 504 502 506 484 571
Bachelor Degrees (BBA in Hospitality Management,
BBA in Business & Technology Management) from Delhi via Delhi/SCCC joint programs
4 3 13 14 21
24 * Non-Destructive Testing graduated one student in 2008
DEGREES/CERTIFICATES AWARDED BYBY PROGRAM OF STUDY: 2006 through 2010

55.2% 55.2% 55.9% 56.4%
51.3%
34 1%36.4%
40%
50%
60%
DEGREES AND CERTIFICATES AWARDED BY PROGRAM TYPE
36.3% 33.7% 33.4% 34.1%
8.5%11.2% 10.7%
9.5%
12.3%
0%
10%
20%
30%
2006 2007 2008 2009 2010
Career Degrees Transfer Degrees Certificates
25
26
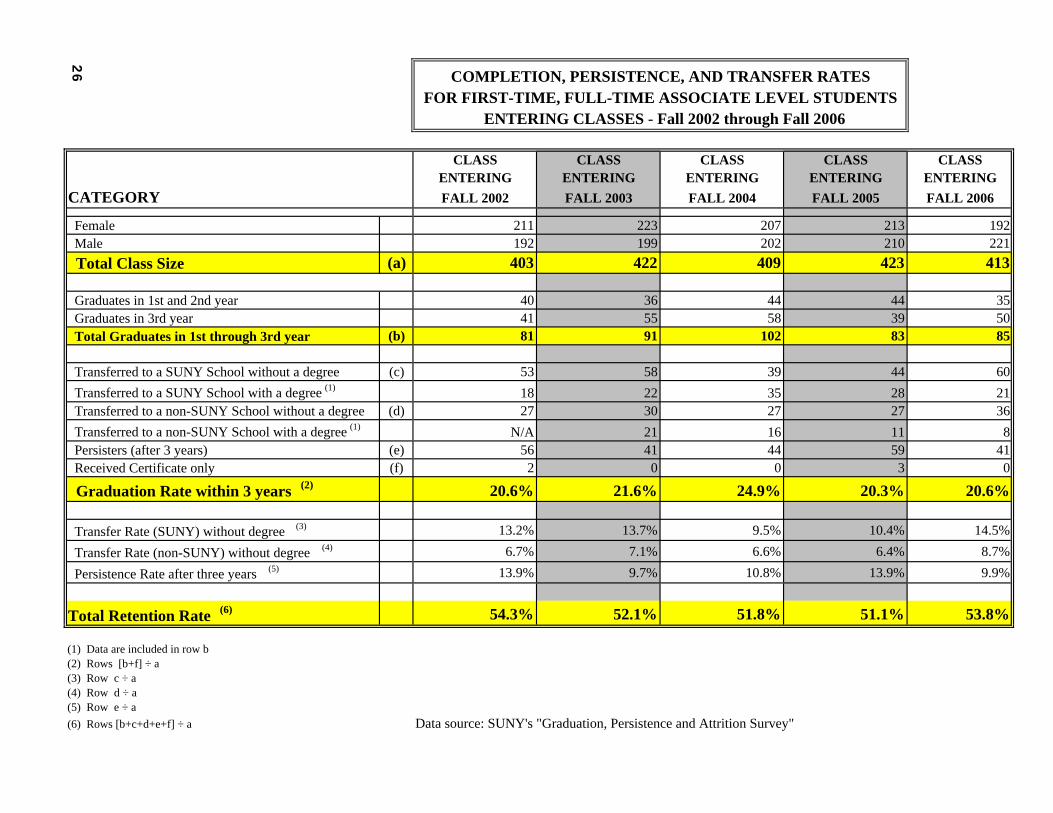
CLASS CLASS CLASS CLASS CLASSENTERING ENTERING ENTERING ENTERING ENTERING
CATEGORY FALL 2002 FALL 2003 FALL 2004 FALL 2005 FALL 2006
Female 211 223 207 213 192 Male 192 199 202 210 221 Total Class Size (a) 403 422 409 423 413
Graduates in 1st and 2nd year 40 36 44 44 35 Graduates in 3rd year 41 55 58 39 50 Total Graduates in 1st through 3rd year (b) 81 91 102 83 85
Transferred to a SUNY School without a degree (c) 53 58 39 44 60 Transferred to a SUNY School with a degree (1) 18 22 35 28 21 Transferred to a non-SUNY School without a degree (d) 27 30 27 27 36 Transferred to a non-SUNY School with a degree (1) N/A 21 16 11 8 Persisters (after 3 years) (e) 56 41 44 59 41 Received Certificate only (f) 2 0 0 3 0
Graduation Rate within 3 years (2) 20.6% 21.6% 24.9% 20.3% 20.6%
Transfer Rate (SUNY) without degree (3) 13.2% 13.7% 9.5% 10.4% 14.5% Transfer Rate (non-SUNY) without degree (4) 6.7% 7.1% 6.6% 6.4% 8.7% Persistence Rate after three years (5) 13.9% 9.7% 10.8% 13.9% 9.9%
Total Retention Rate (6) 54.3% 52.1% 51.8% 51.1% 53.8%
(1) Data are included in row b(2) Rows [b+f] ÷ a(3) Row c ÷ a(4) Row d ÷ a(5) Row e ÷ a(6) Rows [b+c+d+e+f] ÷ a Data source: SUNY's "Graduation, Persistence and Attrition Survey"
COMPLETION, PERSISTENCE, AND TRANSFER RATESFOR FIRST-TIME, FULL-TIME ASSOCIATE LEVEL STUDENTS
ENTERING CLASSES - Fall 2002 through Fall 2006