Grade Six - Session 6 Exploring Probability with the Graphing Calculatormlhartma/6thSession6.pdf ·...
42
Grade Six - Session 6 Exploring Probability with the Graphing Calculator Participant Packet Modules developed by Macomb County Teachers under the leadership of Marie Copeland M athematics – G rade L evel A ssessments an d C ontent E xpectations
Transcript of Grade Six - Session 6 Exploring Probability with the Graphing Calculatormlhartma/6thSession6.pdf ·...

Grade Six - Session 6
Exploring Probability with the Graphing Calculator
Participant Packet
Modules developed by Macomb County Teachers under the leadership of Marie Copeland
Mathematics – Grade Level Assessments and Content Expectations

Developers
M-GLAnCE Project Directors Debbie Ferry Macomb ISD Mathematics Consultant
Carol Nowakowski Retired Mathematics Consultant K-4 Project Coordinator
Marie Copeland Warren Consolidated Macomb MSTC 5-8 Project Coordinator
2004 Project Contributors David Andrews Chippewa Valley Schools
William Ashton Fraser Public Schools
Lynn Bieszki Chippewa Valley Schools
Sharon Chriss Romeo Schools
Kimberly DeShon Anchor Bay School District
Barbara Diliegghio Retired, Math Consultant
Kimberly Dolan Anchor Bay School District
Jodi Giraud L’Anse Creuse Schools
Julie Hessell Romeo Schools
Amy Holloway Clintondale Schools
Barbara Lipinski Anchor Bay School District
Linda Mayle Romeo Schools
Therese Miekstyn Chippewa Valley Schools
James Navetta Chippewa Valley Schools
Gene Ogden Anchor Bay School District
Rebecca Phillion Richmond Comm. Schools
Charlene Pitrucelle Anchor Bay School District
Shirley Starman Van Dyke Public Schools
Ronald Studley Anchor Bay School District
2005 and 2006 Session/Module Developers Carol Nowakowski Retired, Math Consultant
Deb Barnett Lake Shore Public Schools
Luann Murray Genesee ISD
Kathy Albrecht Retired, Math Consultant
Jo-Anne Schimmelpfenneg Retired, Math Consultant
Marie Copeland Warren Consolidated
Terri Faitel Trenton Public Schools
Debbie Ferry Macomb ISD

M-GLAnCE – Grade 6 Session 6 – Exploring Probability with the Graphing Calculator – Participant Packet Page 1 Revised 10.15.07
INSTRUCTIONAL SEQUENCES
Grade 6 – Session #6 Exploring Probability with the Graphing Calculator D.PR.06.01 D.PR.06.02
Express probabilities as fractions, decimals, or percentages between 0 and 1; know that 0 probability means an event will not occur and that probability 1 means an event will occur.
Compute probabilities of events from simple experiments with equally likely outcomes, e.g., tossing dice, flipping coins, spinning spinners, by listing all possibilities and finding the fraction that meets given conditions.
Fractions
Probability With Simple Events
Decimals
Experimental/EmpiricalTheoretical
Percents
M-GLAnCE – Grade 6 Session 6 – Exploring Probability with the Graphing Calculator – Participant Packet Page 2 Revised 10.15.07
SIXTH GRADE SESSION SIX – IMPORTANT TIPS
• In order to help students understand the distinction between theoretical probability and
experimental probability, engage the students in actual experiments. The experiments
emphasize the concept of the Law of large Numbers. The larger the number of trials of their
experiment, the closer the two sets of values become.
• It is beneficial to the students if they make bar graphs as well as tables of their results from
the probability experiments. This will provide a visual analysis of their results. It would be a
good time to introduce the Texas Instruments application Prob Sim. This application will let
the students go between the table and bar graph with ease.
• When you are having students collect data using dice, for example, ask them what was the
frequency of getting a one, then ask the students what was the relative frequency of getting a
one. Use both terms to help them distinguish the difference.
• In addition to using tangible items with students such as spinners, dice, etc., also use the
application Prob Sim on the TI83 Plus, TI84, or TI84 Plus graphing calculators.
• Keep reinforcing the fact that probability is a value between 0 and 1 inclusive. A probability
of 0 would mean the event is impossible. A probability of 1 would mean the event is a
certainty. Making a number line from 0 to 1 helps visually make this connection. Whenever
the students determine the empirical probability or the theoretical probability, have them put
it on the number line using two different colored pencils.
• Have students make a graphic organizer to help them remember all the probability terms.
• If you have students set up a line graph for probability, number the y-axis by a scale of .05,
from 0 to 1. You will be able to spot the student having difficulties with some basic decimal
comparisons.

M-GLAnCE – Grade 6 Session 6 – Exploring Probability with the Graphing Calculator – Participant Packet Page 3 Revised 10.15.07
SIXTH GRADE SESSION SIX – COMMON MISCONCEPTIONS
• Students confuse the terms: experimental probability, empirical probability and relative
frequency. Empirical probability is determined by conducting an experiment or simulation to
collect data. It is also referred to as experimental probability. The relative frequency of, for
example, the number of heads for 50 tosses of a coin (obtained experimentally) will vary
from student to student. The relative frequency is the estimated probability of observing a
head.
• Students think if they roll some dice 50 times that 50 is a large number of trials.
• Students confuse frequency and relative frequency.
• It is essential to constantly bring out the fact that probability is a value between 0 and 1
inclusive. As some students convert their fraction probability to a decimal, if they make a
mistake in converting and their decimal is greater than 1, some students do not see this as a
problem.

M-GLAnCE – Grade 6 Session 6 – Exploring Probability with the Graphing Calculator – Participant Packet Page 4 Revised 10.15.07
Adapted from Texas Instruments Investigations with Prob Sim Written by Judy Wheeler and Jane Damaske
LAW OF LARGE NUMBERS EQUAL OPPORTUNITIES
How many rolls of a fair, six-sided die do you think it would take so that each face turns up the same
number of times? Do you think if you rolled the die six times that each face would come up exactly
once? If you rolled the die twelve times, would each face come up twice? Or do you think you
would need to roll the die many more times than that, say 6, 36, 408, 1020 times?
In this activity, you conduct probability experiments that involve tossing a fair die. By graphing the
experimental results obtained each time, you can compare the experimental probability of each
outcome to its theoretical probability and see how the Law of Large Numbers affects the results.
Problem
How many times would you have to roll a fair, six-sided die so that the frequencies of the six
outcomes are equal (or nearly equal)? In other words, how large is “large” in the Law of Large
Numbers?
Theoretical Probability: Theoretical probability is determined by logical reasoning which might
use a formula or a representation such as an area model, a tree diagram, or an organized list.
Empirical Probability: Empirical probability is determined by conducting an experiment or
simulation to collect data. It is often referred to as experimental probability.

M-GLAnCE – Grade 6 Session 6 – Exploring Probability with the Graphing Calculator – Participant Packet Page 5 Revised 10.15.07
Part A: Practice Exploration – Getting to Know the Prob Sim
1.) Press APPS, select Prob Sim, and then press any key to display the Simulation menu.
2.) Select 2:Roll Dice. Press Enter.
3.) Select ROLL. Roll is above the window key on the
calculator. The animation shows the rolling of a die and the
results of the roll. A bar appears above the number rolled on
the corresponding bar graph.
4.) The height of the bar indicates its’ frequency, which,
in this case, is equal to 1. Use the right and left arrow
keys to see the frequency. With the one roll, the single
bar will have a frequency of 1, which the remaining 5
empty spaces will have a frequency of 0.
Notice the options that appear at the bottom of the screen. You can select + 1, + 10, or + 50
to continue to roll one, 10, or 50 rolls at a time.
5.) Press Clear to clear the first roll. Clear is above the graph key on the calculator.
6.) Select Yes to confirm that you want to clear the first roll. Yes is above the Y= key on the
calculator.

M-GLAnCE – Grade 6 Session 6 – Exploring Probability with the Graphing Calculator – Participant Packet Page 6 Revised 10.15.07
7.) Select + 10 to roll the die ten ties. + 10 is above
the Zoom key on the calculator. The experimental
results appear on the bar graph. When you roll multiples
of 10 and 50, a counter appears briefly to show the total
number of rolls represented by the bar on the graph.
8.) Press the right and left arrow keys to highlight each bar to see the frequency of each
outcome.
9.) After you have practiced rolling the die and viewing the results, clear the screen to continue
by pressing ESC two times. ESC is above the Y=key on the calculator. Then select YES
which is also above the Y= calculator key. This will return you to the Simulation menu.
Part B: Beginning the Actual Experiment: First Rolls of the Die
1.) Select Roll Dice and Enter to begin a new group or rolls.
2.) Select Roll and then select + 1, to roll the die by ones until you have rolled it six times!
Record your data in the table.
Are the bars on the bar graph the same height after 6 rolls?
YES OR NO
3.) Select +10 to roll the die in sets of 10 until you have rolled the die a total of 36 times. Six
original rolls plus 3 sets of 10 = 36. Record your data in the table.
Are the bars on the bar graph the same height after 36 rolls?
YES OR NO

M-GLAnCE – Grade 6 Session 6 – Exploring Probability with the Graphing Calculator – Participant Packet Page 7 Revised 10.15.07
4.) Sketch your graph after 36 rolls.
654321
5.) Compare your graph to those of your classmates. How do the graphs compare?
Part C: MORE ROLLS OF THE DIE
Your graphing calculator should still display the bar graph showing the results of rolling
a fair die 36 times. In this new investigation, you set the number of trials from memory.
1.) Select ESC twice, and then select YES to return to the Simulation menu.
2.) Select 2: Roll Dice and Enter.
3.) Select SET which is above the calculator key, Zoom.
Change the settings as shown. Press ENTER
after each change and/or use the down arrow.
4.) Select OK which is above the calculator key, GRAPH.

M-GLAnCE – Grade 6 Session 6 – Exploring Probability with the Graphing Calculator – Participant Packet Page 8 Revised 10.15.07
5.) Select ROLL which is above the calculator key, WINDOW. The die is rolled 204 times,
and the corresponding bar graph is created. Notice that 204 is a multiple of 6, which allows
the graph to have even bars. Select ROLL again for another 204 rolls or a total of 408 times.
Record your results in the table.
6.) Continue this process until you have rolled the die 1, 020 times. Record your results in the
table.
Part D: Analyzing the Results
1.) Examine your relative frequencies for rolling the numbers one through six, from 6 rolls to
1,020 rolls. How closely do your experimental (empirical) and theoretical probabilities agree
in this model?
2.) While you rolled the die 1,020 times, all of your classmates also rolled a die 1,020 times.
Combining the results from all students’ experiments gives a much larger number of trials
(for example, 30 students • 1,020 trials). Record the results of the experiments from all of
your classmates in the table.

M-GLAnCE – Grade 6 Session 6 – Exploring Probability with the Graphing Calculator – Participant Packet Page 9 Revised 10.15.07
CLASS RESULTS FOR EACH STUDENT’S DATA FROM 1,020 ROLLS OF THE DIE
Name 1 2 3 4 5 6

M-GLAnCE – Grade 6 Session 6 – Exploring Probability with the Graphing Calculator – Participant Packet Page 10 Revised 10.15.07
3.) Quit the Probability Simulation App if it is still running.
To quit the App, select ESC which is above the
key.
4.) Select YES which is above the key.
5.) Select QUIT, and then select YES. This will take you back to the home screen.
6.) Clear the lists by pressing
Select 4:ClrAllLists
7.) Press
8.) Press
M-GLAnCE – Grade 6 Session 6 – Exploring Probability with the Graphing Calculator – Participant Packet Page 11 Revised 10.15.07
9.) Select 1: Edit and press ENTER. Enter the data from your classmates in L1 to L6
respectively.
10.) Press 2nd Quit (Mode) to go to the Home Screen.
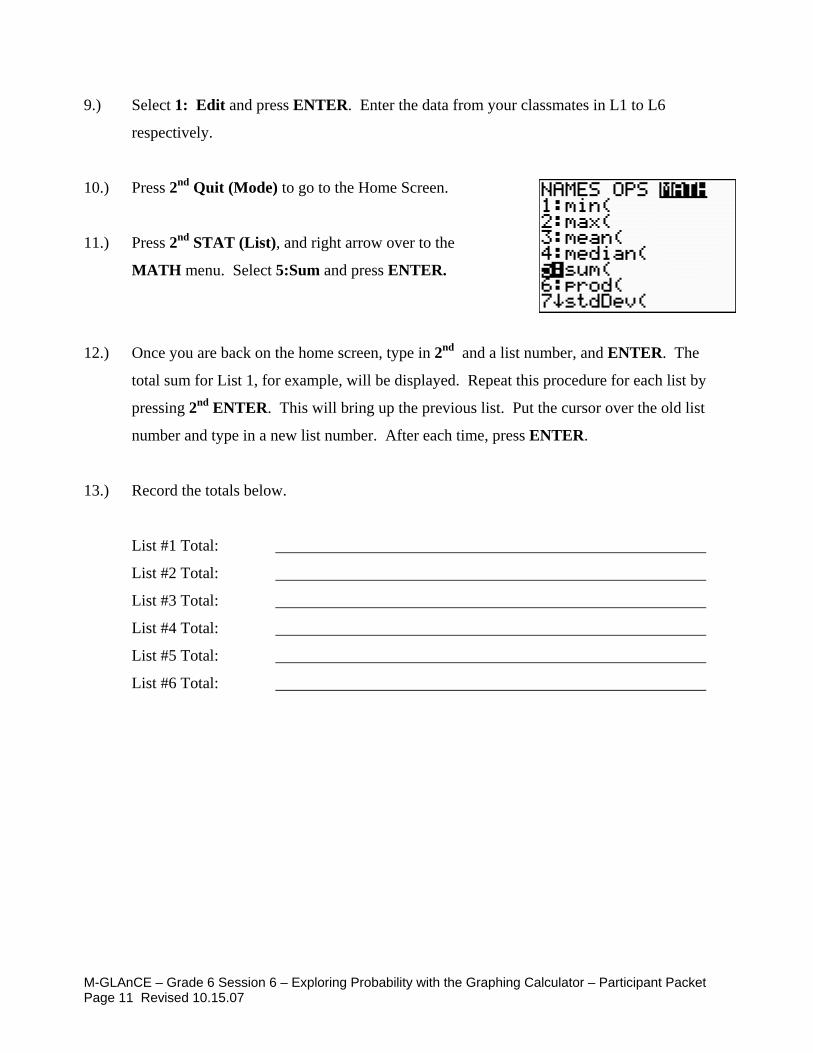
11.) Press 2nd STAT (List), and right arrow over to the
MATH menu. Select 5:Sum and press ENTER.
12.) Once you are back on the home screen, type in 2nd and a list number, and ENTER. The
total sum for List 1, for example, will be displayed. Repeat this procedure for each list by
pressing 2nd ENTER. This will bring up the previous list. Put the cursor over the old list
number and type in a new list number. After each time, press ENTER.
13.) Record the totals below.
List #1 Total:
List #2 Total:
List #3 Total:
List #4 Total:
List #5 Total:
List #6 Total:
M-GLAnCE – Grade 6 Session 6 – Exploring Probability with the Graphing Calculator – Participant Packet Page 12 Revised 10.15.07
14.) Use the cumulative class data to calculate the experimental (empirical) probability for each
of the six possible outcomes on the die.
Empirical Probability for 1:
Empirical Probability for 2:
Empirical Probability for 3:
Empirical Probability for 4:
Empirical Probability for 5:
Empirical Probability for 6:
15.) How do these experimental probabilities compare with the theoretical probabilities?
16.) Now that you have explored the concept of the law of large numbers as it relates to an actual
situation, give an explanation of what the law of large numbers means to you.

M-GLAnCE – Grade 6 Session 6 – Exploring Probability with the Graphing Calculator – Participant Packet Page 13 Revised 10.15.07
EMPIRICAL PROBABILITY
OF ROLLING A FAIR SIX-SIDED DIE
Number on Die
1
2
3
4
5
6
Frequency
6
Rolls of
the Die
Relative
Frequency
Frequency
36
Rolls of
the Die
Relative
Frequency
Frequency
408 Rolls
of the
Die
Relative
Frequency
Frequency
1,020
Rolls of
the Die
Relative
Frequency
Theoretical
Probability

M-GLAnCE – Grade 6 Session 6 – Exploring Probability with the Graphing Calculator – Participant Packet Page 14 Revised 10.15.07
GROUPING DATA
Press Group is highlighted, press Select 1:Create New, press Give your data a name you will remember in order to retrieve it at a later time. Notice the Alpha key is activated so you just need to spell out your name for your group. Press

M-GLAnCE – Grade 6 Session 6 – Exploring Probability with the Graphing Calculator – Participant Packet Page 15 Revised 10.15.07
Choose List Press Select the lists where you have data you want to save and press Use the right arrow to go to DONE Press

M-GLAnCE – Grade 6 Session 6 – Exploring Probability with the Graphing Calculator – Participant Packet Page 16 Revised 10.15.07
Now let’s check to see if your data is saved. We will do the ultimate test. We will delete all the data from the lists. Press Go down to 4:ClrAllLists Press
UNGROUPING DATA
Let’s retrieve your data. Press Press
M-GLAnCE – Grade 6 Session 6 – Exploring Probability with the Graphing Calculator – Participant Packet Page 17 Revised 10.15.07
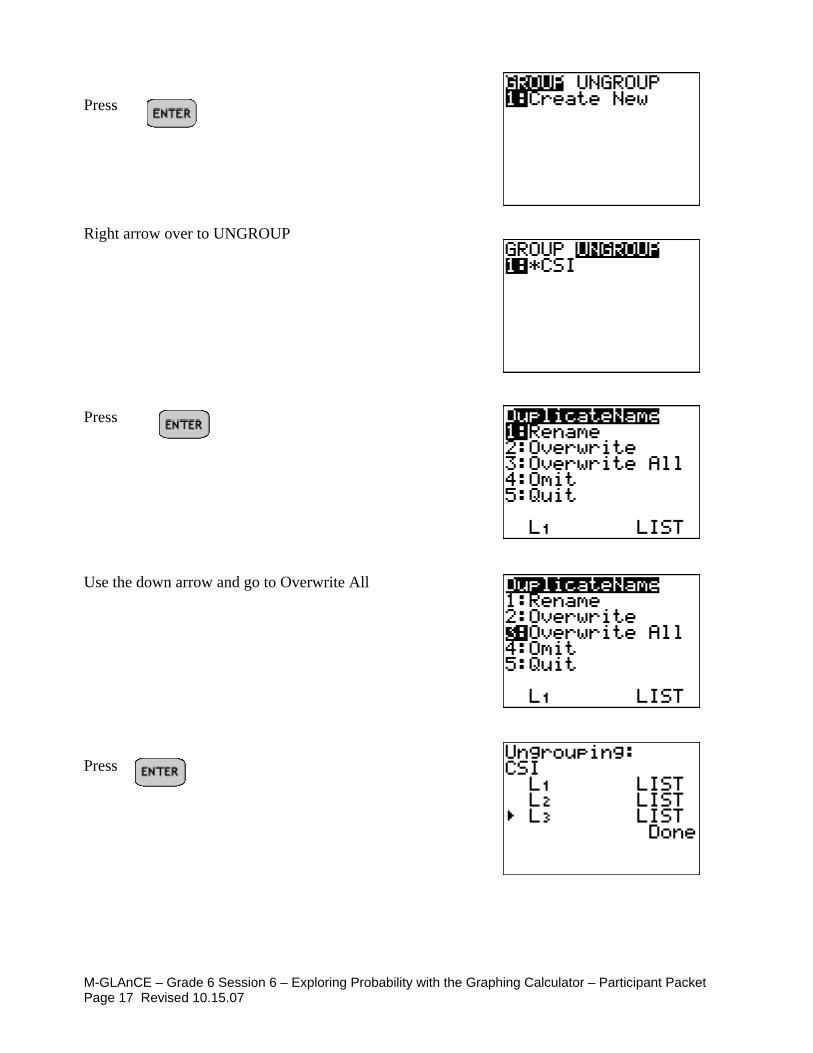
Press Right arrow over to UNGROUP Press Use the down arrow and go to Overwrite All Press

M-GLAnCE – Grade 6 Session 6 – Exploring Probability with the Graphing Calculator – Participant Packet Page 18 Revised 10.15.07
Now let’s check if your data is back in your lists! Press Edit is highlighted, so press All the data is back, even though you cleared all the lists!
DELETING A GROUP
Suppose you no longer wish to save the data. Press
Arrow down to 2:Mem Mgmt/Del

M-GLAnCE – Grade 6 Session 6 – Exploring Probability with the Graphing Calculator – Participant Packet Page 19 Revised 10.15.07
Press Press Press Press Arrow down to Yes

M-GLAnCE – Grade 6 Session 6 – Exploring Probability with the Graphing Calculator – Participant Packet Page 20 Revised 10.15.07
Press As you can see, these series of steps eliminated the CSI group.
M-GLAnCE – Grade 6 Session 6 – Exploring Probability with the Graphing Calculator – Participant Packet Page 21 Revised 10.15.07
Adapted from Texas Instruments Exploring Mathematics with the Probability Simulation Application by Jane E. Damaske and Judy Wheeler
COIN TOSS – PROBABILITY SIMULATION
If you toss a coin, it lands either heads up or tails up. If you toss that coin a second time, it once
again lands either heads or tails up. Each time you toss the coin, the chances of it landing heads up
is 1 out of 2. No outcome is affected by the outcome preceding it. That is, each toss is an
independent event.
If you look at the pattern of a series of coin tosses, you can determine the relative frequency of the
coin landing heads up by comparing the number of times the coin lands heads up to the total number
of times the coin is tossed. The Law of Large Numbers suggests that the relative frequency of heads
landing up gets closer to the theoretical probability of heads landing up as the number of tosses
increases.
Problem:
If you tossed a fair coin a large number of times, how many times would the coin land heads up?
Theoretically, the probability would be 12
because there are two possible outcomes. Will the
relative frequency of heads landing up match the theoretical probability of heads landing up?
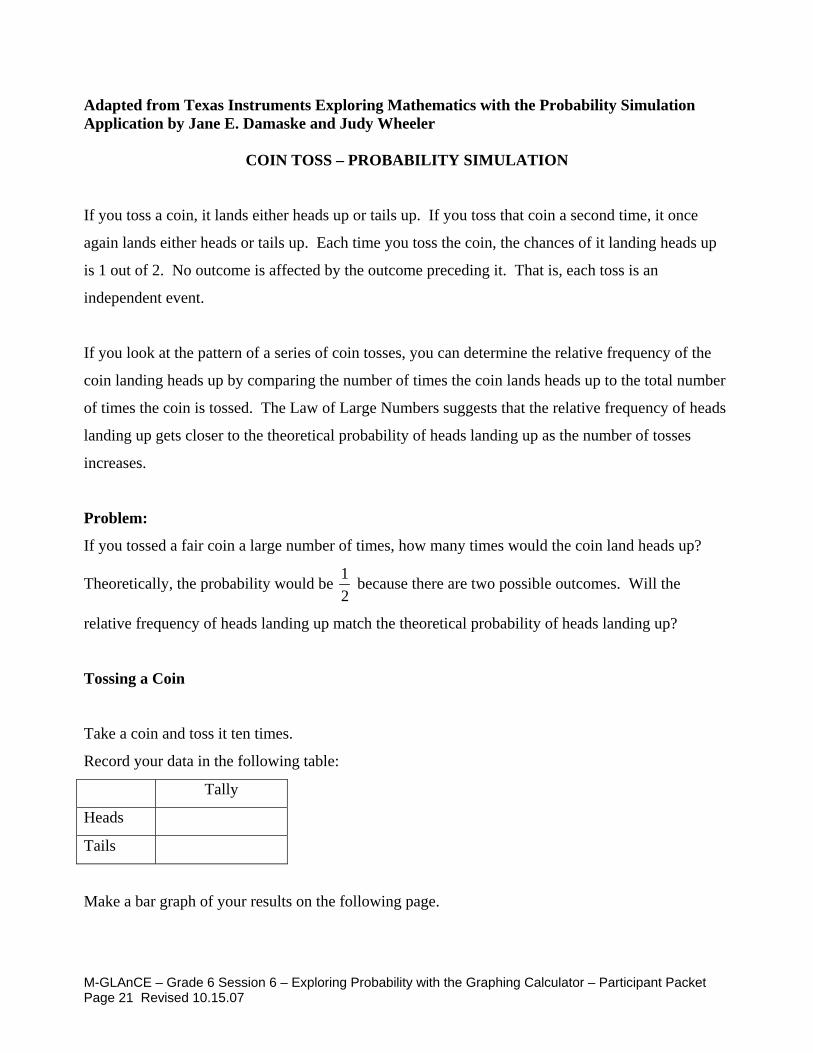
Tossing a Coin
Take a coin and toss it ten times.
Record your data in the following table:
Tally
Heads
Tails
Make a bar graph of your results on the following page.

M-GLAnCE – Grade 6 Session 6 – Exploring Probability with the Graphing Calculator – Participant Packet Page 22 Revised 10.15.07
HT
Tossing a Coin Using ProbSim
1.) Press
Scroll down to the ProbSim Application.
2.) Open the ProbSim Application by
pressing
M-GLAnCE – Grade 6 Session 6 – Exploring Probability with the Graphing Calculator – Participant Packet Page 23 Revised 10.15.07
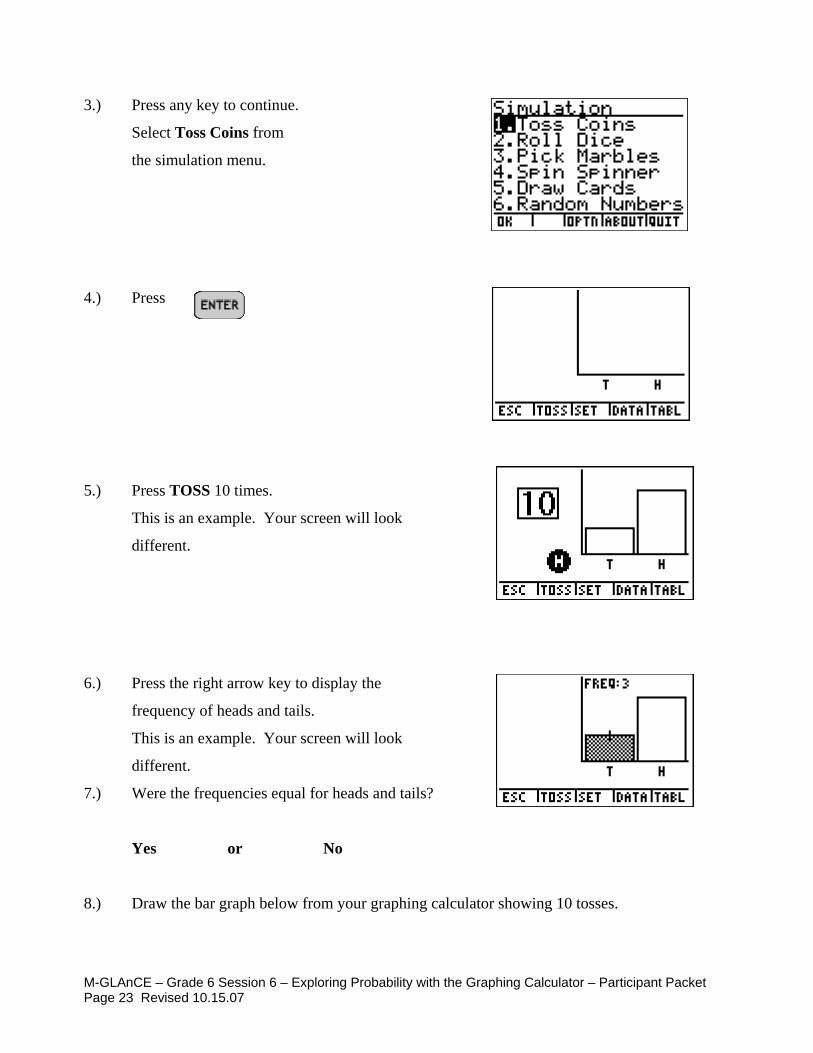
3.) Press any key to continue.
Select Toss Coins from
the simulation menu.
4.) Press
5.) Press TOSS 10 times.
This is an example. Your screen will look
different.
6.) Press the right arrow key to display the
frequency of heads and tails.
This is an example. Your screen will look
different.
7.) Were the frequencies equal for heads and tails?
Yes or No
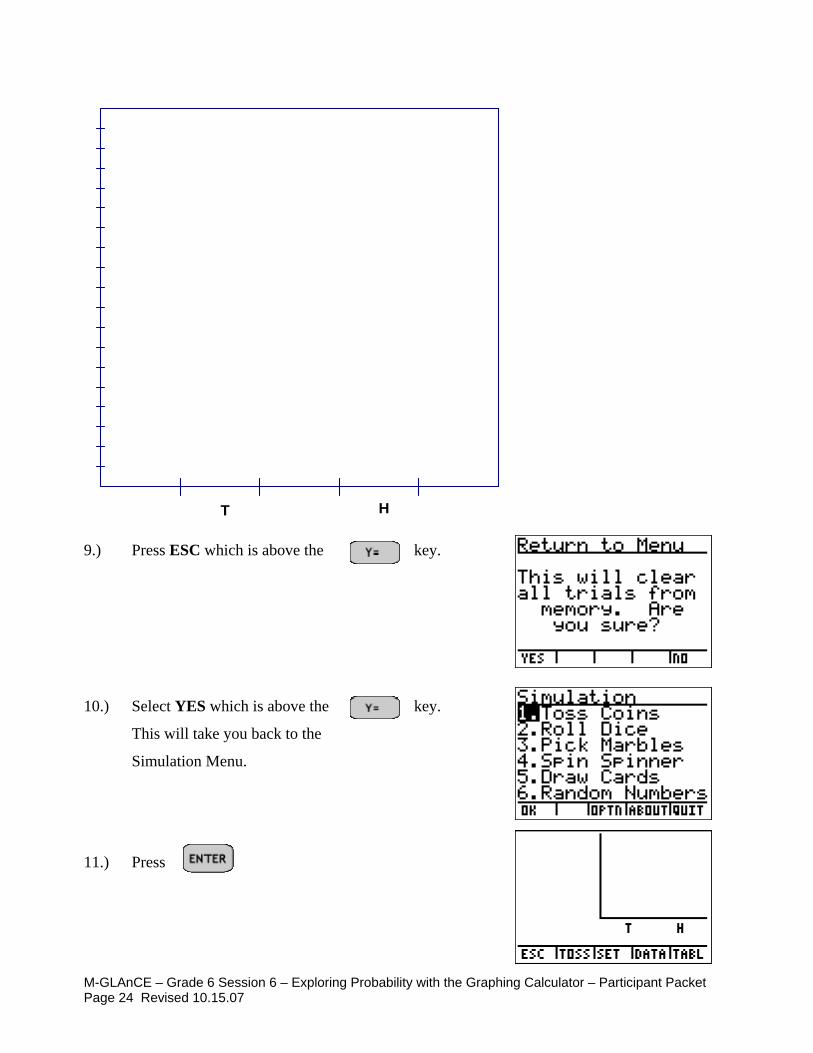
8.) Draw the bar graph below from your graphing calculator showing 10 tosses.
M-GLAnCE – Grade 6 Session 6 – Exploring Probability with the Graphing Calculator – Participant Packet Page 24 Revised 10.15.07
HT
9.) Press ESC which is above the key.
10.) Select YES which is above the key.
This will take you back to the
Simulation Menu.
11.) Press

M-GLAnCE – Grade 6 Session 6 – Exploring Probability with the Graphing Calculator – Participant Packet Page 25 Revised 10.15.07
12.) Select SET which is above the Zoom key.
Change the settings as shown.
13.) Select OK which is above the Graph key.
14.) Select Toss which is above the Window key.
The Probability Simulation Application will
toss the coin 25 times and create a bar graph
of the total number of tosses and the frequency
of heads and tails.
This is an example. Your screen will look
different.
15.) To see how many times the coin
landed heads up, press the right and
left arrow keys,
This is an example. Your screen will look
different.
16.) Were the frequencies equal for heads and tails?
Yes or No

M-GLAnCE – Grade 6 Session 6 – Exploring Probability with the Graphing Calculator – Participant Packet Page 26 Revised 10.15.07
17.) Draw the bar graph below from your graphing calculator showing 25 tosses.
HT
18.) Press ESC which is above the key.
19.) Press YES which is above the key
This brings you back to the Simulation Menu.

M-GLAnCE – Grade 6 Session 6 – Exploring Probability with the Graphing Calculator – Participant Packet Page 27 Revised 10.15.07
20.) Press
21.) Select SET which is above the Zoom key.
Change the settings as shown.
22.) Select OK which is above the Graph key.
23.) Select Toss which is above the Window key.
The Probability Simulation Application will
toss the coin 100 times and create a bar graph
of the total number of tosses and the frequency
of heads and tails. This is an example. Your screen will
look different.
24.) To see how many times the coin landed heads up, press the right and left arrow keys.
25.) Were the frequencies equal for heads and tails? Yes or No
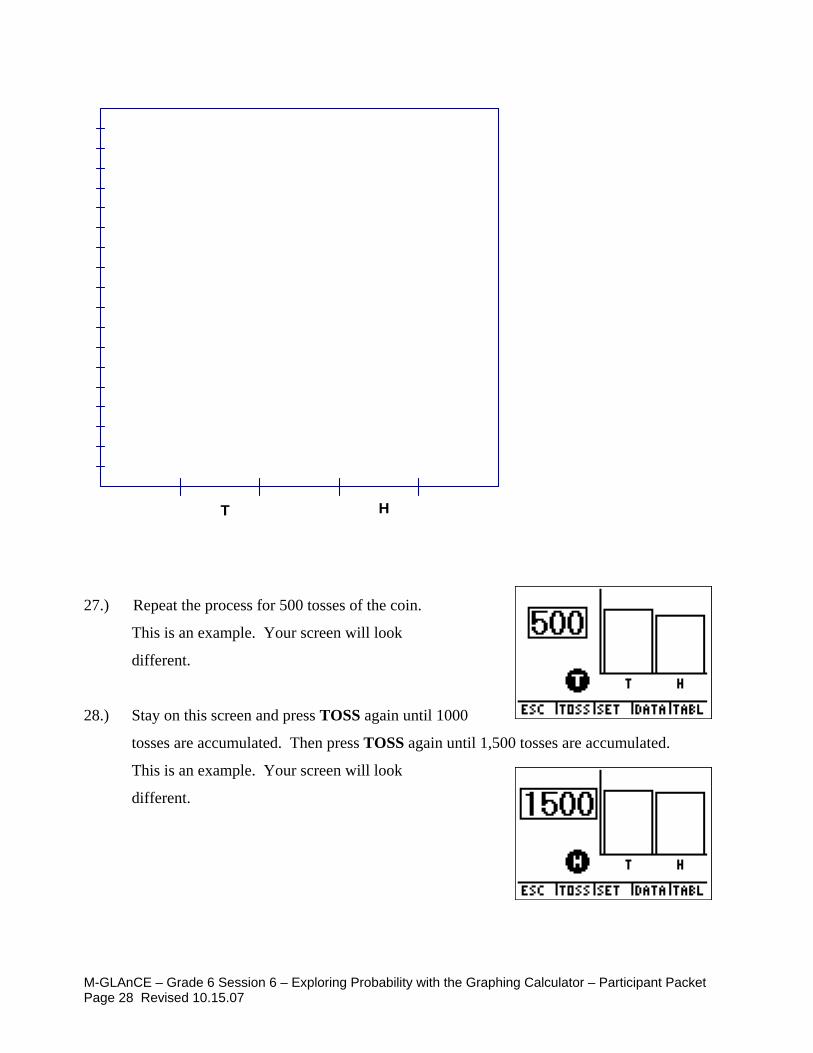
26.) Draw the bar graph below from your graphing calculator showing 100 tosses.
M-GLAnCE – Grade 6 Session 6 – Exploring Probability with the Graphing Calculator – Participant Packet Page 28 Revised 10.15.07
HT
27.) Repeat the process for 500 tosses of the coin.
This is an example. Your screen will look
different.
28.) Stay on this screen and press TOSS again until 1000
tosses are accumulated. Then press TOSS again until 1,500 tosses are accumulated.
This is an example. Your screen will look
different.
M-GLAnCE – Grade 6 Session 6 – Exploring Probability with the Graphing Calculator – Participant Packet Page 29 Revised 10.15.07
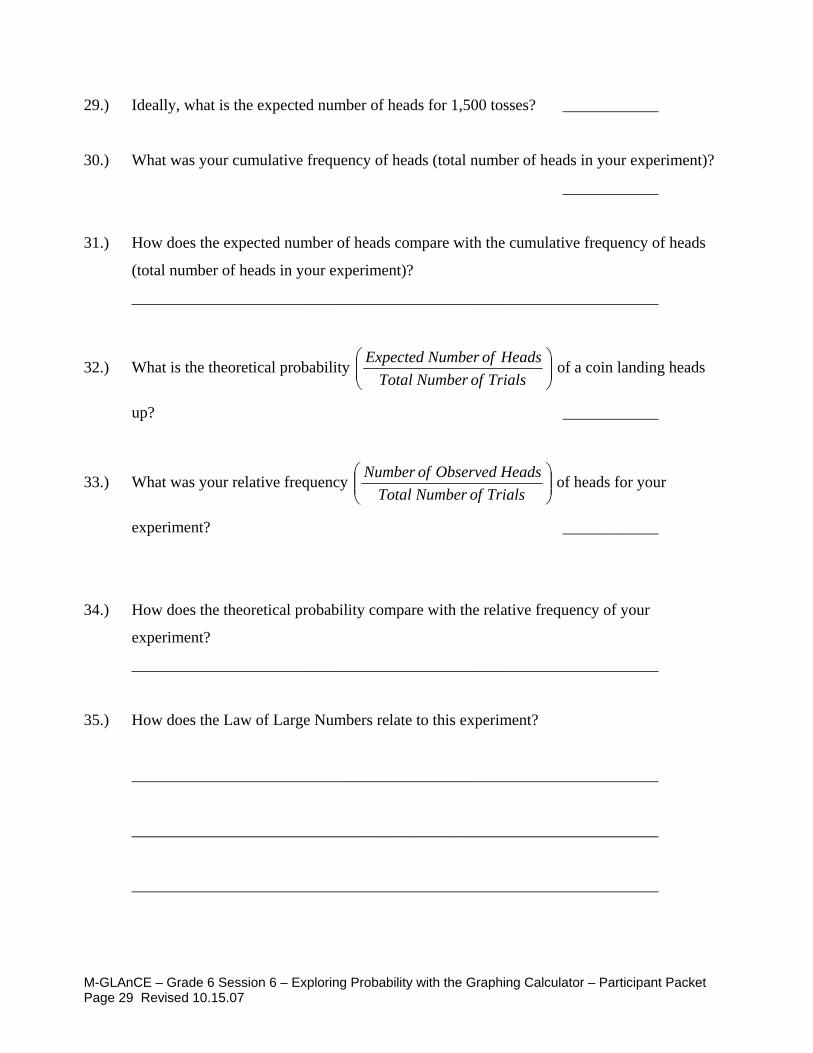
29.) Ideally, what is the expected number of heads for 1,500 tosses? ____________
30.) What was your cumulative frequency of heads (total number of heads in your experiment)?
____________
31.) How does the expected number of heads compare with the cumulative frequency of heads
(total number of heads in your experiment)?
__________________________________________________________________
32.) What is the theoretical probability ⎟⎟⎠
⎞⎜⎜⎝
⎛TrialsofNumberTotal
HeadsofNumberExpected of a coin landing heads
up? ____________
33.) What was your relative frequency ⎟⎟⎠
⎞⎜⎜⎝
⎛TrialsofNumberTotal
HeadsObservedofNumber of heads for your
experiment? ____________
34.) How does the theoretical probability compare with the relative frequency of your
experiment?
__________________________________________________________________
35.) How does the Law of Large Numbers relate to this experiment?
__________________________________________________________________
__________________________________________________________________
__________________________________________________________________

M-GLAnCE – Grade 6 Session 6 – Exploring Probability with the Graphing Calculator – Participant Packet Page 30 Revised 10.15.07
SIMPLE EXPERIMENT WITH COLOR TILES
Each brown paper bag will contain 10 color tiles:
2 Yellow
5 Red
3 Blue
This experiment is called a simple experiment because each trial consists of a single event.
The single event will be pulling one color tile out of the paper bag, recording the color, and
replacing the color tile back into the paper bag.
Before conducting any trials of this experiment, determine the theoretical probability of each color tile. How many total color tiles are in the paper bag? __________
How many of the color tiles are yellow? __________
What is the theoretical probability of drawing a yellow color tile? __________
How many of the color tiles are red? __________
What is the theoretical probability of drawing a red color tile? __________
How many of the color tiles are blue? __________
What is the theoretical probability of drawing a blue color tile? __________
Directions for Simple Experiment:
1.) Perform 30 trials of this simple experiment.
2.) Record your color tile results in the table that follows.
3.) Determine the cumulative frequency of drawing a red tile.
4.) Determine the relative frequency of drawing a red tile in fraction form.
5.) Determine the relative frequency of drawing a red tile in decimal form.
6.) Make a line graph of your results of the simple experiment.
7.) Use a colored pencil to mark the theoretical probability line.

M-GLAnCE – Grade 6 Session 6 – Exploring Probability with the Graphing Calculator – Participant Packet Page 31 Revised 10.15.07
EMPIRICAL (EXPERIMENTAL) PROBABILITY OF DRAWING A RED TILE
Result of Tile Draw
Cumulative Frequency of
Drawing a Red Tile
Relative Frequency of
Drawing a Red Tile
(Fraction Form)
Relative Frequency of
Drawing a Red Tile
(Decimal Form) Round to the Hundredths
Place

M-GLAnCE – Grade 6 Session 6 – Exploring Probability with the Graphing Calculator – Participant Packet Page 32 Revised 10.15.07
Result of Tile Draw
Cumulative Frequency of
Drawing a Red Tile
Relative Frequency of
Drawing a Red Tile
(Fraction Form)
Relative Frequency of
Drawing a Red Tile
(Decimal Form) Round to the Hundredths
Place
After 30 trials, what was your cumulative frequency of drawing a red tile?
After 30 trials, what was your relative frequency of drawing a red tile?
How does the theoretical probability of drawing a red tile compare with your relative
frequency of drawing a red tile?
How does the Law of Large Numbers relate to this experiment?

M-GLAnCE – Grade 6 Session 6 – Exploring Probability with the Graphing Calculator – Participant Packet Page 33 Revised 10.15.07
Make a line graph of your data below.
M-GLAnCE – Grade 6 Session 6 – Exploring Probability with the Graphing Calculator – Participant Packet Page 34 Revised 10.15.07
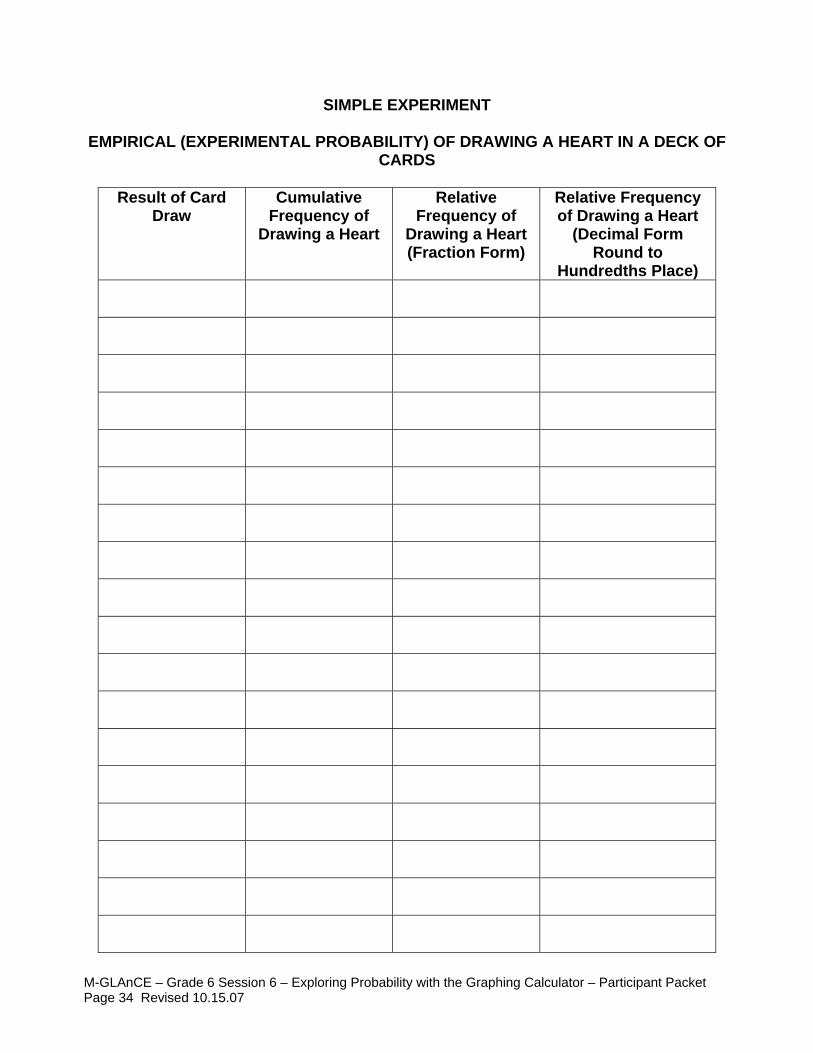
SIMPLE EXPERIMENT
EMPIRICAL (EXPERIMENTAL PROBABILITY) OF DRAWING A HEART IN A DECK OF CARDS
Result of Card
Draw Cumulative
Frequency of Drawing a Heart
Relative Frequency of
Drawing a Heart (Fraction Form)
Relative Frequency of Drawing a Heart
(Decimal Form Round to
Hundredths Place)

M-GLAnCE – Grade 6 Session 6 – Exploring Probability with the Graphing Calculator – Participant Packet Page 35 Revised 10.15.07
Result of Card
Draw Cumulative
Frequency of Drawing a Heart
Relative Frequency of
Drawing a Heart (Fraction Form)
Relative Frequency of Drawing a Heart
(Decimal Form Round to
Hundredths Place)
How many cards are in a standard deck of playing cards? How many suits are in a standard deck of playing cards? How many cards are in each suit in a standard deck of playing cards? What is the theoretical probability of drawing a heart from a standard deck of playing cards? a spade or a club? Is this a simple experiment? If so, why?

M-GLAnCE – Grade 6 Session 6 – Exploring Probability with the Graphing Calculator – Participant Packet Page 36 Revised 10.15.07
Make a line graph of your data below.
M-GLAnCE – Grade 6 Session 6 – Exploring Probability with the Graphing Calculator – Participant Packet Page 37 Revised 10.15.07
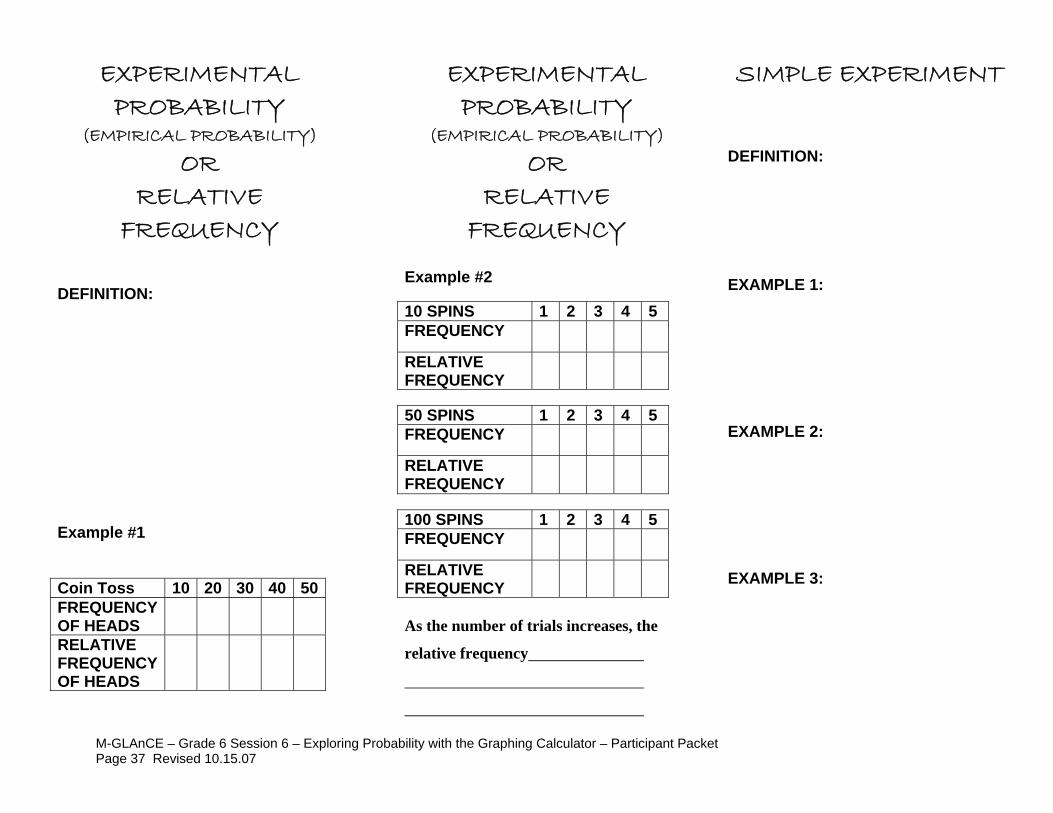
EXPERIMENTAL PROBABILITY
(EMPIRICAL PROBABILITY) OR
RELATIVE FREQUENCY
DEFINITION: Example #1 Coin Toss 10 20 30 40 50 FREQUENCY OF HEADS RELATIVE FREQUENCY OF HEADS
EXPERIMENTAL PROBABILITY
(EMPIRICAL PROBABILITY) OR
RELATIVE FREQUENCY
Example #2 10 SPINS 1 2 3 4 5 FREQUENCY RELATIVE FREQUENCY 50 SPINS 1 2 3 4 5 FREQUENCY RELATIVE FREQUENCY 100 SPINS 1 2 3 4 5 FREQUENCY RELATIVE FREQUENCY As the number of trials increases, the
relative frequency
SIMPLE EXPERIMENT DEFINITION: EXAMPLE 1: EXAMPLE 2: EXAMPLE 3:

M-GLAnCE – Grade 6 Session 6 – Exploring Probability with the Graphing Calculator – Participant Packet Page 38 Revised 10.15.07
Grade 6: Facilitator Presentation – Exploring Probability with the Graphing Calculator – Session 6
LAW OF LARGE NUMBERS
THEORETICAL PROBABILITY
DEFINITION: Example #1 – Spinner – 5 equal sections
1 2 3 4 5
Theoretical Probability Example #2
Heads Tails
TheoreticalProbability
M-GLAnCE – Grade 6 Session 6 – Exploring Probability with the Graphing Calculator – Participant Packet Page 39 Revised 10.15.07
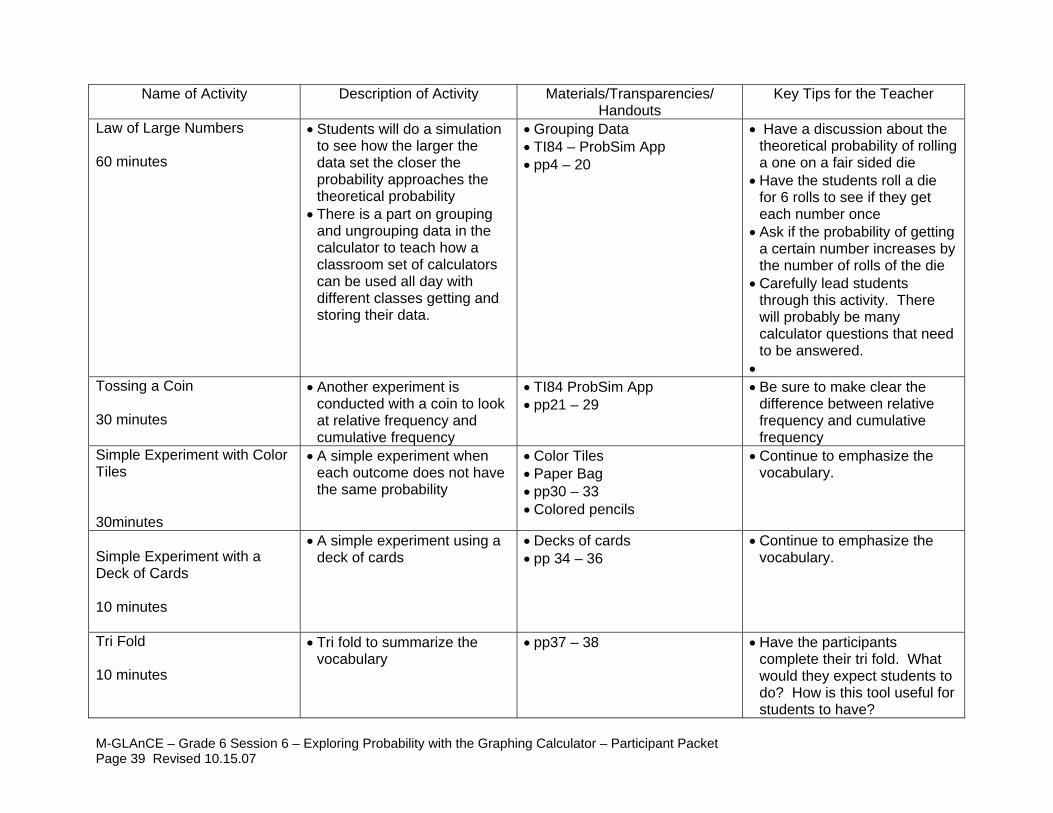
Name of Activity Description of Activity Materials/Transparencies/ Handouts
Key Tips for the Teacher
Law of Large Numbers 60 minutes
• Students will do a simulation to see how the larger the data set the closer the probability approaches the theoretical probability
• There is a part on grouping and ungrouping data in the calculator to teach how a classroom set of calculators can be used all day with different classes getting and storing their data.
• Grouping Data • TI84 – ProbSim App • pp4 – 20
• Have a discussion about the theoretical probability of rolling a one on a fair sided die
• Have the students roll a die for 6 rolls to see if they get each number once
• Ask if the probability of getting a certain number increases by the number of rolls of the die
• Carefully lead students through this activity. There will probably be many calculator questions that need to be answered.
• Tossing a Coin 30 minutes
• Another experiment is conducted with a coin to look at relative frequency and cumulative frequency
• TI84 ProbSim App • pp21 – 29
• Be sure to make clear the difference between relative frequency and cumulative frequency
Simple Experiment with Color Tiles 30minutes
• A simple experiment when each outcome does not have the same probability
• Color Tiles • Paper Bag • pp30 – 33 • Colored pencils
• Continue to emphasize the vocabulary.
Simple Experiment with a Deck of Cards 10 minutes
• A simple experiment using a deck of cards
• Decks of cards • pp 34 – 36
• Continue to emphasize the vocabulary.
Tri Fold 10 minutes
• Tri fold to summarize the vocabulary
• pp37 – 38 • Have the participants complete their tri fold. What would they expect students to do? How is this tool useful for students to have?

M-GLAnCE – Grade 6 Session 6 – Exploring Probability with the Graphing Calculator – Participant Packet Page 40 Revised 10.15.07