Godrej Agrovet Limited - HDFC securities Agrovet Limited IPO Note... · Godrej Agrovet Ltd (GAL) is...
17
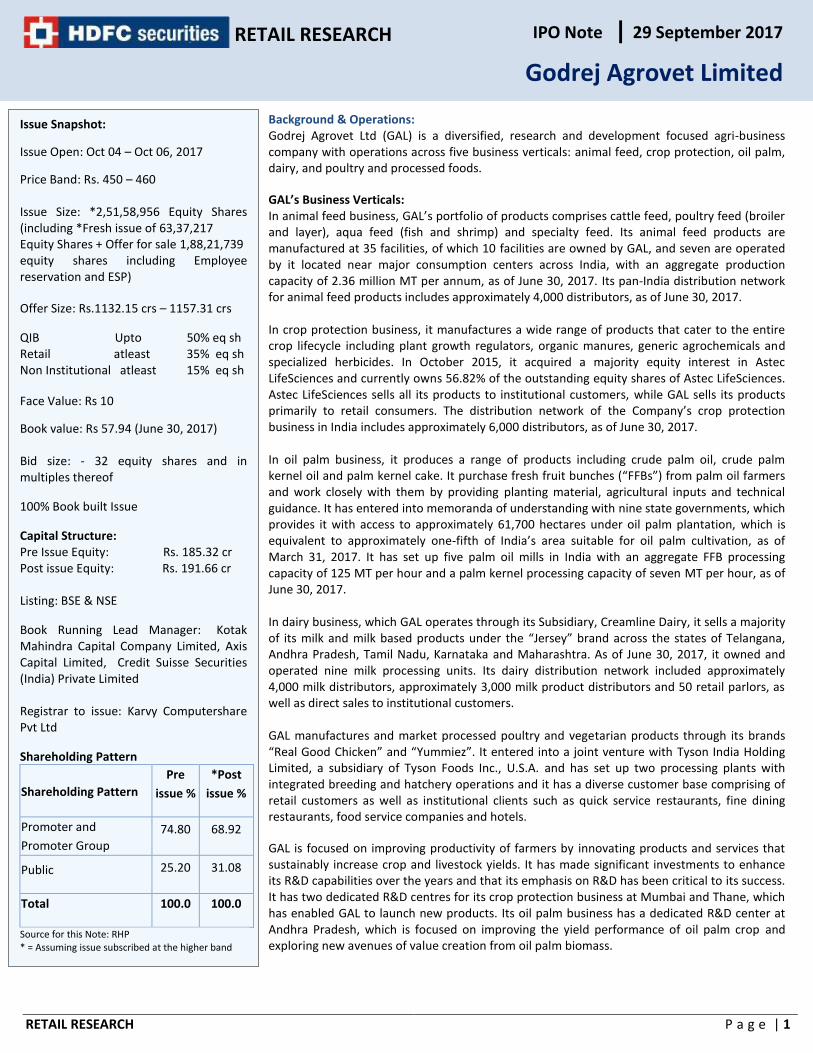
IPO Note 29 September 2017 Godrej Agrovet Limited RETAIL RESEARCH Page | 1 RETAIL RESEARCH Background & Operations: Godrej Agrovet Ltd (GAL) is a diversified, research and development focused agri-business company with operations across five business verticals: animal feed, crop protection, oil palm, dairy, and poultry and processed foods. GAL’s Business Verticals: In animal feed business, GAL’s portfolio of products comprises cattle feed, poultry feed (broiler and layer), aqua feed (fish and shrimp) and specialty feed. Its animal feed products are manufactured at 35 facilities, of which 10 facilities are owned by GAL, and seven are operated by it located near major consumption centers across India, with an aggregate production capacity of 2.36 million MT per annum, as of June 30, 2017. Its pan-India distribution network for animal feed products includes approximately 4,000 distributors, as of June 30, 2017. In crop protection business, it manufactures a wide range of products that cater to the entire crop lifecycle including plant growth regulators, organic manures, generic agrochemicals and specialized herbicides. In October 2015, it acquired a majority equity interest in Astec LifeSciences and currently owns 56.82% of the outstanding equity shares of Astec LifeSciences. Astec LifeSciences sells all its products to institutional customers, while GAL sells its products primarily to retail consumers. The distribution network of the Company’s crop protection business in India includes approximately 6,000 distributors, as of June 30, 2017. In oil palm business, it produces a range of products including crude palm oil, crude palm kernel oil and palm kernel cake. It purchase fresh fruit bunches (“FFBs”) from palm oil farmers and work closely with them by providing planting material, agricultural inputs and technical guidance. It has entered into memoranda of understanding with nine state governments, which provides it with access to approximately 61,700 hectares under oil palm plantation, which is equivalent to approximately one-fifth of India’s area suitable for oil palm cultivation, as of March 31, 2017. It has set up five palm oil mills in India with an aggregate FFB processing capacity of 125 MT per hour and a palm kernel processing capacity of seven MT per hour, as of June 30, 2017. In dairy business, which GAL operates through its Subsidiary, Creamline Dairy, it sells a majority of its milk and milk based products under the “Jersey” brand across the states of Telangana, Andhra Pradesh, Tamil Nadu, Karnataka and Maharashtra. As of June 30, 2017, it owned and operated nine milk processing units. Its dairy distribution network included approximately 4,000 milk distributors, approximately 3,000 milk product distributors and 50 retail parlors, as well as direct sales to institutional customers. GAL manufactures and market processed poultry and vegetarian products through its brands “Real Good Chicken” and “Yummiez”. It entered into a joint venture with Tyson India Holding Limited, a subsidiary of Tyson Foods Inc., U.S.A. and has set up two processing plants with integrated breeding and hatchery operations and it has a diverse customer base comprising of retail customers as well as institutional clients such as quick service restaurants, fine dining restaurants, food service companies and hotels. GAL is focused on improving productivity of farmers by innovating products and services that sustainably increase crop and livestock yields. It has made significant investments to enhance its R&D capabilities over the years and that its emphasis on R&D has been critical to its success. It has two dedicated R&D centres for its crop protection business at Mumbai and Thane, which has enabled GAL to launch new products. Its oil palm business has a dedicated R&D center at Andhra Pradesh, which is focused on improving the yield performance of oil palm crop and exploring new avenues of value creation from oil palm biomass. Issue Snapshot: Issue Open: Oct 04 – Oct 06, 2017 Price Band: Rs. 450 – 460 Issue Size: *2,51,58,956 Equity Shares (including *Fresh issue of 63,37,217 Equity Shares + Offer for sale 1,88,21,739 equity shares including Employee reservation and ESP) Offer Size: Rs.1132.15 crs – 1157.31 crs QIB Upto 50% eq sh Retail atleast 35% eq sh Non Institutional atleast 15% eq sh Face Value: Rs 10 Book value: Rs 57.94 (June 30, 2017) Bid size: - 32 equity shares and in multiples thereof 100% Book built Issue Capital Structure: Pre Issue Equity: Rs. 185.32 cr Post issue Equity: Rs. 191.66 cr Listing: BSE & NSE Book Running Lead Manager: Kotak Mahindra Capital Company Limited, Axis Capital Limited, Credit Suisse Securities (India) Private Limited Registrar to issue: Karvy Computershare Pvt Ltd Shareholding Pattern Shareholding Pattern Pre issue % *Post issue % Promoter and Promoter Group 74.80 68.92 Public 25.20 31.08 Total 100.0 100.0 Source for this Note: RHP * = Assuming issue subscribed at the higher band
Transcript of Godrej Agrovet Limited - HDFC securities Agrovet Limited IPO Note... · Godrej Agrovet Ltd (GAL) is...
IPO Note 29 September 2017
Godrej Agrovet Limited
RETAIL RESEARCH P a g e | 1
RETAIL RESEARCH
Background & Operations: Godrej Agrovet Ltd (GAL) is a diversified, research and development focused agri-business company with operations across five business verticals: animal feed, crop protection, oil palm, dairy, and poultry and processed foods.
GAL’s Business Verticals: In animal feed business, GAL’s portfolio of products comprises cattle feed, poultry feed (broiler and layer), aqua feed (fish and shrimp) and specialty feed. Its animal feed products are manufactured at 35 facilities, of which 10 facilities are owned by GAL, and seven are operated by it located near major consumption centers across India, with an aggregate production capacity of 2.36 million MT per annum, as of June 30, 2017. Its pan-India distribution network for animal feed products includes approximately 4,000 distributors, as of June 30, 2017. In crop protection business, it manufactures a wide range of products that cater to the entire crop lifecycle including plant growth regulators, organic manures, generic agrochemicals and specialized herbicides. In October 2015, it acquired a majority equity interest in Astec LifeSciences and currently owns 56.82% of the outstanding equity shares of Astec LifeSciences. Astec LifeSciences sells all its products to institutional customers, while GAL sells its products primarily to retail consumers. The distribution network of the Company’s crop protection business in India includes approximately 6,000 distributors, as of June 30, 2017. In oil palm business, it produces a range of products including crude palm oil, crude palm kernel oil and palm kernel cake. It purchase fresh fruit bunches (“FFBs”) from palm oil farmers and work closely with them by providing planting material, agricultural inputs and technical guidance. It has entered into memoranda of understanding with nine state governments, which provides it with access to approximately 61,700 hectares under oil palm plantation, which is equivalent to approximately one-fifth of India’s area suitable for oil palm cultivation, as of March 31, 2017. It has set up five palm oil mills in India with an aggregate FFB processing capacity of 125 MT per hour and a palm kernel processing capacity of seven MT per hour, as of June 30, 2017. In dairy business, which GAL operates through its Subsidiary, Creamline Dairy, it sells a majority of its milk and milk based products under the “Jersey” brand across the states of Telangana, Andhra Pradesh, Tamil Nadu, Karnataka and Maharashtra. As of June 30, 2017, it owned and operated nine milk processing units. Its dairy distribution network included approximately 4,000 milk distributors, approximately 3,000 milk product distributors and 50 retail parlors, as well as direct sales to institutional customers. GAL manufactures and market processed poultry and vegetarian products through its brands “Real Good Chicken” and “Yummiez”. It entered into a joint venture with Tyson India Holding Limited, a subsidiary of Tyson Foods Inc., U.S.A. and has set up two processing plants with integrated breeding and hatchery operations and it has a diverse customer base comprising of retail customers as well as institutional clients such as quick service restaurants, fine dining restaurants, food service companies and hotels.
GAL is focused on improving productivity of farmers by innovating products and services that sustainably increase crop and livestock yields. It has made significant investments to enhance its R&D capabilities over the years and that its emphasis on R&D has been critical to its success. It has two dedicated R&D centres for its crop protection business at Mumbai and Thane, which has enabled GAL to launch new products. Its oil palm business has a dedicated R&D center at Andhra Pradesh, which is focused on improving the yield performance of oil palm crop and exploring new avenues of value creation from oil palm biomass.
Issue Snapshot:
Issue Open: Oct 04 – Oct 06, 2017
Price Band: Rs. 450 – 460 Issue Size: *2,51,58,956 Equity Shares (including *Fresh issue of 63,37,217 Equity Shares + Offer for sale 1,88,21,739 equity shares including Employee reservation and ESP)
Offer Size: Rs.1132.15 crs – 1157.31 crs
QIB Upto 50% eq sh Retail atleast 35% eq sh Non Institutional atleast 15% eq sh
Face Value: Rs 10
Book value: Rs 57.94 (June 30, 2017) Bid size: - 32 equity shares and in multiples thereof
100% Book built Issue
Capital Structure: Pre Issue Equity: Rs. 185.32 cr Post issue Equity: Rs. 191.66 cr Listing: BSE & NSE
Book Running Lead Manager: Kotak Mahindra Capital Company Limited, Axis Capital Limited, Credit Suisse Securities (India) Private Limited Registrar to issue: Karvy Computershare Pvt Ltd
Shareholding Pattern
Shareholding Pattern
Pre
issue %
*Post
issue %
Promoter and
Promoter Group
74.80 68.92
Public 25.20 31.08
Total 100.0 100.0
Source for this Note: RHP * = Assuming issue subscribed at the higher band
RETAIL RESEARCH
RETAIL RESEARCH P a g e | 2
Objects of Issue: The Offer consists of a Fresh Issue by GAL and an Offer for Sale. The Company will not receive any proceeds from the Offer for Sale. The Company proposes to utilize the Net Proceeds from the Fresh Issue towards funding the following objects:
Repayment or prepayment of working capital facilities availed by the Company
Repayment of commercial papers issued by the Company; and
General corporate purposes subject to the applicable laws.
Requirement of Funds and proposed schedule of deployment (Rs.mn)
Particulars Amount
Repayment or prepayment of working capital facilities availed by the Company 1000
Repayment of commercial papers issued by the Company 1500
General corporate purposes *
Total *
Competitive Strengths Pan-India Presence with Extensive Supply and Distribution Network: GAL has a pan-India presence and operations spanning across five business verticals: animal feed, crop protection, oil palm, dairy, and poultry and processed foods. It has since set up its processing facilities and supporting infrastructure as well as R&D to develop a modern operating platform across key agriculture verticals in which it operates. As a result of its widespread network and significant operational experience, it has been able to identify market trends and introduce a range of innovative and value added products in the market to cater to the evolving needs of the customers. In addition, since several of its facilities are located near major consumption centers, GAL is able to ensure product freshness by reducing delivery time to customers as well as reduce its transportation costs. Its nationwide footprint also allows to leverage the competitive advantages of each location to enhance competitiveness and reduce geographic and political risks in its businesses. GAL’s business model with a strong procurement base, diversified product portfolio and large-scale operations enables to achieve economies of scale in sourcing of raw materials and the distribution of its products. In oil palm business, it had access to approximately 61,700 hectares under oil palm plantations across nine states, or approximately one-fifth of India’s oil palm plantations, as of March 31, 2017. For dairy business, its supply chain network includes procurement from six states through a network of 120 chilling centers as of June 30, 2017. As of June 30, 2017, its dairy distribution network included approximately 4,000 milk distributors, approximately 3,000 milk product distributors and 50 retail parlors, as well as direct sales to institutional customers. Diversified Businesses with Synergies in Operations: GAL’s presence across five business verticals has enabled it to grow revenues over the last five years. Its diversified businesses along with geographic diversification provides a hedge against the risks associated with any particular industry segment or geography while benefiting from the synergies of operating in diverse but related businesses. Its synergies across diverse businesses provide it with the ability to drive growth, optimize capital efficiency and maintain competitive advantage. It also derives operational efficiencies by centralizing and sharing certain key functions across its businesses such as finance, legal, information technology, strategy, procurement and human resources. GAL invest significant management resources to ensure that it leverage existing inter-linkages between its businesses and are able to maximize the potential synergies amongst them. Additionally, some of the biomass produced from the oil palm business is used as an animal feed ingredient, which provides additional source of revenue to its oil palm business as well as strengthens the cost competitiveness of the animal feed business. Strong R&D Capabilities: GAL’s emphasis on R&D has been critical to its success and a differentiating factor from its competitors. It undertakes dedicated R&D in its existing products primarily with a focus to improve yields and process efficiencies. It offers a variety of cattle feed for the entire lifecycle of the cattle. For its crop protection business, it has developed products in-house such as “Vipul”, “Double” and “Combine” and “Hitweed”, which is an indigenously developed selective cotton herbicide targeting broad-leaf weeds, and works with both, indigenous and genetically modified varieties of cotton. It has also developed layer concentrate for egg laying hens in crumb form, which is an important input in automated feeding systems. It focus its R&D efforts in areas where there is significant growth potential. Its acquisition of Astec LifeSciences provided it access to strong R&D capabilities in the agrochemical active ingredients category, which has leveraged to introduce new fungicide products such as “Kemplar” and “Casper” as part of the Company’s offerings. GAL is also investing in developing innovative technologies to further grow its product portfolio. Strong Parentage and Established Brands: GAL is a part of the Godrej group, which is among India’s oldest and most prominent corporate groups. The ‘Godrej’ brand is recognizable in India due to its long established presence in the Indian market, the diversified businesses in which the Godrej group operates and the trust it has developed over the course of its operating history. The strength of the “Godrej” brand and its association with trust, quality and reliability helps it in many aspects of its various businesses, particularly its businesses that involve
direct sales to retail consumers. GAL’s association with the ‘Godrej’ brand provides it with a competitive advantage in attracting talent, benefiting from its global network, exploring potential business opportunities, corporate governance practices and acquiring direct access to

RETAIL RESEARCH
RETAIL RESEARCH P a g e | 3
senior decision makers. The strong recall of its brands has allowed GAL to maintain a large and diverse customer base and facilitated its ability to develop and market new products, as that customers are more likely to rely on a trusted brand while experimenting with new products.
Experienced Promoters and Management Team: GAL has a strong management team with significant industry experience. Its Promoters include Mr. Adi Godrej and Mr. Nadir Godrej, each of whom has approximately 40 years of experience in successfully creating shareholder value across businesses in a diverse range of industries. In addition, its Board of Directors includes independent directors who bring significant business expertise. The combination of its experienced Board of Directors and its dynamic management team positions it well to capitalize on future growth opportunities. Its experienced management has demonstrated the ability to successfully build and integrate various operating activities through their years of experience. Business Strategy: The primary elements of GAL’s business strategy is to continue to grow its existing businesses, leverage synergies between its businesses and opportunistically evaluate inorganic opportunities. Its specific growth strategies for each of its business verticals are as follows: Animal Feed Business: The animal feed industry in India is largely unorganized and GAL compete with multiple players in each geography in which it operates. Its strategy for its animal feed business is to focus on achieving cost leadership by improving the operational efficiency of its animal feed business through R&D as well as cost rationalization initiatives. Crop Protection Business: GAL’s strategy for growing crop protection business is primarily focused on expanding its product portfolio. It has introduced new products in its crop protection business and intends to continue its focus on introducing new products. It also intends to continue to leverage Astec LifeSciences portfolio of agro chemical technical (active ingredients) and formulations, such as triazoles, and sell them under the ‘Godrej’ brand through its strong distribution network. It also plans to focus on increasing the market share of its existing core products by developing products for additional crops and increasing geographic presence. Oil Palm Business: GAL’s strategy for oil palm business is to grow its presence in certain regions, create additional revenue streams from oil palm biomass and continue to focus on R&D to improve FFB yield. It intends to diversify its oil palm business and create additional revenue streams and lower operational costs, including through the use of oil palm biomass in its animal feed business, which will reduce its dependence on the prices of crude palm oil and crude palm kernel oil. It also intends to grow its presence in certain districts of Andhra Pradesh and Tamil Nadu, both organically and inorganically, and increase the area under oil palm, which is accessible to it. GAL plans to continue to focus on R&D to improve FFB yields per hectare at its laboratory in Chintampalli, Andhra Pradesh and also plans to continue providing targeted interventions for farmers whose farms are experiencing slow growth or low yields. Dairy Business: GAL growth strategy for dairy business is to: (i) increase its market share by growing brand in southern states of India; (ii) increase the salience of value-added product portfolio; (iii) automate a majority of its operations; and (iv) increase procurement base. GAL intends to increase the share of its value-added product portfolio to cater to evolving consumer trends and is currently evaluating introducing new products in the UHT milk and flavored yogurt segments. It currently procure milk from 52 districts across six states and propose to increase its milk procurement by setting up new collection centers to deepen its presence in existing areas as well as access new areas to procure milk. GAL also seeks to strengthen its existing relationships with milk farmers and vendors through methods including providing farmers with cattle feed, assisting with veterinary health-care and vaccinations.
Poultry and Processed Foods Business: GAL’s strategy for poultry and processed foods business is to introduce new products and increase its product reach. It intends to continue to provide variants of existing, and new, value-added poultry products. While it currently has a diverse distribution network to cater to its retail and institutional customers, it constantly seeks to grow its product reach to under-penetrated geographies. It intends to appoint additional distributors to increase the availability of its products in certain regions in India. Continue to Grow Overall Market Share by Leveraging Presence in Existing Business Verticals: GAL will continue to focus on improving its market share across all its business verticals. Since several sectors in which it operates are largely unorganized, cost leadership will be a key enabler for GAL to increase the market share of its products. Its presence in key-agricultural verticals provides it with significant business inter-linkages and it intends to improve its overall operating efficiencies by leveraging strengths from different businesses as well as benefit from the economies of scale. It also intends to improve its cost efficiency and productivity by implementing effective and efficient operational techniques. Its operations team, comprising experienced veterinarians, agronomists, plant engineers and senior management, adopts best practices in line with industry standards across its production facilities. GAL will continue to leverage its in-house technological and R&D capabilities to effectively manage its operations, maintain strict operational controls and enhance customer service levels.

RETAIL RESEARCH
RETAIL RESEARCH P a g e | 4
Inorganically Grow Business Offerings: GAL will evaluate inorganic growth opportunities, in keeping with its strategy to grow and develop its market share or to add new product categories. It may consider opportunities for inorganic growth, such as through mergers and acquisitions, if, among other things, they consolidate its market position in existing business verticals; achieve operating leverage in key markets by unlocking potential efficiency and synergy benefits; strengthen and expand its product portfolio, enhance its depth of experience, knowledge-base and know-how; and increase its sales and distribution network. GAL has demonstrated the capability to operate joint ventures in and outside India with partners in its animal feed business in Bangladesh and poultry and processed foods business in India. Industry: Animal Feed Current market size of global animal feed In terms of sales volume, the size of the compound animal feed industry has been estimated to be approximately 1 billion million tons (“MT”) in the calendar year 2015. In terms of sales value, the feed industry has been valued at an estimated $400 billion as of the calendar year 2015. In the calendar year 2015, China was the largest producer of animal feed, contributing 19% of sales volume, followed by the United States of America at 17% and the European Union at 16%. Of the total one billion tons of animal feed produced globally, poultry feed accounts for the largest share at 45%, followed by the pig feed segment at 26% and cattle and other ruminants at 20%. Aquaculture, which includes shrimp and fish feed, accounts for 4%, while others account for approximately 5%. Overview of the animal compound feed industry in India CRISIL Research estimates the animal compound feed industry in India to be valued at approximately Rs. 715 to Rs.725 billion as of the financial year 2017. In terms of sales volume, India is one of the largest global producer of animal feed with an annual production of between 25 million MT and 27 million MT. Going forward, the industry is expected to grow at a CAGR of 13% to 14%, reaching a market size of between Rs.1,060 and Rs.1,070 billion by the financial year 2020. Among the three segments, aqua feed is expected to grow the fastest at a CAGR of between 15% and 16%, followed by poultry feed at a CAGR of between 14% to 15% and cattle feed at a CAGR of between 10% to 11% by the financial year 2020. The poultry feed industry constitutes nearly two-thirds of the total feed industry, due to high penetration of compound feed, especially in the broiler segment. In contrast, the share of cattle feed stands lower at 21%, despite India being the largest milk producer in the world. This is largely due to the fact that farmers continue to rely on grazing as a means of feed and the overall penetration of compound feed has remained low. Aqua feed, which currently enjoys a share of 12%, has been witnessing growth mainly on account of increased usage of shrimp feed. Under aquaculture, shrimp exports have seen a robust growth at a CAGR of 33% between the financial year 2010 and the financial year 2015, and since shrimp cultivation is largely organised, it has had a cascading effect on the consumption of shrimp feed. Poultry industry in India The poultry industry can be broadly divided into broiler and layer, of which, the broiler segment represents chicken for meat consumption and the layer segment represents egg laying chickens. The total poultry feed requirement in India has been estimated at between 21 million MT and 22 million MT, based on the overall poultry population and typical feed conversion ratios. Of this, approximately 16 million MT to 17 million MT is contributed by compound feed as of the financial year 2017. In terms of sales value, the poultry feed industry, comprising broiler and layer feeds, has been estimated at between Rs.480 and Rs.490 billion as of the financial year 2017. The poultry feed sector is expected to grow at a CAGR of 14% to 15% in the next three years to reach between Rs.730 and Rs.740 billion by the financial year 2020. Broiler feed comprised 85% of the industry, or between 13.5 million MT and 14.5 million MT in the financial year 2017. The total feed production for the layer segment was between 2 million MT and 3 million MT during the financial year 2017. Compound feed is mix of raw materials and additives formulated according to the specific requirements of the target animal. Concentrates are used with another feed to improve the nutritive balance of the total, which is intended to be further diluted and mixed to produce a supplement or a complete feed. Balanced animal nutrition allows feed manufacturers to help livestock farmers keep their animals healthy and improve animal product quality and safety. Non-compound feed generally includes compressed and pelleted feeds, oils and mixed rations, and sprouted grains and legumes. For the broiler segment, 90% to 95% of feed production is in the form of compound feed, while for the layer segment, 25% to 35% of feed production is in the form of compound feed. The organized sector contributes between 80% and 85% of the poultry feed industry, and the unorganized sector contributes the remaining. The majority of organized feed is manufactured by integrators who produce 70% to 75% of the total manufactured feed. Such integrators typically use the majority of the manufactured feed for captive purposes while balance feeds are sold to individual farmers. In contrast, specialist feed manufacturers are primarily involved with the selling of feed.
RETAIL RESEARCH
RETAIL RESEARCH P a g e | 5
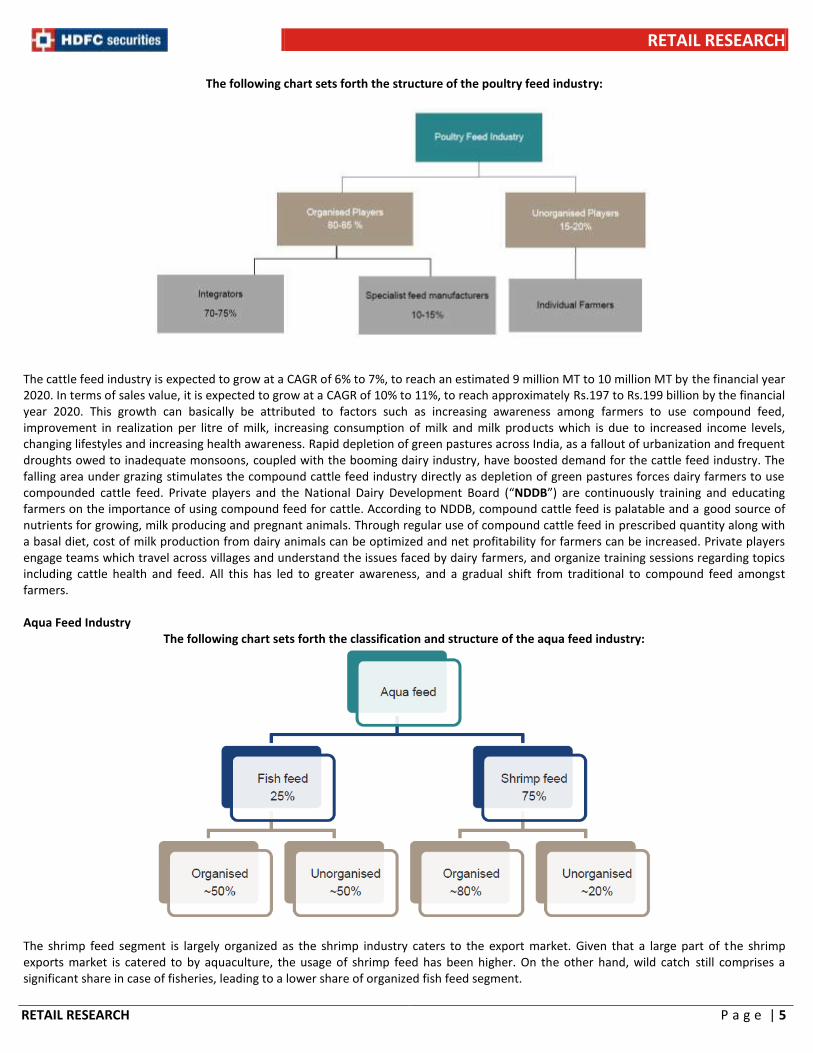
The following chart sets forth the structure of the poultry feed industry:
The cattle feed industry is expected to grow at a CAGR of 6% to 7%, to reach an estimated 9 million MT to 10 million MT by the financial year 2020. In terms of sales value, it is expected to grow at a CAGR of 10% to 11%, to reach approximately Rs.197 to Rs.199 billion by the financial year 2020. This growth can basically be attributed to factors such as increasing awareness among farmers to use compound feed, improvement in realization per litre of milk, increasing consumption of milk and milk products which is due to increased income levels, changing lifestyles and increasing health awareness. Rapid depletion of green pastures across India, as a fallout of urbanization and frequent droughts owed to inadequate monsoons, coupled with the booming dairy industry, have boosted demand for the cattle feed industry. The falling area under grazing stimulates the compound cattle feed industry directly as depletion of green pastures forces dairy farmers to use compounded cattle feed. Private players and the National Dairy Development Board (“NDDB”) are continuously training and educating farmers on the importance of using compound feed for cattle. According to NDDB, compound cattle feed is palatable and a good source of nutrients for growing, milk producing and pregnant animals. Through regular use of compound cattle feed in prescribed quantity along with a basal diet, cost of milk production from dairy animals can be optimized and net profitability for farmers can be increased. Private players engage teams which travel across villages and understand the issues faced by dairy farmers, and organize training sessions regarding topics including cattle health and feed. All this has led to greater awareness, and a gradual shift from traditional to compound feed amongst farmers. Aqua Feed Industry
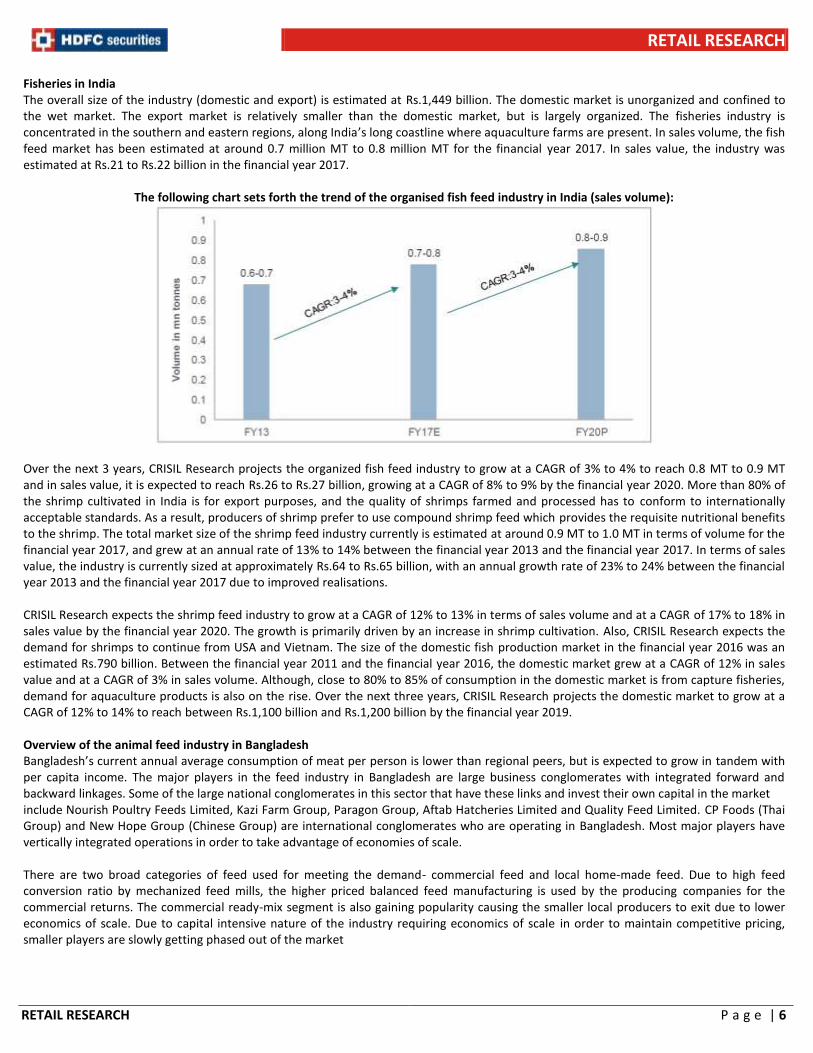
The following chart sets forth the classification and structure of the aqua feed industry:
The shrimp feed segment is largely organized as the shrimp industry caters to the export market. Given that a large part of the shrimp exports market is catered to by aquaculture, the usage of shrimp feed has been higher. On the other hand, wild catch still comprises a significant share in case of fisheries, leading to a lower share of organized fish feed segment.
RETAIL RESEARCH
RETAIL RESEARCH P a g e | 6
Fisheries in India The overall size of the industry (domestic and export) is estimated at Rs.1,449 billion. The domestic market is unorganized and confined to the wet market. The export market is relatively smaller than the domestic market, but is largely organized. The fisheries industry is concentrated in the southern and eastern regions, along India’s long coastline where aquaculture farms are present. In sales volume, the fish feed market has been estimated at around 0.7 million MT to 0.8 million MT for the financial year 2017. In sales value, the industry was estimated at Rs.21 to Rs.22 billion in the financial year 2017.
The following chart sets forth the trend of the organised fish feed industry in India (sales volume):
Over the next 3 years, CRISIL Research projects the organized fish feed industry to grow at a CAGR of 3% to 4% to reach 0.8 MT to 0.9 MT and in sales value, it is expected to reach Rs.26 to Rs.27 billion, growing at a CAGR of 8% to 9% by the financial year 2020. More than 80% of the shrimp cultivated in India is for export purposes, and the quality of shrimps farmed and processed has to conform to internationally acceptable standards. As a result, producers of shrimp prefer to use compound shrimp feed which provides the requisite nutritional benefits to the shrimp. The total market size of the shrimp feed industry currently is estimated at around 0.9 MT to 1.0 MT in terms of volume for the financial year 2017, and grew at an annual rate of 13% to 14% between the financial year 2013 and the financial year 2017. In terms of sales value, the industry is currently sized at approximately Rs.64 to Rs.65 billion, with an annual growth rate of 23% to 24% between the financial year 2013 and the financial year 2017 due to improved realisations. CRISIL Research expects the shrimp feed industry to grow at a CAGR of 12% to 13% in terms of sales volume and at a CAGR of 17% to 18% in sales value by the financial year 2020. The growth is primarily driven by an increase in shrimp cultivation. Also, CRISIL Research expects the demand for shrimps to continue from USA and Vietnam. The size of the domestic fish production market in the financial year 2016 was an estimated Rs.790 billion. Between the financial year 2011 and the financial year 2016, the domestic market grew at a CAGR of 12% in sales value and at a CAGR of 3% in sales volume. Although, close to 80% to 85% of consumption in the domestic market is from capture fisheries, demand for aquaculture products is also on the rise. Over the next three years, CRISIL Research projects the domestic market to grow at a CAGR of 12% to 14% to reach between Rs.1,100 billion and Rs.1,200 billion by the financial year 2019. Overview of the animal feed industry in Bangladesh Bangladesh’s current annual average consumption of meat per person is lower than regional peers, but is expected to grow in tandem with per capita income. The major players in the feed industry in Bangladesh are large business conglomerates with integrated forward and backward linkages. Some of the large national conglomerates in this sector that have these links and invest their own capital in the market include Nourish Poultry Feeds Limited, Kazi Farm Group, Paragon Group, Aftab Hatcheries Limited and Quality Feed Limited. CP Foods (Thai Group) and New Hope Group (Chinese Group) are international conglomerates who are operating in Bangladesh. Most major players have vertically integrated operations in order to take advantage of economies of scale. There are two broad categories of feed used for meeting the demand- commercial feed and local home-made feed. Due to high feed conversion ratio by mechanized feed mills, the higher priced balanced feed manufacturing is used by the producing companies for the commercial returns. The commercial ready-mix segment is also gaining popularity causing the smaller local producers to exit due to lower economics of scale. Due to capital intensive nature of the industry requiring economics of scale in order to maintain competitive pricing, smaller players are slowly getting phased out of the market
RETAIL RESEARCH
RETAIL RESEARCH P a g e | 7
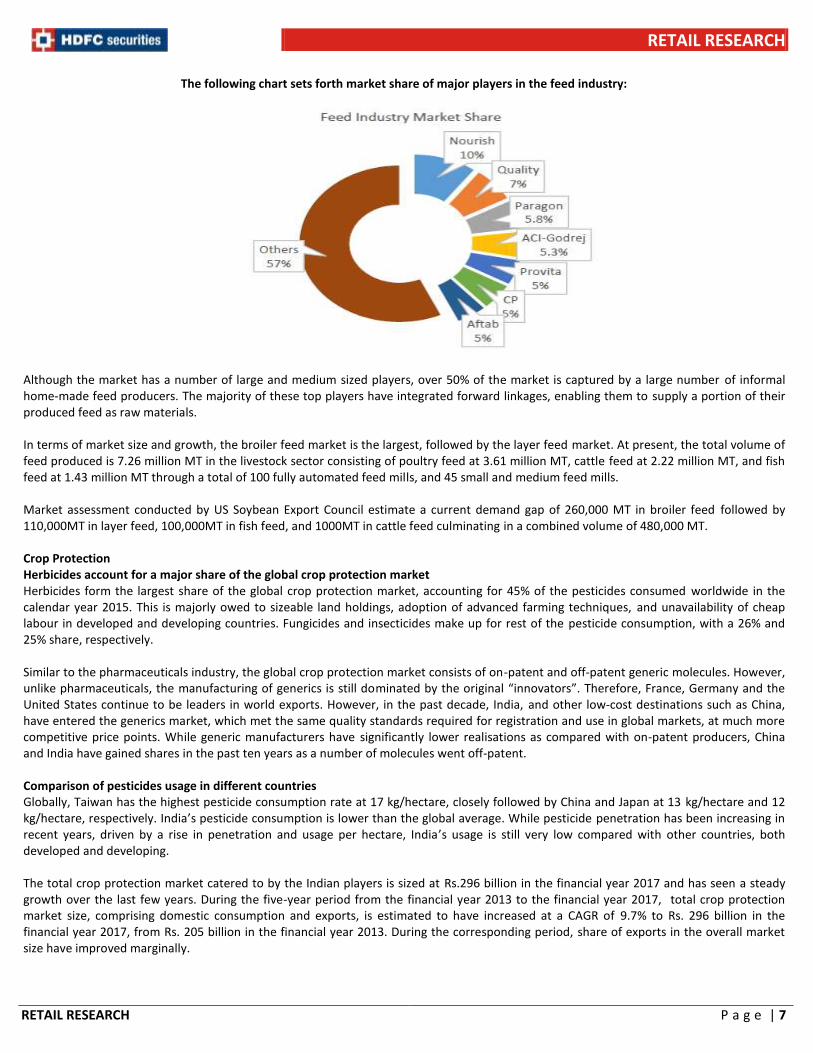
The following chart sets forth market share of major players in the feed industry:
Although the market has a number of large and medium sized players, over 50% of the market is captured by a large number of informal home-made feed producers. The majority of these top players have integrated forward linkages, enabling them to supply a portion of their produced feed as raw materials. In terms of market size and growth, the broiler feed market is the largest, followed by the layer feed market. At present, the total volume of feed produced is 7.26 million MT in the livestock sector consisting of poultry feed at 3.61 million MT, cattle feed at 2.22 million MT, and fish feed at 1.43 million MT through a total of 100 fully automated feed mills, and 45 small and medium feed mills. Market assessment conducted by US Soybean Export Council estimate a current demand gap of 260,000 MT in broiler feed followed by 110,000MT in layer feed, 100,000MT in fish feed, and 1000MT in cattle feed culminating in a combined volume of 480,000 MT. Crop Protection Herbicides account for a major share of the global crop protection market Herbicides form the largest share of the global crop protection market, accounting for 45% of the pesticides consumed worldwide in the calendar year 2015. This is majorly owed to sizeable land holdings, adoption of advanced farming techniques, and unavailability of cheap labour in developed and developing countries. Fungicides and insecticides make up for rest of the pesticide consumption, with a 26% and 25% share, respectively. Similar to the pharmaceuticals industry, the global crop protection market consists of on-patent and off-patent generic molecules. However, unlike pharmaceuticals, the manufacturing of generics is still dominated by the original “innovators”. Therefore, France, Germany and the United States continue to be leaders in world exports. However, in the past decade, India, and other low-cost destinations such as China, have entered the generics market, which met the same quality standards required for registration and use in global markets, at much more competitive price points. While generic manufacturers have significantly lower realisations as compared with on-patent producers, China and India have gained shares in the past ten years as a number of molecules went off-patent. Comparison of pesticides usage in different countries Globally, Taiwan has the highest pesticide consumption rate at 17 kg/hectare, closely followed by China and Japan at 13 kg/hectare and 12 kg/hectare, respectively. India’s pesticide consumption is lower than the global average. While pesticide penetration has been increasing in recent years, driven by a rise in penetration and usage per hectare, India’s usage is still very low compared with other countries, both developed and developing. The total crop protection market catered to by the Indian players is sized at Rs.296 billion in the financial year 2017 and has seen a steady growth over the last few years. During the five-year period from the financial year 2013 to the financial year 2017, total crop protection market size, comprising domestic consumption and exports, is estimated to have increased at a CAGR of 9.7% to Rs. 296 billion in the financial year 2017, from Rs. 205 billion in the financial year 2013. During the corresponding period, share of exports in the overall market size have improved marginally.
RETAIL RESEARCH
RETAIL RESEARCH P a g e | 8
The domestic crop protection demand is currently sized at between Rs. 145 billion and Rs.155 billion. The industry grew at a healthy CAGR of 8.5% in sales value between the financial year 2013 and the financial year 2017, driven by higher pesticide use per hectare to boost agricultural production, and an increased penetration of pesticides. In addition, plant growth regulators have been used for the cultivation of cotton and rice crops in India, and also find application in horticulture and floriculture. Share of organized players in crop protection market The domestic pesticides market is highly competitive in nature. While there are 15 to 20 major manufacturers of technical compounds, who also have a presence in the manufacturing and sale of formulations, there are over 500 standalone formulators as well. The top players, most of whom are integrated manufacturers, comprise 60% to 70% of the pesticides market, with smaller standalone formulators accounting for the rest. Standalone formulators are largely present in the manufacturing of generic, that is, not specific to a particular crop or pest, pesticides, while larger players, in particular MNCs, or large Indian companies with global tie-ups for technology, are more likely to have a greater presence in specific pesticides. As generic pesticides dominate the domestic market, price competition amongst players is intense. Players in the intensely competitive domestic industry adopt a variety of strategies to boost their competitiveness. A wide distribution network provides a higher market share, along with a degree of geographical diversification, and backward integrated players, or players with a presence in the manufacturing of technical, are typically more profitable. A diverse product portfolio, of both specific and generic pesticides, and various categories of pesticides including insecticides, herbicides and fungicides to provide players with a wider market for their products in terms of both geography and target crops. Players who export, besides gaining a wider market, also achieve some degree of natural hedging in the event that some proportion of their raw materials are imported. In addition, over and above a strong distribution network, engagement with the final end consumers, that is, farmers, is essential. Players also have to make efforts to develop some degree of brand recall among the farmers, given the fact that most distributors will be stocking products of more than one company. In order to boost their relationship with farmers, and also to ensure proper utilisation of their products, players regularly interact with farmers and engage in awareness building sessions. Over the next three years (financial year 2018 to financial year 2020), pesticides consumption is expected to grow at a CAGR of 8% to 9% in sales value, driven by growth in the herbicides and fungicides segments. Also, the penetration of pesticides is expected to increase 300 basis points to 52%, aiding growth. Demand for insecticides is expected to slow down, owing to a decline in its application on cotton. The share of cotton in total pesticides consumption is estimated to have dropped sharply from 30% in the financial year 2012 to 15% in the financial year 2017, due to increasing awareness among farmers about Bt cotton seeds. However, the increasing penetration of pesticides in paddy plantation will continue to drive growth for the segment, albeit at a much slower pace at a CAGR of 5%, over the next three years. Trend in India’s exports From the financial year 2013 to the financial year 2017, India’s pesticides exports grew at a CAGR of 11% in terms of the Indian rupee. Exports demand was strong during the financial year 2013 and the financial year 2014, owing to healthy demand from key export markets of Brazil and the US. However, growth was flat during the financial year 2015 and the financial year 2016, owing to El-Nino inducing a fall in demand from Brazil. India’s share in global pesticides exports increased from 4% in the calendar year 2006 to over 7% in the calendar year 2016. The share of China, India’s major competitor in the pesticides generics manufacturing industry, moved up from 6% in the calendar year 2006 to 13% in the calendar year 2016. Both Indian and Chinese exports have grown relatively faster than the global market, owing to an increase in the usage of generics. The expiry of patented products in the past ten years has also aided the increase. Key growth drivers for the crop protection industry Push for higher yields drives pesticides consumption. At 87%, India has a high utilization of arable land compared to Africa (20%), the Americas (30%), the rest of Asia (22%) and Europe (59%). This indicates that the scope for increasing the area under cultivation is minimal. Therefore, any further increase in agriculture production has to come from an increase in yields. Increasing adoption of modern agricultural practices driving growth. From the below graph, it is clearly seen that the penetration of pesticides is highest in the case of land where both irrigation and high yielding varieties of seeds are used. The primary strategy used to boost yields across crops is the implementation of modern agricultural methods. Pesticides, in conjunction with fertilisers, mechanised farm equipment and irrigation are the basic components of modern agricultural practices the world over. The adoption of these modern practices has driven the increase in the use of pesticides in recent years. Higher farm income fuelling investments in plant protection. Moderately increasing income in the hands of farmers is a crucial factor playing out in favour of the pesticides industry. Investments to boost yields at the farm level are linked directly to the farmers’ incomes. Pesticides as an insurance policy against crop loss. While considering farm economics, it becomes important to assess the importance of pesticides in the context of the opportunity cost of not applying them. Advanced technologies and the emergence of a plethora of new products in crop protection over the past several decades have rendered crop losses (due to pest attack) as almost completely avoidable.
RETAIL RESEARCH
RETAIL RESEARCH P a g e | 9
Furthermore, pesticides, if applied in the requisite quantity, will typically constitute around 8% to 10% of farm operating expenses, including labour. The outgo for manual labour and inputs, such as fertilisers, is typically far higher. The implication of this fact is that, if, by application of pesticides, crop losses can be avoided altogether, the decision makes economic sense. Oil Palm Global vegetable oil production and consumption Palm oil and soya bean oil shared 64.0% of the total vegetable oils with 36.0% and 28.1% respectively. Amongst the lauric oil sources, palm kernel oil dominated with 4.0% share followed by coconut oil at 1.7%. In the global vegetables oil production, palm oil remains to be the highest followed by soya bean oil. The next important oils are rape seed and mustard and sunflower oil. These four oils play a vital role in the vegetable oil, in the economy of oils and fats. Future world demand for vegetable oils Global demand for oils and fats is growing fast and in the past 15 years has almost doubled from 92.4 million MT in the financial year 2000 to 180.0 million MT in the financial year 2015. The four major vegetable oils: palm (30%), soya bean (24%), rape seed and mustard (13%) and sunflower (7%) totally contributed to 74% of world production. The growing demand will continue in the coming decades. By the financial year 2050, global demand will rise to 250 million MT. Oil Palm in India Oil palm gives the highest oil yield of 4 to 6 tons per hectare per year with a global average of 3.80 tons per hectare per year which no other known oilseed crop produces. The highest theoretical oil yield of this crop is projected to 18 tons per hectare per year. In India itself the best farmers have obtained 6 to 8 tons and highest being 10 tons of oil per hectare per year. Oil palm is an eco-friendly crop, and soil fertility is improved through the proper recycling of organic bio mass in oil palm plantations. In addition, palm oil is a source of nutrition and health due to its high calorific value and vitamin content, and a major source of biofuel. Oil Palm Development Project In the financial year 1991, the Oil Palm Development Project was launched as part of the Government’s Technology Mission on Oil Seeds program. Implementation of the Oil Palm Development Project began in nine states. As of March 31, 2017, the country has achieved an area expansion of 305,624 hectares across 14 states out of 18 potential identified states. This is the highest irrigated area of oil palm globally involving small and marginal farmers. The Indian oil palm development project with small and marginal farmers is linked with identified processors including GAVL, Ruchi Soya and 3F, who will provide planting material, technical know-how for cultivation and finally purchase the fresh fruit bunches (“FFB”) at the collection centers. Unlike with other crops such as sugarcane, farmers are paid without going to processing locations, and payment is made within two weeks of collecting the fruits from farmers. Area allotments to particular companies ensure that companies can go ahead with oil palm planting without restriction, depending on the conviction of the farmers. Leading players in the Palm Oil Milling space in India Production of Indian Palm oil (CPO) increased from approximately 1,013 tons in the financial year 1994 to 1.87 lakh tons in the financial year 2016. As of March 31, 2017, Godrej Agrovet was the largest crude oil producer in India, with a market share of 35%. Ruchi Soya occupies the second position with a market share of approximately 30%. Nava Bharat Agro Products and 3F occupy the third and fourth position, with a market share of approximately 11% and 7% to 9% respectively. Dairy The Indian Dairy Industry Overview India is the world’s biggest producer and consumer of milk on a country-wise basis. However, the per capita consumption of milk at 97 litres per year is well below that of other major milk markets, except for China. Milk production volumes in India have grown at a rapid pace from 17 million MT during the financial year 1952 to 162 million MT during the financial year 2017, enabling India to become the world’s biggest milk producer. Similarly, driven by a steady population growth and rising incomes, milk consumption continues to rise in India. During the financial year 2017, India with a total consumption of 154 million MT represented the world’s largest consumer of milk. In the financial year 2016, India’s dairy industry was worth approximately Rs. 6,911 billion, growing at a CAGR of 13.0% during the financial years 2010 to 2016. Total production of milk and dairy products in India is expected to increase from 162 million MT in the financial year 2017 to 209 million MT in the financial year 2023, and total consumption of milk and dairy products is expected to increase from 154 million MT in the financial year 2017 to 205 million MT in the financial year 2023. In the financial year 2022, India’s dairy industry is projected to be worth approximately Rs.16,368 billion, maintaining a CAGR of 15.6% during the financial years 2017 to 2022. In India, milk consumption mainly consists of cow milk at 49.9% for the financial year 2017. On a state level, Uttar Pradesh, Rajasthan and Gujarat were the largest milk producers accounting for 17.0%, 12.1% and 8.0% of total milk production in the financial year 2017, respectively. Further, of the 35 states
RETAIL RESEARCH
RETAIL RESEARCH P a g e | 10
and union territories in India, cow milk is dominant in 24 states and union territories. The top 5 cow milk producing states in India are currently Tamil Nadu, Uttar Pradesh, Rajasthan, Maharashtra and West Bengal. Key Growth Drivers There are several key factors driving growth in the dairy industry including: Strong historical and projected GDP growth rates. In the financial year 2016, the Indian economy was valued at over US$ 2.4 trillion and expected to grow at a CAGR of 7.7% during the financial years 2017 to 2022. Driven by the sustained growth of the Indian economy, shift in life styles and eating habits of Indian consumers are expected drive the consumption of dairy products in the country. Rising middle class and urban population. The number of middle class households is expected to significantly increase from 255 million in the financial year 2015 to 586 million by the financial year 2025 at a CAGR of 8.7%. As the demand for dairy products is income elastic, a continuous increase in disposable incomes is creating a positive impact on the growth of the dairy Industry. The consumption of dairy products, in particular the organized sector is also dependent upon the level of urbanization. With increasing urbanization levels and busy lifestyles, consumers tend to prefer clean, hygienic and ready to eat products which can be consumed on-the-go. India’s urbanization levels have increased significantly over the past few decades which are acting as a catalyst for the growth of the organized dairy market. Large and increasing working population. The rise in working population aged 15 to 64 and disposable incomes from the increasing number of middle class households is expected to drive growth in the dairy industry. The increasing level of urbanization across the Indian population is also expected to drive growth in the organized dairy industry as a result of urban consumers preferring clean, hygienic and ready-to-eat milk and dairy products. The total size of the working population is expected to increase from 826 million in the financial year 2015 to 988 million by the financial year 2030. Changing dietary patterns. Greater per capita income and urbanization have changed food consumption patterns in Indian households, particularly from consuming lesser cereals and increasing consumption of milk and dairy products. During the financial year 2012, urban and rural households spent approximately 16.4% and 15.2%, respectively, out of total their total monthly income on milk and dairy products. Milk is considered a perfect health food in India. Milk has traditionally been an important source of proteins, fats, carbohydrates and vitamins, especially for India’s vegetarian population, which make up approximately 31% of India’s population. It is therefore expected that there will be a continuous strong demand for milk and dairy products. Poultry and Processed Foods Meat Industry Overview Poultry meat is the fastest growing component of the global meat demand. As of the calendar year 2017 (forecast), the USA is the largest producer of broiler meat, followed by Brazil and China. India’s production of broiler meat at 4.5 million MT is led largely by domestic demand. In the financial year 2016, India’s per capita consumption of poultry meat was an estimated 3.7 kg per year, compared to the world average of approximately 17.0 kg per year. While India currently has a lower share in consumption as compared to its global peers, overall poultry consumption has been increasing at a healthy pace at a CAGR of 15% to 20% over the last decade. This growth has been led primarily by an increase in average household incomes, increase in popularity and number of fast food restaurants and quick service restaurants, as well as a shift in preference of white meat over red meat. Poultry Meat Industry in India For the financial year 2017, poultry meat production in India was estimated at 3.5 million MT. The poultry market, currently valued at Rs.5.65 billion, contributes to approximately 47.86% of total meat output. Out of the total poultry meat market, the live poultry market constitutes 98% of total sales since most consumers prefer freshly culled chicken meat. Processed chicken meat production comprises 2% of total production, out of which only an estimated one per cent undergoes processing into value-added products that are ready-to-eat or ready-to-cook. The recent emergence of supermarkets and shopping malls has been supporting the growth in the retailing of chilled and frozen poultry products. In addition to five modern integrated poultry processing plants producing dressed chicken, chicken cut parts and other chicken products, there are number of small poultry dressing plants in the country. The organized sector produces an estimated 70% of the total chicken meat production, and is mainly concentrated in Tamil Nadu, Andhra Pradesh, Maharashtra, Karnataka, and West Bengal. Within the last ten years, many broiler enterprises have vertically integrated their operations (also called integrators), especially in southern and western India. Integrators own all the hatcheries, feed mills, and slaughter facilities, and contract with multiple smaller farmers who raise the chicks to slaughter weight primarily in open air sheds.
RETAIL RESEARCH
RETAIL RESEARCH P a g e | 11
Processed Poultry Food Industry Market Structure There are seven to eight large, organized manufacturers present in Tier 1 and Tier II cities across multiple locations in India. The overall turnover of these leading players is over Rs.100 million. Key players include Venkey’s, Godrej Agrovet, Sumeru, Suguna, Keya and Republic of Chicken. These players have a large number of dealers and distributor networks. There are five to six organized, regional players present in Tier 1 and Tier II cities across multiple locations in India, who have strong presences in particular cities or regions. Key players include Skylark, Baramati Agro, and Aarambagh. These players have a limited network of dealers across cities. There are few importers present in India, with the key player being Fortune Gourmet, which is present in Tier 1 and Tier II cities in India. Processed Poultry Production in India The market for processed poultry food in India is estimated at Rs.12 billion, while the market for chilled poultry product is estimated at Rs.5 billion. Chilled whole birds and parts are sold in markets and shops in major cities. Acceptance of chilled meat is higher than that of frozen meat, yet growth in chilled meat consumption may help to accelerate the transition to frozen poultry products. Well-known brands available nationally in the frozen poultry meat category include Venkey’s, Yummiez, Sumeru Suguna, Keya and Republic of Chicken. Fresh poultry meat brands available in only certain markets include Real Good Chicken, Zorabian, Suguna and Venkey’s. Processed Poultry Meat: Processed and Raw Food Market in India Within processed poultry meat production, domestic sales account for 79% while exports account for 21%. 67% of processed poultry meat production is raw, while 33% consists of value added products. In addition, 63% of all domestic processed poultry is chilled while 37% is frozen. In recent years, the demand for frozen or chilled meat products from hotels, fast food restaurant chains and urban consumers has been rising. Suguna, India’s largest integrated poultry operator, is known for its chicken products and focuses on retail andHoReCa as its major consumer segments besides also catering to other segments such as the armed forces and other institutions like KFC, Marry Brown, Vista and Nando’s. Venky’s, Saguna, Zorabian, Meatzza, Sumeru and Yummiez, with an anticipated combined retail value share of 80%, were the leading brands in the frozen processed poultry market. Value added products and raw products account for 40% and 60% of the overall retail market, which is valued at Rs 3.38 billion, respectively. Out of the overall retail market for processed poultry raw, which is worth Rs 2.02 billion, modern trade and traditional trade comprise 23% and 77%, respectively. Out of the overall retail market for processed poultry value added, worth Rs 1.36 billion, modern trade and traditional trade comprise 86% and 14%, respectively.
Key Concerns Unfavourable local and global weather patterns may have an adverse effect on the business, results of operations and financial condition: As an agri-based company, GAL businesses are sensitive to weather conditions, including extremes such as drought and natural disasters. There is growing concern that carbon dioxide and other greenhouse gases in the atmosphere may have an adverse impact on global temperatures, weather patterns and the frequency and severity of extreme weather and natural disasters. The availability of raw materials that it require for its operations and the demand for its products may be adversely affected by longer than usual periods of heavy rainfall in certain regions or a drought in India caused by weather patterns such as the El Nino. Adverse weather conditions may also cause volatility in the prices of commodities, which may affect growers’ decisions about the types and quantum of crops to plant and may consequently affect the sales of its crop protection products. Consequently, the occurrence of any such unfavourable weather patterns may adversely affect the business, results of operations and financial condition. Operate in five business verticals and inability to manage diversified operations may have an adverse effect on the business: GAL operates in five business verticals, on its own and through its subsidiaries, joint ventures and associates: animal feed, crop protection, oil palm, dairy, and poultry and processed food. As a result of operating such diverse businesses, its management requires considerable expertise and skill to manage and allocate an appropriate amount of time and attention to each business. Operating such diverse businesses also makes forecasting future revenue and operating results difficult, which may impair its operations and ability to assess its prospects. If GAL is unable to manage its diversified operations, its business, results of operations and financial condition may be adversely affected. Derive a significant portion of revenue from animal feed business: GAL derived a significant portion of its revenue from its animal feed business, which primarily comprises the sale of cattle, poultry (broiler and layer), aqua (fish and shrimp) and specialty feed. Consequently, any reduction in demand or a temporary or permanent discontinuation of manufacturing of such products could have an adverse effect on its business, results of operations and financial condition. Do not have long-term agreements with suppliers for raw materials: Each of GAL’s businesses depend on the availability of reasonably priced, high quality raw materials in the quantities required by it. Its animal feed business depends primarily on maize, extractions, animal proteins, molasses, amino acids, vitamins and minerals and other additives, all of which are purchased from the open market. Crop protection business depends on organic chemicals, petroleum solvents, intermediates, fluro chemicals, catalysts, inhibitors, anti– oxidants, solid fuel, fine chemicals phytosterols, vegetable oil extracts and emulsifiers. Dairy business depends on the availability of raw milk, cultures, sugar, flavour, spices, packaging material, stabilizers, preservatives and other additives. Oil palm business depends on oil palm seedlings. For
RETAIL RESEARCH
RETAIL RESEARCH P a g e | 12
poultry and processed foods business, it requires broiler feed, day old chicks and the Vencobb breed of birds, which it sources from one of its competitors. The price and availability of such raw materials depend on several factors beyond its control, including overall economic conditions, production levels, market demand and competition for such materials, production and transportation cost, duties and taxes and trade restrictions. The absence of long-term contracts at fixed prices exposes GAL to volatility in the prices of raw materials that it requires and it may be unable to pass these costs onto its customers, which may reduce the profit margins. Further, it typically rely on third-party transportation providers to supply most of the raw materials and to deliver products to its customers. If, for any reason, primary suppliers of raw materials should curtail or discontinue their delivery of such materials or products to it in the quantities it need, or on commercially acceptable terms, production schedules could be disrupted and its business and results of operations could be adversely affected. Certain of the businesses are subject to seasonal variations that could result in fluctuations in results of operations: GAL’s businesses are subject to seasonal variations. Its animal feed business, it sells lower volumes of cattle feed during the monsoons due to the availability of green fodder. In poultry and processed foods business, the demand for poultry products is higher in the second half of financial year. In dairy business, the supply of raw milk is subject to seasonal factors. In dairy business, the supply of raw milk is subject to seasonal factors. Cattle generally produce more milk in temperate weather, and extreme cold or hot weather could lead to lower than expected production. In oil palm business, a significant share of fresh fruit bunches are harvested in India between May and October. As a result, a substantial share of the income it derives from these products is received during these periods. In crop protection business, its domestic sales tend to be higher during the Kharif season in view of significant application of its product on Kharif crops. As a result of such seasonal fluctuations, its sales and results of operations may vary by fiscal quarter, and the sales and results of operations of any given fiscal quarter may not be relied upon as indicators of the sales or results of operations of other fiscal quarters or of its future performance. If it is unable to introduce new products and respond to changing consumer preferences in a timely and effective manner, the demand for products may decline: The success of GAL’s business depends upon its ability to anticipate and identify changes in consumer preferences and offer products that consumers require. It constantly seeks to develop its research and development capabilities to distinguish itself from its competitors to enable to introduce new products and different variant of its existing products, based on consumer preferences and demand. Although it seeks to identify such trends and introduce new products, it cannot be assured that its products would gain consumer acceptance or that it will be able to successfully compete in such new product segments. The development and commercialization process of a new product would require GAL to spend considerable time and money. Its ongoing investments in research and development for new products and processes may result in higher costs without a proportionate increase in revenues. Delays in any part of the process, its inability to obtain necessary regulatory approvals for its products or failure of a product to be successful at any stage could adversely affect the business. Consequently, any failure on GAL’s part to successfully introduce new products and processes may have an adverse effect on its business, results of operations results and financial condition.
Outbreaks of livestock diseases in general, and poultry and shrimp disease in particular, can significantly restrict the ability to conduct operations: GAL take all reasonable precautions to ensure that its poultry flocks are healthy and that its processing plants and other facilities operates in a hygienic and environmentally sound manner. However, events beyond its control, such as the outbreak of disease, could significantly restrict the ability to conduct its operations. An outbreak of disease could result in governmental restrictions on the import, export and domestic sale of fresh chicken or other products to, or from its suppliers, facilities or customers, or require GAL to destroy one or more of its flocks. This could result in the cancellation of orders by its customers and create adverse publicity that may have a material adverse effect on its ability to market products successfully and on its business, reputation and prospects. Cattle diseases that occur within procurement regions, may also affect GAL’s ability to procure adequate amounts of raw milk for its dairy business. In animal feed business, it has experienced a reduction in the sales of its shrimp feed products in the past on account of early mortality syndrome in shrimps. Consequently, the outbreak of any such diseases in the future may adversely affect its business, results of operations and financial condition. Certain of GAL’s operations are concentrated in the state of Andhra Pradesh and any adverse developments affecting this state could have an adverse effect on the business: Certain of GAL’s operations are concentrated in the state of Andhra Pradesh. For its dairy business, it procure a significant amount of raw milk from various districts in Andhra Pradesh and it also sell a significant portion of its dairy products in Andhra Pradesh. For animal feed business, it manufactured and sell a significant portion of its aqua feed products in Andhra Pradesh. Consequently, any significant social, political or economic disruption, or natural calamities or civil disruptions in the state of Andhra Pradesh, or changes in the policies of the state or local governments of this state or the Government of India, could require GAL to incur significant capital expenditure and change its business strategy. The occurrence of, or inability to effectively respond to any such event, could have an adverse effect on its business, results of operations, financial condition and cash flows A slowdown or shutdown in manufacturing operations or under-utilization of manufacturing facilities could have an adverse effect on business: As of June 30, 2017, GAL conducted its operations through 35 manufacturing facilities for its animal feed business, four facilities for its crop protection business, five palm oil mills for oil palm business, nine milk processing units and one milk powder plant for its dairy business and two processing plants for poultry and processed food business. Its business is dependent upon the ability to manage
RETAIL RESEARCH
RETAIL RESEARCH P a g e | 13
manufacturing facilities, which are subject to various operating risks, including those beyond its control, such as the breakdown and failure of equipment or industrial accidents and severe weather conditions and natural disasters. In addition, GAL may be required to carry out planned shutdowns of its facilities for maintenance, statutory inspections and testing, or may shut down certain facilities for capacity expansion and equipment upgrades. Although it has not experienced any significant disruptions at its manufacturing facilities in the past, it cannot be assured that there will not be any disruptions in its operations in the future. Inability to effectively respond to such events and rectify any disruption, in a timely manner and at an acceptable cost, could lead to the slowdown or shut-down of its operations or the under-utilization of manufacturing facilities, which in turn may have an adverse effect on its business, results of operations and financial condition. Do not own the “Godrej” trademark and logo: GAL do not own the ‘Godrej’ trademark and logo it does not have any licensing arrangement to use the same. In the event it is not able to obtain satisfactory licensing arrangements or other agreement for the ‘Godrej’ trademark and logo, it may have to discontinue the use of the ‘Godrej’ trademark and logo which may materially and adversely affect its reputation, business, financial condition, results of operation and prospects.
Inability to accurately forecast demand or price for products and manage inventory may have an adverse effect on business, results of operations and financial condition: GAL’s businesses depends on its estimate of the demand for its products from customers. If it underestimate demand or have inadequate capacity due to which it is unable to meet the demand for its products, it may manufacture fewer quantities of products than required, which could result in the loss of business. While it forecast the demand and price for its products and accordingly plan production volumes, any error in forecast could result in a reduction in profit margins and surplus stock, which may result in additional storage cost and such surplus stock may not be sold in a timely manner, or at all. Its inability to accurately forecast demand for its products and manage inventory may have an adverse effect on its business, results of operations and financial condition. GAL is subject to extensive government regulation: GAL’s operations are subject to extensive government regulation and it is required to obtain and maintain a number of statutory and regulatory permits and approvals under central, state and local government rules in India, generally for carrying out its business and for each of its manufacturing facilities. It is also required to obtain environmental clearances for the manufacture and sale of certain products. A majority of these approvals are granted for a limited duration. Further, while it has applied for some of these approvals, it cannot be assured that such approvals will be issued or granted to the company in a timely manner, or at all. If it do not receive such approvals or are not able to renew the approvals in a timely manner, its business and operations may be adversely affected. The approvals required by GAL is subject to numerous conditions and it cannot be assured that these would not be suspended or revoked in the event of non-compliance or alleged noncompliance with any terms or conditions thereof, or pursuant to any regulatory action. If there is any failure by GAL to comply with the applicable regulations or if the regulations governing its business are amended, it may incur increased costs, be subject to penalties suffer a disruption in its operations, any of which could adversely affect the business. Operations are hazardous and could expose to the risk of liabilities, loss of revenue and increased expenses: GAL’s operations are subject to various hazards associated with the production of chemical and other products, such as the use, handling, processing, storage and transportation of hazardous materials, as well as accidents such as leakage or spillages of chemicals. Any mishandling of hazardous chemical and poisonous substances could also lead to fatal accidents. In addition, its employees operate heavy machinery at its manufacturing facilities and accidents may occur while operating such machinery. These hazards can cause personal injury and loss of life, severe damage to and destruction of property and equipment, environmental damage and may result in the suspension of operations and the imposition of civil and criminal liabilities. Liabilities incurred as a result of these events has the potential to adversely impact financial position. Events like these could result in liabilities, or adversely affect the reputation with suppliers, customers, regulators, employees and the public, which could in turn affect financial condition and business performance. GAL is subject to business risks inherent to the oil palm industry: GAL is subject to risks inherent to the oil palm industry, including, but not limited to, outbreaks of diseases, damage from pests, fire or other natural disasters, unscheduled interruptions in fresh fruit bunch processing, spills from product carriers or storage tanks and adverse climate conditions. Oil palm business is also subject to a long gestation period of fresh fruit bunch harvesting in India, requiring between three and four years between planting and first harvest, which adversely affects the predictability of its operations. Its ability to mitigate these risks depends on various factors, including ability to keep abreast of the latest technologies related to planting materials, disease prevention and oil palm operations and other developments in the industry, as well as its ability to effectively implement strategies for farmer education. It cannot be assured that it will be able to successfully mitigate the various risks of the oil palm industry or that it will be successful in implementing its strategies to grow oil palm business. Fluctuations in the price of crude palm oil and other oil palm products could adversely affect the business and results of operations: The results of operations of GAL’s oil palm business depends heavily on the price of crude palm oil and oil palm products. Crude palm oil prices are subject to a high degree of volatility and cyclicality. Further, in the event of a significant and prolonged reduction in the prices for crude palm oil and palm-oil based products, farmers may uproot their oil palm crops, which could adversely affect the business and results of operations.
RETAIL RESEARCH
RETAIL RESEARCH P a g e | 14
Rely heavily on existing brands and, specifically, the Godrej brand name: GAL’s brand and reputation are among its most important assets and its brands serve in attracting customers to its products in preference over those of its competitors. The ‘Godrej’ brand commands strong brand recall in India due to its long presence in the Indian market and the diversified businesses in which the group operates. Decrease in product quality due to reasons beyond control or allegations of product defects, even when false or unfounded, could tarnish the image of the established brands and may cause consumers to choose other products. Its reputation and brands could also be affected by socially motivated groups, which could lead to a decline in sales volume. Further, the considerable expansion in the use of social media over recent years has compounded the impact of negative publicity. Consequently, any adverse publicity involving the ‘Godrej’ brand, or GAL’s products may impair reputation, dilute the impact of branding and marketing initiatives and adversely affect the business and its prospects. Competition in the industries in which it operates could result in a reduction in market share: The industries in which GAL operates are intensely competitive. It compete with several regional and local companies, as well as large multi-national companies that are larger and has substantially greater resources than it does, including the ability to spend more on advertising and marketing. It also face competition from new entrants who may have more flexibility in responding to changing business and economic conditions. It expects competition to continue to be intense as its existing competitors expand their operations and introduce new products. Its failure to compete effectively, including any delay in responding to changes in the industry and market, together with increased spending on advertising, may affect the competitiveness of its products, which may result in a decline in revenues and profitability. Of its international competitors may be able to capitalize on their overseas experience to compete in the Indian market. As a result, GAL cannot assure that it will be able to compete successfully in the future against its existing or potential competitors or that its business and results of operations will not be adversely affected by increased competition.
If GAL pursue strategic acquisitions or joint ventures, it may not be able to successfully consummate favourable transactions or successfully integrate acquired businesses: From time to time, GAL may evaluate potential acquisitions or joint ventures that would further its strategic objectives. It has also formed joint ventures for its animal feed business in Bangladesh and for poultry and processed foods business. However, it may not be able to identify suitable companies, consummate a transaction on terms that are favourable to it, or achieve expected returns and other benefits as a result of integration challenges or anti-monopoly regulations. Companies or operations acquired or joint ventures created by GAL may not be profitable or may not achieve sales levels and profitability that justify the investments made. Future acquisitions could also result in potentially dilutive issuances of equity securities; the incurrence of debt, contingent liabilities and increased operating expenses, all of which could adversely affect the business, financial condition, results of operations and prospects. Profit & Loss Rs in million
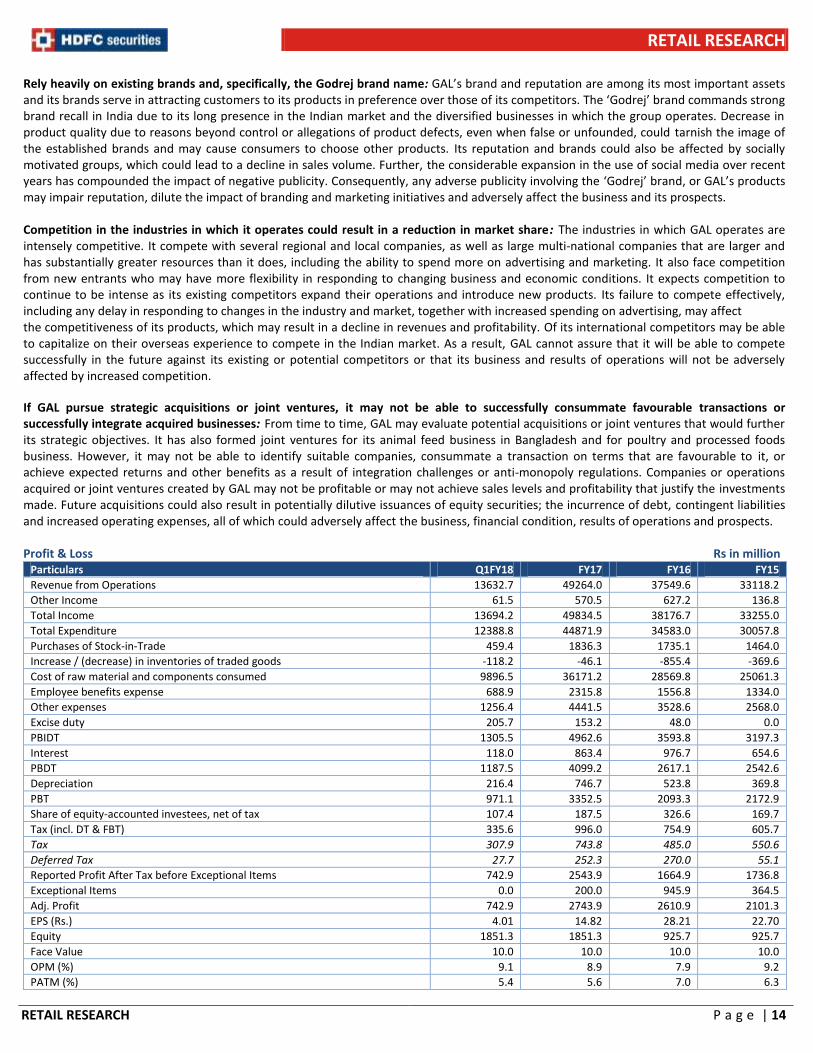
Particulars Q1FY18 FY17 FY16 FY15
Revenue from Operations 13632.7 49264.0 37549.6 33118.2
Other Income 61.5 570.5 627.2 136.8
Total Income 13694.2 49834.5 38176.7 33255.0
Total Expenditure 12388.8 44871.9 34583.0 30057.8
Purchases of Stock-in-Trade 459.4 1836.3 1735.1 1464.0
Increase / (decrease) in inventories of traded goods -118.2 -46.1 -855.4 -369.6
Cost of raw material and components consumed 9896.5 36171.2 28569.8 25061.3
Employee benefits expense 688.9 2315.8 1556.8 1334.0
Other expenses 1256.4 4441.5 3528.6 2568.0
Excise duty 205.7 153.2 48.0 0.0
PBIDT 1305.5 4962.6 3593.8 3197.3
Interest 118.0 863.4 976.7 654.6
PBDT 1187.5 4099.2 2617.1 2542.6
Depreciation 216.4 746.7 523.8 369.8
PBT 971.1 3352.5 2093.3 2172.9
Share of equity-accounted investees, net of tax 107.4 187.5 326.6 169.7
Tax (incl. DT & FBT) 335.6 996.0 754.9 605.7
Tax 307.9 743.8 485.0 550.6
Deferred Tax 27.7 252.3 270.0 55.1
Reported Profit After Tax before Exceptional Items 742.9 2543.9 1664.9 1736.8
Exceptional Items 0.0 200.0 945.9 364.5
Adj. Profit 742.9 2743.9 2610.9 2101.3
EPS (Rs.) 4.01 14.82 28.21 22.70
Equity 1851.3 1851.3 925.7 925.7
Face Value 10.0 10.0 10.0 10.0
OPM (%) 9.1 8.9 7.9 9.2
PATM (%) 5.4 5.6 7.0 6.3
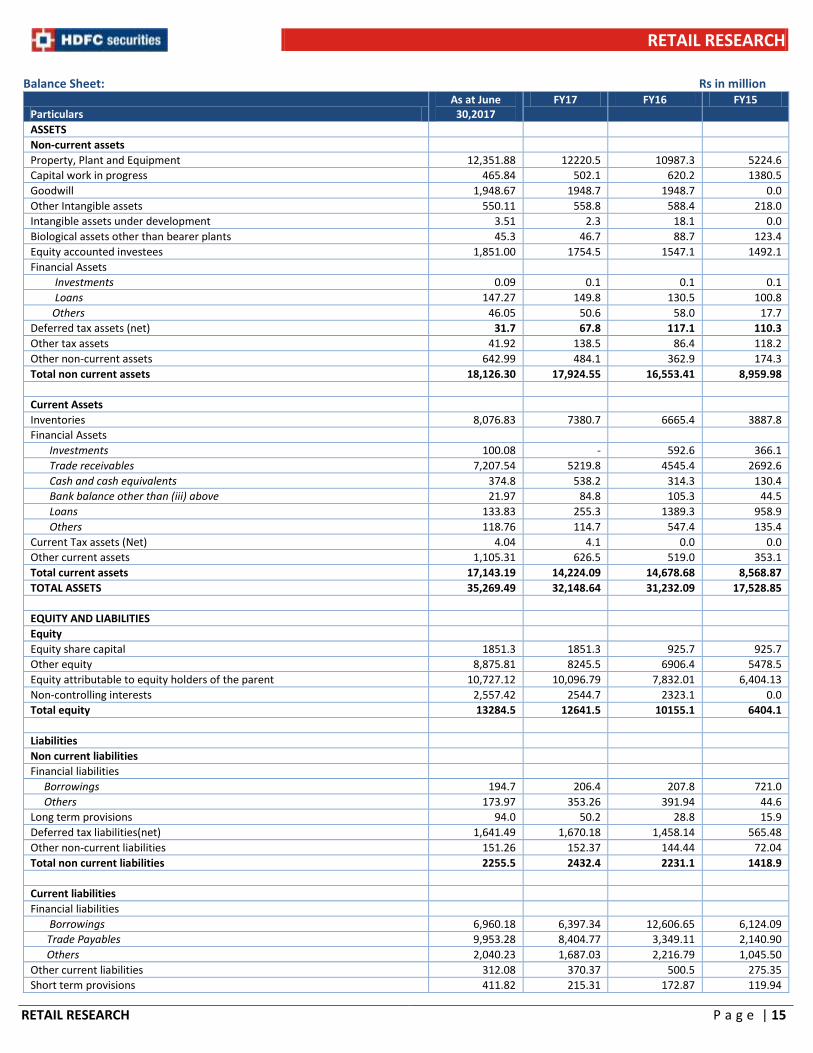
RETAIL RESEARCH
RETAIL RESEARCH P a g e | 15
Balance Sheet: Rs in million
Particulars As at June
30,2017 FY17 FY16 FY15
ASSETS Non-current assets Property, Plant and Equipment 12,351.88 12220.5 10987.3 5224.6
Capital work in progress 465.84 502.1 620.2 1380.5
Goodwill 1,948.67 1948.7 1948.7 0.0
Other Intangible assets 550.11 558.8 588.4 218.0
Intangible assets under development 3.51 2.3 18.1 0.0
Biological assets other than bearer plants 45.3 46.7 88.7 123.4
Equity accounted investees 1,851.00 1754.5 1547.1 1492.1
Financial Assets Investments 0.09 0.1 0.1 0.1
Loans 147.27 149.8 130.5 100.8
Others 46.05 50.6 58.0 17.7
Deferred tax assets (net) 31.7 67.8 117.1 110.3
Other tax assets 41.92 138.5 86.4 118.2
Other non-current assets 642.99 484.1 362.9 174.3
Total non current assets 18,126.30 17,924.55 16,553.41 8,959.98
Current Assets Inventories 8,076.83 7380.7 6665.4 3887.8
Financial Assets Investments 100.08 - 592.6 366.1
Trade receivables 7,207.54 5219.8 4545.4 2692.6
Cash and cash equivalents 374.8 538.2 314.3 130.4
Bank balance other than (iii) above 21.97 84.8 105.3 44.5
Loans 133.83 255.3 1389.3 958.9
Others 118.76 114.7 547.4 135.4
Current Tax assets (Net) 4.04 4.1 0.0 0.0
Other current assets 1,105.31 626.5 519.0 353.1
Total current assets 17,143.19 14,224.09 14,678.68 8,568.87
TOTAL ASSETS 35,269.49 32,148.64 31,232.09 17,528.85
EQUITY AND LIABILITIES Equity Equity share capital 1851.3 1851.3 925.7 925.7
Other equity 8,875.81 8245.5 6906.4 5478.5
Equity attributable to equity holders of the parent 10,727.12 10,096.79 7,832.01 6,404.13
Non-controlling interests 2,557.42 2544.7 2323.1 0.0
Total equity 13284.5 12641.5 10155.1 6404.1
Liabilities Non current liabilities Financial liabilities Borrowings 194.7 206.4 207.8 721.0
Others 173.97 353.26 391.94 44.6
Long term provisions 94.0 50.2 28.8 15.9
Deferred tax liabilities(net) 1,641.49 1,670.18 1,458.14 565.48
Other non-current liabilities 151.26 152.37 144.44 72.04
Total non current liabilities 2255.5 2432.4 2231.1 1418.9
Current liabilities Financial liabilities Borrowings 6,960.18 6,397.34 12,606.65 6,124.09
Trade Payables 9,953.28 8,404.77 3,349.11 2,140.90
Others 2,040.23 1,687.03 2,216.79 1,045.50
Other current liabilities 312.08 370.37 500.5 275.35
Short term provisions 411.82 215.31 172.87 119.94
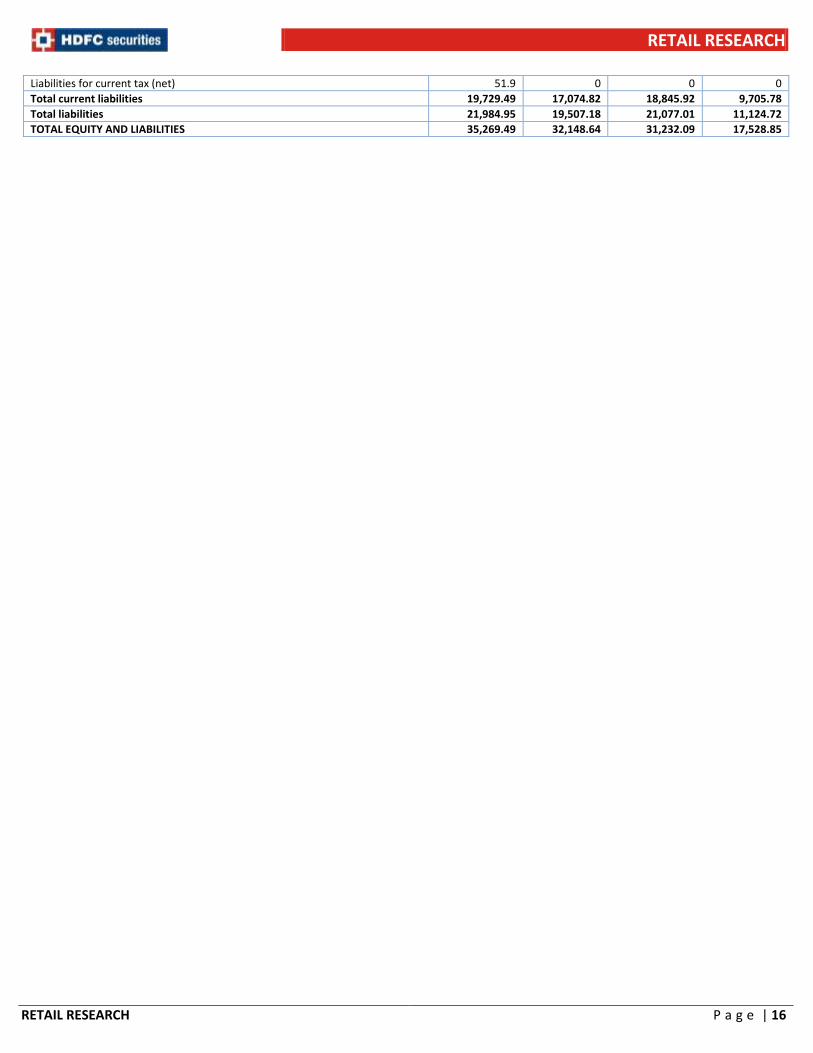
RETAIL RESEARCH
RETAIL RESEARCH P a g e | 16
Liabilities for current tax (net) 51.9 0 0 0
Total current liabilities 19,729.49 17,074.82 18,845.92 9,705.78
Total liabilities 21,984.95 19,507.18 21,077.01 11,124.72
TOTAL EQUITY AND LIABILITIES 35,269.49 32,148.64 31,232.09 17,528.85
RETAIL RESEARCH
RETAIL RESEARCH P a g e | 17
HDFC securities Limited, I Think Techno Campus, Building - B, "Alpha", Office Floor 8, Near Kanjurmarg Station, Opp. Crompton Greaves, Kanjurmarg (East), Mumbai 400 042 Phone: (022) 3075 3400 Fax: (022) 2496 5066 Compliance Officer: Binkle R. Oza Email: [email protected] Phone: (022) 3045 3600 HDFC Securities Limited (HSL) is a SEBI Registered Research Analyst having registration no. INH000002475. Disclaimer: This report has been prepared by HDFC Securities Ltd and is meant for sole use by the recipient and not for circulation. The information and opinions contained herein have been compiled or arrived at, based upon information obtained in good faith from sources believed to be reliable. Such information has not been independently verified and no guaranty, representation of warranty, express or implied, is made as to its accuracy, completeness or correctness. All such information and opinions are subject to change without notice. This document is for information purposes only. Descriptions of any company or companies or their securities mentioned herein are not intended to be complete and this document is not, and should not be construed as an offer or solicitation of an offer, to buy or sell any securities or other financial instruments. This report is not directed to, or intended for display, downloading, printing, reproducing or for distribution to or use by, any person or entity who is a citizen or resident or located in any locality, state, country or other jurisdiction where such distribution, publication, reproduction, availability or use would be contrary to law or regulation or what would subject HSL or its affiliates to any registration or licensing requirement within such jurisdiction. If this report is inadvertently send or has reached any individual in such country, especially, USA, the same may be ignored and brought to the attention of the sender. This document may not be reproduced, distributed or published for any purposes without prior written approval of HSL. Foreign currencies denominated securities, wherever mentioned, are subject to exchange rate fluctuations, which could have an adverse effect on their value or price, or the income derived from them. In addition, investors in securities such as ADRs, the values of which are influenced by foreign currencies effectively assume currency risk. It should not be considered to be taken as an offer to sell or a solicitation to buy any security. HSL may from time to time solicit from, or perform broking, or other services for, any company mentioned in this mail and/or its attachments. HSL and its affiliated company(ies), their directors and employees may; (a) from time to time, have a long or short position in, and buy or sell the securities of the company(ies) mentioned herein or (b) be engaged in any other transaction involving such securities and earn brokerage or other compensation or act as a market maker in the financial instruments of the company(ies) discussed herein or act as an advisor or lender/borrower to such company(ies) or may have any other potential conflict of interests with respect to any recommendation and other related information and opinions. HSL, its directors, analysts or employees do not take any responsibility, financial or otherwise, of the losses or the damages sustained due to the investments made or any action taken on basis of this report, including but not restricted to, fluctuation in the prices of shares and bonds, changes in the currency rates, diminution in the NAVs, reduction in the dividend or income, etc. HSL and other group companies, its directors, associates, employees may have various positions in any of the stocks, securities and financial instruments dealt in the report, or may make sell or purchase or other deals in these securities from time to time or may deal in other securities of the companies / organizations described in this report. HSL or its associates might have managed or co-managed public offering of securities for the subject company or might have been mandated by the subject company for any other assignment in the past twelve months. HSL or its associates might have received any compensation from the companies mentioned in the report during the period preceding twelve months from t date of this report for services in respect of managing or co-managing public offerings, corporate finance, investment banking or merchant banking, brokerage services or other advisory service in a merger or specific transaction in the normal course of business. HSL or its analysts did not receive any compensation or other benefits from the companies mentioned in the report or third party in connection with preparation of the research report. Accordingly, neither HSL nor Research Analysts have any material conflict of interest at the time of publication of this report. Compensation of our Research Analysts is not based on any specific merchant banking, investment banking or brokerage service transactions. HSL may have issued other reports that are inconsistent with and reach different conclusion from the information presented in this report. Research entity has not been engaged in market making activity for the subject company. Research analyst has not served as an officer, director or employee of the subject company. We have not received any compensation/benefits from the subject company or third party in connection with the Research Report. This report is intended for non-Institutional Clients only. The views and opinions expressed in this report may at times be contrary to or not in consonance with those of Institutional Research or PCG Research teams of HDFC Securities Ltd. and/or may have different time horizons. HDFC Securities Limited, SEBI Reg. No.: NSE-INB/F/E 231109431, BSE-INB/F 011109437, AMFI Reg. No. ARN: 13549, PFRDA Reg. No. POP: 04102015, IRDA Corporate Agent License No.: HDF 2806925/HDF C000222657, SEBI Research Analyst Reg. No.: INH000002475, CIN - U67120MH2000PLC152193 Disclaimer: HDFC Bank (a shareholder in HDFC Securities Ltd) is associated with this issue in the capacity of Escrow collection Bank, Refund Bank , Public Issue Bank and monitoring agency and will earn fees for its services. This report is prepared in the normal course, solely upon information generally available to the public. No representation is made that it is accurate or complete. Notwithstanding that HDFC Bank is acting for Godrej Agrovet Ltd, this report is not issued with the authority of Godrej Agrovet Ltd. Readers of this report are advised to take an informed decision on the issue after independent verification and analysis.