Globalization and the Labor Market David G....
87
12:13 PM 9/18/00 Globalization and the Labor Market David G. Blanchflower Department of Economics Dartmouth College and NBER Monday, September 18, 2000 Commissioned by the Trade Deficit Review Commission (http://www.ustdrc.gov ) Contact address: Department of Economics, Dartmouth College, Hanover, NH 03755. Email: [email protected] . I thank Allan Mendelowitz and Matt Slaughter for helpful comments. All opinions and errors are mine.
Transcript of Globalization and the Labor Market David G....

12:13 PM 9/18/00
Globalization and the Labor Market
David G. Blanchflower
Department of Economics Dartmouth College and NBER
Monday, September 18, 2000
Commissioned by the Trade Deficit Review Commission (http://www.ustdrc.gov)
Contact address: Department of Economics, Dartmouth College, Hanover, NH 03755.
Email: [email protected].
I thank Allan Mendelowitz and Matt Slaughter for helpful comments. All opinions and errors are mine.

1
In this paper I survey the effects of international trade and other influences on the
US labor market. First, I examine the move toward globalization and its various
manifestations. Second, I trace out the main labor market changes that have occurred
over the last two or three decades – declines in manufacturing and industrial employment
and in the demand for less skilled workers along with increases in earnings inequality and
slow real earnings growth. I then move on to examine the extent to which increases in
international trade, especially from Less Developed Countries (LDCs), have contributed
to these phenomena. Rather than emphasize the theoretical and technical basis for such
calculations I concentrate on surveying the empirical evidence that has considered the
importance of trade flows1. That is not my comparative advantage, rather I will describe
a number of empirical strategies that have been used to tease out any labor market
effects2. The conclusion I reach is that no matter which of these methods is used, it does
not appear that globalization is the smoking gun. It is appropriate then to look elsewhere
for the culprit. There is no single factor, but it seems that several influences have been at
work -- technological change; immigration; declining unionization; declining levels of the
real minimum wage as well as reductions in the supply of college-educated workers.
1. Globalization
Concerns about globalization – the increasing international integration of markets
for goods, factors and technology – are widespread. Globalization has arisen both
through an increased trade in goods plus easier movements of factors of production –
1 The interested reader is referred to papers by Deardorff and Haikura (1994) and Johnson and Stafford (1999) for a theoretical treatment. 2 A number of earlier papers have also surveyed the empirical literature on how the ‘openness’ of an economy affects a country’s labor market (e.g. Blanchflower and Slaughter, 1999; Katz and Autor, 1999; Slaughter and Swagel, 1997; Gottschalk, 1997 and Levy and Murnane, 1992).

2
capital and labor – across national boundaries. The United Nations (1999) recently
identified a number of fascinating features about the expansion of world trade.
1. World exports of goods and services almost tripled between the 1970s and 1997 in real
terms.
2. Foreign direct investment topped $400 billion in 1997; seven times the level in real
terms in the 1970s.
3. The daily turnover in foreign exchange markets increased from around $10-20 billion
in the 1970s to $1.5 trillion in 1998.
4. Between 1983 and 1993 cross-border sale of US Treasury bonds increased from $30
billion a year to $500 billion.
5. Portfolio and other short-term capital flows in gross terms at the end of the 1990s
totaled more than $2 trillion – almost three times the level in the 1980s.
6. People travel more – tourism increased from 260 million travelers a year in 1980 to
590 million in 1996. The number of international tourism departures in the US between
1985 and 1995 increased 46%.
7. Time spent on international phone calls increased from 33 billion minutes in 1990 to
70 billion minutes in 1996.
8. International bank lending grew from $265 billion in 1975 to $4.2 trillion in 1994.
Table 1 presents evidence on the growth of US international trade in goods and
services from 1960-1999. The growth in the size of the trade balance deficit in goods
from around 1983 is particularly notable. Alongside that is the growing surplus in
services from approximately 1988. It should be pointed out, however, that Krugman
(1995) and Irwin (1995) have both noted that only since the 1970s has the flow of trade
achieved the levels pertaining at the end of the nineteenth century. Table 2 shows that for

3
the US the degree of openness ((exports+imports/2)/GDP) was approximately the same in
1973 as it was in 1913 (Johnson and Stafford, 1999). The long run trend in trade (1913-
1992) is also flat for a few other advanced countries, (Australia, Denmark, Finland,
Switzerland and the UK). Japan was less open to trade at the end of the century than at
the beginning. The major growth in openness in the US has occurred since 1973.
Interestingly, only a few of the advanced countries have had a substantial growth in
openness from 1973-1992 – the main exceptions are Belgium, Finland, the Netherlands
and West Germany. By the end of the period there remain considerable differences
between countries in their degrees of openness, ranging from the least open (Japan and
the USA) to the most open (Belgium and the Netherlands)3. Over the period 1973-1992
Canada and the US had the same increase in the degree of openness (+4.1%): as we show
later, they had very different labor market outcomes over these years. Even though the
US has seen a large proportionate growth in its degree of openness, the level of trade is
still very low by international standards4. However, looking at just imports and exports
divided by GDP tells us little about how open an economy is with respect to the ease of
entry for imports or FDI. Looked at in terms of ease of entry, the U.S. is clearly a much
more open economy than Japan. And, this de facto openness is critical to the extent to
which trade may influence outcomes in the economy. Some qualification is needed to
explain the limits of the cited openness measure. In the case of the EU countries, when
looking at exports and imports and making international comparisons, there is a fairly
sound basis for counting intra-EU trade as “domestic” rather than international trade.
When this is done, the import and export data of the major EU countries do not look that
different than the United States.
3 As Johnson and Stafford note (1999, p.2218), such differences arise due to the close proximity of trading partners in the cases of Belgium and the Netherlands because of low transport costs via rail and water to these trading partners, and a supportive financial infrastructure while a large country like the US has sufficient intra-country variability to promote internal trade. 4 I am grateful to Allan Mendelowitz for this point.

4
Concerns about the growing influence of trade (exports or imports or both
together), with less-developed countries (LDCs) is also particularly widespread in the US.
Borjas et al (1997) show that US manufacturing imports from less developed countries
have grown substantially over the last thirty years: 0.8% of GNP in 1970 to 2.3% in 1980
to 2.8% in 1990 and 4.1% in 1996. As can be seen from Table 3, the proportion of
manufactured imports that comes from developing countries continues to rise. In 1991
imports from developing countries accounted for 35% of imports compared with 44% in
1998. The main developing countries that have seen substantial increases in their share
of imports during the 1990s are Mexico and China (Table 4). In 1991 Mexico accounted
for 5.09% of the value of all imports compared with 8.92% in 1999: China had 3.1% in
1991 and 6.65% in 1999. There is some evidence that across countries from 1970-1990
the change in net imports of manufactures from developing countries is negatively
correlated with changes in the share of manufacturing in total employment (Wood, 1995).
However, the numbers are small – the largest rise in developing country net import
penetration ([imports minus exports]/GDP) across a group of advanced countries
examined by Wood was not much over 2% and the average about 1%. The fact that trade
with developing countries is such a small proportion of GDP is emphasized by
economists who dismiss the influence of trade. We return to this point below.
Table 5 examines changes in the source of imports for the US as well as
separately for Japan, Europe and the OECD as a whole. Source countries for these
imports are distinguished within the OECD (Europe, North America and Other) and from
non-OECD countries, separately for the Dynamic Asian Economies (DAE’s)5 and China
and OPEC. Four main findings emerge from this table.
5 The Dynamic Asian Economies are Chinese Taipei; Hong Kong; Korea; Malaysia; Singapore and Thailand.

5
1. US imports from the DAE’s and China have risen dramatically in the years between
1962 and 1998 (0.14% of GDP in 1962 to 2.03% in 1998). The European Union has seen
a large increase in its trade with these countries (0.26% in 1962 to 1.49% in 1998).
2. By 1998 the US and Japan had a similar percentage of their imports from the DAE’s
and China (2.03% of GDP for the US compared with 1.98% for Japan). By 1998 overall
imports from non-OECD countries also account for a similar percentage of nominal GDP
in the two countries (3.4% and 3.5% respectively).
3. Increases in the price of oil in the 1970s and 1980s raised the share of imports from
OPEC countries to all areas but particularly to Japan.
4. Excluding the trade with OPEC countries, the European has a higher proportion of
imports from non-OECD countries – that are primarily developing – than does the USA
or Japan. In 1962 the USA had imports valued at 0.76% of GDP from non-OECD
countries compared with 2.71% in 1993: Europe had 3.08% compared with 3.42% in
1993.
To summarize, the US has seen a growth in its trade deficit since 1983. Imports
from developing countries have grown particularly rapidly. However, even after this
increase in trade, by international standards the US is a relatively closed economy.
There seems to be little doubt that a process of globalization is taking place.
What are its consequences for the US? Are they as large as Ross Perot or Pat Buchanan
would have us believe? Is the solution to the country’s ills to become more protectionist?
At the same time as there has been a rapid increase in international trade there have been
a number of important changes in the labor market. Is the fact that these changes have
coincided with one another a coincidence or is there something causal? First we need to
identify what labor market changes have occurred. We do so in the next section. In the

6
following section we look at the relationship between the growth of international trade
and its consequences (if any) in the labor market. Alternative explanations are also
examined in subsequent sections.
2. Labor market changes
Over the last few decades increases in globalization have been accompanied in the
US by four main labor market trends – declines in manufacturing and industrial
employment and in the demand for less skilled workers along with increases in earnings
inequality and slow real earnings growth especially at the low end of the earnings
distribution6. The first two of these are found in most OECD countries. The combination
of rapidly rising earnings inequality and low real wage growth are essentially a US
phenomenon. The UK also experienced rapidly rising earnings inequality but had strong
real wage growth across the earnings distribution. In many countries that did not
experience growth in earnings inequality, unemployment increased in its place. However,
there are a number of countries that experienced neither rising inequality nor increased
unemployment. Examples are Denmark, the Netherlands and Norway, all of which are
small, highly open, economies. I will consider each of these labor market trends in turn.
2.1. A decline in manufacturing and industrial employment,
In comparison with employment in services there has been a relative decline in
industrial employment in most advanced countries and been an absolute decline in
numbers in many. Table 6 illustrates. Column 1 shows the percentage change in the
number of workers employed in industry in 1998 compared to the starting year of 1970.
The absolute number of industrial workers declined in a majority of countries -- the main
6 As might be expected, changes in earnings closely track changes in income because for most people their wages are their primary, and often only, income source.

7
exceptions are Canada, Greece, Iceland, Japan, Portugal, USA and Turkey. As a
proportion of total employment, industrial employment fell in virtually all countries from
1970-1998 (columns 2 and 5) with the exceptions of only Portugal (+15%) and Turkey
(+45.1%). Within the OECD industrial employment as a percentage of total employment
fell by nearly a quarter over these years.
It does appear that the movement of workers out of manufacturing to sectors with
higher levels of skill intensity has some part to play in the decline in the demand for less
skilled workers. But, as Katz and Autor (1999) have noted, the rate of between-industry
shifts did not seem to show any rapid acceleration in the 1980s compared to other recent
decades when, as we will show below, there was the most rapid rise in US earnings
inequality.
2.2. A decline in the demand for less skilled workers.
Over the last few decades in the US there has been an increase in the levels of
skills required by workers. This has been particularly true in US manufacturing, which is
the branch of the economy for which trade and foreign outsourcing are most important7.
relative demand shifts to skilled workers. However, ‘upskilling’ has occurred in all
industries, tradeable and nontradeable. This in combination with the fact that the volume
of trade is quite small suggests that the source of most of the observed demand shifts is
something other than globalization.
A number of studies point to big declines in the proportion of production workers
employed in manufacturing over this period8. Figure 1 shows that the trend in the
7 Murphy and Welch (1993) argue that over 20% of the total skill upgrading in the 1980s occurred in manufacturing. 8 Examples include Berman, Bound and Griliches (1994), Sachs and Shatz (1994), Lawrence and Slaughter (1993).

8
proportion of production workers was essentially flat during the 1920’s and 1930’s, but
then had a quick decline in its share of total manufacturing employment from 1925-1930.
This was then followed by a steady increase of approximately ten percentage points from
1930 to the mid 1940s. From the end of WW2 the share of production workers fell
steadily until the early 1980s: the share of production workers fell from nearly 86.1% in
1943 to 67.8% in 1982, a fall of just over 18 percentage points. What is less well known
is that, since the early 1980s the proportion of production workers has remained roughly
constant: by 1999, 68.7% of manufacturing employees were production workers. In part
this is probably driven by the Clinton boom of the 1990s, as it is well known that the
fraction of employment that is production is pro-cyclical, since production employment is
more cyclically sensitive than non-production employment (Berman, Bound and
Griliches, 1994). However this does not explain why the seemingly inexorable decline in
the share of production workers in total manufacturing employment was apparently halted
during the 1980s. It is unclear what explains this reversal. It could have arisen because
in the 1990s firms were increasingly outsourcing non-production intensive activities to
contractors. Another possibility is that computer use initially boosted skilled labor
demand but is now raising the demand for unskilled labor. The documented change may
be a statistical illusion reflecting the fact that ongoing skill upgrading is resulting in the
production/non-production split being a worse and worse measure of skills.
Another way to measure the intensity of low-skill production is to look at
employment to population rates by level of education and gender. Table 7 shows the
decline in the relative employment of the least educated over the last two decades for the

9
US and a number of OECD countries9. This table makes clear that there are marked
differences by gender across countries. Employment-population rates fell for both low
and highly educated men in all of the countries reported except Portugal10. In most of the
countries the employment-population rates of low-educated men declined more than was
the case for high-educated men. In a number of countries, however, the employment-
population rate for women rose for both low and the high education group (e.g. USA,
Australia, New Zealand and Sweden). Relative to high-educated women, the
employment-population rates of low-educated women deteriorated in the USA, Canada,
Denmark, Finland, France, New Zealand, Norway, Portugal, and the UK, but improved in
Australia, Austria, Belgium, Italy and Spain. As we show below, there are a number of
other important differences between the male and female labor markets in virtually all
advanced countries.
2.3. A widening of earnings and income inequality and sluggish real wage growth.
Since the early 1970's earnings in the US have become much more unequal
between more-skilled and less-skilled workers as well as between workers with high and
low levels of education and those with many years of labor market experience compared
to those with few11. For example, in 1979 male college-educated workers earned on
average 30% more than male high-school-educated workers. By 1995 this premium for
college-educated workers had risen to about 70%. Table 8 shows the increase in earnings
inequality that has occurred since the 1960s. An increase in the standard deviation of the
log of weekly wages suggests a widening of the income distribution for both men and
9 The exact dates vary by country. 10 The results are similar when unemployment rates are examined: see OECD, 1997. 11 For discussions of changes in income and earnings inequality in earlier periods in a number of countries see Phelps Brown (1977, 1988).

10
women. The most rapid changes that have occurred have been at the tails of the wage
distribution, hence in the last three columns of the table differences between the earnings
of individuals at the 10th, 50th (median) and 90th percentile are compared. In 1963 an
male at the 90th percentile earned 3.3 times those of an individual at the 10th percentile12.
By 1995 the gap had increased to 4.7 times. Further, the weekly earnings of workers at
the 90th percentile of the wage distribution increased by over 25 log points (28%)
compared with workers at the 10th percentile between 1979 and 1995 (Table 8)13. Over
these years the ratio of the earnings of a worker at the ninth decile compared with a
worker at the median rose by about a quarter. However, earnings at the median compared
with those at the tenth percentile only grew by about 12%. The gap between the earnings
of those at the top of the distribution and the rest has thus widened considerably over
time.
Figure 2 and Table 814 suggests that the most rapid rise in wage inequality
occurred in the years since 1979, and especially from 1979-1987, for both men and
women. On the vertical axis is the 90-10 log weekly wage differential plotted as in the
second row of Table 8 but now for each year. The widening of the wage distribution
appears to have slowed but not reversed itself into the 1990’s.
The main findings about changes in earnings inequality have come from
observations of the labor market earnings of millions of individuals in various data
12 To get the percentage change take the log points (1.19) and take natural anti-logs and deduct one = 3.29. 13 These data are taken from Katz and Autor (1999) who use the March files from the Current population Survey. The wage data are taken from the 1964-1996 surveys and relate to the years 1963-19995 because they relate to the year prior to interview (see Blanchflower and Oswald, 1994 for further details). The data relate to full-time, full-year wage and salary workers, working 35 hours or more a week and at least 40 weeks in the previous calendar year. The sample is further restricted to individuals prior to retirement age (19-65) without allocated earnings, who earned at least $67 per week in 1982 dollars. Weekly earnings are imputed by multiplying the value by 1.5.

11
sources. Katz and Autor (1999) make it quite clear that the wage trends that are identified
are robust across data sources including the March Current Population Surveys, Census
PUMS and the CPS May Samples and Outgoing Rotation Group files. Similar data files
are available in many other advanced countries, and there has been a growing effort to
compare and contrast the evidence for those countries with those for the United States
(for some of these papers see Freeman and Katz, 1995, and OECD, 1996).
Wages are only a part of the total compensation package: non-wage benefits such
as employer pension contributions, employer provided health insurance represent a large
part of total compensation, and especially so for those high up the earnings distribution.
Pierce (1997), for example, estimates that non-wage compensation amounted to 27.3% of
total employer compensation costs in 1994. There is evidence that “changes in the
distribution of non-wage benefits and non-pecuniary workplace amenities tend to
reinforce rather than offset observed increases in US wage inequality” (Katz and Autor,
1999, p. 1489). This is primarily due to the decline over time in the likelihood of
coverage of the least educated and low wage workers. Pierce (1997) finds that
compensation inequality is greater than wage inequality: a 90-10 log hourly compensation
differential of 1.75 in 1994 compared with a 90-10 log hourly wage differential of 1.57.
He also finds a greater rise in compensation inequality over the period 1986-1994 than
was found in wage inequality. Hamermesh (1999) has found evidence that industries
between from 1979 to 1995 that have had rising relative earnings have had declining
injuries. Also he has found that the incidence of work at unattractive hours has increased
relatively for low paid workers. Farber and Levy (2000) show that between 1979 and
14 The source for both this figure and table as well as figures 3-5 is Katz and Autor (1999). I am grateful to Larry Katz for providing me with these figures
12
1997 the proportion of workers who were high school dropouts that had health insurance
fell from 67% to 50% compared with a decline from 85% to 76% for college graduates.
Bloom and Freeman (1992) also report declines in pension coverage for those at the
lower part of the earnings distribution.
A similar picture is found when data on income, rather than on labor market
earnings or total compensation, are examined. Examples of papers that look at changes in
the income distribution are Blackburn and Bloom (1994), Gottschalk (1995, 1997);
Gottschalk and Smeeding (1997); Karoly (1994); Atkinson (1996); Feldstein (1998);
Hoxby and Terry (1999); Deaton (1999). Most people have small levels of savings
(Browning and Lusardi, 1996) and hence for them earnings are a very large component of
total income. Analyzing income rather than earnings has the benefit though that non-
wage income such as the Earned Income Tax Credit, food stamps, dividend income etc.
can be included. When income measures are examined the unit of observation often
moves from the individual to the household or the family. Gottschalk (1993) has
summarized well why changes in the earnings and income distributions have moved quite
closely together.
“Changes in the distribution of other family members’ earnings and other private and public income sources were not sufficient to offset the increase in inequality of heads of households. While the earnings of spouses were mildly equalizing, their impact did not offset the trends in male earnings inequality. Furthermore, government tax and transfer policies did little to offset the increase in earnings inequality. As a result of the retrenchment in transfer policy, government actions failed to change significantly the underlying trend toward greater inequality. (1993, p.136) The rise in U.S. earnings and income inequality is indeed far from being a global
phenomenon. While many OECD countries experienced increases in earnings inequality
during the 1980s, with the exception of the United Kingdom, the orders of magnitude
13
were well below those experienced in the U.S. It should also be noted that the rise in
U.S. inequality appears to pre-date increases occurring elsewhere. Table 9 reports the
ratios of earnings at the ninth decile to the median and the median to the first decile for
men for the years 1979, 1985 and 1994/5. Only the United Kingdom and the United
States have continued to experience a rapid rise in inequality into the 1990s, albeit it at a
slower rate than had occurred in the 1980s. With the exception of Germany and Norway,
earnings dispersion increases at the top of the earnings distribution (D9/D5) from 1973-
1994/5. At the lower part of the distribution, the earnings of the median worker rise a lot
in comparison to the worker at the first decile over the period rise only in the UK and the
USA but actually fall in five countries (Belgium, Finland, France, Germany and
Norway)15. Interestingly, referring back to Table 2, Belgium, Finland, France, and
Germany had some of the largest increases in openness over the period 1973-92.
Other indicators besides those looking at earnings inequality suggest that the US
is much more unequal than other OECD countries. Table 10 provides a number of data
series taken from the 1999 Human Development Report of the UN which provide further
details on the wide levels of inequality that exist in the United States, and to a lesser
extent the UK and New Zealand which both embarked on programs in the 1980s and
1990s to “Americanize” their labor markets16. The first column presents country rankings
for 1997 based on the Human Development Index (HDI). The index attempts to
recognise that human welfare is not adequately captured by GDP per capita. It is a
15 Data on male inequality are not available for Denmark but those for overall inequality for the years 1980-90 are available and also suggest a fall in earnings inequality at the low end between 1980 and 1990 –D5/D1 in 1980=1.41 compared with 1.38 in 1990. There was a small increase at the top end - D9/D5 in 1980=1.52 compared with 1.57 in 1990 (OECD, 1996, Table 3.1). 16 For a discussion of the lack of success of the Thatcher reforms of the UK labor market see Blanchflower and Freeman (1994). Maloney and Savage (1996), Chapple et al (1996) and Maloney (1997, 1998) all document the lack of success of the labor market reforms in New Zealand.

14
composite of three main factors: longevity, knowledge, and standard of living. Longevity
is measured by life expectancy. Knowledge is measured by a combination of adult
literacy (given two-thirds weight) and mean years of schooling (given one-third weight).
Standard of living is measured by real GDP per capita, after adjustment for the local cost
of living as captured by purchasing power parity PPP prices. The three factors are then
averaged to form the HDI index. On the HDI the US is ranked third, behind Canada and
Norway despite the fact that the US ranks higher than Canada on GDP per capita (column
10). The US has the lowest ranking on the Poverty Index17 (column 2) and is ranked near
or at the bottom on the proportion of people expected to survive to age 60 (column 3), the
proportion of adults that are functionally illiterate (column 4) and the proportion of the
population below the poverty line (columns 8 & 9). Real GDP per capita for the richest
20% is highest in the USA (column 6).
In the United States real wage growth has been much greater at the top of the
earnings distribution than at the bottom (Figure 3)18. In the hundred years to 1973, real
average hourly earnings rose by 1.9% per year. Between 1973 and 1997 CPI-deflated real
wages have fallen by about 0.4% per year. The combination of flat average wages and
rising inequality means that large numbers of American workers have experienced
stagnation or even absolute declines in their real earnings in recent decades. U.S. workers
17 The human poverty index for industrialized countries concentrates on deprivations in four dimensions of human life, quite similar to those reflected in the HDI — longevity, knowledge, a decent standard of living and social exclusion. The first deprivation relates to survival—vulnerability to death at a relatively early age. The second relates to knowledge—being deprived of the world of reading and communication. The third relates to a decent standard of living in terms of overall economic provisioning. And the fourth relates to non-participation or exclusion. In constructing the index deprivation in longevity is represented by the percentage of people not expected to survive to age 60 (P 1), and the deprivation in knowledge by the percentage of people who are functionally illiterate as defined by the OECD (P 2 ). The deprivation in standard of living is represented by the percent- age of people living below the income poverty line, set at 50% of the median disposable personal income (P 3 ). And the fourth deprivation, in non-participation or exclusion, is measured by the rate of long-term (12 months or more) unemployment of the labor force. See Human Development Report, 1999, page 163.

15
at the low end of the earnings distribution have suffered the most, particularly those in the
lowest decile. For example, the real hourly earnings of high-school-educated males fell
by 20% from 1979 to 1993.19 In contrast, there has been considerable growth in real
earnings at the top of the earnings distribution. Senior managers and executives have
experienced large increases in real earnings over the last couple of decades, and
especially so when total compensation including stock options are included.
In contrast to the United States, in most OECD countries, including the United
Kingdom, there has been strong real earnings growth across the wage distribution. For
only one or two countries (New Zealand and Australia) has a rise in earnings inequality
implied weak growth, or even declining real wages for workers at the bottom half of the
earnings distribution20. The low-paid in most industrial countries have experienced real
earnings growth over the last two decades.21 Gottschalk (1993) shows, using data from
the Luxembourg Income Study for the 1980s in a comparison of seven OECD countries
(Australia, Canada, France, Netherlands, Sweden, UK, USA) that only in the US did the
inequality of family income rise more than the inequality of earnings. In these countries
government actions through social expenditures mitigated somewhat the impact of
increasing wage inequality
Second, the earnings of women in the US increased relative to the earnings of men
from 1963 to 1995, although the main period of growth was post 1979. Real wages for
men were flat over the period 1963-1995 for those in the lowest 25% of the earnings
distribution (Figure 3). This contrasts with the high (>30%) real wage growth for males
18 I am grateful to Larry Katz for providing me with his various graphs from Katz and Autor (1999). 19 Freeman (1995) and Mishel and Bernstein (1994) report declines of this magnitude. 20 For more information on changes in real wages see OECD (1996) and Katz et al (1995) for the UK, USA, France and Japan.

16
in the top 10% of the wage distribution. The pattern was very similar for men and
women. However, real wages for women were much greater than for men. The lowest
quartile had real earnings growth of around 25%: the top decile had earnings growth of
over 50%. More generally, over the last couple of decades, the labor market position of
women has started to move closer to that of men, both in terms of their earnings and their
employment, relative to that of men. Interestingly, as women’s relative labor market
position has improved the reported happiness levels of women in the US has fallen over
time (Blanchflower and Oswald, 1999). In the 1970s the happiness levels of women were
well above those of men: happiness levels of women have declined steadily since the
1970s while those of men have remained roughly constant in both the US and the UK. In
contrast, the job satisfaction ratings of both men and women have remained roughly equal
– and constant -- over the period 1972-1998 (Blanchflower and Oswald, 2000).
The earnings of the most educated and those with the highest amounts of labor
market experience also increased strongly between 1963 and 1995 (Figure 4). Panel A of
the Figure shows changes in the male/female log wage differential which widened during
the 1960s but has narrowed considerably since then both for high school and college
graduates. Panel B shows that the college/high school log wage differential grew
significantly post-1979. Panel C shows a steady increase in the relative earnings of those
with experience (25-35 yrs) compared to those with 5 years of experience.
While most OECD countries did not experience a sharp rise in inequality, many
confronted increased unemployment in its place. Table 11 presents the range of
unemployment outcomes from 1973 through 1998 for a number of OECD countries. It is
certainly true that on average earnings inequality did increase less whilst unemployment
21 See OECD (1996).

17
increased more in Europe than it did in North America from 1979-1994. However, there
are a number of countries that are important exceptions. Of particular interest is the
United Kingdom which experienced both a rise in earnings inequality and a rise in
unemployment. Countries with a similar mix (albeit with less inequality) are Australia,
New Zealand, and Canada. The unemployment experience of Belgium looks much like
that in the United Kingdom despite the fact it experienced a decline in inequality over the
period. Unemployment in the Netherlands has been low and declining in the 1990s,
alongside only a small rise in earnings inequality. Similar to the Netherlands are Austria,
Norway and Denmark all of which are highly open economies which have had low
unemployment and little increase in earning inequality. The experience of other OECD
countries has been more varied. If globalization is such a pervasive phenomenon why
have these countries avoided its more harmful effects?
Third, there has been an increase in residual or within-group wage inequality over
the period 1963-1995. Wage inequality among those with similar education and
experience increased for both men and women in the United States over this period.
Figure 5 and table 12 summarize the time series pattern of changes in the log wage
differential between the 90th and the 10th percentile in the residual wage distribution.
These residuals were obtained by Katz and Autor (1999) from separate regressions by sex
each year of log weekly wages on a full set of 8 education dummies, a quartic in
experience, interactions of the experience quartic with 3 broad education categories, 3
region dummies, and 2 race dummies. Residual wage inequality increased by over 27 log
points (31%) for men and 25 log points (28%) for women from 1963-1995. In the United
States, rising residual inequality accounts for approximately half of the overall rise in
wage inequality. Even if the differences between groups, such as the educational or wage

18
premium were to return to their 1979 levels (perhaps through an increase in the supply of
skilled workers) overall inequality in the United States would still be higher than in
earlier years. In contrast to the situation in the US, residual inequality declined in Great
Britain in the 1970s but rose in the 1980s and was generally flat throughout the 1970s and
1980s in France (see Katz, Loveman and Blanchflower (1995).
As Katz and Autor note
“the rise in wage inequality suggests that the ‘least skilled’ or ‘least lucky’ workers within each category as well as less educated and less experienced workers have seen their relative earnings decline substantially over the past two decades” (1999, p.1480).
Exactly.
Fourth, there does not appear to have been an increase in the mobility of workers
out of the lowest deciles, that dissipates the impact of rising earnings inequality on the
poor. The same people appear to be suffering stagnating or falling wages - the lower
deciles do not appear to represent changing pools of people in different years. Movement
up the earnings distribution appears to be little different in the US than in other OECD
countries. This issue has been examined using longitudinal information on the same
individuals over time to see how their position in the earnings distribution changes.
Gottschalk and Moffitt (1994) use data from the Panel Study of Income Dynamics on
male heads of households to examine whether the impact of mobility has changed much
over time. They subdivide their data into two 9-year periods, 1970-1978 and 1979-1987
and find little change in earnings mobility between the two periods. In a comparison of
inequality in the US and Germany in the 1980s using longitudinal data from the PSID as
well as the German Socio-Economic Panel respectively Burkhauser et al (1997) rather
surprisingly found very similar patterns of quintile-to-quintile mobility in the two
19
countries. For example, they found that the proportion of individuals remaining in the
lowest quintile in the United States was 75% after 1 year; 66% after two years and 55%
after five years. For Germany the comparable estimates were 79%, 70% and 53% (Table
6). Analogously, OECD (chapter 2, 1997) finds that mobility reduces inequality by
broadly similar amounts in each of the six OECD countries they examined (France,
Germany, Denmark, Italy, UK, USA). Interestingly, they also find no evidence “that
countries with more liberalized labour and product markets, as exemplified by the UK
and the USA, have higher mobility which offsets their higher levels of cross-sectional
inequality” (1997, p.32). Nor do they find any evidence that low-paid workers in these
two countries experienced more upward mobility.
OECD (1997) also found that the young in most countries were the ones that
experience the greatest movement up the earnings distribution, with this being
particularly pronounced in Germany where high proportions of the young spend a number
of years in low paying apprenticeships. Buchinsky and Hunt (1999) using data on young
people from the National Longitudinal Survey of Youth from 1979-1991 find that the
level of inequality in the US for the young is lower by 12-26% once mobility is taken into
account. However, Buchinsky and Hunt also find that the sharp increase in inequality
during the 1980s is actually worse for the young than it appears, due to falling mobility
over time.
What are the consequences for families of the increased income and earnings
inequality that has been observed in the US? To what extent does this directly impact
standards of living? Have families altered their consumption patterns or turned to
alternative income sources? There is some disagreement on whether families in the US
are able to mitigate the impact of increased earnings variability. Dynarski and Gruber

20
(1997) report that households have responded to earnings variation by smoothing their
consumption. They find that roughly half of this consumption smoothing occurs through
offsetting income flows, in particular through the tax and transfer system, with the other
half coming through savings and dissaving. This consumption smoothing is fairly
complete: Dynarski and Gruber report that only about 10% of the variation in a
household head's earnings is translated into variation in non-durables consumption and
17% in durables. Consumption expenditures, particularly on durables, do appear to be
much more responsive to unemployment-induced earnings reductions for low-education
or low wealth groups than for high-education or high-wealth groups. In contrast,
however, Attanasio and Davis (1996) report for the United States that among the less
educated, real household consumption fell sharply during the early 1980s in parallel with
sharp declines in real wages for these groups. Among the college educated both real
consumption and real earnings rose throughout the 1980s.
To summarize: there has been a decline in employment in manufacturing and
industry alongside a decline in the relative demand for male unskilled workers but not for
females. These changes are common to most advanced countries. The US, and the UK
have experienced a much more rapid increase in earnings inequality than other OECD
countries. The increase in inequality came much earlier in the US than it did in the UK or
elsewhere. Some countries that did not experience increased inequality had rising
unemployment in its place. Other countries like Austria, the Netherlands, Norway and
Denmark, for whom trade constitutes a very high proportion of GDP, had neither rising
unemployment nor rising earnings inequality. Mobility up the earnings distribution does
not appear to have changed much over time in the US, and the amount of mobility in the
US appears to be comparable to that of a number of European countries. We now move

21
on to examine the factors that account for these changes. Any comprehensive
explanation for the changes in labor market behavior that have occurred over the past two
decades has to be consistent with the rather different experiences that have occurred
across countries and through time.
3. The Framework of Causes: Demand, Supply, and Institutions
The quest has been on to ascertain the culprits for the declining relative position
of the least skilled. There are three main candidates to explain the labor market changes
outlined above: shifts in relative labor demand; shifts in relative labor supply; and
changes in labor-market institutions. Within the set of demand-side and institutional
explanations, those that have received the most attention are international trade,
technological change, the composition of aggregate demand, the decline in the real
minimum wage and de-unionization. On the supply-side, changes in the supply of
educated workers have been emphasized as an important influence.
Over the last couple of decades the structure of demand and supply in the labor
market can be characterized as follows. In the case of skilled workers there has been an
outward shift in the labor demand schedule which has been accompanied by an outward
shift in the labor supply curve. This has resulted in an increase in both the equilibrium
price and quantity of skilled workers. In the case of the less skilled the labor supply curve
remained roughly constant while the labor demand curve moved down, resulting in a
lower price and quantity (Johnson and Stafford, 1999).
Katz and Murphy (1992) document that for the U.S. economy, supply changes
alone cannot explain rising income inequality. The main reason is that for most time
periods and skill groups, both the relative earnings and relative supply of more-skilled
workers have been rising. Relative earnings can increase along with relative supply only

22
if relative demand is increasing as well. Katz and Murphy conclude that demand growth
has been an important component of the change in factor prices since 1963 and
particularly during the 1980s. Autor, Katz, and Krueger (1997) also report an
acceleration of the demand shift between the 1970s and 1980s relative to earlier decades.
Looking at just the manufacturing sector, Berman, Bound, and Griliches (1994) and
Lawrence and Slaughter (1993) find the same trend: that even though the relative wage
of more-skilled workers has been rising, within most industries firms have been
employing relatively more of these workers. These facts point strongly toward a shift in
labor demand as an important part of the explanation for observed changes in the labor
market.
3.1 The Influence of International Trade on Labor Demand
The theoretical economic model used to test the effect of international trade on
labor demand is the Heckscher-Ohlin framework. The standard assumptions are that all
countries make the same sufficiently diversified mix of products under perfect
competition and with all factors (in particular, skilled and unskilled labor) perfectly
mobile across industries. Trade liberalization changes relative prices and shifts the
pattern of production in line with comparative advantage which increases welfare. Hence
the Stolper-Samuelson theorem predicts that international trade influences relative factor
demands and thus factor prices22. In the two-good, two-factor model, each economy
exports the good that is intensive in its most widely available factor. According to the
Stolper-Samuelson theorem international trade affects the prices of products which, in
turn, affect factor prices by changing relative factor demands. Any trade-induced change
in a country's product prices alters the relative profit opportunities facing its price-taking

23
firms, who respond by shifting their resources towards (away from) the industries whose
relative profitability has risen (fallen). This entails a shift in country-wide demand for
factors of production: demand rises (falls) for the factors used relatively intensively in
the now relatively-profitable (unprofitable) sectors. Given fixed factor supplies, changed
factor demands mean changed factor prices. Thus trade influences relative factor prices
via changes in the terms of trade -- which may result from trade liberalization and other
causes. US trade patterns will vary by trading partner: those countries that are low-wage
should follow this prediction most closely. The US exports skill-intensive goods to them
in exchange for imports of goods that are less skill-intensive.
For the Stolper-Samuelson theorem to hold, certain conditions need to be present
(OECD, 1997). First, trade with relatively low-wage countries is assumed to be of the
inter-industry type. Advanced countries are assumed to export skilled-labor intensive
products and import unskilled-labor intensive products. This trade is motivated by
differences in endowments. If trade were of the intra-industry type involving the export
and import of similar products the impact on the demand for labor is ambiguous (Oliveira
Martins 1994). Second, there should be incomplete specialization of production. If there
were complete specialization of production Bhagwati (1995) has shown that increases in
trade with low skilled countries would be beneficial to all workers including the
unskilled. Third, the theorem assumes perfect wage flexibility but if that is not the case
then the shift in trade prices will translate into relative employment changes rather than
relative wage changes.
22 See Deardorff (1994) for a discussion of the Stolper-Samuelson theorem.

24
A number of papers have tested whether the Stolper-Samuelson process has
contributed to the changes in the labor market that were described above23. Several of
these papers have examined changes in U.S. product prices to see whether the prices of
unskilled-labor-intensive products have fallen relative to the prices of skilled-labor-
intensive products. Performing convincing analyses of product prices is a difficult task.
Quality of products can vary. Wholesale prices differ from retail prices, list prices are
often different from transaction prices. Prices can vary because of differences in delivery
time (“I need this product now and I am prepared to pay for it”). Left-handed golf clubs
do not compete with right-handed golf clubs. Size 17 shirts do not compete with size 16
shirts, and so on. I for one have concerns about the usefulness of any work of this kind
because of the difficulty of data aggregation. Others seem less concerned. Bhagwati
(1991) analyzes the aggregate U.S. terms of trade (i.e., the price of U.S. exports relative
to the price of U.S. imports) and finds they fell during the 1980s. This is evidence that
skilled-labor-intensive products did not have relatively higher price increases (assuming
exports employ skilled labor intensively relative to imports). Lawrence and Slaughter
(1993) analyze various samples of industry-level U.S. manufacturing prices over the
1980s. They find no clear evidence that skilled-labor-intensive products had relatively
larger price increases. Sachs and Shatz (1994) argue that computer prices should be
excluded from any analysis because these prices are measured poorly. For this restricted
sample, Sachs and Shatz find that skilled-labor-intensive products had slightly higher
relative price increases in the 1980s. Leamer (1998) allows for various degrees of pass-
through from technology changes (as measured by total-factor productivity growth) to
product prices; he also analyzes the 1960s and 1970s as well as the 1980s. For all pass-
23 Slaughter (2000) provides a more complete survey.

25
through specifications for the 1980s and the 1960s he finds no concentration of price
increases in skilled-labor-intensive industries. But for the 1970s he consistently finds
relative price increases for the skilled-labor-intensive products. Baldwin and Cain (1997)
also control for the effect of technology on product prices, and they also conclude that
trade seems not to have contributed to widening income inequality during the 1980s.
Krueger (1997) finds that for a sample of 150 of the 450 4-digit SIC industries, from 1989
to 1995 skilled-labor-intensive industries did experience slightly higher product-price
increases. Feenstra and Hansen (1999) examined 446 of the 450 4-digit industries from
1972-1990 and found that outsourcing resulted in increases in wage inequality. Revenga
(1992) examines a panel of 38 US manufacturing industries (1977-1987) and finds that
import competition had a small but significant impact on both wages and employment. A
10 per cent reduction in the price of competing imports is associated with a 2.5%-4%
drop in employment and a 0.5% to 1% fall in wages.
There has also been work for other countries besides the US on whether the prices
of unskilled-labor-intensive products have fallen relative to the prices of skilled-labor-
intensive products. Neven and Wyplosz (1998) find no evidence that the relative price of
unskilled labor-intensive commodities has fallen since 1975 in France, Italy, Germany or
the UK. Overall there is no significant impact of LDC competition on sectoral wages and
employment, although there are some differences by country. In Germany wages and
employment were both lowered by import competition from developing countries: in Italy
and the UK they were more influenced by imports from advanced countries. However,
they did find evidence that for unskilled labor-intensive commodities relative domestic
production prices fell more than import prices plus some evidence of downsizing and
skill upgrading in unskilled labor-intensive industries in the face of increased
26
international competition. Freeman and Revenga (1968) for OECD countries find some
moderate effects of import competition but weak evidence that the impact of within
OECD trade is more important than the impact of non-OECD trade. Desjonqueres et al
(1999) examine the relationship between skill mix and import prices for six countries –
UK, USA, Germany, Sweden, Denmark, Japan. Only for the US are they able to find any
positive, statistically significant effects.
OECD (1997) collected data on the evolution of import prices of import-
competing sectors and export prices of export-competing sectors, 1980-1990 in OECD
countries. They found evidence (Table 13) that the unweighted average increase in
import prices over the period 1980-1990 was 18%, but ranged from a decline of 7.5% in
Japan to over 30% in Australia. The average import price in import-competing sectors
declined relative to the export price in export sectors in all countries except the
Netherlands, Norway and Australia. The unweighted average decline of the relative trade
price (export price minus import price) of import competing sectors was 12%. In order
to assess whether the behavior of computer prices affects the estimated trade-price gap
the results were re-estimated excluding the price of the office and computer sector
(column 4). The main result remained unaltered and the OECD average gap falls to
almost 9%. The OECD then conducted an econometric analysis for nine countries
(Australia, Canada, Denmark, Finland, Germany, Japan, Sweden, the UK, and the USA)
to try to quantify the extent to which trade-price changes contributed to explaining the
labor market changes identified earlier. Estimated elasticities suggested that the fall in
relative trade prices of import-competing sectors was small and
“would explain less than 10% of the widening earnings inequalities recorded in the United states and the United Kingdom. Likewise trade-price changes are estimated to have accounted for only a small proportion

27
of the observed” worsening in the relative employment position of unskilled workers…(T)he trade-price changes would have generated a cut in the relative employment of unskilled workers ranging between 1% for Finland to 7% for Japan” (OECD, 1997, p.122). On balance, then, these product-price studies generally find little evidence that
trade contributed much at all to the loss of jobs or increased income inequality during the
1980s. Some studies do find evidence of relative-price declines for unskilled-labor-
intensive products during the 1970s and the 1990s. However, on many measures these
were not periods of rapidly rising earnings inequality or job loss. Even where evidence
of trade effects are found they are generally small in magnitude.
In contrast to these product-price studies, many labor economists and some trade
economists have analyzed the effect of trade flows -- exports and imports. The difference
in focus can be attributed in part to the fact that many labor economists have expressed
concern about the quality of aggregate price data. For example, Freeman worries that
"price data is subject to serious measurement problems. Import prices exist for relatively few industries and cover only some goods in those industries. Output prices suffer from an aggregation problem, since the sectors with imports presumably include domestic goods that differ in important dimensions from the imports. Changes in the quality of products not captured in the indices create measurement error, which may be correlated with the skill intensity of production" (1995, pp. 28-29).
In addition to concerns about data quality, many economists also worry that product-price
studies do not control adequately for non-trade influences on these prices. Given these
concerns, various authors have searched for effects of trade in output or employment
quantities. The most commonly used method of estimating the effects of trade on labor
markets is to measure its factor content. The approach consists of identifying the extent
to which skilled and unskilled labor are used to produce a country’s exports and how
much would have been used to produce its imports. The difference is then interpreted as

28
the impact of trade on the demand for skilled and unskilled workers, absent trade.
Increased trade will hurt the less skilled to the extent that import-competing industries
employ the less skilled while export sectors tend to be more skill-intensive. As Borjas et
al (1997) note, this pattern is seen for US trade with LDCs but the characteristics of
workers in industries with high imports and exports with other developed countries are
broadly similar.
Sachs and Shatz (1994) use this method to estimate the effect of trade on the
employment of production and non-production workers in 51 US manufacturing sectors
from 1978-1990. They do so by first calculating the effect of a change in net exports or
imports on the level of output: an important assumption is that both types of labor change
in the same proportion of output. Summing across the various sectors they show that
trade from developing countries reduced manufacturing employment particularly of the
less skilled because the main output declines came in sectors where less skilled workers
dominated. Wood (1994) has criticized these, and most other factor content calculations,
for being biased downward because they understate the extent to which trade shifts
relative demand against unskilled workers. He goes on to argue that a more appropriate
calculation involves measuring the amount of labor used to produce these imports in
developing countries. These inputs then have to be adjusted to allow for the much higher
wages operating in the developed countries as well as for the fact that the goods would
cost more if they were produced domestically and hence that people would buy fewer of
them. Wood then recalculates Sachs and Shatz (1994) results using this method and finds
much greater impacts of trade (>3 times larger) on the employment of unskilled workers.
Bound and Johnson (1992) treat trade as a product-demand shock and find that it
explains very little of the rise in inequality. Berman, Bound, and Griliches (1994) assume

29
that trade operates by shifting demand across industries only (which could be true, for
example, with fixed-input production technologies and an unchanging set of industries).
Yet they calculate that the large majority of the manufacturing-wide demand shift for the
period 1959-1987 occurred within industries. From this they conclude trade played no
important role. Dunne, Haltiwanger and Troske (1997) find similar evidence over the
period 1972-1988. Kletzer (1996) uses industry-level data on US drawn from the March
Annual Demographic Files of the Current Population Survey and finds that foreign
competition accounts for a relatively small share of employment and wage changes.
Furthermore, Davis, Haltiwanger and Schuh (1996) examine firm and plant level data
from the Census of Manufactures over many years and find no evidence that either job
creation or job destruction varies across industries according to the trade flows in those
industries. The evidence they present “is highly unfavorable to the view that international
trade exposure systematically reduces job security” (1996, p.49).
Kletzer (2000) examines the relationship between increasing foreign competition
and job displacement in US manufacturing, 1975-94. She finds that imports displace
some domestic jobs. In industries long identified as import-competing, such as Footwear:
Leather Products: Radio & TV; Watches and Clocks and Toys there is strong evidence of
a positive relationship between increasing foreign competition and job displacement24.
At the same time there were a number of import-competing industries, such as Office and
Accounting Machines and Photographic equipment with below average rates of job loss.
Further considerable job losses were also present in industries facing little or no change in
import competition (Guided Missiles and Space Vehicles; Wood Buildings and Mobile

30
Homes: Optical and Health Services). Kletzer concludes that “across industries,
increasing foreign competition accounts for a very small share of job displacement”
(2000, p.33). The ability of firms to relocate production in low wage countries does
potentially involve the loss of higher wage jobs from the US to the low wage country.
Feenstra et al (2000) examined whether outsourcing has contributed to rising
wage inequality. They examined outsourcing by US industry conducted through the
Offshore Assembly Program which allows US firms to export component parts and have
them assembled overseas. Feenstra et al (2000) hypothesize that as US firms disperse
production overseas through the OAP program they will raise the ratio of
skilled/unskilled workers. Of the five industries they examined, they found support for
this hypothesis in apparel and machinery industries but found the opposite result in
electrical machinery and transportation equipment and no significant effects in the
footwear industry. As Berman et al (1994) have noted, if trade and foreign outsourcing
explain little of the skill upgrading in manufacturing “it seems implausible that they can
explain much skill upgrading in other branches” (1994, p.392).
Other studies on the impacts of international trade have focused on trade volumes.
Krugman (1995) calibrates a simple general-equilibrium model of the U.S. economy to
consider what changes in relative product prices and wages would be consistent with the
observed increase in imports from less-developed countries (LDCs). In his model, the
small amount of imports that enter the U.S. from LDCs (1.6% of total OECD output in
1990) correspond to very small changes in relative product prices and relative wages--
magnitudes he terms well within measurement error. Borjas, Freeman, and Katz (1992)
24 The data on displacement are taken from the Displaced Worker Surveys of the CPS. The term “displacement” refers to a job loss in the preceding 5 years due to “a plant closing, an employer going out
31
argue that the effect of trade on labor markets can be thought of as working through factor
supplies, not factor demands: imports from developing countries are treated as an increase
in the U.S. relative endowment of less-skilled labor while exports reduce it. Using input-
output tables to infer from observed U.S. trade flows the implicit quantities of factor
services embodied in these flows, they calculate that the large U.S. trade deficits from
1980 to 1985 can account for approximately 15%-20% of the total rise in income
inequality. But they also conclude this effect dissipated in later years as the trade deficit
shrank relative to total output. Using a similar methodology, Borjas, Freeman, and Katz
(1997) conclude that U.S. trade -- particularly trade with less-developed countries --
accounts for less than 10% of either the rise in the college/high-school wage differential
or the drop in relative wages of high-school dropouts. Wood (1995) uses this method to
estimate how much of the decline in demand for labor in manufacturing in advanced
countries is due to increased imports from the developed world. He finds that such trade
resulted in a 20% reduction in demand with the effect concentrated primarily on the
unskilled. Why are Wood’s estimates of the impact of trade so much larger? He argues
that most calculations using factor contents are biased downwards because of the way
they calculate the labor content of imports. The numbers of skilled and unskilled workers
displaced by a dollar of imports in each sector are taken to be the same as the numbers
required to produce exports. Wood argues that the implicit assumption here, that the
imports in each statistical category are goods of the same types and skill intensity as the
goods produced in the corresponding domestic sector (Wood, 1995, pp.64-5) is
unreasonable because most manufactured imports from developing countries are no
longer produced on a significant scale in advanced economies. Hence, Wood contends, it
of business, a layoff from which he/she has not been recalled or other similar reasons”
32
is more appropriate to measure the amount of labor used to produce these imports in
developing countries and then adjust to allow for the much higher levels of wages in
developed economies and the fact that these goods would cost more if they were
produced domestically. These adjustments generate much larger displacement effects
than suggested by conventional factor content calculations. However, Slaughter and
Swagel have noted, these assumptions are rather questionable
“since it is likely that differences in factor prices between developed and developing countries are in fact connected to different factor usages, so that it is not appropriate to assume identical production functions across countries – had the imported goods been produced in the advanced economies, they would in fact have been produced using relatively less unskilled labor” (1997, p.15).
Many trade economists have responded that these quantity studies--particularly
the trade volume studies -- have serious problems. A major issue has been the conditions
under which trade volumes correctly identify the effect of trade on relative factor prices.25
One serious problem with relying on trade volumes is they are endogenous outcomes:
that is, trade flows are the outcome of decisions of producers and consumers worldwide.
Trade volumes are not exogenous causes, and they can change for non-trade reasons such
as a rise in aggregate demand triggered by higher government spending. Of course, as
Krugman (2000) has noted, prices are also endogenously determined.
Trade economists have criticized the technique used by labor economists such as
Borjas et al (1992) of measuring the skilled and unskilled labor content of trade and then
comparing it to quantities in the relevant factor markets as having no theoretical basis
(Bhagwati and Dehejia, 1994). Indeed, Leamer (1994) rejects factor content calculations
as “measurement without theory”. It was subsequently noticed that the paper by
25 Comprehensive surveys of many of the issues include Bhagwati and Dehejia (1994), Deardorff and

33
Deardorff and Staiger (1988) provided such a rationale. Panagariya (2000) and Deardorff
(2000) present theoretical contributions where they further examine the value of factor
contents of trade analysis. Both conclude that the model developed by Deardorff and
Staiger, which demonstrated that if all production functions and the utility functions are
Cobb-Douglas factor content analysis can be generalized to the CES case with an
identical elasticity of substitution. However, Panagariya warns that even then a highly
restrictive set of assumptions are needed and concludes that
“personally, I take a skeptical view of the approach: the assumptions required to implement it are much too strong to inspire confidence in the estimates it generates” (2000, p.94).
In contrast Deardorff (2000) is less concerned about the restrictiveness of the model’s
assumptions
“Is the factor content of trade of any use? Yes. It must be used with careful attention to both the questions that it answers, and to the assumptions needed for these answers to be informative. These assumptions are not trivial. But they are not quite as special as may be alleged, and one can understand and deal with the biases that departures from these entail” (2000, p.89). Skepticism about the effects of trade on wages derives from the observation that,
despite the fact that it has grown, trade is quite small. Imports of manufactured goods
from developing countries are only about 2% of the combined GDP of the OECD. It is
hard to see how trade flows of this limited magnitude explain very much of the roughly
30% rise in the wage premium associated with a college education that has taken place in
the United States since the 1970s (Krugman, 2000, p.52). Wood (1995) counters,
unconvincingly, that trade can hurt unskilled labor even when it does not raise import
penetration by depressing the prices of labor intensive goods and by forcing firms to find
Haikura (1994), Freeman (1995), Richardson (1995), and Wood (1995).

34
ways of using less unskilled labor to remain competitive. In addition Wood claims, for
reasons laid out above, that imports from LDCs are highly labor intensive goods and thus
displace more domestic workers than might be supposed by simply comparing their dollar
value to that of the US GDP. Leamer (1998, 2000) argues that factor content analysis
tells us nothing about the impact of trade from LDCs because it fails to understand basic
trade theory.
“In a Heckscher-Ohlin Stolper-Samuelson framework it is prices of tradables and only prices of tradables that carry news of changes in the international product markets. The message of this model is quite clear: if you are interested in determining the effects that trade with low-wage countries is having on wages, look first and look carefully at changes in product prices. Factor contents at best are only proxies for these price movements. Once you understand fully the product price movements trade factor contents become entirely irrelevant” (2000, p. 46).
Krugman (2000) counters convincingly that trade volumes are not irrelevant and
ultimately one must “return to the data”. Krugman goes further and warns that
“classroom exercises that explore the effects of technical change in a small price-taking economy do not address the issues posed by technical change occurring in the OECD as a whole; the absence of trade volumes in the statement of the Stolper-Samuelson theorem, which implicitly involves a thought experiment in which prices are changed exogenously, does not mean that such volumes are irrelevant to attempts to infer the impact of trade on factor prices when the impact of trade on goods prices is part of the question” (2000, p.70).
Which do you believe, the theory or the data? In a 1991 paper Treasury Secretary Larry
Summers’ was critical of “the scientific illusion” in economics and the fact that in the
profession it is “much easier to demonstrate technical virtuosity than make a contribution
to knowledge”. His comments seem pertinent to this debate,
“theoretical research divorced from the problems of empirical generalization is unlikely to be fruitful. There is a still greater danger however in research directed at internal consistency starting from first principles without explicit regard for empirical observation. It is all too easy to confuse what is tractable with what is right. There is a tendency to

35
reason that since the world must be consistent, and since all full-blown models derived from optimizing behavior share a common prediction, that prediction must have some validity. This form of illogic is a modern development” (1991, p.145).
Topel (1997) has raised other difficulties for the trade model because if trade
causes factor prices to be determined on international markets, and if technical changes
have not raised the demand for high-skill labor, then firms ought to respond to a reduction
in the relative price of low-skilled labor by substituting toward it. However, this does not
appear to have been the case as the factor ratio of skilled/unskilled workers has shifted in
favor of the skilled in virtually all major industries and countries. Topel concludes that
“(T)he idea that trade has caused inequality does not square with these facts” (1997,
p.68). Topel goes on to argue, with factor price equalization across borders, all factor
prices would be determined in international markets. Changes in the domestic supply of
college-educated workers shouldn’t matter much for the determination of relative wages
since prices are set in world markets. The same applies to immigration, cohort size etc..
As we will show below, there is growing evidence across countries that changes in
domestic factor proportions do affect domestic wages.
The vast majority of studies to date -- regardless of their methodology -- find only
a small role for international trade in general, and trade from the LDCs in particular, in
rising U.S. income inequality and job loss. Product prices, labor shifts, trade flows: all
these data have been analyzed in different ways with the recurring conclusion that trade
hasn't mattered much.
3.2. Other Influences on Labor Demand: Skill-Biased Technological Change
It is fair to say that at present, many economists think that the biggest single cause
of changes in the U.S. income distribution is technological change. In most studies, the

36
conclusion that technology is the main culprit has not been drawn from direct observation
or measurement. Rather, it is the residual explanation -- it is largely a name for our
ignorance. The often-made argument is "it isn't X, Y or Z so it must be skill-biased
technical change".
There are a few recent papers providing direct evidence of this technological shift
and to link it to wage outcomes. Various direct measures of technology, such as
computer investment or computer usage seem to do a better job in explaining differences
across industries in the pace of skills upgrading than do indicators of outsourcing activity,
import pressures or changes in export activity (Autor et al, 1997). Berman, Bound, and
Griliches (1994) present several case studies documenting the technological changes that
have occurred in industries experiencing large shifts toward more-skilled workers.
Following this work, Berman, Bound, and Machin (1997) present evidence that many
OECD countries have experienced rising relative employment of more-skilled workers
within the same industries. This, they argue, is evidence that the skill-biased
technological change is a global phenomenon. Machin and Van Reenan (1998) for seven
OECD countries (USA, Denmark, France, Germany, Japan, Sweden and the UK) find
evidence of a significant association between skill upgrading and both R&D intensity and
computer usage in all seven countries. Krueger (1993) demonstrates evidence that people
who use computers on the job tend to earn more than similar workers who do not use
computers on the job. And Autor, Katz, and Krueger (1997) analyze several plausibly
direct measures of technological change (e.g., rising investment in office equipment) and
find a high correlation across industries between these direct measures and indirect
measures such as rising skilled-labor shares of the total wage bill. Studies using plant-
37
level data such as Bernard and Jensen (1997) and Doms et al (1997) also find strong
positive relationship between skill upgrading and R&D intensity.
But the evidence in favor of the skill-biased technological change hypothesis is
not without its own set of problems. DiNardo and Pischke (1997) emphasize the
difficulty in inferring causation between income inequality and measures of computer
usage. Rather than the computers causing higher wages for the users, it might be that the
more-skilled, higher-paid workers tend to choose jobs using computers. Also, the
technology story is not easily reconciled with sluggish growth in average U.S. real wages.
Real wages approximately equal labor productivity, and if massive investments in new
computer technologies have been made why haven't these investments lifted average
labor productivity and, thus, wages? Also, one might wonder why, if technological
changes have been similar across countries (as suggested by Berman, Bound, and
Machin), they have not produced similar inequality outcomes. It certainly does appear
that changes in technology are a good deal more important than international trade as a
source of relative demand shifts in favor of the more highly skilled.
Allan Mendelowitz has suggested to me that the real impact on productivity has
been relatively recent in character, arising through networking technologies and not
computers per see. These networking technologies, he argues, have made possible major
changes in business processes and productivity improvement in service functions. The
impact would only show up in the later half of the 1990s with the opening of the Internet
to commercial uses and the advent of the graphical user interface for the web. In
international comparisons, beginning in the mid 1990s, U.S. performance should diverge
from the rest of the world because of the rapid diffusion of access to the Internet in the

38
U.S. made possible by cheap (zero marginal cost) access to local phone lines and flat-rate
ISPs. It is too early to test this hypothesis empirically!
Research currently has not demonstrated that labor-demand factors, while
important in absolute terms, explain much of the differential growth of wage inequality
among countries. In fact, all advanced countries have experienced large, steady shifts in
the industrial and occupational structure of employment towards sectors and job
categories that use a greater proportion of more educated workers. Also, the share of
employment in manufacturing declined everywhere except in Japan. It might be the case
that differential labor-demand shifts help explain different countries' experiences. But if
this is the case, it will need to be demonstrated that different countries have experienced
different combinations of trade-policy changes, the rate of new-technology adoptions,
fiscal policies, and other factors affecting the demand for products and factors.
4. The Role of Supply Changes
In contrast, current research does indicate that differences among countries in
growth in the supply of workers has contributed to the greater rise in skill premiums in
the United States than in other countries. In the United States in the 1970s, the baby-
boom cohort moved from college to the labor market, increasing the relative supply of
more-skilled workers. But in the 1980s the baby boom busted and growth in the relative
supply of more-skilled workers slowed considerably. These changes help explain why
the U.S. college-high school wage differential fell during the 1970s and then reversed
around 1979. But fluctuations in the rate of growth of the relative supply of more highly
educated workers seems to be an important part of the explanation of the time series

39
changes in educational wage differentials26. Table 14 illustrates the differential growth
rates of college educated workers in the United States, the United Kingdom, Japan, and
France. Katz, Loveman, and Blanchflower (1995) found that, under a set of plausible
assumptions, such differences can account for a large portion of the declining U.S. skill
premium in the 1970s and its rise in the 1980s.
Variations in the rate of growth of the supply of the more educated appears to be
important in explaining the increase in educational wage differentials.
“A deceleration in the rate of growth of the relative supply of college workers appears to be an important determinant of the sharp increase of the US educational wage differential in the 1980s and especially rapid growth in the relative skill supply a key determinant of the narrowing of the college wage premium in the 1970s. Countries with decelerations in relative supply growth in the 1980s are those with the largest increase in educational wage differentials” (Katz and Autor, 1999, p. 1539).
Katz and Murphy (1992) show that almost half of the 2.9 log points per year difference in
the increase in the log wage premium in the 1980s from the 1970s is explained by a
slowdown in the relative supply growth with the remaining 1.54 log points accounted for
by unmeasured (residual) increases in relative demand growth. Katz and Autor (1999)
note that countries that experienced some increases in educational wage differentials in
the 1980s (principally the US and the UK) experienced declines in the rate of growth of
the supply of college graduates in the 1980s. In contrast countries whose educational
differentials did not expand in the 1980s – France Germany and the Netherlands – had
roughly the same rate of growth of the supply of college educated workers in the 1980s as
in the 1970s (Freeman and Katz, 1994). Freeman and Needels (1993) show that the more
rapid increase of more highly educate workers in Canada helps to explain why the rate of
26 As a proportion of full-time employment, based on Census data, college graduates were 6.4% in 1940, 7.8% in 1950; 10.6% in 1960, 13.8% in 1970, 20.4% in 1980; 25.4% in 1990 and 28.3% in 1996 from the

40
return to schooling in Canada rose more slowly than it did in the USA. Murphy et al
(1998) have a similar result.
Card and Lemieux (2000) have shown that the college premium for young
workers in the US and the UK has risen substantially, while the premium for older
workers is about the same as it was in the mid-1970s. The college high school wage gap
in Canada remained roughly constant while that of older men declined substantially.
Card and Lemieux argue that this shifting structure can be largely explained by the
increasing relative demand for skilled workers alongside a dramatic slowdown in the rate
of growth of college educated workers in all three countries. The success of this
explanation is all the more remarkable given the very different levels of educational
attainment in the three countries, along with the fact that the average college wage
premium moved rather differently in the three countries studied.
There are other supply changes that need to be considered -- changes in cohort
size, increase in female labor force participation and immigration which reflects a non-
trade aspect of "globalization".
4.1. Cohort size changes.
Changes in cohort size have had some effect on the labor market. Both Welch (1979) and
Berger (1985) found that increases in the relative numbers of young workers that occurred
in the 1970s caused their relative wages to fall. Since the 1970s there have been declines
in the size of the youth population but youth wages have continued to fall in all OECD
countries (see Korenman and Neumark, 2000 and Blanchflower and Freeman, 1999).
4.2. Female labor force participation.
1996 CPS ORG file (Autor et al, 1998).
41
Female labor force participation rates have risen in most countries over most of
the post-war period while male wage inequality has risen. Topel (1993, 1994) and Juhn
and Kim (1995) find some evidence of a pattern of high wage women substituting for low
wage men. There are some problems with attributing a large role for increased female
participation, however, because women who entered the labor market work in different
occupations and industries than low-skilled men whose wages have fallen. Also the surge
of female labor supply occurred in the 1970s while men’s wages continued to fall through
the 1980s. Finally, the increased participation of women coexists with rising relative
wages for women. If the demand for women’s skills were increasing and low-skilled men
are substitutes then demand for low-skilled men should be rising also. As Freeman
(1999) has noted, “it is difficult to see why more women workers adversely affected
men’s wages but not their own (1999, p.47).
4.3. Immigration.
There are two key facts here. First, immigration rates have risen sharply since
around 1970. Second, since about that time U.S. immigrants' average skill levels have
been declining. Today one-third of U.S. high-school dropouts are foreign-born (Freeman,
1996). Recent immigrants might have helped expand the relative supply of less-skilled
workers during the 1980s and thus put downward pressure on the wages of less-skilled
U.S. natives who compete with these immigrants for jobs.
The evidence on immigration's contribution to rising income inequality is mixed.
Some studies find that immigration-driven supply shifts have not contributed very much
to wage dispersion. Lalonde and Topel (1991) find that new immigration lowers the
wages of recent immigration cohorts (those who have been in the US less than 10 years)
but has no impact on other workers. Altonji and Card (1991) find broadly similar results.
42
Card (1990) finds little or no effects of the Mariel boatlift on relative wages or employent
in Miami. However, Topel (1993, 1994) finds a substantial impact of immigration on
relative wages and inequality in the western part of the US.
The ballpark figure is that a 10% increase in the fraction of immigrants in an area
appears to reduce native wages by less than 1%. But there is a methodological debate
among labor economists on this point. Most of these studies have used cities (or
metropolitan statistical areas) as the unit of observation. Borjas (1995) argues that this
approach ignores the possibility that workers move across cities and regions. This
mobility can diffuse the impact of immigrants from their destination city throughout the
national labor market. If native workers can leave a city when immigrants arrive or if
outside native workers can choose not to relocate to that city, then the labor-supply
change in the destination city can be much smaller than the total immigrant inflow. Thus
wages decline everywhere, not just in the destination city (although presumably the
nationwide decline is much smaller than the destination-city decline would be if native
workers were immobile). To measure accurately the impact of immigrants on wages, one
must study the entire United States. With this national perspective, Borjas, Freeman, and
Katz (1997) find that immigration has sharply pressured the earnings of the least-skilled
Americans. Specifically, post-1979 immigration can account for between 27% and 55%
of the decline in the relative wages of high-school dropouts. However, immigrants can
explain no more than 10% of the decline in the wages of high-school graduates relative to
college graduates. Borjas et al (1997) show that increased unskilled immigration had
bigger effects on the relative supply of the least skilled than did trade with LDCs from
1980-1995.

43
Immigration seems to have mattered less in the rest of the OECD. Immigration
flows have been small in the United Kingdom in the years since 1980 when earnings
inequality showed its most dramatic increases. Yet immigration flows from the
Commonwealth – Jamaica, Pakistan, India, Kenya, Uganda -- were substantial in the
period of declining wage inequality before 1970. Similarly, immigrant flows into France
and Germany appear to have coincided with a narrowing, not a widening, of the earnings
distribution.
4.4. The Role of Labor-Market Institutions
In addition to supply and demand, a third possible influence on relative wages are
labor-market institutions interacting with supply and demand. The two most important
ones are labor unions and minimum wages. And the broad evidence here is that both
have mattered: in the two OECD countries with the strongest rise in inequality during the
1980s (the United States and the United Kingdom) both of these institutions weakened in
ways that tended to exacerbate inequality.
a) Trade unions
The decline in trade unions might be an important explanation of rising inequality.
Unions reduce inequality by standardizing pay rates among workers within an
establishment and across establishments. The threat of unionization also forces non-
union employers to raise pay or benefits to keep unions out. Thus, strong unions
generally mean less inequality27.
Table 15A reports union density rates across European countries and the USA. In
the United States, union density has declined steadily since 1950 (Blanchflower and
27 The evidence is much more mixed on whether trade unions influence unemployment (Blanchflower, 1999).

44
Freeman, 1992; Blanchflower, 1996). With the exception of France, the U.S. decline is
greater than in other countries and predates declines elsewhere -- as does its rise in
inequality. The French case is special as union coverage is close to 100% - there is no
need to belong to a union as they will bargain for you anyway. In the other country with
rapidly increasing earnings inequality in the 1980s, the United Kingdom, unionization
rose strongly from 1950 to 1980 and then declined subsequently. Again, this trend
closely tracks the inequality changes over the period – both the decline in unionization
and the upward move in earnings inequality occurred in the 1980s and not in the 1970s as
occurred in the US. Other countries which experienced steady declines throughout the
period are Austria and Switzerland: union density fell in the Netherlands through to
1990s but has remained steady throughout the 1990s. In the rest of the OECD the
evidence is more mixed. Six European countries (i.e., Belgium, Denmark, Finland,
Ireland, Norway and Sweden) actually saw increased union density throughout the half
century. In part B of Table 15 union density rates for 4 other non-European OECD
countries are reported (Australia, Canada, Japan and New Zealand), the first three of
which experienced dramatic declines in union density, while Canada experienced an
increase from 31% in 1970 to 37% in 1993. Indeed, the decline in earnings inequality in
the 1990s that occurred in a number of countries (Belgium, Canada and Germany) is
associated with stabilizing or even slight increases in union density in a number of
countries (Japan, Netherlands, Norway, Canada and Germany).
Freeman (1993) attributes about 20% of the overall increase in male earnings
inequality in the US to the fall in union density in the 1980s. He also shows that the
movement to increased earnings inequality across countries was much less pronounced in
the more unionized economies than in the least unionized. Freeman concludes that

45
“The fall in union density in the United States contributed to the rise in inequality on a par with most other measurable factors such as changes in the industrial mix of employment save possibly for the deceleration in the growth of relative supplies of skilled labor. Overall declining unionization was a supporting player in the story of the increase in inequality – not the main character: Rosencrantz or Guildenstern, not Hamlet” (1993 p.159).
Card (1998) adjusted Freeman’s estimates to account for the non-random
selection of workers into the union sector and concludes that unions accounted for about
12% of the increase in male inequality and little if any for females. Blau and Kahn
(1996) argue that more-decentralized wage-setting mechanisms in the United States
accounts for its greater rise in male wage inequality than in other countries. Fortin and
Lemieux (1997) find that the variance of log wages would have risen by 21.3% for men
between 1979 and 1988 if the rate of unionization had remained at its 1979 level, but they
could find no effect for women. DiNardo, Fortin, and Lemieux (1996) examined data for
the same years but used a more sophisticated reweighting method that takes account of
possible changes in the characteristics of workers and broadly similar effects that varied
between 14 percent and 20 percent on the standard deviation of wages.
Bronfenbrenner (2000) undertook a survey on the impact of plant closings and
threats of plant closings on more than 400 NLRB union certification election campaigns
in the US private sector. She found that overt threats to relocate manufacturing to low-
wage countries by employers reduced the success of union organizing drives. More than
half of all employers faced with a union organizing campaign threatened to close the plant
during the drive. However, employers followed through on their threats in and shut down
all or part of their facilities only 3% of the campaigns. This does suggest the possibility
that changing unionization may actually not be independent of trade. However, it is hard
to come up with a reason why the threat of transferring production overseas impacted the

46
US so much more than elsewhere. Countries like Sweden, Norway, Finland and Belgium
that as we have shown above are considerably more open than the US have had rising
unionization rates (Table 15A). Canada also experienced rising unionization rates over
the period 1970-1993 (Table 15b). These countries presumably are also subject to similar
competitive pressures to locate their production abroad.
b) Minimum wages
Setting a minimum wage that bites obviously tends to reduce inequality (at least
among the employed). The fall in the real minimum wage also seems to have contributed
to rising inequality in the United States and United Kingdom. The value of the minimum
has risen in other countries such as France, the Netherlands and Spain (Dolado et al,
1996; Abowd et al, 2000). Its real value in the United States declined substantially over
the period 1970-1990, and even with recent increases it remains very low by historical
standards. In the United Kingdom, Wages Councils, which set sectoral pay rates for the
young and the unskilled, were gradually abolished during the 1980s. Even though the
abolition appears to have had little impact on employment it appears to have reduced
wages at the low end. Here again the United States and the United Kingdom look
different from other OECD countries. For example, strong rises in France's minimum
wage appear to have prevented a sharp erosion in real wages at the low end of the French
wage distribution (Katz et al, 1995: Abowd et al, 2000).
DiNardo et al (1997) find that the decline in the real value of the minimum wage
can account for most of the increase in the 50-10 log wage differential for men and
women and 17-25% of the growth in the standard deviation of log hourly wages for men
and 25-30% of the increase for women. Fortin and Lemieux (1997) attribute 39% of the
change in the variance of log wages, for both men and women, to changes in the real

47
value of the minimum wage. Lee (1999) also finds evidence across states that the
minimum wage is responsible for a compression of the lower part of the wage
distribution. Indeed, he concludes that the decline in the real value of the minimum is
responsible for much of the increase in residual earnings inequality in the 1980s. Card
and Krueger (1995) find that 20%-30% of the rise in wage dispersion in the 1980s is
attributable to the erosion of the real value of the minimum wage. Card and Krueger
(1995) also compared changes in the wage distribution at the state level for 1989-1992
according to the percentage of workers who were directly affected by the 1990 and 1991
minimum wage increases and found that these increases measurably lowered earnings
inequality.
Minimum wages have generally remained low in most European countries except
France, where they appear to have had some employment effects. Neumark and Wascher
(1999) report evidence in the raw data that increases in minimum wages have reduced
youth employment rates in Canada, the Netherlands, Luxembourg, and to a lesser extent
in the US and the UK. They also found evidence that declines in minimum wages were
accompanied by declines in youth employment rates in Italy, Belgium, Spain, Greece and
Portugal. They could find no relation between these two variables in Germany, Sweden,
France and Japan. Both patterns were evident at various times in New Zealand and
Denmark. There is stronger evidence for employment reducing effects of minimum wages
in a number of Latin American countries.
A possible criticism of the role of these institutions is that de-unionization reflects
the competitive pressures generated by international trade. Minimum wage changes are
more immune to this criticism because they can be traced explicitly to legislative action.
It does seem that the pattern of institutions across countries is hard to reconcile with the

48
view that institutions are purely endogenous as the relevant demand and supply shocks
appear to be roughly comparable across countries (Fortin and Lemieux, 1997, Card and
Lemieux, 2000). A further argument is that factors like the minimum wage and
unionization have employment effects that need to be considered in any analysis of
distributional changes. If a higher minimum wage reduces wage inequality among those
with jobs, but increases unemployment among the low-skilled, it may not reduce overall
inequality. There is indeed some evidence of a negative effects of unions on employment
growth (Blanchflower et al, 1991 for the UK; Leonard, 1992 for California and Long,
1993 for Canada). There has been an ongoing, and sometimes acrimonious, debate over
the employment effects of the minimum wage (Card and Krueger, 1995: Neumark and
Wascher, 1992, 1994; Card, Katz and Krueger, 1992)). A number of years ago Brown et
al (1982) concluded that the employment effects of the minimum wage were small.
Brown (1999) updated the evidence from the earlier paper and came to essentially the
same conclusion.
5. Evaluation of Current Evidence
Research to date does not allow one to allocate precisely the relative contribution
of demand, supply, and institutional forces to rising U.S. wage inequality and job loss.
Most economists do seem to agree that trade has not been a major factor in the shift in
labor demand away from less-skilled and towards more-skilled workers or for the
increases in inequality observed in the US and the UK but not elsewhere. Other factors
playing an important role seem to be demand shifts from skill-biased technological
change; a deceleration in the growth of skilled-labor supply; and institutional factors such

49
as declining unionization and falling real minimum wages28 alongside shifts in the supply
of college-educated workers.
There are some important differences in thinking between the two groups of
economists who have been examining these issues – labor economists and trade
economists as well as the role of theory versus empirical work. As the research has
progressed, methodological debates have emerged – some quite spirited at times. It is
probably fair to say that many of the "trade versus labor" debates reveal fundamental
methodological differences between the two fields. Trade economists tend to value clear
general-equilibrium theoretical thinking, whereas labor economists tend to value careful
empirical work. The reason for this difference in relative values is not entirely clear.
History might explain part of it. For a long time labor economists have had more and
higher-quality data sets available than trade economists. Perhaps over time those lacking
data concentrated on theoretical issues while those with data focused on empirical issues.
Whatever the reasons for these taste differences, they clearly have driven a lot of the
methodological debates. Some trade economists fault labor economists for being
atheoretical while some labor economists fault trade economists for sloppy empirical
work and untestable theories.
In particular, some trade economists argue that labor economists miss many of the
important general-equilibrium insights of trade theory. Trade economists tend to prefer
thinking about – and analyzing empirically – many markets simultaneously. This is
crucial, because many of trade theory's key insights such as the Stolper-Samuelson
theorem rely upon interactions among product and factor markets. Labor economists who
focus on an individual labor market or markets will necessarily miss these general-
28 This section draws heavily on Blanchflower and Slaughter, 1999.

50
equilibrium issues. Some labor economists respond that because there are few
appropriate instruments in the labor market to solve endogeneity problems, identification
is difficult to achieve. When set alongside the serious aggregation and omitted variable
biases associated with estimating general equilibrium models there is a widely held view
that such models are unlikely to produce useful insights. More generally, there also
seems to be skepticism among labor economists about the validity of some of the basic
assumptions of most trade theories.
For example, standard trade theory assumes that factor markets are perfectly
competitive – i.e., that every factor earns its marginal revenue product. There is a good
deal of evidence, however, that rent-sharing is prevalent and hence that labor markets
should be characterized as non-competitive (Oswald, 1997). This is especially true in
Europe (Blanchflower, Garrett and Oswald, 1990; Van Reenen, 1996), and a growing
body of evidence finds this even in the United States and Canada (Blanchflower, Oswald
and Sanfey, 1996; Christofides and Oswald, 1992; and Abowd and Lemieux, 1993).
Similarly, standard trade theory assumes perfect inter-industry factor mobility within
countries. This implies, among other things, that the same factor should earn the same
wage in all industries. Yet labor economists have assembled a large body of evidence
that inter-industry wage differentials are sizable, persistent over time, and stable across
countries (see, for example, Krueger and Summers (1987, 1988) and Katz and Summers
(1989)). Such evidence has led Nobel Laureate Robert Solow (1986) to conclude that “in
the case of the labor market, our preoccupation with price-mediated market clearing as
the natural equilibrium condition may be a serious error”.
The literature's near consensus that trade has played a smaller role than other
factors such as skill-biased technological change depends so strongly on research from

51
one perspective: the Heckscher-Ohlin model. The model's detailed analysis of multiple
factor and product markets makes it a natural tool to study a general-equilibrium problem
such as trade and wages. However, there are many issues regarding how trade – and
globalization more generally – affects labor markets that remain understudied.
What has not been looked at? Many non-trade aspects of globalization. We still
know very little about how the U.S. labor market may have been affected by exchange-
rate volatility or increased international capital mobility. It may be that "non-trade"
influences on labor demand are themselves driven by international trade. Might not the
pace of technological change depend (among other things) on the competitive pressures
generated by international trade? Wood (1994) calls this type of technological change
"defensive innovation": firms innovate only when forced to defend existing market
positions by international competitors. Couldn’t the declines in unionization or the
lowering of the real minimum wage simply arise as a result of competitive pressures from
abroad? These aspects of globalization seem plausible. There are anecdotes of firms
adopting information-technology in order to remain internationally competitive.
Similarly, there are anecdotes of firms gaining bargaining strength against unions by
threatening to hire foreign factors of production (via foreign-direct investment or
outsourcing to foreign suppliers). What is the role of intra-firm trade? What are the
consequences if multinational enterprises are increasingly able to shift production
locations in response to changes in costs. The difficulty is to find appropriate empirical
tests to distinguish between these competing explanations.
Some researchers have moved beyond Heckscher-Ohlin models and factor-content
studies to analyze the effects of globalization. For example, Feenstra and Hanson (1995,
1996) consider the factor-price implications of Ricardian trade among countries making
52
different sets of products (distinct from the standard Heckscher-Ohlin assumption that all
countries make the same set of products). Slaughter (1995) considers whether foreign
direct investment by multinational corporations has contributed to U.S. income
inequality. Borjas and Ramey (1995) analyze whether international trade has pressured
imperfectly-competitive industries to squeeze the rents earned by less-skilled workers in
those industries. And Slaughter (1997) considers whether international trade has
pressured U.S. labor markets not by changing the prices of factors but by changing the
elasticities of demand for factors. It is worth noting that in some cases, the results
suggest a slightly more important role for trade in explaining rising inequality.
More attention certainly needs to be paid to explaining residual (within-group)
inequality. This fact will likely be difficult to reconcile with models which group factors
of production based on observable characteristics. This problem affects not only standard
trade models but also many labor models as well. A comprehensive trade-based
explanation of residual inequality will have to expand standard trade models to
incorporate some explanation of this dimension of inequality.
6. Conclusions
On the basis of the empirical analysis that is available at the time of writing
(September 2000), globalization does not appear to have had a major influence on the US
labor market. The size of the US trade balance has increased strongly since the early
1980s as have imports from LDCs. In comparison with other countries, the US is a fairly
closed economy measured by the degree (or the change in the degree) of openness since
1973 (Table 2). The extent of trade with the Dynamic Asian Economies and China is
comparatively high in the US in comparison with other OECD countries but still small as
a proportion of GDP (US=1.84% in 1993 compared with 1.49% for the OECD as a

53
whole). The magnitude of these trade flows do not appear to be enough to explain the
dramatic changes in labor markets that have appeared over the last couple of decades, and
especially the rise in earnings inequality and the growth in the college-high school wage
differential that has occurred in the US since the early 1970s (Figure 2) and which predate
the increase in trade flows in the US.
With the exception of the UK, a number of OECD countries did not experience
large increases in inequality, but instead had large rises in the unemployment rate. If
‘globalization” is the big culprit in all the labor market changes we have seen it is perhaps
surprising then that a number of the most open economies, particularly Austria, the
Netherlands, Norway and Denmark, experienced neither a large increase in inequality nor
an increase in unemployment over the period 1973-1998.
There is a good deal of both direct and indirect evidence that suggests that
technology is an important factor in explaining the shift in the demand away from the less
skilled. A number of papers have shown that there is evidence of rising relative
employment of skilled workers within the same industries in many OECD countries
(Berman, Bound and Machin, 1997). There is also evidence of a significant association
between skill upgrading and both R&D intensity and computer usage across a number of
OECD countries.
Supply-side changes seem to be important. The rapid increase in the growth rate
of college educated workers appears to be a major contributor to the sharp decrease in the
US educational differential in the 1970s: a deceleration in the rate of growth of the supply
of college educated workers in the 1980s appears to be a key factor in explaining the
widening of the college wage premium (Katz et al, 1995; Katz and Autor, 1999; Card and
Lemieux, 2000). Countries whose educational wage differentials remained constant in
54
the 1980s such as France, Germany and the Netherlands did experience increases in the
relative supply of college educated workers in the 1980s as compared to the 1970s.
There is little evidence that cohort size changes or a change in the labor force
participation rate of women matters much. Borjas et al (1997) have shown that a non-
trade aspect of globalization – immigration – has had bigger effects on the relative supply
of the least skilled than trade with LDCs. Immigration sharply lowers the wages of the
least skilled. A 10% increase in the fraction of immigrants in an area appears to reduce
native wages by under 1%.
Institutions also seem to matter a lot – declining unionization rates alongside a fall
in the real value of the minimum wage have been important in the United States. A
variety of studies suggest that between 10% and 20% of the overall increase in male
earnings inequality in the US is due to the fall in union density in the 1980s (Freeman,
1993; Card (1998). Declines in earnings inequality are associated with increased union
density in Belgium, Denmark, Finland, Ireland, Norway and Sweden. The fall in the
value of the real minimum wage, which occurred notably in the US and the UK, appears
to have contributed a good deal to declining earnings inequality. Fortin and Lemieux
attribute 39% of the change in the variance in log wages in the U.S. to changes in the
value of the real minimum. Lee (1999) argues that much of the increase in residual
earnings inequality arises directly from declines in the real value of the minimum wage.
Globalization does not appear to be the main, or even one of the major, causes of
the labor market changes that occurred in the United States or elsewhere since the 1970s.
It is appropriate then to look for other culprits. There is no single factor, but it seems that
several influences have been at work -- technological change; immigration; declining
unionization; declining levels of the real minimum wage as well as reductions in the

55
supply of college-educated workers. The empirical evidence suggests that the increase in
imports from LDCs and the rising deficit on the trade balance have both had relatively
minor consequences for the US labor market.

56
References Abowd, J., F. Kramarz, T. Lemieux, and D.N. Margolis (2000), “Minimum wages and youth employment in France and the United States” in Youth employment and joblessness in advanced countries edited by D.G. Blanchflower and R.B. Freeman, University of Chicago Press and NBER. Abowd, J. and T. Lemieux (1993) "The effects of product market competition on collective bargaining agreements: the case of foreign competition in Canada", Quarterly Journal of Economics, 109, pp. 983-1014. Altonji, J.G. and D. Card (1991), “The effects of immigration on the labor market outcomes of less-skilled natives”, in Immigration, trade and the labor market edited by R.B. Freeman and J. Abowd, University of Chicago Press and NBER. Atkinson, A. B. (1996), “Income distribution in Europe and the United States”, Oxford Review of Economic Policy, 12(1), Spring, pp. 15-28. Attanasio, O. and S.J. Davis (1996), "Relative wage movements and the distribution of consumption", Journal of Political Economy, December 1996, 1227-1262. Autor, D.H., L.F. Katz, and A.B. Krueger (1997), "Computing inequality: have computers changed the labor market?", Quarterly Journal of Economics, 113 pp. 1169-1213 Baldwin, R.E. and G.G. Cain (1997), "Shifts in U.S. relative wages: the role of trade, technology, and factor endowments," NBER Working Paper #5934, February. Berger, M. (1985), “The effect of cohort size on earnings growth: a reexamination of the evidence”, Journal of Political Economy, June, 93, pp. 561-573 Berman, E., J. Bound, and Z. Griliches (1994), "Changes in the demand for skilled labor within U.S. manufacturing: evidence from the Annual Survey of Manufactures," Quarterly Journal of Economics, May, pp. 367-397. Berman, E., J. Bound, and S. Machin (1997), "Implications of skill-biased technological change: international evidence", Quarterly Journal of Economics, 113, pp. 1245-1279. Bernard, A. and J. B. Jensen (1997), “Exporters, skill upgrading and the wage gap”, Journal of International Economics, 42, pp. 3-31. Bhagwati, J. (1991), "Free traders and free immigrationists: strangers or friends?", Russell Sage Foundation Working Paper. Bhagwati J. (1995), “Trade and wages: a malign relationship”, mimeo, Columbia University.

57
Bhagwati, J. and V. Dehejia (1994), "Free trade and wages of the unskilled: is Marx striking again," in Trade and wages edited by Bhagwati, J. and M. Kosters, Washington, D.C.: American Enterprise Institute. Blackburn, M.L. and D.E. Bloom (1993), “The distribution of family income: measuring and explaining changes in the 1980s for Canada and the United States”, in Small differences that matter, edited by D.A. Card and R.B. Freeman, NBER and University of Chicago Press. Blanchflower, D.G. (1996), The role and influence of trade unions in the OECD, report to the Bureau of International Labor Affairs, U.S. Department of Labor. Blanchflower, D.G. (1999), “What can be done to reduce the high levels of youth joblessness in the world?”, Report to the ILO, Geneva, Switzerland, August. Blanchflower, D.G. and R.B. Freeman (1992), "Going different ways: unionism in the US and other OECD countries", Industrial Relations, Winter, pp. 56-79 reprinted in Labor market institutions and the future role of unions edited by M. Bognanno and M. Kleiner, Blackwell. Blanchflower, D.G. and R.B. Freeman (1994), “Did the Thatcher reforms change British labour market performance?, in The UK labour market. Comparative aspects and institutional developments, edited by R. Barrell, Cambridge University Press. Blanchflower, D.G. and R.B. Freeman (2000), “The declining economic status of young workers in OECD countries” in Youth employment and joblessness in advanced countries edited by D.G. Blanchflower and R.B. Freeman, University of Chicago Press and NBER. Blanchflower, D.G., N. Millward and A.J. Oswald (1991), “Unions and employment behaviour”, Economic Journal, 101, pp. 815-34. Blanchflower, D.G., A.J. Oswald and M. Garrett (1990), “Insider power in wage determination”, Economica, 57, pp. 143-170. Blanchflower, D.G. and A.J. Oswald (1994), The wage curve, MIT Press, Cambridge, MA. Blanchflower, D.G. and A.J. Oswald (1999), “Well-being over time in Britain and the United States”, NBER Working Paper #7487 . Blanchflower, D.G. and A.J. Oswald (2000), “Is the UK moving up the international well-being rankings?” mimeo, Department of Economics, Dartmouth College, Hanover, NH. Blanchflower, D.G., A.J. Oswald and P. Sanfey (1996), "Wages, profits and rent sharing", Quarterly Journal of Economics, 111(1), February, pp. 227-51.

58
Blanchflower, D.G. and M.J. Slaughter (1999), "The causes and consequences of changing earnings inequality” in Growing apart: the causes and consequences of global wage inequality edited by A. Fishlow and K. Parker, Council on Foreign Relations Press, New York. Blau, F.D., and L.M. Kahn (1996), "International differences in male wage inequality: institutions versus market forces," Journal of Political Economy, 104, No. 4, pp. 791-837, Bloom, D.E. and R.B. Freeman (1992), “The fall in private pension coverage in the United States”, American Economic Review, 82(2), Borjas, G.J. (1995), "The economic benefits from immigration," Journal of Economic Perspectives, pp. 3-22. Borjas, G.J., R.B. Freeman, and L.F. Katz (1992), "On the labor-market effects of immigration and trade," in Immigration and the Work Force edited by G.J. Borjas and Richard Freeman, University of Chicago Press, Chicago. Borjas, G.J., R.B. Freeman, and L.F. Katz (1997), "How much do immigration and trade affect labor market outcomes?" Brookings Papers on Economic Activity 1, pp. 1-90. Borjas, G.J., and V.A. Ramey (1995), "Foreign competition, market power, and wage inequality," Quarterly Journal of Economics, pp. 1075-1110. Bound, J. and G. Johnson (1992), "Changes in the structure of wages in the 1980s: an evaluation of alternative explanations", American Economic Review, 82(1), pp. 371-392. Bronfenbrenner, K. (2000), “Uneasy terrain: the impact of capital mobility on workers, wages and union organizing”, Trade Deficit Review Commission, September. Brown, C., C. Gilroy and A. Kohen (1982), “The effect of the minimum wage on employment and unemployment”, Journal of Economic Literature, 20, pp. 487 Brown, C., (1999), “Minimum wages, employment and the distribution of income” in Handbook of labor economics, volume 3B, edited by O. Ashenfelter and D. Card, North-Holland. Browning, M. and A. Lusardi (1996), “Household Saving: Micro Theories and Micro Facts”, Journal of Economic Literature, 34(4), December, pp.1797-1855 Buchinsky, M. and J. Hunt (1999), “Wage mobility in the United States”, Review of Economics and Statistics, August. 81 (3), pp.351-68 Burkhauser, R.V., D. Holtz-Eakin and S.E. Rhody (1997), “Labor earnings mobility and inequality in the United States and Germany during the growth years of the 1980s”, International Economic Review, November, 38(4), pp. 775-94
59
Card, D. (1990), “The impact of the Mariel boatlift on the Miami labor market”, Industrial and Labor Relations Review, January, 40, pp. 383-393. Card, D. (1997), "Immigrant inflows, native outflows, and the local labor market impacts of higher immigration," National Bureau of Economic Research Working Paper #5927. Card, D. (1998), “Falling union membership and rising wage inequality”, NBER Working Paper #6520. Card, D. and A. Krueger (1995), Myth and measurement: the new economics of the minimum wage, Princeton University Press, Princeton. Card, D., L. Katz and A. Krueger (1992), “Comment on David Neumark and William Wascher’ ‘Employment effects of minimum and sub-minimum wages: panel data on state minimum wage laws”, Industrial and Labor Relations Review, 47, pp. 487-497. Card, D. and T. Lemieux (2000), “Can falling supply explain the rising return to college for younger men? A cohort based analysis”, NBER Working Paper #7655, April. Christofides, L. and A.J. Oswald (1992), " Real wage determination and rent sharing in collective bargaining agreements", Quarterly Journal of Economics, 65, pp. 985-1002. Davis, S., J. Haltiwanger and S. Schuh (1996), Job creation and destruction, MIT Press, Cambridge, MA. 1996. Deardorff, A. and R.W. Staiger (1988), “An interpretation of the factor content of trade”, Journal of International Economics, 24, pp. 93-107. Deardorff, A. (1994), “An overview of the Stolper-Samuelson theorem” in The Stolper-Samuelson theorem: a golden jubilee edited by A. Deardorff and R.M. Stern, University of Michigan Press, Ann Arbor. Deardorff, A. and D. Haikura (1994), "Trade and wages: what are the questions?" in Trade and wages: leveling wages down edited by Bhagwati, J. and M. Kosters, AEI press, Washington D.C. Deardorff, A. (2000) “Factor prices and the factor content of trade revisited: what’s the use?”, Journal of International Economics, 50, pp. 73-90. Desjonqueres, T., S. Machin and J. Van Reenen (1999), “Another nail in the coffin? Or can the trade based explanation of changing skill structures be resurrected?”, Scandinavian Journal of Economics, December, pp. 533-54. DiNardo, J.E., and J.S. Pischke (1997), "The returns to computers revisited: have pencils changed the wage structure too?", Quarterly Journal of Economics, 112, pp. 291-304.
60
DiNardo, J.E., N.M. Fortin, and T. Lemieux (1996), "Labor market institutions and the distribution of wages, 1973-1992: a semi-parametric approach", Econometrica, pp. 1001-1044. Dolado, J., F. Kramarz, S. Machin, A. Manning, D. Margolis and C. Toelings (1996), “The economic impact of minimum wages in Europe”, Economic Policy, 23, October, pp. 319=372. Doms, M., T. Dunne and K. R. Troske (1997), “Workers, wages and technology”, Quarterly Journal of Economics, 112, pp. 253-290. Dunne, T., J. Haltiwanger and K. Troske (1997), “Technology and jobs: secular changes and cyclical dynamics”, Carnegie-Rochester Conference Series on Public Policy, vol. 46 June, pp. 107-78 Dynarski, S. and J. Gruber (1997), "Can families smooth variable earnings?", Brookings Papers on Economic Activity, pp. 229-305. Ebbinghaus, B. and J. Visser (2000), Trade unions in Western Europe since 1945, Macmillan, London. Farber, H. and H. Levy (2000), “ Recent trend in employer-sponsored health insurance coverage: are bad jobs getting worse?”, Journal of Health Economics, 19(1), January pp. 93-119 Feenstra, R.C. and G. Hanson (1995), "Foreign investment, outsourcing, and relative wages," in Political economy of trade policy: essays in honor of Jagdish Bhagwati, edited by R.C. Feenstra and Gene M. Grossman (eds), Cambridge: MIT Press, 1995. Feenstra, R.C. and G. Hanson (1996), "Globalization, outsourcing, and wage inequality," American Economic Review, pp. 240-245. Feenstra, R.C. and G. Hanson (1999), "Productivity measurement and the impact of trade and technology on wages: estimates for the US, 1972-1990”, Quarterly Journal of Economics, August, pp. 907-940. Feldstein, M. (1998), “Income inequality and poverty”, NBER Working Paper # W6770 Fortin, N.M. and T. Lemieux (1997), "Institutional changes and rising wage inequality: is there a linkage?", Journal of Economic Perspectives, Vol. 11, No. 2, Spring, pp. 75-96. Freeman, R.B. (1993), "How much has de-unionization contributed to the rise in male earnings inequality?” in Uneven tides edited by P.S. Danziger and P. Gottschalk, Russell Sage Foundation, New York. Freeman, R.B. (1995), "Are your wages set in Beijing?" Journal of Economic Perspectives, Summer, pp. 15-32.

61
Freeman, R.B. (1999), “The new inequality in the United States” in Growing apart: the causes and consequences of global wage inequality edited by A. Fishlow and K. Parker, Council on Foreign Relations Press, New York. Freeman, R.B. and L.F. Katz (eds) (1995), Differences and changes in wage structures and published by University of Chicago Press and NBER. Freeman, R.B. and K. Needels (1993), “Skill differentials in Canada in an era of rising labor market inequality”, in Small differences that matter edited by D. Card and R. Freeman, University of Chicago Press and NBER. Freeman, R.B. and A. Revenga (1998), “How much has LDC trade affected wetern job markets?”, in Trade and jobs in Europe: much ado about nothing? Edited by M. Dewatripont, A. Sapir and K. Sekket, Clarendon Press, Oxford. Gottschalk, P. (1993), “Changes in inequality of family income in seven industrialized Countries”, American Economic Review, 83(2), May, pp.136-42 Gottschalk, P. (1997), “Inequality, income growth and mobility: the basic facts”, Journal of Economic Perspectives, 11(2), pp. 21-40. Gottschalk, P. and R. Moffitt (1994), “The growth of earnings instability in the US labor market”, Brookings Papers on Economic Activity, 2, pp. 217-272. Gottschalk, P. and T.M. Smeeding, (1997), “Cross-national comparisons of earnings and income inequality”, Journal of Economic Literature 35(2), June, pp. 633-87. Hamermesh, D. (2000), “Changing inequality in markets for workplace amenities”, Quarterly Journal of Economics, 114(4), November, pp.1085-1123 Hoxby, C.M. and B. Terry (1999), “Explaining rising income and wage inequality among the college educated”, NBER Working Paper #6873. Irwin, D.A. (1995), “The United States in a new global economy? A century’s perspective”, American Economic Review, May, pp. 41-46. Johnson, G. & F. Stafford (1999), “The labor market implications of international trade” in Handbook of labor economics, volume 3B, edited by O. Ashenfelter and D. Card, North-Holland 1999. Karoly, L. (1993), “The trend in inequality among families, individuals and workers in the United States: a twenty-five year perspective”, in Uneven tides edited by P.S. Danziger and P. Gottschalk, Russell Sage Foundation, New York.

62
Katz, L.G. and D. H. Autor (1999), “Changes in the wage structure and earnings inequality” in Handbook of labor economics, volume 3B, edited by O. Ashenfelter and D. Card, North-Holland. Katz, L., G. Loveman and D. Blanchflower (1995), “A comparison of changes in the structure of wages in four OECD countries”, in Differences and changes in wage structures edited by R.B. Freeman and L.F. Katz and published by University of Chicago Press and NBER, pp. 25-65. Katz, L.F., and K.M. Murphy (1992), "Changes in Relative Wages, 1963-1987: Supply and Demand Factors", Quarterly Journal of Economics, 107, pp. 35-78. Katz, L.F., and L.H. Summers (1989), "Interindustry wage differentials: theory and evidence," Brookings Papers on Economic Activity: Microeconomics, pp. 209-275. Kletzer, L.G. (1996), "The impact of foreign competition on occupational employment and wages in US manufacturing, 1971-1992", mimeo, University of California, Santa Cruz. Kletzer, L.G. (2000), “Trade and job loss in U.S. manufacturing, 1979-94”, in International Trade and Wages, edited by R. C. Feenstra, National Bureau of Economic Research and University of Chicago Press, forthcoming., Korenman, S. and D. Neumark (2000), “cohort crowding and youth labor markets: a cross-national analysis” in Youth employment and joblessness in advanced countries edited by D.G. Blanchflower and R.B. Freeman, University of Chicago Press and NBER. Krueger, A.B. (1993), "How computers have changed the wage structure: evidence from microdata, 1984-1989," Quarterly Journal of Economics, 108, pp. 33-60. Krueger, A.B. (1997), "Labor market shifts and the price puzzle revisited," NBER Working Paper, January 1997. Krueger, A.B., and L.H. Summers (1987), “Reflections on the inter-industry wage structure”, in Unemployment and the structure of labor markets edited by K. Lang and J.S. Leonard, Oxford, Basil Blackwell. Krueger, A.B., and L.H. Summers (1988), “Efficiency wages and the inter-industry wage structure”, Econometrica, 56, pp. 259-293. Krugman, P.R. (1995), "Growing world trade: causes and consequences," Brookings Papers on Economic Activity, pp. 327-377. Krugman, P.R. (2000), “Technology, trade and factor prices”, Journal of International Economics, 50, pp. 51-71.
63
LaLonde, R.J., and R.H. Topel (1991), "Labor market adjustment to increased immigration," in Immigration, trade, and the labor market edited by J.M. Abowd and R.B. Freeman (eds), , Chicago: University of Chicago Press. Lawrence, R.Z. and M.J. Slaughter (1993), "International trade and American wages in the 1980s: giant sucking sound or small hiccup?" Brookings Papers on Economic Activity: Microeconomics 2, pp. 161-211. Leamer, E. E. (1994), “Trade, wages and revolving door ideas”, NBER Working paper #4716. Leamer, E. E. (1998), "In search of Stolper-Samuelson linkages between international trade and lower wages” in Imports, exports and the American worker edited by S. Collins, Brookings, Washington DC. Leamer, E. E. (2000), “What’s the use of factor contents?”, Journal of International Economics, 50, pp. 17-49. Lee, D. (1999), “Wage inequality in the US during the 1980s: rising dispersion or falling minimum wage?”, Quarterly Journal of Economics, 114, August, pp. 977-1023. Leonard, J.S. (1992), “Unions and employment growth”, Industrial Relations, 3191), pp. 80-94. Levy, F. and R.J. Murnane (1992), “U.S. earnings levels and earnings inequality: a review of recent trends and proposed explanations”, Journal of Economic Literature, 30, pp. 1333-81. Long, R.J. (1993), “The effect of unionization on employment growth of Canadian companies”, Industrial and Labor Relations Review, 46(4), pp. 81-93. Machin, S. and J. Van Reenan (1998), “Technology and changes in skill structure: evidence from seven OECD countries”, Quarterly Journal of Economics, 113, pp. 33-60. Maloney, T. (1997), Benefit reform and labour market behaviour in New Zealand, Institute of Policy Studies, Victoria University, Wellington, NZ. Maloney, T. (1998), Five years after: the New Zealand labour market and the Employment Contracts Act, Institute of Policy Studies, Victoria University, Wellington, NZ. Maloney, T. and J. Savage (1996), “Labour markets and policy”, in A study of economic reform: the case of New Zealand, edited by B. Silverstone, A. Bollard and R. Lattimore, Elsevier Science, BV. Mishel, L. and A. Bernstein (1994), The state of working America, 1994-95, New York: Economic Policy Institute, M.E. Sharpe.

64
Murphy, K.M and F. Welch (1993), “The structure of wages”, Quarterly Journal of Economics, CVII, February, pp. 285-326. Murphy, K.M, W.C. Riddell, P.M. Romer (1998), “Wages, skills and technology in the United States and Canada” in “General purpose technologies and economic growth” edited by E. Helpman, MIT Press, Cambridge, MA. Neven, D. and C. Wyplosz (1998), “Relative prices, trade and restructuring in European industry”, in Trade and jobs in Europe: much ado about nothing? Edited by M. Dewatripont, A. Sapir and K. Sekket, Clarendon Press, Oxford. Neumark, D. and W. Wascher (1992), “Employment effects of minimum and sub-minimum wages: panel data on state minimum wage laws”, Industrial and Labor Relations Review, 46, pp. 55-81. Neumark, D. and W. Wascher (1994), “Employment effects of minimum and sub-minimum wages: reply to Card, Katz and Krueger”, Industrial and Labor Relations Review, 47, pp. 497-512. Neumark, D and W. Wascher (1999), “A cross-national analysis of the effects of minimum wages on youth employment’, NBER Working Paper # 7299, Cambridge, MA. OECD (1996), “Earnings inequality, low-paid employment and earnings mobility”, Employment Outlook, July, Paris, France. OECD (1997), Employment Outlook, July, Paris, France. Oliveira Martins, J. (1994), “Market structure, trade and industry wages”, OECD Economic Studies, Spring , pp. 131-154. Oswald, A.J. (1997), "Rent sharing in the labour market", mimeo, University of Warwick. Panagariya, A. (2000), “Evaluating the factor content approach to measuring the effect of trade on wage inequality”, Journal of International Economics, 50, pp. 91-116. Phelps Brown, H. (1977), The inequality of pay, Oxford University Press, Oxford, UK. Phelps Brown, H. (1988), Egalitarianism and the generation of inequality, Oxford University Press, Oxford, UK. Pierce, B. (1997), “Compensation inequality”, Office of Compensation and Working Conditions, Working Paper 323, Bureau of Labor Statistics, Washington DC. Revenga, A. (1992), “Exporting jobs? The impact of import competition on employment and wages in US manufacturing”, Quarterly Journal of Economics, 107, pp. 255-284.
65
Richardson, J. D. (1995), "Income inequality and trade: how to think, what to conclude", Journal of Economic Perspectives, Summer, pp. 33-55. Sachs, J.D,. and H. Shatz (1994), "Trade and jobs in U.S. manufacturing", Brookings Papers on Economic Activity, pp. 1-84. Slaughter, M.J. (1995) "Multinational corporations, outsourcing, and American wage divergence", National Bureau of Economic Research Working Paper #5253. Slaughter, M.J. (1997) "International trade and labor-demand elasticities", National Bureau of Economic Research Working Paper. Slaughter, M.J. and P. Swagel (1997), “The effect of globalization on wages in the advanced economies”, Working Paper of the IMF #97/43. Slaughter, M.J. (2000), “What are the results of product price studies and what can we learn from their differences?”, in International trade and wages, edited by R. C. Feenstra, National Bureau of Economic Research and University of Chicago Press. Solow, R.M. (1986), The labor market as a social institution, Oxford, Basil Blackwell. Summers, L.H. (1991), “The scientific illusion in empirical macroeconomics”, Scandinavian Journal of Economics, 93(2), pp, 129-148. Topel, R.H. (1993), “Regional labor markets and the determinants of earnings inequality, American Economic Review, May, pp. 110-115. Topel, R.H. (1994), “Wage inequality and regional labor market performance in the United States”, in Labour market and economic performance: Europe, Japan and the United States, edited by T. Tachibanaki, St. Martin”s Press, New York. Topel, R.H. (1997), “Factor proportions and relative wages: the supply-side determinants of wage inequality”, Journal of Economic Perspectives, 11(2), pp. 55-74. United Nations, (1999), Human Development Report, 1999. United Nations, New York. Van Reenen, J. (1996), “The creation and capture of rents: wages and innovation in a panel of U.K. companies”, Quarterly Journal of Economics, 111(1), February, pp. 195-226. Welch, F. (1979), “The effect of cohort size on earnings growth: the baby boom babies”, Journal of Political Economy, October, 87, pp. S65-S97. Wood, A. (1994), North-south trade, employment and inequality, Clarendon Pres, Oxford.

66
Wood, A. (1995), "How trade hurt unskilled workers", Journal of Economic Perspectives, Summer, pp. 57-80.

67
Table 1. U.S. international trade in goods and services - balance of payments (BOP) basis (billions of dollars), 1960-1998 Exports Imports Trade Balance Total Goods Services Total Goods Services Total Goods Services 1960 25.9 19.7 6.3 22.4 14.8 7.7 3.5 4.9 -1.4 1961 26.4 20.1 6.3 22.2 14.5 7.7 4.2 5.6 -1.4 1962 27.7 20.8 6.9 24.4 16.3 8.1 3.4 4.5 -1.2 1963 29.6 22.3 7.3 25.4 17.0 8.4 4.2 5.2 -1.0 1964 33.3 25.5 7.8 27.3 18.7 8.6 6.0 6.8 -0.8 1965 35.3 26.5 8.8 30.6 21.5 9.1 4.7 5.0 -0.3 1966 38.9 29.3 9.6 36.0 25.5 10.5 2.9 3.8 -0.9 1967 41.3 30.7 10.7 38.7 26.9 11.9 2.6 3.8 -1.2 1968 45.5 33.6 11.9 45.3 33.0 12.3 0.2 0.6 -0.4 1969 49.2 36.4 12.8 49.1 35.8 13.3 0.1 0.6 -0.5 1970 56.6 42.5 14.2 54.4 39.9 14.5 2.3 2.6 -0.3 1971 59.7 43.3 16.4 61.0 45.6 15.4 -1.3 -2.3 1.0 1972 67.2 49.4 17.8 72.7 55.8 16.9 -5.4 -6.4 1.0 1973 91.2 71.4 19.8 89.3 70.5 18.8 1.9 0.9 1.0 1974 120.9 98.3 22.6 125.2 103.8 21.4 -4.3 -5.5 1.2 1975 132.6 107.1 25.5 120.2 98.2 22.0 12.4 8.9 3.5 1976 142.7 114.7 28.0 148.8 124.2 24.6 -6.1 -9.5 3.4 1977 152.3 120.8 31.5 179.5 151.9 27.6 -27.2 -31.1 3.8 1978 178.4 142.1 36.4 208.2 176.0 32.2 -29.8 -33.9 4.2 1979 224.1 184.4 39.7 248.7 212.0 36.7 -24.6 -27.6 3.0 1980 271.8 224.3 47.6 291.2 249.8 41.5 -19.4 -25.5 6.1 1981 294.4 237.0 57.4 310.6 265.1 45.5 -16.2 -28.0 11.9 1982 275.2 211.2 64.1 299.4 247.6 51.7 -24.2 -36.5 12.3 1983 266.0 201.8 64.2 323.8 268.9 54.9 -57.8 -67.1 9.3 1984 290.9 219.9 71.0 400.1 332.4 67.7 -109.2 -112.5 3.3 1985 288.8 215.9 72.9 410.9 338.1 72.8 -122.1 -122.2 0.1 1986 309.7 223.3 86.4 450.3 368.4 81.8 -140.6 -145.1 4.5

68
1987 348.8 250.2 98.6 502.1 409.8 92.3 -153.3 -159.6 6.2 1988 431.3 320.2 111.1 547.2 447.2 100.0 -115.9 -127.0 11.1 1989 489.4 362.1 127.2 581.6 477.4 104.2 -92.2 -115.2 23.0 1990 537.2 389.3 147.9 618.4 498.3 120.0 -81.1 -109.0 27.9 1991 581.3 416.9 164.3 611.9 490.7 121.2 -30.7 -73.8 43.1 1992 615.9 440.4 175.6 652.9 536.5 116.5 -37.0 -96.1 59.1 1993 641.8 456.8 185.0 711.7 589.4 122.3 -69.9 -132.6 62.7 1994 702.1 502.4 199.7 800.5 668.6 131.9 -98.4 -166.2 67.8 1995 793.5 575.8 217.6 891.0 749.6 141.4 -97.5 -173.7 76.2 1996 849.8 612.1 237.7 954.1 803.3 150.8 -104.3 -191.3 87.0 1997 938.5 679.7 258.8 1,043.3 876.4 166.9 -104.7 -196.7 91.9. 1998 933.9 670.2 263.7 1,098.2 917.2 181.0 -164.3 -246.9 82.7 1999 958.5 683.0 275.5 1,229.8 1,030.2 199.7 -271.3 -347.1 75.8 NOTE: 1. Compiled from official statistics of the U.S. Department of Commerce, Bureau of Economic Analysis. Data reflect revisions through February 18, 2000. 2. Balance of Payments (BOP) basis for goods reflects adjustments for timing, coverage, and valuation to the data compiled by the Census Bureau. The major adjustments concern: military trade of U.S. defense agencies, additional non-monetary gold transactions, and inland freight in Canada and Mexico. 3. Goods valuation are F.a.s. for exports and Customs value for imports. Source: Office of Trade and Economic Analysis, International Trade Administration, US Department of Commerce. http://www.ita.doc.gov/td/industry/otea/usfth/aggregate/H99t01.txt

69
Table 2. Changes in the degree of openness (1950-1992) 1913 1950 1973 1987 1992 1973-92 USA 6.1 4.2 6.8 9.8 10.9 +4.1 Australia 18.3 25.4 19.7 17.4 19.0 -0.7 Austria 8.2 16.6 30.3 35.3 38.9 +8.6 Belgium 50.9 31.0 54.5 67.8 68.5 +14.0 Brazil - 7.9 8.9 7.8 8.3 -0.6 Canada 15.1 10.3 22.9 26.1 27.0 +4.1 Denmark 26.9 28.7 29.5 30.5 33.2 +3.7 Finland 25.2 18.2 16.8 25.6 26.3 +9.5 France 13.9 14.1 17.1 20.6 22.4 +5.3 Germany 17.5 9.3 20.4 26.5 30.0 +9.6 Italy 12.0 9.3 18.4 19.2 19.8 +1.4 Japan 12.3 9.2 10.0 8.8 9.0 -1.0 Netherlands 38.2 40.7 43.8 48.5 50.6 +6.8 Norway 22.7 42.4 43.8 36.6 39.5 -4.3 Sweden 20.8 21.4 25.7 31.5 27.0 +1.3 Switzerland 31.4 26.0 31.5 35.1 34.2 +2.7 UK 20.9 23.3 24.9 26.0 24.5 -0.4 Source: Johnson and Stafford (1999). Notes: [(exports+imports)/2] * GDP (at current international prices)

70
Table 3. Source of U.S. Manufactures Imports, 1991-99 (Census Basis; General Imports, Customs; Millions of Dollars)
World Developed Developing % US imports from Countries Countries Developing
Countries 1991 393,820 256,223 137,596 34.9% 1992 434,256 273,481 160,775 37.0% 1993 480,016 297,470 182,546 38.0% 1994 557,871 338,255 219,616 39.4% 1995 629,632 371,781 257,851 41.0% 1996 659,867 380,550 279,318 42.3% 1997 728,574 411,736 316,839 43.5% 1998 792,422 444,206 348,216 43.9% 1999 882,729 491,059 391,670 44.4% 1990-99 % change 224.1% 191.7% 284.7% Note: Data are based on the Harmonized System of commodity classification and converted to other classification systems using recent Census data concordances to produce consistent time series. Source: Office of Trade and Economic Analysis, International Trade Administration, US Department of Commerce and http://www.ita.doc.gov/td/industry/otea/usfth/aggregate/H99t15.txt

71
Table 4. Source countries for US imports, 1991 and 1999 (% of total) 1991 1999 1991 1999 Canada 14.88 16.13 Finland 0.18 0.24 Japan 14.95 10.68 Denmark 0.27 0.23 Mexico 5.09 8.92 Honduras 0.09 0.22 China 3.10 6.65 Turkey 0.16 0.21 Germany 4.27 4.48 Argentina 0.21 0.21 United Kingdom 3.01 3.19 Angola 0.29 0.20 Taiwan 3.76 2.86 Guatemala 0.15 0.18 Korea, South 2.78 2.54 Peru 0.13 0.16 France 2.18 2.11 Bangladesh 0.09 0.16 Italy 1.92 1.82 Hungary 0.06 0.15 Malaysia 1.00 1.74 Algeria 0.34 0.15 Singapore 1.63 1.48 Ecuador 0.22 0.15 Thailand 1.00 1.16 Top 50 countries 77.00 80.76 Philippines 0.57 1.01 Brazil 1.10 0.92 Venezuela 1.34 0.92 Ireland 0.32 0.89 Hong Kong 1.52 0.86 Israel 0.57 0.80 Switzerland 0.91 0.78 Belgium/Luxembourg 0.67 0.77 Indonesia 0.53 0.77 India 0.52 0.74 Netherlands 0.79 0.69 Saudi Arabia 1.78 0.67 Sweden 0.74 0.66 Colombia 0.45 0.51 Russia 0.00 0.47 Australia 0.65 0.43 Spain 0.47 0.41 Nigeria 0.84 0.35 Dominican Republic 0.33 0.35 Iraq 0.00 0.34 Norway 0.27 0.33 Costa Rica 0.19 0.32 South Africa 0.28 0.26 Chile 0.21 0.24 Austria 0.21 0.24 Source: http://www.ita.doc.gov/td/industry/otea/usfth/aggregate/H99t11.txt http://www.ita.doc.gov/td/industry/otea/usfth/aggregate/H99t05.txt Total value of imports 1991=$611.9, 1999=$1229.8 (billions of current dollars)

72
Table 5. Source of OECD imports (% nominal GDP) 1962 1972 1982 1992 1997 1998 OECD OECD 5.85 7.77 10.13 10.67 12.79 13.18 of which European Union 3.33 4.54 5.70 6.13 6.98 7.27 United States 1.19 1.25 1.61 1.64 2.20 2.22 Other 1.33 1.97 2.82 2.89 3.61 3.69 Non-OECD 2.26 2.28 4.46 3.03 4.13 3.89 of which DAE’s + China 0.24 0.34 0.75 1.19 1.83 1.84 OPEC 0.63 0.77 2.07 0.69 0.78 0.59 USA OECD 1.80 3.45 4.94 5.74 6.97 7.03 of which European Union 0.69 1.15 1.45 1.60 1.90 2.01 Other 1.11 2.30 3.49 4.14 5.08 5.02 Non-OECD 0.99 1.03 2.55 2.67 3.51 3.40 of which DAE’s + China 0.14 0.30 0.72 1.45 2.01 2.03 OPEC 0.24 0.21 0.90 0.49 0.53 0.39 Japan OECD 5.43 4.21 4.72 3.38 4.04 3.89 of which European Union 0.90 0.73 0.79 0.91 1.07 1.03 United States 2.97 1.95 2.21 1.40 1.80 1.77 Other 1.56 1.52 1.71 1.07 1.16 1.08 Non-OECD 3.84 3.62 7.35 2.89 4.03 3.52 of which DAE’s + China 1.09 0.76 1.45 1.25 2.11 1.98 OPEC 1.11 1.50 4.44 1.04 1.19 0.91 European OECD 10.28 12.39 16.62 16.39 19.95 20.35 Union of which European Union 6.92 9.27 12.10 12.31 14.73 14.95 United States 1.66 1.37 1.92 1.46 2.00 2.07 Other 1.70 1.76 2.60 2.62 3.22 3.33 Non-OECD 4.00 3.53 5.87 3.23 4.34 4.21 of which DAE’s + China 0.26 0.27 0.54 0.91 1.41 1.49 OPEC 1.15 1.30 2.64 0.66 0.70 0.56 Source: OECD Economic Outlook, December 1999, Annex Table 64. DAE’s are Dynamic Asian economies of Chinese Taipei, Hong Kong, Korea, Malaysia, Singapore and Thailand

73
Table 6. Employment in industry as a % total employment % change in industrial employment % total employment in industry 1970-98 1970 1980 1993 1998 Australia -39.8 36.4 30.7 23.5 21.9 Austria -26.6 41.4 40.3 35.0 30.4 Belgium -37.1 41.5 33.9 27.2 26.1* Canada -26.8 30.6 28.3 22.2 22.4 Denmark -27.8 37.1 30.1 26.0 26.8** Finland -18.3 33.9 34.0 26.5 27.7 France -34.0 38.2 35.0 27.1 25.2 Germany -27.7 48.4 42.8 29.7 35.0 Greece -8.4 25.0 30.2 24.2 22.9* Iceland -26.6 34.6 35.8 24.8 25.4** Ireland -4.1 29.6 32.1 28.6 28.4** Italy -13.5 38.4 36.9 32.7 33.2 Japan -10.4 35.7 35.3 34.3 32.0 Luxembourg 44.3 38.0 31.3 n/a Netherlands -41.6 38.0 30.8 24.3 22.2** Norway -35.2 36.1 29.1 22.7 23.4 New Zealand -38.0 38.9 33.4 23.4 24.1 Portugal +15.9 31.4 35.8 32.8 36.4 Spain -11.4 34.3 34.7 30.1 30.4 Sweden -33.1 38.4 32.2 25.4 25.7 Switzerland -43.0 46.0 38.1 33.2 26.2 Turkey +45.3 16.1 19.7 21.2 23.4** UK -39.7 44.1 37.2 25.9 26.6 USA -29.6 33.5 30.0 23.8 23.6 Total OECD -23.7 36.3 33.3 27.3 27.7** Source: Labour Force Statistics, 1973-1993, OECD, 1995, Table 7.0; Labour Force Statistics, 1977-1997, OECD, 1995, Table 7.0; and for 1998 Quarterly Labour Force Statistics OECD 1999 #4. Industry defined as Major divisions 2-5 of the ISIC. *=1996; **=1997

74
Table 7. Employment-population rates by level of education and gender. Males Females Education level Low High Difference Low High Difference USA 1981 69.8 91.8 22.0 38.7 71.6 32.9 1994 62.4 90.6 28.2 39.2 80.1 40.9 Australia 1989 76.7 90.9 14.2 44.2 74.1 29.9 1994 73.0 90.2 17.2 50.5 78.3 27.8 Austria 1989 73.4 92.3 18.9 39.6 82.1 42.5 1994 70.0 91.6 21.6 47.0 83.9 36.9 Belgium 1989 68.4 91.9 23.5 29.6 79.9 50.3 1994 64.6 88.0 23.4 31.7 80.8 49.1 Canada 1981 79.6 94.6 15.0 39.5 73.7 34.2 1994 71.9 91.8 19.9 42.2 80.3 38.1 Denmark 1981 77.1 93.1 16.0 59.5 86.9 27.4 1994 65.7 89.8 24.1 55.5 87.9 32.4 Finland 1982 79.2 96.6 17.4 67.6 87.7 20.1 1994 54.6 86.5 31.9 50.9 84.0 33.1 France 1981 80.3 92.5 12.2 47.6 78.7 31.1 1994 62.1 86.0 23.9 44.0 76.2 32.2 Italy 1989 78.0 91.0 13.0 30.5 79.9 49.4 1994 72.2 88.0 15.8 28.5 75.0 46.5 New Zealand 1981 88.3 94.8 6.5 47.9 69.4 21.5 1994 71.4 92.1 20.7 51.7 78.5 26.8 Norway 1981 83.1 94.5 11.4 52.8 85.4 32.6 1994 69.2 93.2 24.0 51.6 89.1 37.5 Portugal 1989 78.7 79.5 0.8 56.2 61.3 5.1 1994 81.1 92.6 11.5 54.8 92.5 37.7 Spain 1981 81.3 89.8 8.5 23.8 67.8 44.0 1994 67.3 82.0 14.7 26.1 68.2 42.1 Sweden 1981 85.3 95.2 9.9 68.7 93.2 24.5 1994 81.8 90.8 9.0 74.8 89.5 14.7 UK 1984 71.7 91.3 19.6 53.1 72.6 19.5 1994 61.0 90.0 29.0 52.0 84.3 32.3 Source: OECD Employment Outlook, 1997, Table 4.1b. 1 The classification of educational attainment is based on the International Standard Classification for Education (SCED). A low level of education corresponds to ISCED levels 0, 1 and 2, that is up to lower secondary education. A high level corresponds to ISCED levels 6 and 7, that is up to tertiary education. The employment rate is the share of employed workers aged 25-64 in the total population aged 25-64 years.

75
Table 8. Measures of weekly wage inequality in the United States, 1963-1995. SD of Log Wage Percentiles of log wage distribution 90-10 90-50 50-10 A) Male 1963 .469 1.19 .51 .68 1971 .495 1.16 .55 .61 1979 .517 1.27 .55 .72 1987 .579 1.47 .65 .82 1995 .616 1.54 .74 .79 B) Female 1963 .406 1.04 .50 .54 1971 .430 1.08 .54 .55 1979 .432 1.05 .54 .51 1987 .506 1.30 .61 .69 1995 .544 1.38 .68 .70 A) All males and females 1963 .502 1.27 .57 .70 1971 .530 1.31 .62 .68 1979 .539 1.35 .66 .69 1987 .580 1.44 .70 .74 1995 .603 1.54 .76 .78 Notes: Full-time, full year workers, March CPS Source: Katz and Autor (1999).

76
Table 9. Male earnings inequality since 1979 across the OECD. 1979 1986 1994/5 1979 1986 1994/5 D9/D5 D5/D1 Australia 1.69 1.70 1.75 1.62 1.64 1.68 Austria 1.62 1.65 1.63 1.57 1.67 Belgium 1.72 1.57 1.39 1.38 Canada 1.67 1.68 1.73 2.07 2.40 2.18 Finland 1.67 1.73 1.73 1.46 1.50 1.46 France 2.04 2.10 2.13 1.66 1.61 1.61 Germany 1.63 1.66 1.64 1.46 1.42 1.37 Italy 1.46 1.53 1.65 1.57 1.44 1.60 Japan 1.63 1.69 1.73 1.59 1.64 1.60 Netherlands 1.64 1.66 1.55 1.56 New Zealand 1.61 1.79 1.69 1.77 Norway 1.46 1.49 1.50 1.41 1.45 1.32 Sweden 1.61 1.60 1.62 1.31 1.34 1.36 U.K. 1.58 1.73 1.86 1.55 1.66 1.78 U.S.A. 1.73 1.87 2.04 1.84 2.07 2.13 Notes: D9/D5 is the value of the ninth decile over the fifth (median): D5/D1 is the value of the fifth decile over the first decile. Source: OECD Employment Outlook, July 1996, Table 3.1.

77
Table 10. Human poverty in industrialized countries. (1) (2) (3) (4) (5) (6) (7) (8) (9) (10) Canada 1 9 9.3 16.6 5,971 42,110 7.1 11.7 5.9 22,480 Norway 2 4 9.1 16.8 6,315 37,379 5.9 6.6 2.6 24,450 United States 3 17 12.6 20.7 5,800 51,705 8.9 19.1 14.1 29,010 Japan 4 8 8.2 16.8 8,987 38,738 4.3 11.8 3.7 24,070 Belgium 5 11 10.1 18.4 7,718 35,172 4.6 5.5 12.0 22,750 Sweden 6 1 8.7 7.5 7,160 33,026 4.6 6.7 4.6 19,790 Australia 7 12 8.9 17.0 4,077 39,098 9.6 12.9 7.8 20,210 Netherlands 8 2 9.3 10.5 7,109 31,992 4.5 6.7 14.4 21,110 United Kingdom 10 15 9.8 21.8 3,963 38,164 9.6 13.5 13.1 20,730 France 11 7 11.3 16.8 5,359 40,098 7.5 7.5 12.0 22,030 Switzerland 12 .. 9.8 18.9 5,907 50,666 8.6 .. .. 25,240 Finland 13 6 11.3 16.8 5,141 30,682 6.0 6.2 3.8 20,150 Germany 14 3 10.7 14.4 6,594 37,963 5.8 5.9 11.5 21,260 Denmark 15 10 12.8 16.8 5,454 38,986 7.1 7.5 7.6 23,690 Austria 16 .. 10.9 .. .. .. .. .. 8.0 22,070 Luxembourg 17 .. 10.6 .. .. .. .. 5.4 4.3 30,863 New Zealand 18 13 11.1 18.4 4,264 37,369 8.8 9.2 .. 17,410 Italy 19 5 9.0 16.8 6,174 37,228 6.0 6.5 2.0 20,290 Ireland 20 16 10.0 22.6 .. .. .. 11.1 36.5 20,710 Spain 21 14 10.1 16.8 15,669 24,998 4.4 10.4 21.1 15,930 Column 1. Human Development Index rank, 1997. Column 2. Human Poverty Index rank, 1997. Column 3. People not expected to survive to age 60 as % of total population, 1997 Column 4. People who are functionally illiterate as % age 16-65, 1995 Column 5. Real GDP per capita (PPP$) poorest 20%, 1980-94. Column 6. Real GDP per capita (PPP$) richest 20%, 1980-94. Column 7. Real GDP per capita (PPP$) richest 20% to poorest 20%,1980-94. Column 8. Population below poverty line (%) – 50% of median income, 1989-94. Column 9. Population below poverty line (%) – $14.40 a day (1985 PPP$), 1989-95. Column 10. Real GDP per capita (PPP$), 1997. Source: Human Development Report, United Nations, 1999, Table 5, p.149 and GDP per capita Table 1, p.134.
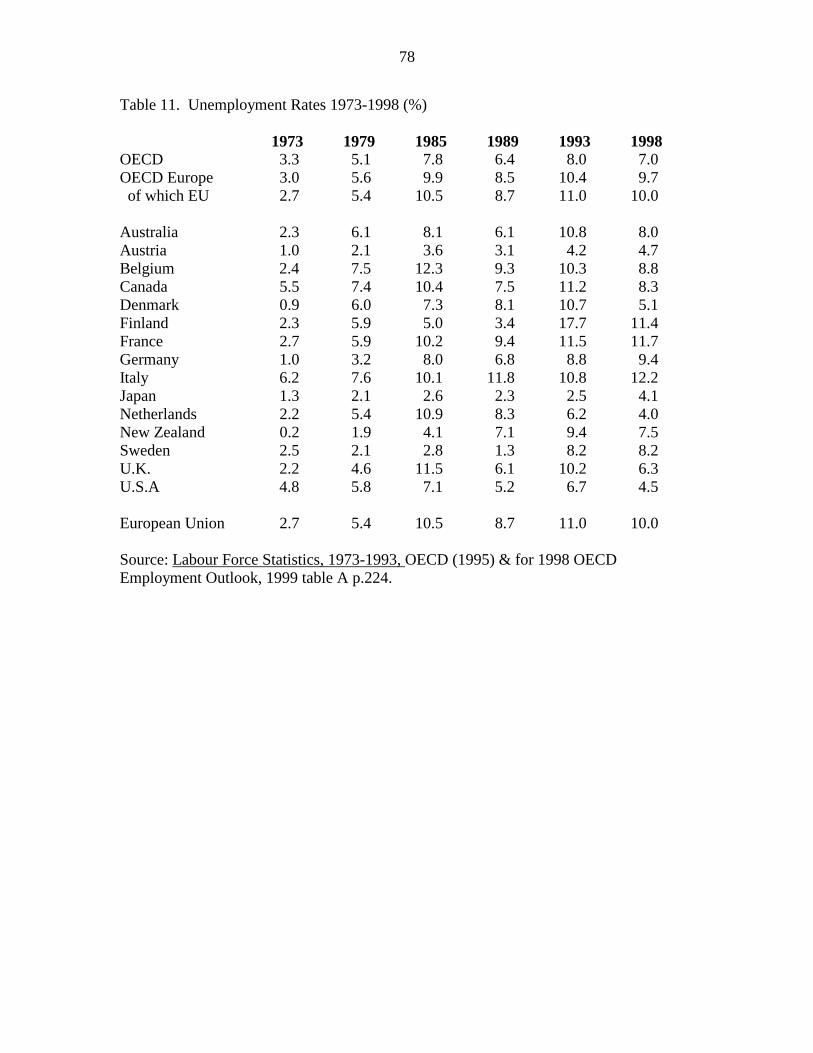
78
Table 11. Unemployment Rates 1973-1998 (%) 1973 1979 1985 1989 1993 1998 OECD 3.3 5.1 7.8 6.4 8.0 7.0 OECD Europe 3.0 5.6 9.9 8.5 10.4 9.7 of which EU 2.7 5.4 10.5 8.7 11.0 10.0 Australia 2.3 6.1 8.1 6.1 10.8 8.0 Austria 1.0 2.1 3.6 3.1 4.2 4.7 Belgium 2.4 7.5 12.3 9.3 10.3 8.8 Canada 5.5 7.4 10.4 7.5 11.2 8.3 Denmark 0.9 6.0 7.3 8.1 10.7 5.1 Finland 2.3 5.9 5.0 3.4 17.7 11.4 France 2.7 5.9 10.2 9.4 11.5 11.7 Germany 1.0 3.2 8.0 6.8 8.8 9.4 Italy 6.2 7.6 10.1 11.8 10.8 12.2 Japan 1.3 2.1 2.6 2.3 2.5 4.1 Netherlands 2.2 5.4 10.9 8.3 6.2 4.0 New Zealand 0.2 1.9 4.1 7.1 9.4 7.5 Sweden 2.5 2.1 2.8 1.3 8.2 8.2 U.K. 2.2 4.6 11.5 6.1 10.2 6.3 U.S.A 4.8 5.8 7.1 5.2 6.7 4.5 European Union 2.7 5.4 10.5 8.7 11.0 10.0 Source: Labour Force Statistics, 1973-1993, OECD (1995) & for 1998 OECD Employment Outlook, 1999 table A p.224.

79
Table 12. Between and within group components of changes in wage inequality in the United States, 1963-95 Total change Between Within % explained % residual group group change change A) Males 1963-1995 .159 .067 .092 42 58 1963-1979 .047 .014 .033 33 67 1979-1995 .112 .053 .059 47 53 B) Females 1963-1995 .131 .048 .083 37 63 1963-1979 .022 -.001 .023 -5 105 1979-1995 .109 .049 .060 45 55 A) All males and females 1963-1995 .111 .028 .083 25 75 1963-1979 .037 .010 .027 27 73 1979-1995 .074 .018 .056 24 76 Notes: full-time full-year workers, March CPS Source: Katz and Autor (1999)

80
Table 13. Evolution of trade prices, 1980-1990 Import prices Export prices Trade price gap Trade price gap minus prices of office & computer equipment Australia 31.3 9.5 -21.8 -21.3 Canada 14.0 38.0 24.0 10.0 Austria 26.4 27.8 1.4 -3.5 Belgium 18.0 26.5 8.5 7.3 Denmark 10.9 39.1 28.2 25.4 Finland 27.6 34.0 6.4 5.5 France 20.9 38.0 17.1 17.8 Germany 20.2 40.4 20.2 18.7 Italy 24.0 32.7 8.7 7.7 Netherlands 19.3 14.8 -4.5 -5.7 Portugal 15.9 21.2 5.3 5.7 Spain 21.0 33.9 12.9 11.6 Sweden 25.2 37.6 12.4 14.0 UK 19.3 28.2 8.9 8.9 Japan -7.5 43.2 50.7 55.7 New Zealand 23.1 25.0 1.9 2.1 Norway 14.4 10.6 -3.8 -18.1 USA 0.7 30.3 29.6 14.6 EU 20.7 31.2 10.5 9.5 OECD 18.0 29.5 11.5 8.7 Source: OECD (1997) Notes: import prices are average unit values [the ratio of imports at current prices (in US$) to imports at constant prices) of import competing sectors Export prices are average unit values [the ratio of exports at current prices (in US$) to exports at constant prices) of export sectors Trade price gap is the difference between column 2 and column 1. A positive (negative) indicates that export prices rose (fell) with respect to import prices.

81
Table 14. Growth Rates of College Educated Workers in Four Countries Group and Ages (Males & Females) Annual Log Growth Rates A) United States 1969-1979 1979-1989 Employees age 18-64 .043 .023 Population age 18-64 .043 .026 B) Britain 1973-1979 1979-1989 Employees age 16-60 .068 .037 Population age 16-60 .068 .037 C) France 1970-1980 1980-1989 Labor force age 15+ .039 .050 Population age 15+ (males) .045 .039 Population age 15+ (females) .026 .046 D) Japan 1971-1979 1979-1987 All Employees age 15+ .050 .029 Source: Katz et al (1995).
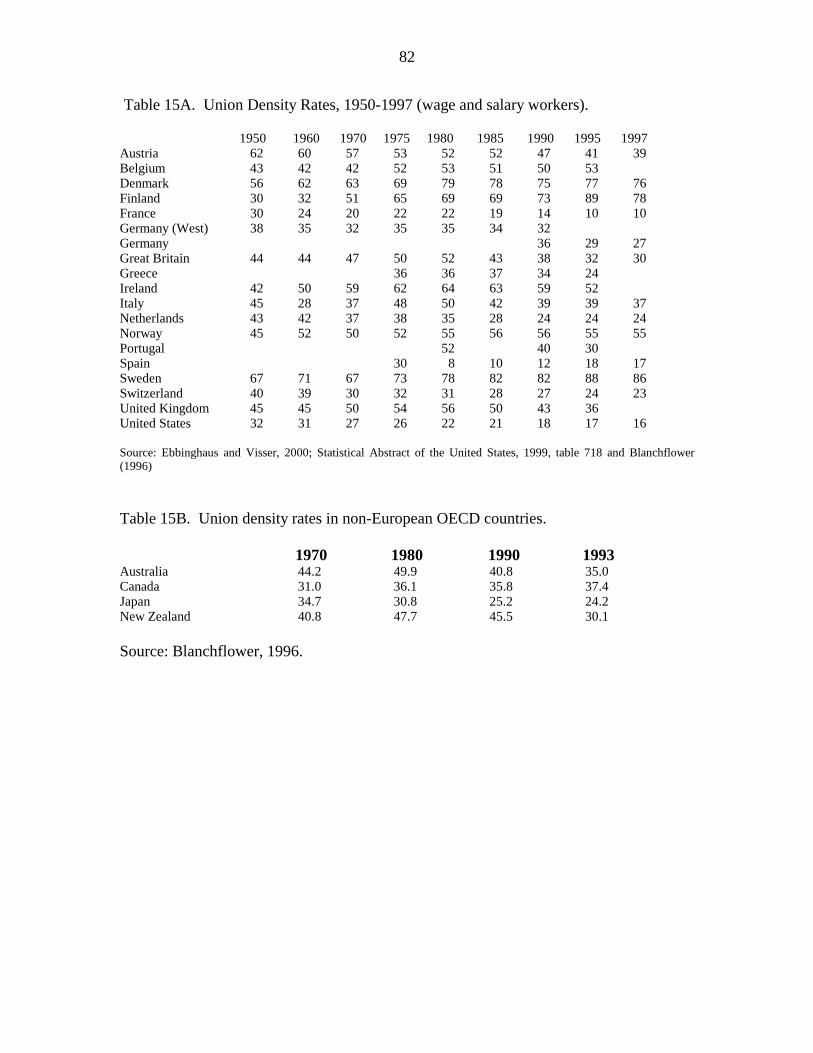
82
Table 15A. Union Density Rates, 1950-1997 (wage and salary workers).
1950 1960 1970 1975 1980 1985 1990 1995 1997 Austria 62 60 57 53 52 52 47 41 39 Belgium 43 42 42 52 53 51 50 53 Denmark 56 62 63 69 79 78 75 77 76 Finland 30 32 51 65 69 69 73 89 78 France 30 24 20 22 22 19 14 10 10 Germany (West) 38 35 32 35 35 34 32 Germany 36 29 27 Great Britain 44 44 47 50 52 43 38 32 30 Greece 36 36 37 34 24 Ireland 42 50 59 62 64 63 59 52 Italy 45 28 37 48 50 42 39 39 37 Netherlands 43 42 37 38 35 28 24 24 24 Norway 45 52 50 52 55 56 56 55 55 Portugal 52 40 30 Spain 30 8 10 12 18 17 Sweden 67 71 67 73 78 82 82 88 86 Switzerland 40 39 30 32 31 28 27 24 23 United Kingdom 45 45 50 54 56 50 43 36 United States 32 31 27 26 22 21 18 17 16 Source: Ebbinghaus and Visser, 2000; Statistical Abstract of the United States, 1999, table 718 and Blanchflower (1996) Table 15B. Union density rates in non-European OECD countries. 1970 1980 1990 1993 Australia 44.2 49.9 40.8 35.0 Canada 31.0 36.1 35.8 37.4 Japan 34.7 30.8 25.2 24.2 New Zealand 40.8 47.7 45.5 30.1 Source: Blanchflower, 1996.

83
Men (+) Women ( )
90-1
0 Lo
g W
eekl
y W
age
Diff
eren
tial
Figure 2: Overall US wage inequality, 1963-95
63 70 75 80 85 90 95
1
1.1
1.2
1.3
1.4
1.5
1.6
Source: Katz and Autor (1999, Figure 4)
Figure 1. % production workers in manufacturing%
pro
du
ctio
n w
ork
ers
Year1920 1940 1960 1980 2000
65
70
75
80
85
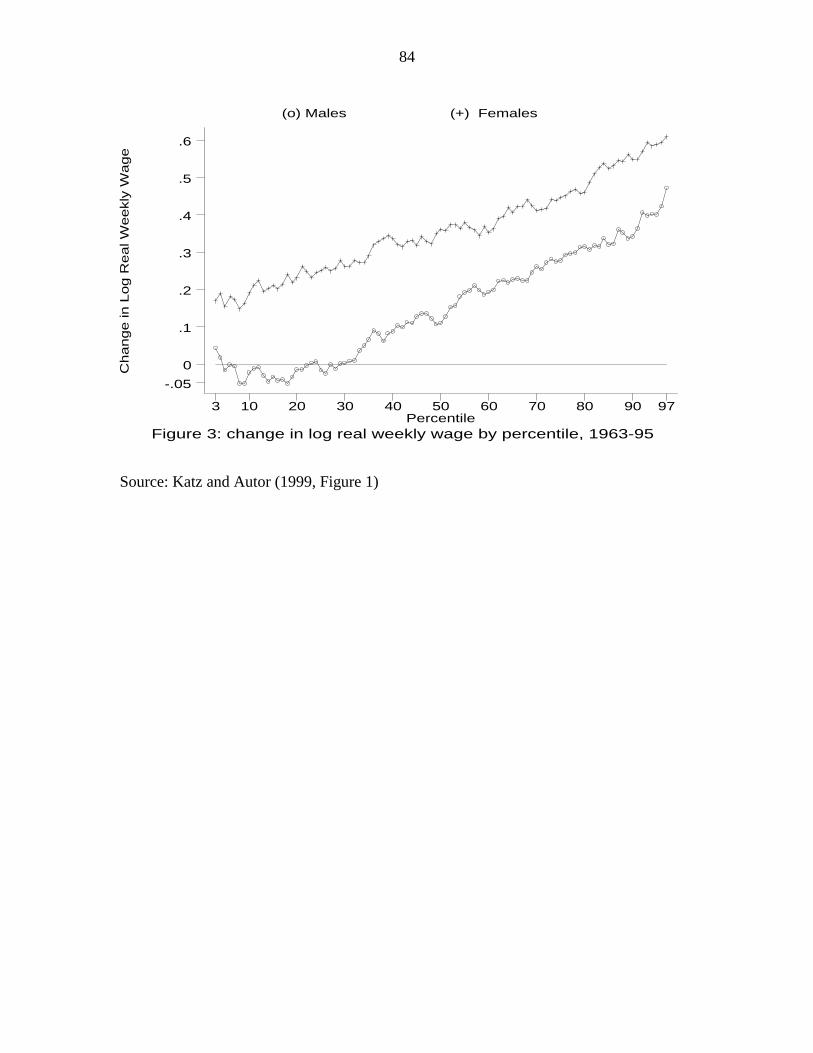
84
(o) Males (+) FemalesC
hang
e in
Log
Rea
l Wee
kly
Wag
e
Figure 3: change in log real weekly wage by percentile, 1963-95Percentile
3 10 20 30 40 50 60 70 80 90 97
-.050
.1
.2
.3
.4
.5
.6
Source: Katz and Autor (1999, Figure 1)

85
Fem
ale/
Mal
e Lo
g W
age
Diff
Figure 4a: Female/male log wage differential, 1963-95
High School College Grads
63 67 71 75 79 83 87 91 95
-.55
-.5
-.45
-.4
-.35
-.3
-.25
-.2
Col
lege
/HS
Log
Wag
e D
iff
Figure 4B: College/HS log weekly wage differential, 1963-95
All Young, 5 Years Experience
63 67 71 75 79 83 87 91 95
.3
.35
.4
.45
.5
.55
.6

86
Log
Wag
e D
iff 2
5/5/
Yea
r E
xp
Figure 4C: Returns to experience, males, 1963-95
High School College Grads
63 67 71 75 79 83 87 91 95
.2
.25
.3
.35
.4
.45
.5
.55
Source: Katz and Autor (1999, Figure 5a-c)
(o) Males (+) Females
90%
- 1
0% L
og W
eekl
y W
age
Res
idua
l
Figure 5: 90%-10% Log weekly wage residual, 1963-95
63 67 71 75 79 83 87 91 95
.85
.9
.95
1
1.05
1.1
1.15
1.21.22
Source: Katz and Autor (1999, Figure 5d)