
Chapter 10 Globalization and Firm Demand for Skilled Labor ...
27
Chapter 10 Globalization and Firm Demand for Skilled Labor in China’s Manufacturing Sector Yifan Zhang Department of Economics, Lignan University March 2010 This chapter should be cited as Zhang, Y. (2010), ‘Globalization and Firm Demand for Skilled Labor in China’s Manufacturing Sector’, in Hahn, C. H. and D. Narjoko (eds.), Causes and Consequences of Globalization in East Asia: What Do the Micro Data Analyses Show?. ERIA Research Project Report 2009-2, Jakarta: ERIA. pp.313-338.
Transcript of Chapter 10 Globalization and Firm Demand for Skilled Labor ...
Chapter 10
Globalization and Firm Demand for Skilled
Labor in China’s Manufacturing Sector
Yifan Zhang
Department of Economics, Lignan University
March 2010
This chapter should be cited as
Zhang, Y. (2010), ‘Globalization and Firm Demand for Skilled Labor in China’s
Manufacturing Sector’, in Hahn, C. H. and D. Narjoko (eds.), Causes and
Consequences of Globalization in East Asia: What Do the Micro Data Analyses Show?.
ERIA Research Project Report 2009-2, Jakarta: ERIA. pp.313-338.
313
CHAPTER 10
Globalization and Firm Demand for Skilled Labor in China’s
Manufacturing Sector
YIFAN ZHANG
Department of Economics, Lingnan University
In this paper, we use large-scale firm-level census data to examine how trade and FDI
affect firm demand for skilled labor in China’s manufacturing sector. Our estimation results
suggest that exporters tend to employ more unskilled workers than non-exporters. This is true
for both Chinese exporters in the ordinary trade regime and foreign-invested exporting firms in
the processing trade regime. Although this finding is consistent with the Heckscher–Ohlin
model, it contradicts the predictions of the recent international trade literature on
heterogeneous firms. We also find that FDI is associated with a higher share of skilled labor in
total employment, which supports the Feenstra-Hanson theory of outsourcing. Our results are
robust to alternative definitions of variables and econometric methods.
314
1. Introduction
One of the most important questions in the study of globalization is how trade and
FDI liberalization affects demand for skilled labor. This issue is related to the question
of globalization and wage inequality. Conventional wisdom predicts favorable effects
of trade liberalization on unskilled labor. According to the Heckscher–Ohlin model,
trade liberalization will increase demand for unskilled labor in developing countries
because developing countries are relatively rich in unskilled labor and will specialize in
the production of goods that are unskilled-labor-intensive. The Stolper-Samuelson
theorem, which is based on the Heckscher–Ohlin model, predicts that trade will increase
the wages of unskilled workers and reduce wage inequality between skilled and
unskilled workers. However, there is overwhelming empirical evidence in developing
countries that unskilled workers are generally not better off relative to workers with
higher skill levels.
Motivated by this observation, Feenstra and Hanson (1996, 1999) propose an
alternative explanation. Their theory is based on outsourcing, or the international
fragmentation of production, where production processes are sliced thinner and thinner
into many stages and the resulting production fragments are carried out in different
locations. According to Feenstra and Hanson, those production activities that are shifted
to developing countries are unskill-intensive in developed countries but are in fact skill-
intensive in developing countries.
In a growing body of literature on heterogeneous firms in international trade,
exporters are considered to be superior to non-exporters in many respects, including the
skill intensity of their workers. For example, according to the theoretical models of
Yeaple (2005) and Costatini and Melitz (2007), in equilibrium, exporters are more
productive and choose to employ more skilled workers than non-exporters.
China is an important laboratory for investigations of the relationship between
globalization and demand for skilled labor. In the past three decades, China has been
transformed from one of the most isolated countries in the world into one of its largest
trading nations. China edged past Germany in 2009 to become the world’s largest
315
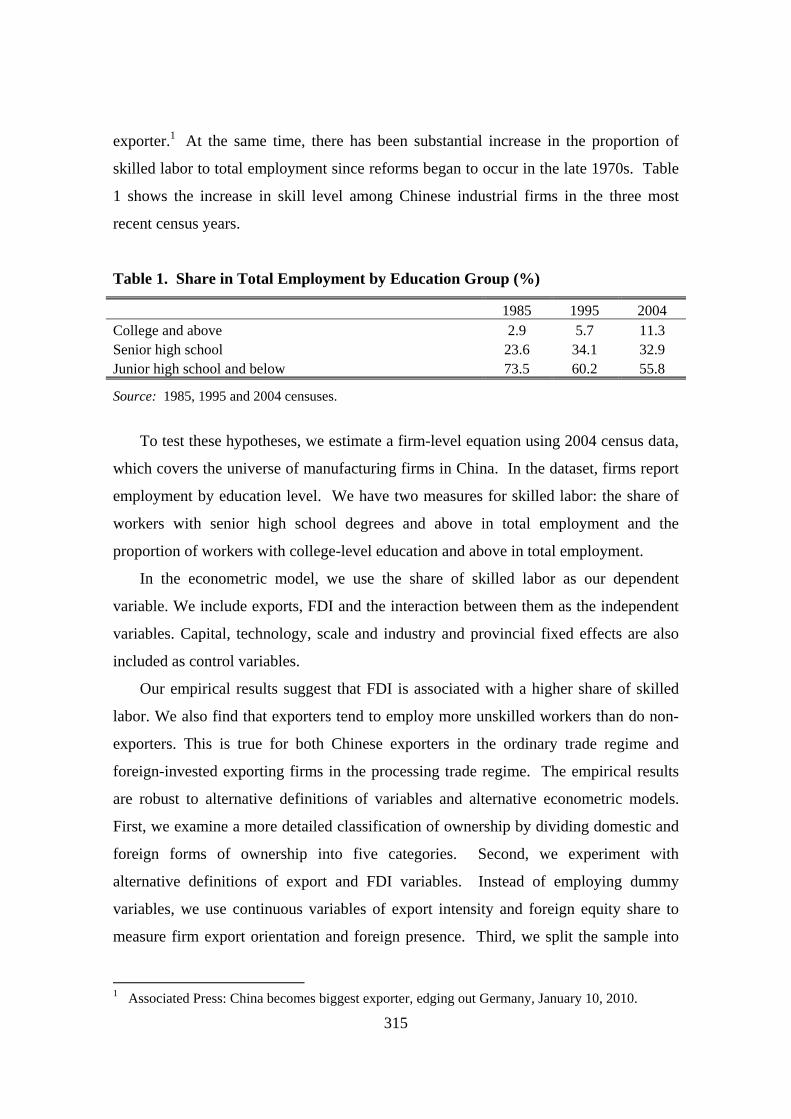
exporter.1 At the same time, there has been substantial increase in the proportion of
skilled labor to total employment since reforms began to occur in the late 1970s. Table
1 shows the increase in skill level among Chinese industrial firms in the three most
recent census years.
Table 1. Share in Total Employment by Education Group (%)
1985 1995 2004 College and above 2.9 5.7 11.3 Senior high school 23.6 34.1 32.9 Junior high school and below 73.5 60.2 55.8
Source: 1985, 1995 and 2004 censuses.
To test these hypotheses, we estimate a firm-level equation using 2004 census data,
which covers the universe of manufacturing firms in China. In the dataset, firms report
employment by education level. We have two measures for skilled labor: the share of
workers with senior high school degrees and above in total employment and the
proportion of workers with college-level education and above in total employment.
In the econometric model, we use the share of skilled labor as our dependent
variable. We include exports, FDI and the interaction between them as the independent
variables. Capital, technology, scale and industry and provincial fixed effects are also
included as control variables.
Our empirical results suggest that FDI is associated with a higher share of skilled
labor. We also find that exporters tend to employ more unskilled workers than do non-
exporters. This is true for both Chinese exporters in the ordinary trade regime and
foreign-invested exporting firms in the processing trade regime. The empirical results
are robust to alternative definitions of variables and alternative econometric models.
First, we examine a more detailed classification of ownership by dividing domestic and
foreign forms of ownership into five categories. Second, we experiment with
alternative definitions of export and FDI variables. Instead of employing dummy
variables, we use continuous variables of export intensity and foreign equity share to
measure firm export orientation and foreign presence. Third, we split the sample into
1 Associated Press: China becomes biggest exporter, edging out Germany, January 10, 2010.
316
data from the coastal region and from the interior region and run separate regressions
with these two subsamples. Fourth, we use Tobit regression as an alternative
econometric method. Our baseline regression results hold given all of these robustness
checks.
The evidence that exporters employ more unskilled labor supports the Heckscher–
Ohlin model. Our findings are consistent with Ma and Zhang (2008), who find that
Chinese exporters are more labor intensive than non-exporters. Exporting firms are
those that most effectively exploit the comparative advantages of labor cost in China.
However, our findings contradict the “stylized facts’ of recent theoretical and empirical
literature on heterogeneous firms. The findings related to FDI support the Feenstra-
Hanson theory of outsourcing. Those activities that have shifted from developed
countries to China are indeed more skill-intensive than the average skill level of existing
production activities in China.
Although wage inequality is related to both demand and supply factors, our
empirical results have important implications for public policy. China has evolved from
one of the most egalitarian countries before reform into one of the most unequal
countries in the world. According to our findings, exporting can help reduce the wage
gap between the skilled labor and the unskilled labor, while FDI appears to increase
such inequality.
The rest of the paper is organized as follows. The next section presents the
background for this study. Section 3 discusses the literature and hypotheses. Section 4
describes the data and the estimation strategy. The regression results are reported in
Section 5. Finally, we discuss our conclusions and policy implications in Section 6.
2. Background: Trade and FDI in China
In the 1970s, China was one of the most isolated countries in the world. Since the
early 1980s, the Chinese government has been actively promoting foreign trade. The
reforms had several key features, including granting trading rights to manufacturing
firms, the reduction and eventual elimination of the mandatory plan, and the reform of
317
the foreign exchange regime (Lardy, 2001, p. 46). These trade reforms, combined with
other export promotion policies such as rebates on value-added taxes on exports and the
duty drawback system, have helped to transform China into a major trading power.
Stimulated by China’s entry into the WTO, the annual growth rate for Chinese exports
between 2001 and 2009 was as high as 20 percent. In the reform era, China’s exports
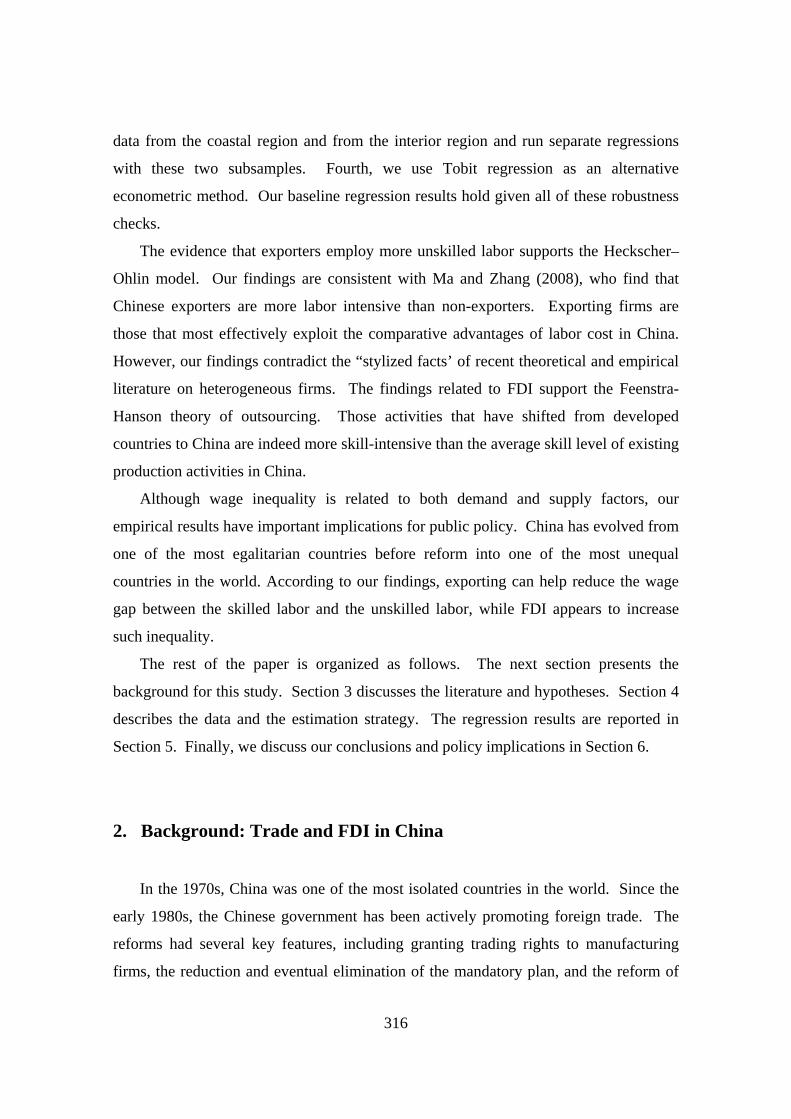
grew from $14 billion in 1979 to $1202 billion in 2009 (Figure 1), while over the same
period, the ratio of exports to GDP rose from 0.06 to 0.31.
Figure 1. China’s Exports (1979-2009)
(Unit: Billions of U.S. Dollars)
Sources: 1979-2008: China Statistical Yearbook, 1988, 1995, 2009; 2009: Statistical Communiqué of the People’s Republic of China on 2009 National Economic and Social Development.
China’s exports structure has changed dramatically over the past three decades. In
the 1980s, China’s leading exports were crude oil, refined petroleum products and
apparel. In the early and mid-1990s, labor-intensive goods dominated Chinese exports.
Since the late 1990s, China has emerged as a major producer and exporter of electronic
0
200
400
600
800
1000
1200
1400
1600
79 80 81 82 83 84 85 86 87 88 89 90 91 92 93 94 95 96 97 98 99 00 01 02 03 04 05 06 07 08 09
318
and information technology products such as consumer electronics, office equipment
and computers, and communications equipment. China has become the world’s new
manufacturing workshop for technology-oriented products.
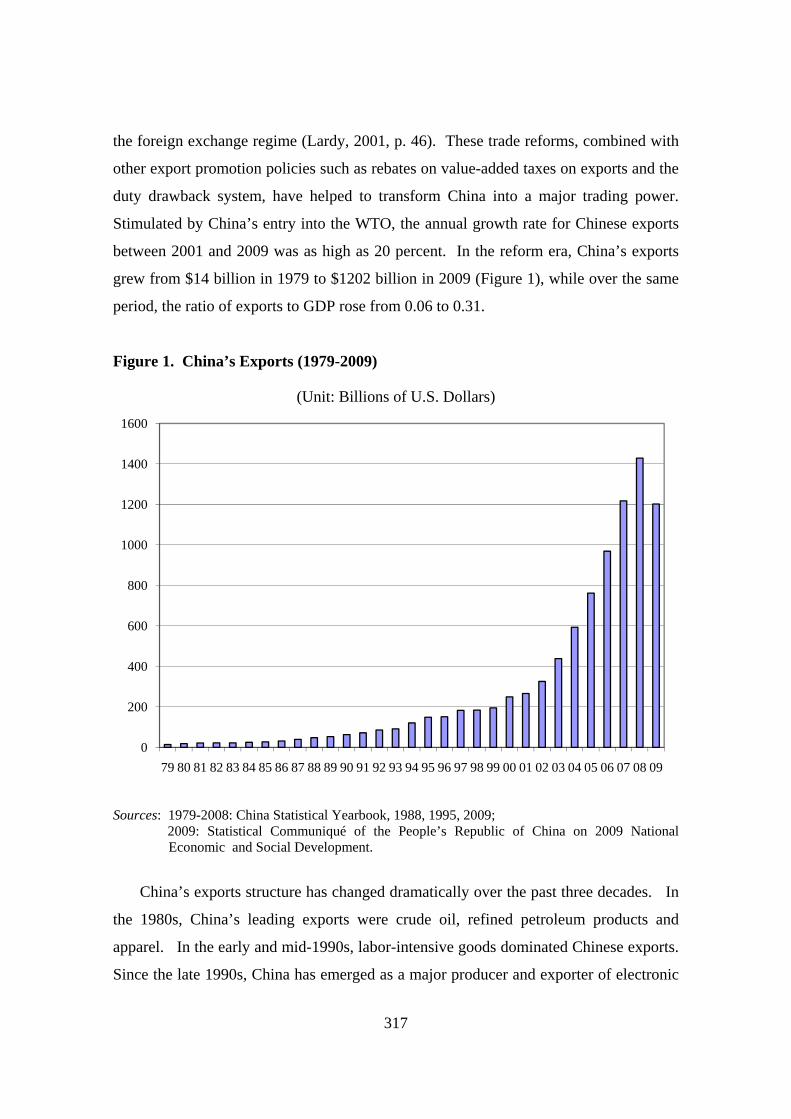
Similarly, in the reform era, China has aggressively pursued policies that encourage
FDI inflow. It is not surprising that China developed its first law governing foreign
investment in 1979, while the first law relevant to domestic firms was not enacted until
1988. 2 Figure 2 shows that the amount of China’s FDI inflow has increased
dramatically, shifting from less than $1 billion in 1983 to $90 billion in 2009. China’s
accumulative FDI reached $900 billion by the end of 2009.3 Foreign-invested firms
accounted for about 10 percent of total investment in fixed assets and 31 percent of total
industrial output in 2008.4 Nearly 70 percent of FDI in China was poured into the
manufacturing sector. This is mainly due to the competitive edge that China’s relatively
low production cost for manufacturing affords. One of the main goals of China’s FDI
policies is to promote technology transfer to China, especially from multinational
companies. Since the mid-1990s, China has been encouraging FDI to flow into
technology-oriented industries such as electronic information, bioengineering, new
materials, and aviation and aerospace. Local R&D centers have also been established.5
2 Source: Table 11.1, Clarke et al. (2008). 3 Source: Author’s calculation based on information from the China Statistical Yearbook. 4 Source: China Statistical Yearbook 2009. 5 See Long (2005) for a recent review of China’s FDI policy.
319
Figure 2. FDI Inflow into China (1983-2009)
(Unit: Billions of U.S. Dollars)
Sources: 1983-2008: China Statistical Yearbook, 1988, 1995, 2009; 2009: Statistical Communiqué of the People’s Republic of China on 2009 National
Economic and Social Development.
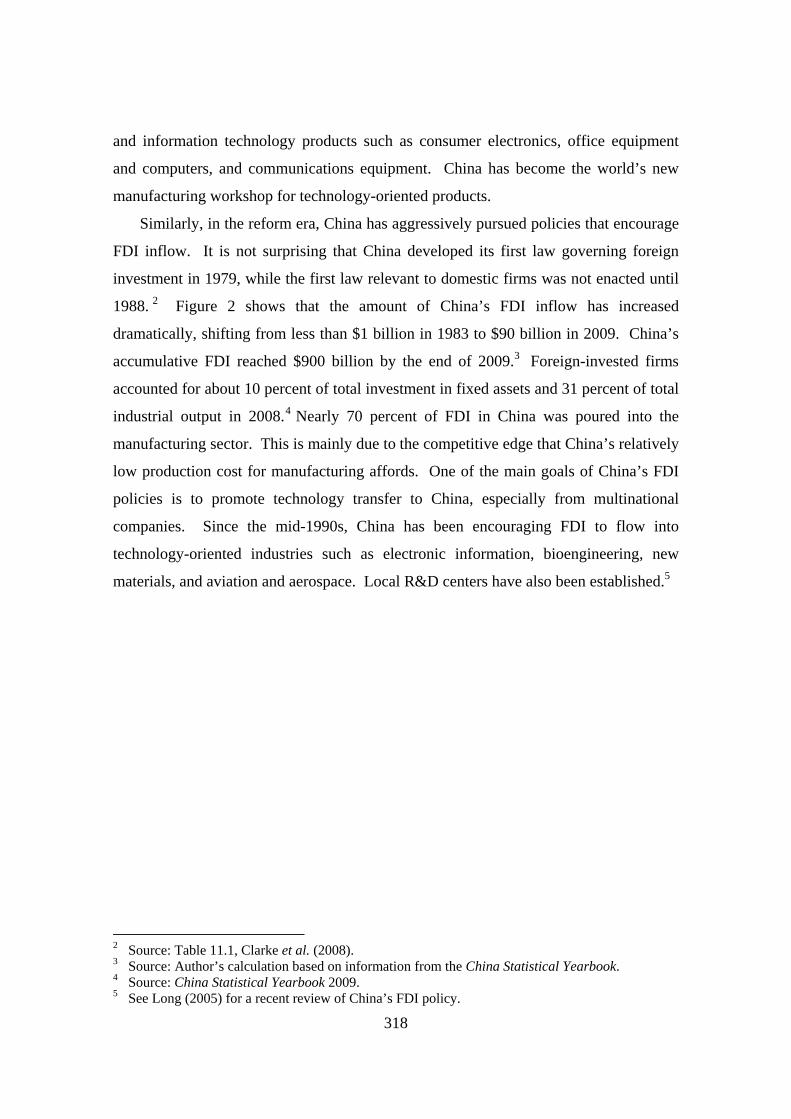
China’s exports and FDI are closely related. With the increasing fragmentation of
production, multinationals have used China as a major assembly center. A large part of
China’s overall success in foreign trade can be attributed to the strong export orientation
of foreign-invested firms. Foreign parts and components are brought in, assembled or
processed using relatively low-cost Chinese labor, and then exported to international
markets. The contribution of foreign-invested firms to total exports jumped from only
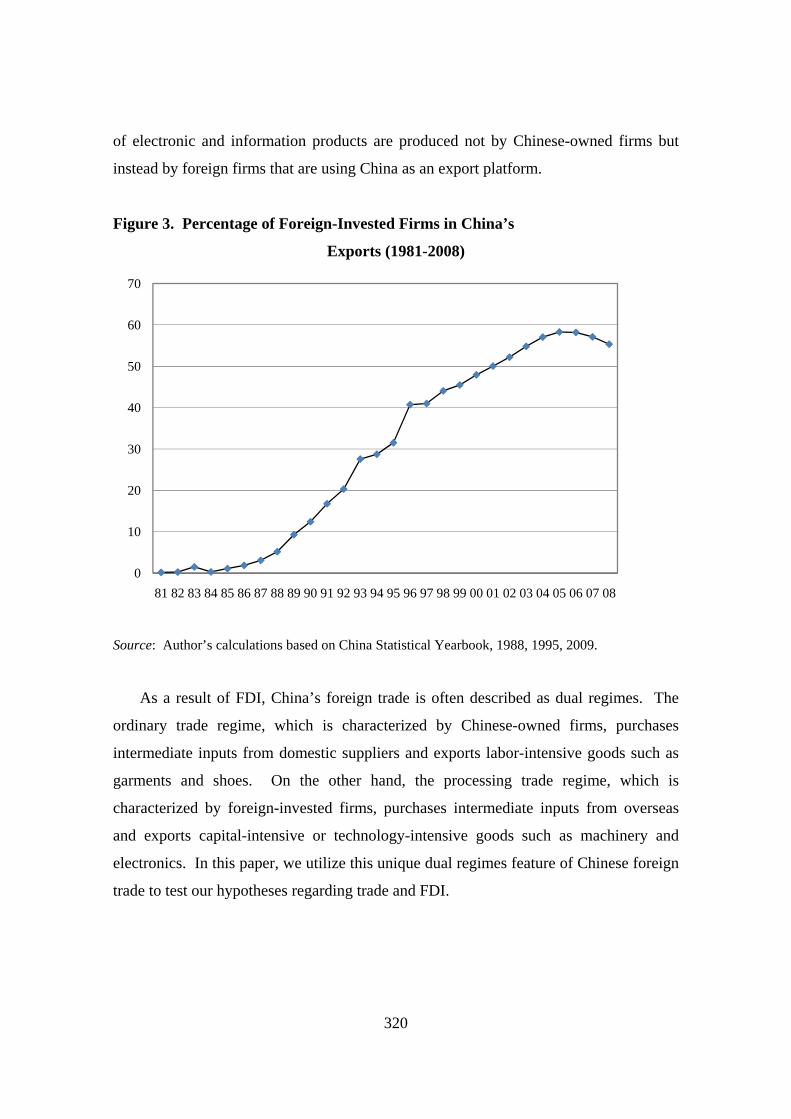
0.2 percent in 1981 to 55 percent in 2008 (Figure 3). In the electronics and
telecommunications industry, for example, foreign-invested firms accounted for 95
percent of Chinese exports. China is able to export huge quantities of high-tech
products only because it imports most of the high value-added and technology-intensive
parts and components. China only specializes in the assembly of these goods, which
constitutes the labor-intensive stage of the vertical value chain. Moreover, most exports
0
10
20
30
40
50
60
70
80
90
100
83 84 85 86 87 88 89 90 91 92 93 94 95 96 97 98 99 00 01 02 03 04 05 06 07 08 09
320
of electronic and information products are produced not by Chinese-owned firms but
instead by foreign firms that are using China as an export platform.
Figure 3. Percentage of Foreign-Invested Firms in China’s
Exports (1981-2008)
Source: Author’s calculations based on China Statistical Yearbook, 1988, 1995, 2009.
As a result of FDI, China’s foreign trade is often described as dual regimes. The
ordinary trade regime, which is characterized by Chinese-owned firms, purchases
intermediate inputs from domestic suppliers and exports labor-intensive goods such as
garments and shoes. On the other hand, the processing trade regime, which is
characterized by foreign-invested firms, purchases intermediate inputs from overseas
and exports capital-intensive or technology-intensive goods such as machinery and
electronics. In this paper, we utilize this unique dual regimes feature of Chinese foreign
trade to test our hypotheses regarding trade and FDI.
0
10
20
30
40
50
60
70
81 82 83 84 85 86 87 88 89 90 91 92 93 94 95 96 97 98 99 00 01 02 03 04 05 06 07 08
321
3. Related Literature and Hypotheses
The Heckscher–Ohlin model of international trade probably provides the most
direct link between trade openness and the demand for skilled labor. Although the
theoretical and empirical drawbacks of the model are widely acknowledged at this time,
this model has dominated the thinking about the distributional effects of globalization
for a long time. (Goldberg and Pavcnik, 2007). The Heckscher–Ohlin model predicts
that countries that are relatively rich in unskilled labor will specialize in the production
of goods that are unskilled-labor intensive, leading to increased demand for unskilled
labor.
The Stolper–Samuelson theorem, a companion theorem of Heckscher–Ohlin model,
deals with distributional effects by linking changes in product prices to changes in
factor returns. An increase in the price of unskilled-labor-intensive products that is
induced by trade liberalization should increase the return to unskilled labor, the factor
that is most intensively used in the production of these products. In contrast, the
expected decrease in the price of skilled-labor-intensive imported products should lead
to a decline in wages for skilled labor. Based on the Stolper–Samuelson theorem, one
would expect trade liberalization in developing countries to favor unskilled workers.
There has been abundant evidence in developing countries that contradicts the
theorized Stolper–Samuelson effects. Empirical studies on developing countries such as
Argentina, Brazil, Mexico, Chile, Colombia and India have consistently found
increasing inequality for those countries with greater exposure to globalization.
The Heckscher–Ohlin model mainly deals with industry-level variables. At the firm
level, it is possible that in developing countries, exporters are less skill-intensive than
non-exporters to fully exploit their comparative advantage. However, this is not always
true in a theoretical sense. As Bernard and Jensen (1997) point out, large variation in
factor intensity exists among firms even within narrowly defined industries. Bernard et
al. (2007) study the firm dynamics within comparative advantage industries and
comparative disadvantage industries under trade liberalization. They find that the
improvements in aggregate productivity following trade liberalization can even reverse
the real-wage losses of scarce factors.
322
In fact, recent literature on heterogeneous firms in international trade (e.g., Melitz,
2003) can be extended to link exporter status with higher skill share because exporters
need to overcome the fixed costs of accessing international markets. Theoretical and
empirical studies at the firm level have always found that exporting firms are larger, use
more advanced technologies, employ more skilled workers, pay higher wages, and
appear to be more productive than firms that do not export. In fact, exporters are more
skill-intensive is considered one of the most robust findings in Tybout’s (2003) survey
article. Recent work on innovation and exports provides theoretical guidance to
understand this issue. For example, in Yeaple’s (2005) model, firms endogenously
choose technology and workers’ skill. In equilibrium, exporters choose higher skilled
workers than do non-exporters. Costantini and Melitz (2007) construct a theoretical
model in which decisions regarding export market participation and innovation are
modeled jointly. In their theory, innovation by exporters generates extra demand for
skilled labor. In an empirical study, Bustos (2005) finds that exporters in Argentina use
more skilled labor than non-exporters.
In another strand of literature, Feenstra and Hanson (1996, 1997, 1999) propose a
theory of trade in intermediate goods and outsourcing. In their model, the final good is
assembled from a continuum of intermediate inputs indexed by 0,1 , which
includes all activities from design and production to final delivery to the consumer.
Inputs vary in terms of the relative amounts of skilled and unskilled labor used in
production. These activities are listed based on skilled/unskilled ratios in increasing
order. For example, the least skill-intensive activity is assembly, and the most skill-
intensive activity is R&D. Feenstra and Hanson show that the south will produce the
range of goods ),0[ *z and that the north will produce ]1,( *z . When capital flows from
the north to the south, the equilibrium value of *z increases. As a result, outsourcing
increases the demand for skilled labor in both the north and the south.
To understand the Feenstra-Hanson effects, let us consider the “value chain” of a
multinational firm from the Unites States, which includes all of the activities involved in
the production of a good, from R&D to assembly to marketing and after-sales service.
In Figure 4, we arrange these activities in increasing order based on the ratio of skilled
to unskilled labor used in each activity. In this example, assembly uses the least amount
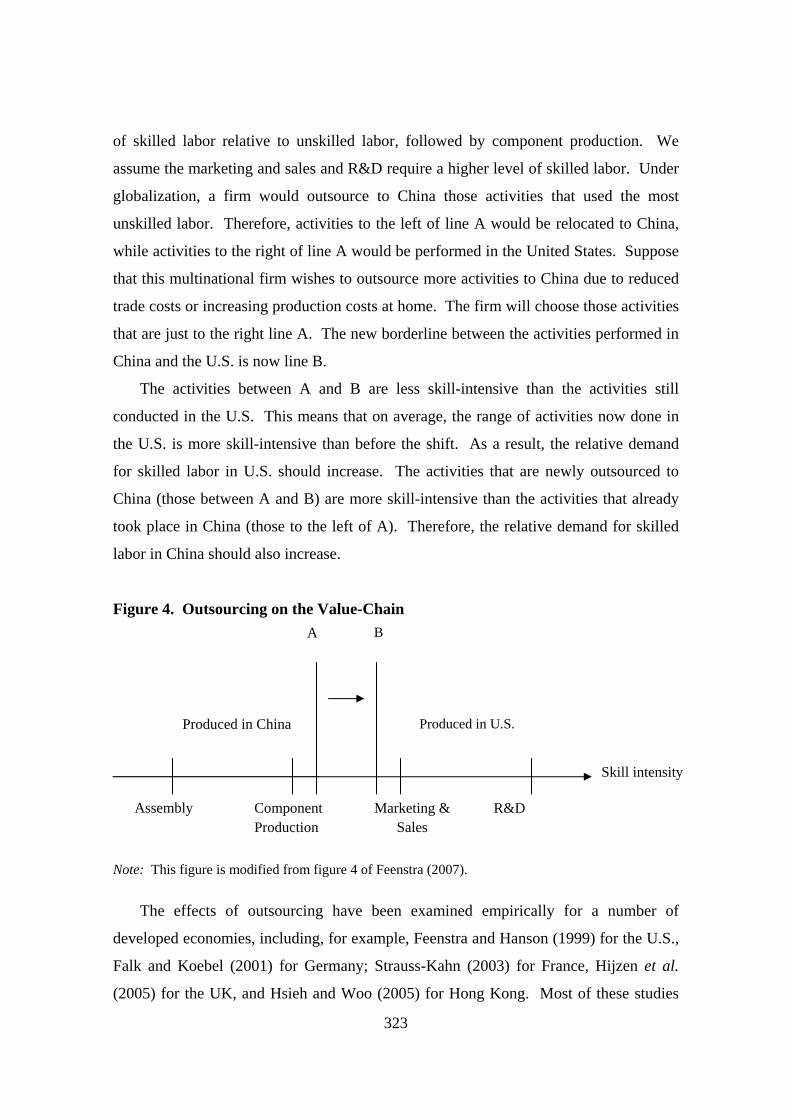
323
of skilled labor relative to unskilled labor, followed by component production. We
assume the marketing and sales and R&D require a higher level of skilled labor. Under
globalization, a firm would outsource to China those activities that used the most
unskilled labor. Therefore, activities to the left of line A would be relocated to China,
while activities to the right of line A would be performed in the United States. Suppose
that this multinational firm wishes to outsource more activities to China due to reduced
trade costs or increasing production costs at home. The firm will choose those activities
that are just to the right line A. The new borderline between the activities performed in
China and the U.S. is now line B.
The activities between A and B are less skill-intensive than the activities still
conducted in the U.S. This means that on average, the range of activities now done in
the U.S. is more skill-intensive than before the shift. As a result, the relative demand
for skilled labor in U.S. should increase. The activities that are newly outsourced to
China (those between A and B) are more skill-intensive than the activities that already
took place in China (those to the left of A). Therefore, the relative demand for skilled
labor in China should also increase.
Figure 4. Outsourcing on the Value-Chain
Note: This figure is modified from figure 4 of Feenstra (2007).
The effects of outsourcing have been examined empirically for a number of
developed economies, including, for example, Feenstra and Hanson (1999) for the U.S.,
Falk and Koebel (2001) for Germany; Strauss-Kahn (2003) for France, Hijzen et al.
(2005) for the UK, and Hsieh and Woo (2005) for Hong Kong. Most of these studies
Produced in China Produced in U.S.
A B
Assembly Component Production
Marketing & Sales
R&D
Skill intensity
324
find that outsourcing is an important source of increasing demand for skilled labor in
developed countries.
There have been very few similar studies of developing countries. Feenstra and
Hanson (1997) test their theory using Mexican data. They linked the increase in relative
wages for skilled labor to the FDI inflow in Mexico and find that FDI can explain a
large portion of the increase in the skilled labor share in total wages. Much of the FDI
was the results of outsourcing by U.S. multinationals. To the best of our knowledge,
there has been virtually no empirical work on the relationship between globalization and
firm skill structure in China.
It is worth mentioning that in the literature, in addition to the Feenstra-Hanson
theory, there are other theories of the relation between trade and skill structure. These
studies include “defensive innovations” (Wood, 1995), product life cycle (Zhu, 2005),
and quality upgrades to products for export (Verhoogen, 2008).
In this paper, we take advantage of the dual regime of Chinese exports to
empirically test these major theories in international trade. The ordinary trade exports
produced by Chinese firms are directly related to the Heckscher–Ohlin model, while
processing trade exports produced by foreign-invested firms will allow us to test the
Feenstra-Hanson theory.
4. Data and Empirical Strategy
4.1. The Data
The main dataset used in this study is the 2004 Economic Census Database. China
conducted its first economic census in 2004; it covers the universe of Chinese industrial
firms and service firms in that year. Our firm-level dataset includes all manufacturing
industries. In the data, firms report detailed information including firm IDs, ownership,
output, value added, exports, four-digit industry codes, six-digit geographic codes,
employment, and capital stock. After deleting those observations with missing
variables, we have a total sample of about 1.18 million manufacturing firms.
325
Most important for this study are the variables related to human capital: the number
of employees by education level. Unfortunately, the database does not provide a wage
information breakdown by education level. Because of this data limitation, we can only
study skill structure based on employment share, not based on wage share. In the data,
we have two measures of skilled labor: (1) senior high school and above, which
accounts for about 39 percent of total manufacturing employment; and (2) college and
above, with about 9 percent of total employment.
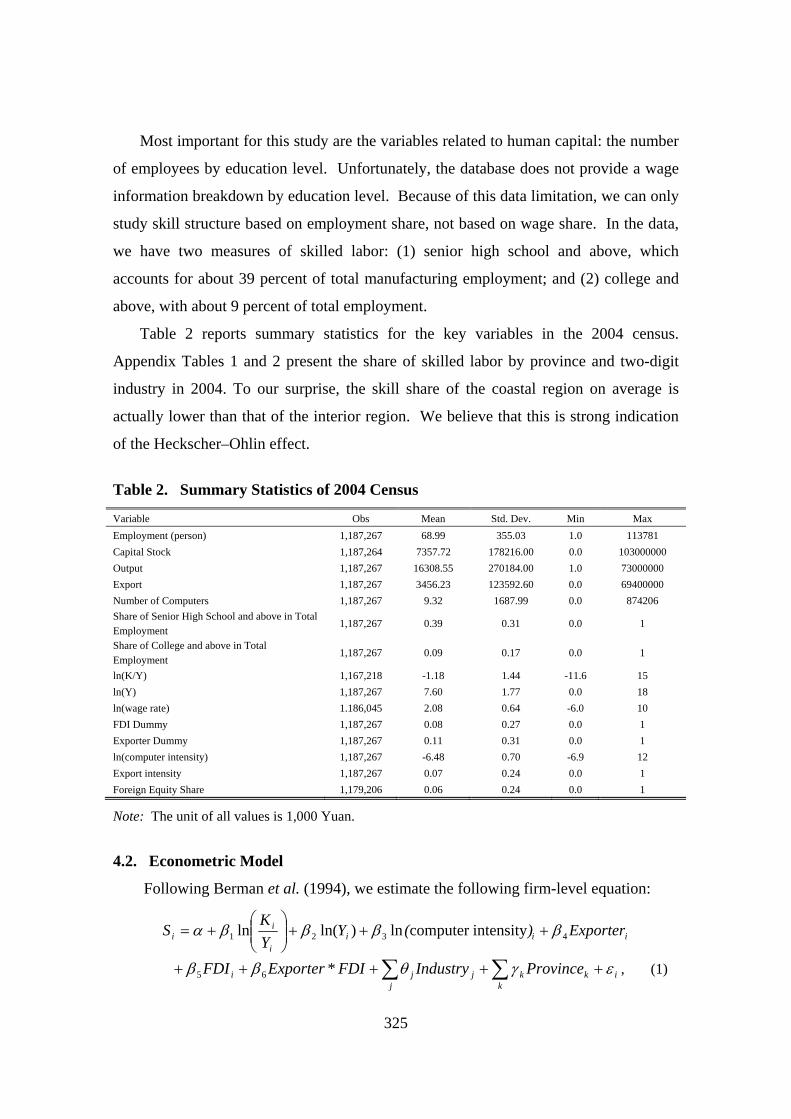
Table 2 reports summary statistics for the key variables in the 2004 census.
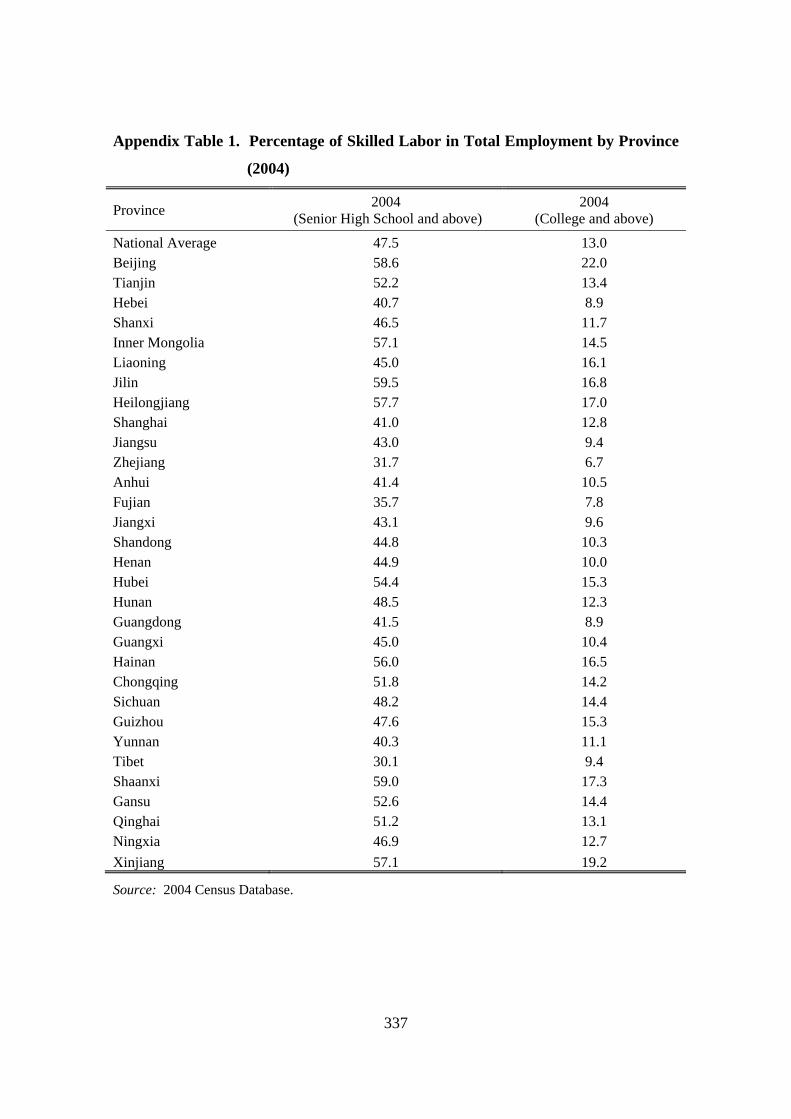
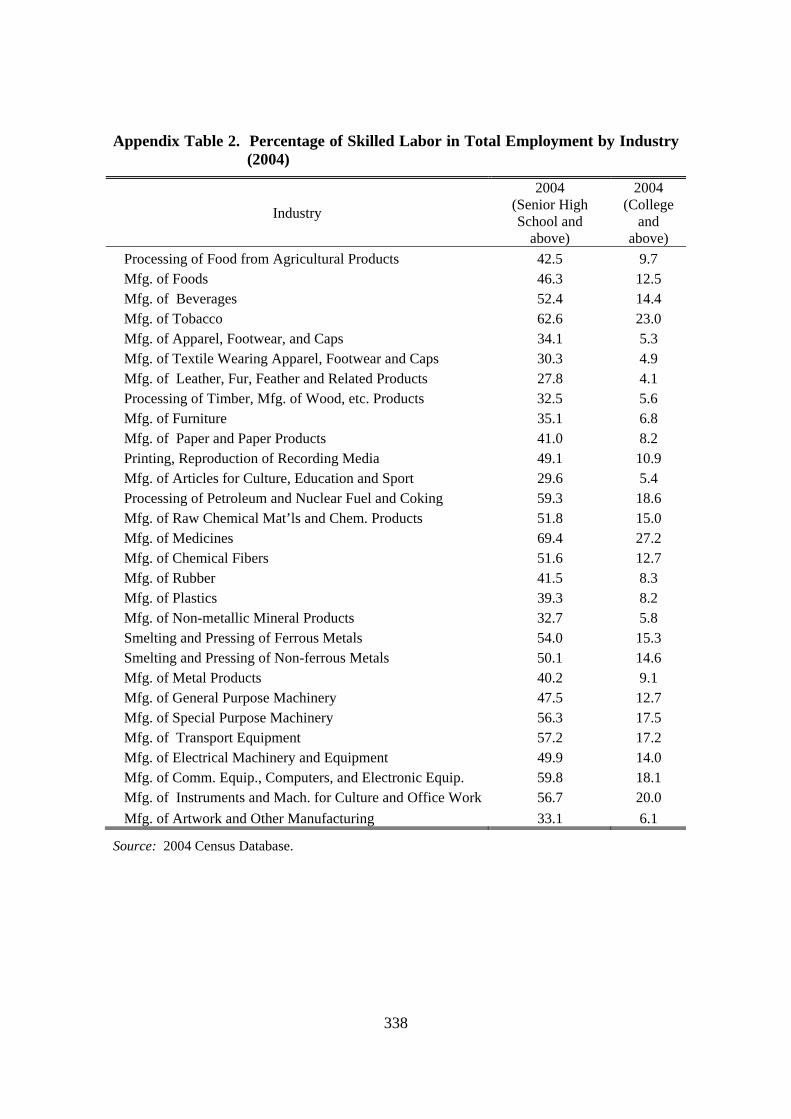
Appendix Tables 1 and 2 present the share of skilled labor by province and two-digit
industry in 2004. To our surprise, the skill share of the coastal region on average is
actually lower than that of the interior region. We believe that this is strong indication
of the Heckscher–Ohlin effect.
Table 2. Summary Statistics of 2004 Census
Variable Obs Mean Std. Dev. Min Max
Employment (person) 1,187,267 68.99 355.03 1.0 113781
Capital Stock 1,187,264 7357.72 178216.00 0.0 103000000
Output 1,187,267 16308.55 270184.00 1.0 73000000
Export 1,187,267 3456.23 123592.60 0.0 69400000
Number of Computers 1,187,267 9.32 1687.99 0.0 874206
Share of Senior High School and above in Total Employment
1,187,267 0.39 0.31 0.0 1
Share of College and above in Total Employment
1,187,267 0.09 0.17 0.0 1
ln(K/Y) 1,167,218 -1.18 1.44 -11.6 15
ln(Y) 1,187,267 7.60 1.77 0.0 18
ln(wage rate) 1.186,045 2.08 0.64 -6.0 10
FDI Dummy 1,187,267 0.08 0.27 0.0 1
Exporter Dummy 1,187,267 0.11 0.31 0.0 1
ln(computer intensity) 1,187,267 -6.48 0.70 -6.9 12
Export intensity 1,187,267 0.07 0.24 0.0 1
Foreign Equity Share 1,179,206 0.06 0.24 0.0 1
Note: The unit of all values is 1,000 Yuan.
4.2. Econometric Model
Following Berman et al. (1994), we estimate the following firm-level equation:
iiii
ii Exporter)(Y
Y
KS 4321 intensitycomputer ln)ln(ln
ik
kkj
jji ProvinceIndustryFDIExporterFDI *65 , (1)
326
where
iS : the share of skilled labor in total employment for firm i.
i
i
Y
Kln : the logarithm of capital intensity, which captures the capital-skill
complementarity.
)ln( iY : the logarithm of output, included to control for scale effects.
FDI: a dummy for foreign-invested firms.
ln(computer intensity): defined as
001.0
computers ofnumber ln
iY. We
include computer intensity as a proxy for firm technology.
FDIExporter* : an interaction term for the FDI dummy and exporter
dummy.
jIndustry : a full set of three-digit industry dummies.
kProvince : a full set of provincial dummies.
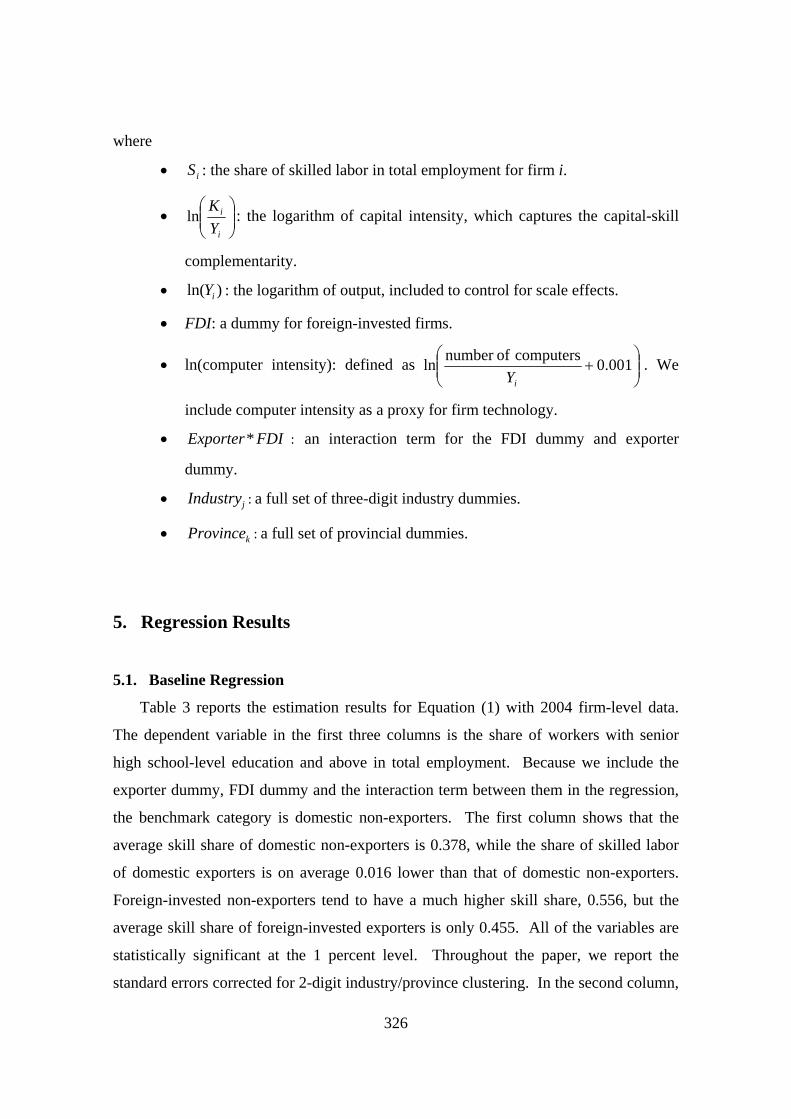
5. Regression Results
5.1. Baseline Regression
Table 3 reports the estimation results for Equation (1) with 2004 firm-level data.
The dependent variable in the first three columns is the share of workers with senior
high school-level education and above in total employment. Because we include the
exporter dummy, FDI dummy and the interaction term between them in the regression,
the benchmark category is domestic non-exporters. The first column shows that the
average skill share of domestic non-exporters is 0.378, while the share of skilled labor
of domestic exporters is on average 0.016 lower than that of domestic non-exporters.
Foreign-invested non-exporters tend to have a much higher skill share, 0.556, but the
average skill share of foreign-invested exporters is only 0.455. All of the variables are
statistically significant at the 1 percent level. Throughout the paper, we report the
standard errors corrected for 2-digit industry/province clustering. In the second column,
327
we add the capital intensity (ln(K/Y)), scale effect (lnY) and technology proxy
(ln(computer intensity)). Compared with that in the first column, the coefficient of the
FDI dummy in the second column is decreased by nearly half. To the extent that the
capital and technology introduced by FDI are skill-biased, including these controls in
the regression may underestimate the effect of FDI. The regression results indicate that
capital intensity, the scale factor and computer intensity are all associated with a higher
skill share. Given that both trade and FDI vary enormously across industries and
regions, we include in column 3 a full set of industry and provincial dummies. Now the
R-squared increases substantially from that of the second column, but the estimates are
similar.
Table 3. Skill Share Regression (Baseline)
Dependent Variable: Share of Senior High School and above
Dependent Variable: Share of College and above
1 2 3 4 5 6
Exporter Dummy -0.016** -0.059*** -0.013*** 0.001 -0.023*** -0.002** (0.007) (0.001) (0.003) (0.003) (0.003) (0.001)
FDI Dummy 0.178*** 0.091*** 0.097*** 0.125*** 0.074*** 0.073*** (0.008) (0.002) (0.005) (0.006) (0.005) (0.004)
Exporter*FDI -0.101*** -0.063*** -0.079*** -0.086*** -0.064*** -0.065*** (0.009) (0.002) (0.006) (0.001) (0.005) (0.004)
ln(K/Y) 0.011*** 0.007*** 0.0013* -0.001* (0.001) (0.001) (0.001) (0.001)
lnY 0.029*** 0.023*** 0.015*** 0.012*** (0.001) (0.001) (0.001) (0.000)
ln(Computer Intensity) 0.118*** 0.086*** 0.081*** 0.062*** (0.004) (0.002) (0.003) (0.002)
Constant 0.378*** 0.946*** 0.797*** 0.082*** 0.497*** 0.445*** (0.007) (0.024) (0.019) (0.003) (0.021) (0.019)
Industry Dummies No No Yes No No Yes Provincial Dummies No No Yes No No Yes
No. of observations 1187267 1187267 1167218 1187267 1187267 1167218 R-squared 0.0124 0.0812 0.1792 0.0205 0.1229 0.2320
Notes: The benchmark category is domestic non-exporters. Numbers in parentheses are standard errors corrected for 2-digit industry/province clustering. *, **, and *** represent statistical significance at the 10 percent, 5 percent, and 1 percent levels, respectively.
In the last three columns, we use college education rather than senior high school-
level education as a measure of skilled labor. The estimated coefficients of the exporter
dummy, the FDI dummy and the interaction term are generally lower than in the first
three columns. For example, the estimate of the FDI dummy decreases from 0.101 in
328
column 3 to 0.076 in column 6. This is expected because the overall share of workers
with college-level education is much smaller than the share of workers with senior high
school-level education.
Our estimates are not only statistically significant but also quantitatively significant.
For example, a one-standard-deviation increases in the FDI dummy increases college
skill share by 0.31×0.076 = 2.4%.
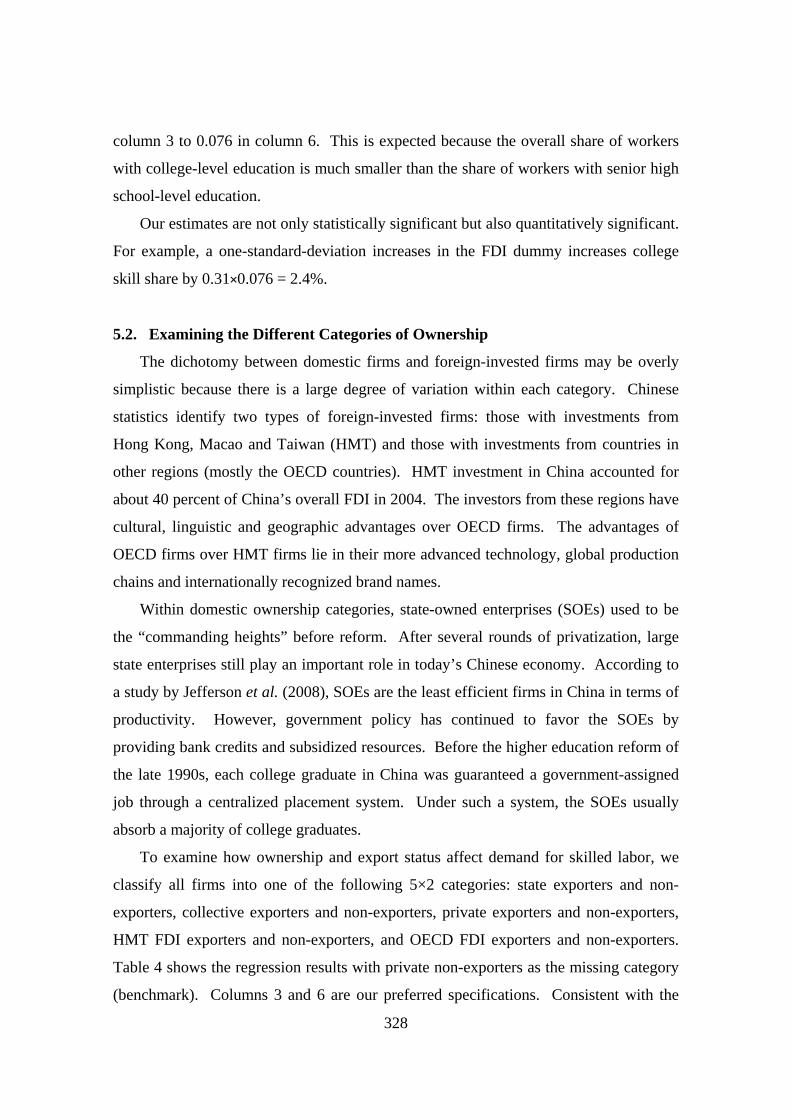
5.2. Examining the Different Categories of Ownership
The dichotomy between domestic firms and foreign-invested firms may be overly
simplistic because there is a large degree of variation within each category. Chinese
statistics identify two types of foreign-invested firms: those with investments from
Hong Kong, Macao and Taiwan (HMT) and those with investments from countries in
other regions (mostly the OECD countries). HMT investment in China accounted for
about 40 percent of China’s overall FDI in 2004. The investors from these regions have
cultural, linguistic and geographic advantages over OECD firms. The advantages of
OECD firms over HMT firms lie in their more advanced technology, global production
chains and internationally recognized brand names.
Within domestic ownership categories, state-owned enterprises (SOEs) used to be
the “commanding heights” before reform. After several rounds of privatization, large
state enterprises still play an important role in today’s Chinese economy. According to
a study by Jefferson et al. (2008), SOEs are the least efficient firms in China in terms of
productivity. However, government policy has continued to favor the SOEs by
providing bank credits and subsidized resources. Before the higher education reform of
the late 1990s, each college graduate in China was guaranteed a government-assigned
job through a centralized placement system. Under such a system, the SOEs usually
absorb a majority of college graduates.
To examine how ownership and export status affect demand for skilled labor, we
classify all firms into one of the following 5×2 categories: state exporters and non-
exporters, collective exporters and non-exporters, private exporters and non-exporters,
HMT FDI exporters and non-exporters, and OECD FDI exporters and non-exporters.
Table 4 shows the regression results with private non-exporters as the missing category
(benchmark). Columns 3 and 6 are our preferred specifications. Consistent with the
329
baseline regression results, for every ownership category, exporters have a lower skill
share than non-exporters. For both exporters and non-exporters, OECD-invested firms
appear to have the highest skill share, followed by SOEs, HMT invested firms, and
finally, collective and private firms.
Table 4. Skill Share Regression (Ownership)
Dependent Variable: Share of Senior High School and above
Dependent Variable: Share of College and above
1 2 3 4 5 6
HMT FDI Exporter 0.042*** -0.039*** -0.012 0.022*** -0.024*** -0.005
(0.012) (0.010) (0.009) (0.006) (0.006) (0.005)
HMT FDI Non-Exporter 0.166*** 0.092*** 0.095*** 0.098*** 0.056*** 0.056***
(0.009) (0.008) (0.006) (0.006) (0.005) (0.004)
OECD FDI Exporter 0.134*** 0.058*** 0.070*** 0.083*** 0.042*** 0.041***
(0.012) (0.010) (0.008) (0.006) (0.006) (0.005)
OECD FDI Non-Exporter FDI 0.241*** 0.160*** 0.142*** 0.177*** 0.129*** 0.111***
(0.009) (0.007) (0.006) (0.008) (0.006) (0.005)
State-Owned Exporter 0.135*** 0.067*** 0.061*** 0.074*** 0.041*** 0.032***
(0.009) (0.007) (0.004) (0.005) (0.004) (0.002)
State-Owned Non-Exporter 0.189*** 0.145*** 0.098*** 0.102*** 0.077*** 0.051***
(0.006) (0.004) (0.003) (0.003) (0.002) (0.002)
Collective-Owned Exporter -0.020*** -0.056*** -0.028*** -0.011*** -0.031*** -0.017***
(0.007) (0.006) (0.005) (0.003) (0.003) (0.003)
Collective-Owned Non-Exporter 0.028*** 0.028*** 0.010*** 0.006*** 0.008*** -0.006***
(0.005) (0.004) (0.003) (0.002) (0.002) (0.001)
Private Exporter -0.023*** -0.052*** -0.006** -0.001 -0.018*** 0.002
(0.007) (0.006) (0.003) (0.003) (0.003) (0.001)
ln(K/Y) 0.006*** 0.004*** -0.001 -0.002***
(0.001) (0.001) (0.001) (0.001)
lnY 0.021*** 0.018*** 0.010*** 0.010***
(0.001) (0.001) (0.000) (0.000)
ln(Computer Intensity) 0.111*** 0.081*** 0.076*** 0.064***
(0.004) (0.002) (0.003) (0.002)
Constant 0.357*** 0.928*** 0.782*** 0.070*** 0.487*** 0.438***
(0.007) (0.022) (0.020) (0.003) (0.021) (0.019)
Industry Dummies No No Yes No No Yes
Provincial Dummies No No Yes No No Yes
No. of observations 1187267 1187267 1167218 1187267 1187267 1167218
R-squared 0.0452 0.0998 0.1877 0.0559 0.1437 0.2177
Notes: The benchmark category is private non-exporters. Numbers in parentheses are standard errors corrected for 2-digit industry/province clustering. *, **, and *** represent statistical significance at the 10 percent, 5 percent, and 1 percent levels, respectively.
330
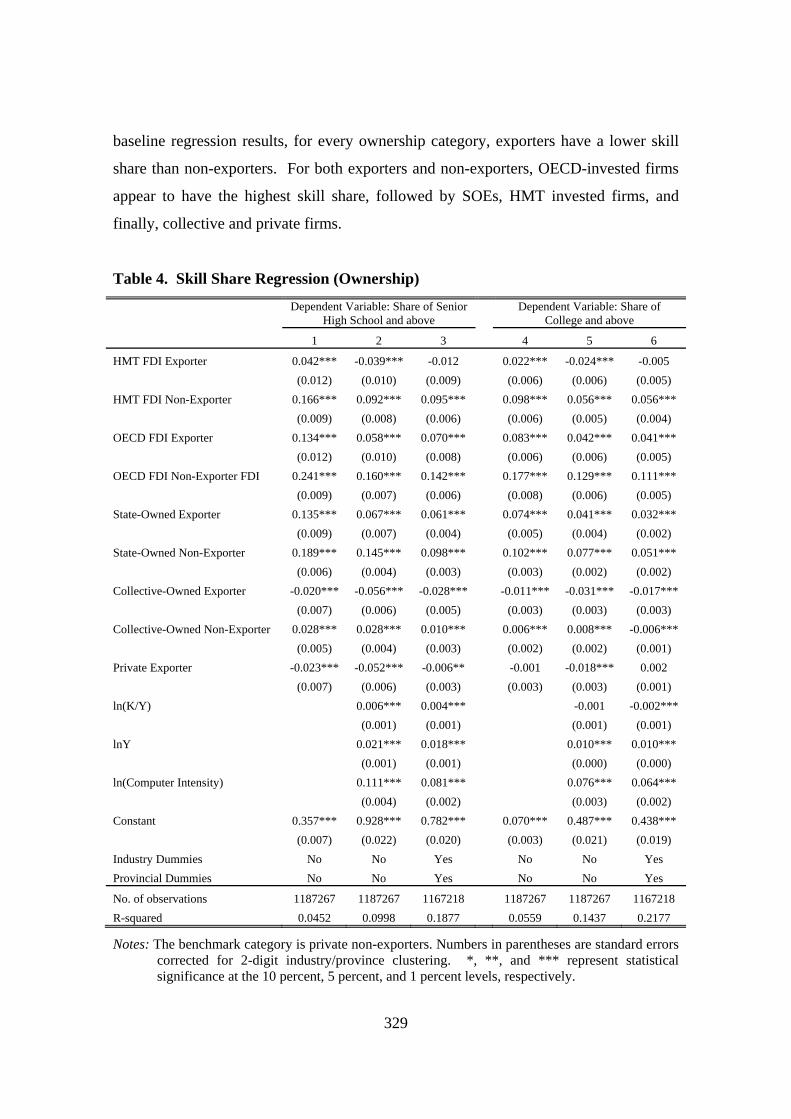
5.3. Using Alternative Definitions of Export and FDI Variable
In this subsection, to conduct a robustness check, we use alternative definitions of
export and FDI variables. Rather than using an exporter dummy variable, we create an
export intensity variable defined as the export to sales ratio. As a continuous variable,
export intensity allows us to exploit richer information on the export orientation of firms.
Similarly, we create a new variable of foreign equity share to replace the FDI dummy.
Wholly foreign-owned firms may have stronger incentives to bring the latest technology
to China than will joint ventures. Foreign equity share can be a better measure of
foreign presence than the FDI dummy.
Table 5 reports the regression results with alternative definitions of export and FDI
variables. The results are qualitatively the same. Compared with the baseline results in
Table 3, the negative effects of the export variable are stronger for both measures of
skilled labor in Table 5.
Table 5. Skill Share Regression (Export Intensity and Foreign Equity Share)
Dependent Variable: Share of Senior High School and above
Dependent Variable: Share of College and above
1 2 3 4 5 6
Export Intensity -
0.057*** -
0.097*** -
0.029*** -
0.019*** -
0.044*** -
0.010*** (0.009) (0.007) (0.005) (0.004) (0.003) (0.002)
Foreign Equity Share 0.203*** 0.101*** 0.109*** 0.139*** 0.076*** 0.080*** (0.012) (0.009) (0.005) (0.009) (0.005) (0.006)
Export Intensity*Foreign Equity Share
-0.135***
-0.091***
-0.130***
-0.116***
-0.079***
-0.099***
(0.011) (0.009) (0.006) (0.008) (0.005) (0.006) ln(K/Y) 0.010*** 0.008*** 0.0013* -0.001
(0.001) (0.001) (0.001) (0.001) lnY 0.028*** 0.023*** 0.015*** 0.013***
(0.001) (0.001) (0.001) (0.000) ln(Computer Intensity) 0.119*** 0.086*** 0.081*** 0.063***
(0.004) (0.002) (0.003) (0.002) Constant 0.380*** 0.953*** 0.798*** 0.084*** 0.502*** 0.447***
(0.003) (0.024) (0.018) (0.003) (0.022) (0.019) Industry Dummies No No Yes No No Yes Provincial Dummies No No Yes No No Yes No. of observations 1179206 1160713 1160713 1179206 1160713 1160713 R-squared 0.0131 0.0838 0.1811 0.0201 0.1257 0.2334
Notes: Export intensity is defined as ratio of export to sales. Foreign equity share is defined as the share of total equity held by foreign firms or foreign investors. Numbers in parentheses are standard errors corrected for 2-digit industry/province clustering. *, **, and *** represent statistical significance at the 10 percent, 5 percent, and 1 percent levels, respectively.
331
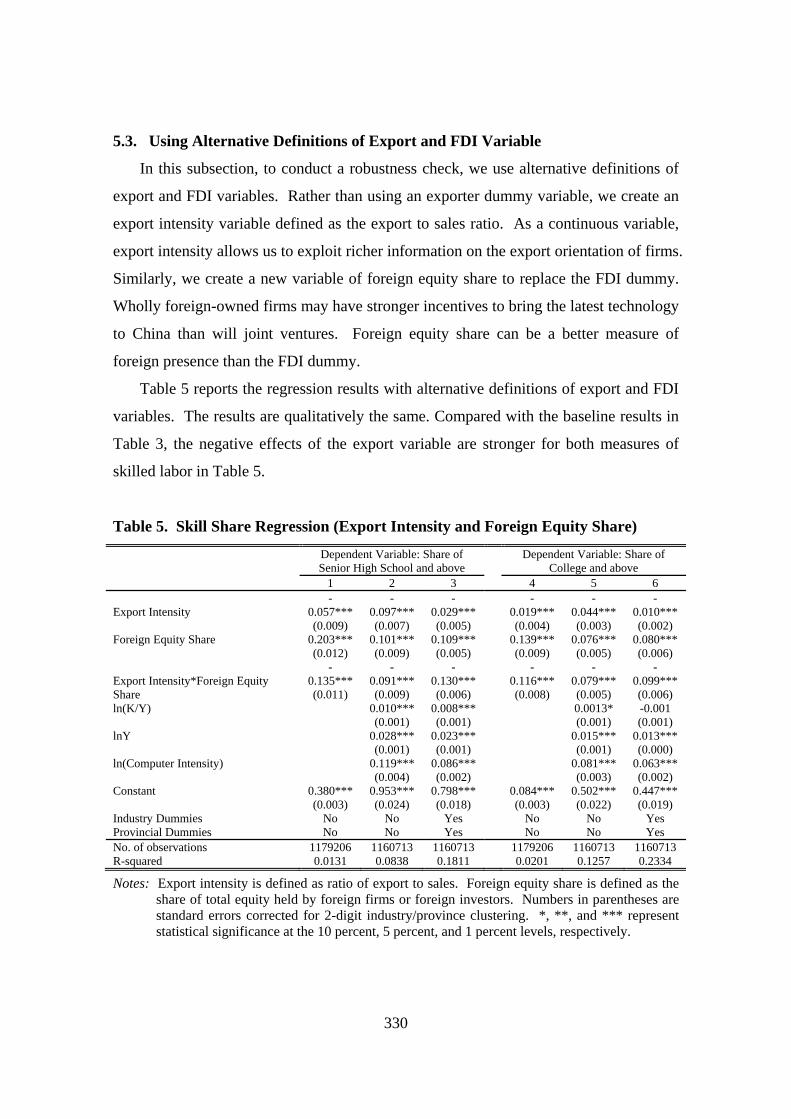
5.4. Examining the Coastal Region and the Interior Region
The geographic distribution of trade and FDI in China has been highly uneven. Due
to their convenient location, better infrastructure and superior business environment, the
coastal regions have been the main source of exports and main recipients of FDI. In
2004, our sample year, the coastal provinces accounted for 89 percent of total exports
and received 88 percent of the total FDI in China. Because both trade and FDI are
highly concentrated in the coastal region, it will be useful to examine if our earlier
results hold for the interior region.
To compare the interior region with the coastal region, we split the sample and run
the same regression separately for interior firms only and coastal firms only.6 We report
the estimation results in Table 6. The firms in coastal and interior regions show a
similar pattern. The only exception is Column 4, where the negative coefficient of the
exporter dummy is no longer statistically significant.
Table 6. Skill Share Regression (Coastal vs. Interior Region)
Dependent Variable:
Share of Senior High School and above
Dependent Variable:
Share of College and above
Coastal Region Only Interior Region Only Coastal Region Only
Interior Region
Only
Exporter Dummy -0.011*** -0.016*** -0.002 -0.001
(0.003) (0.006) (0.001) (0.003)
FDI Dummy 0.101*** 0.979*** 0.074*** 0.082***
(0.006) (0.005) (0.004) (0.004)
Exporter*FDI -0.079*** -0.043*** -0.064*** -0.046***
(0.005) (0.008) (0.004) (0.006)
ln(K/Y) 0.003** 0.016*** -0.002*** 0.002***
(0.001) (0.001) (0.001) (0.001)
lnY 0.021*** 0.025*** 0.012*** 0.011***
(0.001) (0.001) (0.000) (0.000)
ln(Computer Intensity) 0.082*** 0.094*** 0.058*** 0.076***
(0.002) (0.002) (0.002) (0.002)
Constant 0.801*** 0.777*** 0.434*** 0.474***
(0.022) (0.020) (0.022) (0.016)
Industry Dummies Yes0.2260 Yes Yes Yes
Provincial Dummies Yes Yes Yes Yes
No. of observations 816826 350392 816826 350392
R-squared 0.1589 0.2339 0.2012 0.2659
Notes: We run the regression with two subsamples: coastal region and interior region. The benchmark category is domestic non-exporters. Numbers in parentheses are standard errors
6 The coastal region includes Beijing, Fujian, Guangdong, Hainan, Hebei, Jiangsu, Liaoning, Shandong, Shanghai, Tianjin and Zhejiang; the interior region includes all other provinces.
332
corrected for 2-digit industry/province clustering. *, **, and *** represent statistical significance at the 10 percent, 5 percent, and 1 percent levels, respectively.
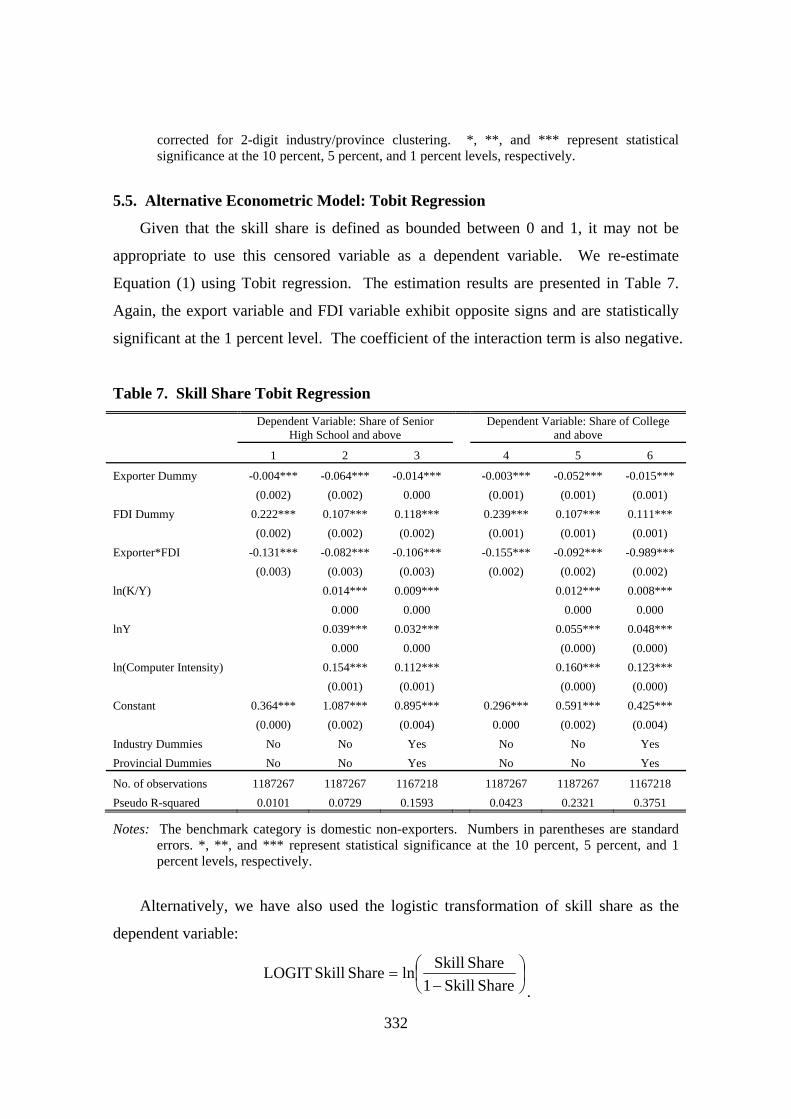
5.5. Alternative Econometric Model: Tobit Regression
Given that the skill share is defined as bounded between 0 and 1, it may not be
appropriate to use this censored variable as a dependent variable. We re-estimate
Equation (1) using Tobit regression. The estimation results are presented in Table 7.
Again, the export variable and FDI variable exhibit opposite signs and are statistically
significant at the 1 percent level. The coefficient of the interaction term is also negative.
Table 7. Skill Share Tobit Regression
Dependent Variable: Share of Senior High School and above
Dependent Variable: Share of College and above
1 2 3 4 5 6
Exporter Dummy -0.004*** -0.064*** -0.014*** -0.003*** -0.052*** -0.015***
(0.002) (0.002) 0.000 (0.001) (0.001) (0.001)
FDI Dummy 0.222*** 0.107*** 0.118*** 0.239*** 0.107*** 0.111***
(0.002) (0.002) (0.002) (0.001) (0.001) (0.001)
Exporter*FDI -0.131*** -0.082*** -0.106*** -0.155*** -0.092*** -0.989***
(0.003) (0.003) (0.003) (0.002) (0.002) (0.002)
ln(K/Y) 0.014*** 0.009*** 0.012*** 0.008***
0.000 0.000 0.000 0.000
lnY 0.039*** 0.032*** 0.055*** 0.048***
0.000 0.000 (0.000) (0.000)
ln(Computer Intensity) 0.154*** 0.112*** 0.160*** 0.123***
(0.001) (0.001) (0.000) (0.000)
Constant 0.364*** 1.087*** 0.895*** 0.296*** 0.591*** 0.425***
(0.000) (0.002) (0.004) 0.000 (0.002) (0.004)
Industry Dummies No No Yes No No Yes
Provincial Dummies No No Yes No No Yes
No. of observations 1187267 1187267 1167218 1187267 1187267 1167218
Pseudo R-squared 0.0101 0.0729 0.1593 0.0423 0.2321 0.3751
Notes: The benchmark category is domestic non-exporters. Numbers in parentheses are standard errors. *, **, and *** represent statistical significance at the 10 percent, 5 percent, and 1 percent levels, respectively.
Alternatively, we have also used the logistic transformation of skill share as the
dependent variable:
Share Skill1
Share SkilllnShare Skill LOGIT
.
333
The results are similar and are available upon request. Our baseline regression
results are quite robust to the use of these alternative econometric methods.
6. Conclusions and Policy Implications
This study uses large-scale firm-level census data to examine how trade and FDI
affect the demand for skilled labor in China’s manufacturing firms. We use two
measures of skilled labor: senior high school-level education and college-level
education. For both measures, we find that exporters tend to employ more unskilled
workers than do non-exporters. The results hold for both Chinese exporters in the
ordinary trade regime and foreign-invested exporting firms in the processing trade
regime. Although these findings are consistent with the Heckscher–Ohlin model, they
are somewhat surprising given the predictions of a large body of literature on trade and
heterogeneous firms. We also find that FDI is associated with a higher share of skilled
labor in total employment. We interpret this finding as evidence in support of Feenstra
and Hanson’s outsourcing theory. Our results are qualitatively the same for several
robustness checks.
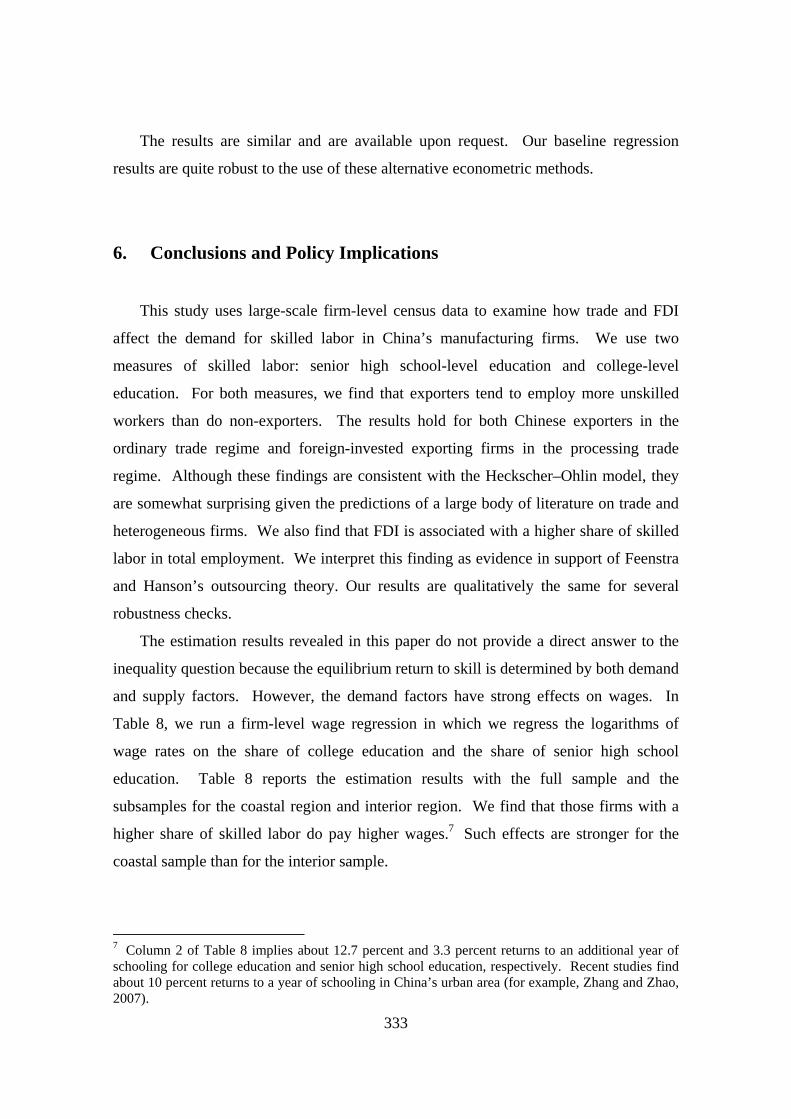
The estimation results revealed in this paper do not provide a direct answer to the
inequality question because the equilibrium return to skill is determined by both demand
and supply factors. However, the demand factors have strong effects on wages. In
Table 8, we run a firm-level wage regression in which we regress the logarithms of
wage rates on the share of college education and the share of senior high school
education. Table 8 reports the estimation results with the full sample and the
subsamples for the coastal region and interior region. We find that those firms with a
higher share of skilled labor do pay higher wages.7 Such effects are stronger for the
coastal sample than for the interior sample.
7 Column 2 of Table 8 implies about 12.7 percent and 3.3 percent returns to an additional year of schooling for college education and senior high school education, respectively. Recent studies find about 10 percent returns to a year of schooling in China’s urban area (for example, Zhang and Zhao, 2007).
334
Table 8. Wage Regression
Dependent Variable: In(wage rate)
Full Sample Coastal Region Only Interior Region Only
1 2 3 4 5 6
Share of College Education
0.650*** 0.506*** 0.665*** 0.523*** 0.648*** 0.458***
(0.003) (0.018) (0.004) (0.025) (0.006) (0.015)
Share of Senior High School
0.109*** 0.097*** 0.104*** 0.091*** 0.179*** 0.100***
(0.002) (0.007) (0.003) (0.007) (0.004) (0.013)
Constant
2.008*** 2.363*** 2.087*** 2.255*** 1.802*** 2.074***
(0.001) (0.003) (0.004) (0.055) (0.002) (0.031)
Industry Dummies No Yes No Yes No Yes
Provincial Dummies No Yes No Yes No Yes
No. of observations 1187267 1187267 1187267 1187267 1187267 1187267
R-squared 0.0336 0.1572 0.0361 0.1406 0.0388 0.1008
Notes: Numbers in parentheses are standard errors corrected for 2-digit industry/province clustering. *, **, and *** represent statistical significance at the 10 percent, 5 percent, and 1 percent levels, respectively.
Our empirical results should be very useful for policy-makers. If a more equal
distribution of income between skilled labor and unskilled labor is desired, then
according to our findings, government policies that promote exports (and particularly
ordinary trade exports) can be strongly justified. Policy-makers should also be aware of
the opposite effects of foreign direct investment.
335
References
Berman, Eli, Bound, John, and Zvi Griliches (1994) “Changes in the Demand for Skilled Labor within U.S. Manufacturing: Evidence from the Annual Survey of Manufacturing.” Quarterly Journal of Economics 109: 367-397.
Bernard, Andrew, and Bradford Jensen (1997) “Exporters, Skill Upgrading, and the Wage Gap.” Journal of International Economics 42: 3-31,
Bernard, Andrew, Jensen, Bradford, Redding, Stephen, and Peter Schott (2007) “Firms in International Trade.” Journal of Economic Perspective 3: 105-130.
Bustos, Paula (2005) “The Impact of Trade on Technology and Skill Upgrading Evidence from Argentina.” working paper, CREI and Universitat Pompeu Fabra.
Clarke, Donald, Murrell, Peter, and Susan Whiting (2008) “The Role of Law in China’s Economic Development.” In China’s Great Economic Transformation, ed. Brandt, Loren and Thomas G. Rawski. Cambridge University Press, 375-428.
Costantini, James, and Marc Melitz (2007) “The Dynamics of Firm-Level Adjustment to Trade Liberalization.” working paper, Princeton University.
Falk, Martin, and Bertrand Koebel (2001) “A Dynamic Heterogenous Labour Demand Model for German Manufacturing.” Applied Economics 33: 339-348.
Feenstra, Robert C. (2007) “Globalization and Its Impact on Labor.” Global Economy Lecture, Vienna Institute for International Economic Studies.
Feenstra, Robert C., and Gordon H. Hanson (1997) “Foreign Direct Investment and Relative Wages: Evidence from Mexico’s Maquiladoras.” Journal of International Economics, no.42: 371-393.
Feenstra, Robert C., and Gordon H. Hanson (1999) “The Impact of Outsourcing and High-Technology Capital on Wages: Estimates for the United States, 1979-1990.” Quarterly Journal of Economics, no.114: 907-940.
Feenstra, Robert C., and Gordon H. Hanson. (1996) “Foreign Investment, Outsourcing, and Relative Wages.” In The Political Economy of Trade Policy:Papers in Honor of Jagdish Bhagwati, ed. Robert C. Feenstra, Gene M. Grossman, and Douglas A. Irwin. Cambridge and London: MIT Press, 89–127.
Goldberg, Pinelopi Koujianou, and Nina Pavcnik (2007) “Distributional Effects of Globalization in Developing Countries.” Journal of Economics Literature, no.45: 39-82.
Hijzen, Alexander, Görg, Holger, and Robert Hine (2005) “International Outsourcing and the Skill Structure of Labour Demand in the United Kingdom.” Economic Journal 115: 860-878.
Hsieh, Chang-Tai, and Keong T. Woo (2005) “The Impact of Outsourcing to China on Hong Kong's Labor Market.” American Economic Review 95: 1673-1687.
Jefferson, Gary, Rawski, Thomas, and Yifan Zhang (2008) “Productivity Growth and Convergence across China's Industrial Economy.” Journal of Chinese Economic and Business Studies 6: 121-140
336
Lardy, Nicholas (2001) Integrating China into the Global Economy, Washington: Brookings Institution Press.
Long, Guoqiang (2005) “China’s Policies on FDI: Review and Evaluation.” in Does Foreign Direct Investment Promote Development? ed. Theodore. H. Moran, Edward M. Graham, and Magnus Blomstrom, Institute for International Economics, Washington D.C.: 315-336.
Ma, Yue, and Yifan Zhang (2008) “What's Different about New Exporters? Evidence from Chinese Manufacturing Firms.” Working paper, Lingnan University.
Melitz, Marc (2003) “The Impact of Trade on Intra-Industry Reallocations and Aggregate Industry Productivity.” Econometrica 71: 1695-1725.
Strauss-Kahn, Vanessa (2003) “The Role of Globalization in the Within-Industry Shift Away from Unskilled Workers in France.” NBER Working Paper 9716.
Tybout, James (2003) “Plant and Firm-Level Evidence on ‘new’ Trade Theories.” In Handbook of International Trade. ed. E.K. Choi and James Harrigan. Blackwell, Oxford.
Verhoogen, Eric A. (2008) “Trade, Quality Upgrading and Wage Inequality in the Mexican Manufacturing Sector.” Quarterly Journal of Economics 123: 489-530.
Wood, Adrian (1995) “How Trade Hurt Unskilled Workers.” Journal of Economic Perspectives 9: 57-80.
Yeaple, Stephen (2005) “A Simple Model of Firm Heterogeneity, International Trade, and Wages.” Journal of International Economics 65: 1-20.
Zhang, Junsen, and Yaohui Zhao (2007) “Rising Returns to Schooling in Urban China.” In Education and Reform in China. ed. Emily Hannum and Albert Park. London: Routledge.
Zhu, Susan Chun (2005) “Can Product Cycles Explain Skill Upgrading?” Journal of International Economics 66: 131–155.
337
Appendix Table 1. Percentage of Skilled Labor in Total Employment by Province
(2004)
Province 2004
(Senior High School and above) 2004
(College and above)
National Average 47.5 13.0 Beijing 58.6 22.0 Tianjin 52.2 13.4 Hebei 40.7 8.9 Shanxi 46.5 11.7 Inner Mongolia 57.1 14.5 Liaoning 45.0 16.1 Jilin 59.5 16.8 Heilongjiang 57.7 17.0 Shanghai 41.0 12.8 Jiangsu 43.0 9.4 Zhejiang 31.7 6.7 Anhui 41.4 10.5 Fujian 35.7 7.8 Jiangxi 43.1 9.6 Shandong 44.8 10.3 Henan 44.9 10.0 Hubei 54.4 15.3 Hunan 48.5 12.3 Guangdong 41.5 8.9 Guangxi 45.0 10.4 Hainan 56.0 16.5 Chongqing 51.8 14.2 Sichuan 48.2 14.4 Guizhou 47.6 15.3 Yunnan 40.3 11.1 Tibet 30.1 9.4 Shaanxi 59.0 17.3 Gansu 52.6 14.4 Qinghai 51.2 13.1 Ningxia 46.9 12.7
Xinjiang 57.1 19.2
Source: 2004 Census Database.
338
Appendix Table 2. Percentage of Skilled Labor in Total Employment by Industry (2004)
Industry
2004 (Senior High School and
above)
2004 (College
and above)
Processing of Food from Agricultural Products 42.5 9.7 Mfg. of Foods 46.3 12.5 Mfg. of Beverages 52.4 14.4 Mfg. of Tobacco 62.6 23.0 Mfg. of Apparel, Footwear, and Caps 34.1 5.3 Mfg. of Textile Wearing Apparel, Footwear and Caps 30.3 4.9 Mfg. of Leather, Fur, Feather and Related Products 27.8 4.1 Processing of Timber, Mfg. of Wood, etc. Products 32.5 5.6 Mfg. of Furniture 35.1 6.8 Mfg. of Paper and Paper Products 41.0 8.2 Printing, Reproduction of Recording Media 49.1 10.9 Mfg. of Articles for Culture, Education and Sport 29.6 5.4 Processing of Petroleum and Nuclear Fuel and Coking 59.3 18.6 Mfg. of Raw Chemical Mat’ls and Chem. Products 51.8 15.0 Mfg. of Medicines 69.4 27.2 Mfg. of Chemical Fibers 51.6 12.7 Mfg. of Rubber 41.5 8.3 Mfg. of Plastics 39.3 8.2 Mfg. of Non-metallic Mineral Products 32.7 5.8 Smelting and Pressing of Ferrous Metals 54.0 15.3 Smelting and Pressing of Non-ferrous Metals 50.1 14.6 Mfg. of Metal Products 40.2 9.1 Mfg. of General Purpose Machinery 47.5 12.7 Mfg. of Special Purpose Machinery 56.3 17.5 Mfg. of Transport Equipment 57.2 17.2 Mfg. of Electrical Machinery and Equipment 49.9 14.0 Mfg. of Comm. Equip., Computers, and Electronic Equip. 59.8 18.1 Mfg. of Instruments and Mach. for Culture and Office Work 56.7 20.0
Mfg. of Artwork and Other Manufacturing 33.1 6.1
Source: 2004 Census Database.