Geomorphology of the Grand Staircase Region of … of the Grand Staircase Region ... Hotel lodging...
42
2016 Rocky Mountain Friends of the Pleistocene Field Trip Geomorphology of the Grand Staircase Region of the Colorado Plateau October 14-16, 2016 Leaders: Tammy Rittenour, Utah State University Kerry Riley, Utah State University Co-leaders: Dave Wilkins, Boise State University Rick Ford, Weber State University Michelle Nelson, Utah State University Joel Pederson, Utah State University Jonathan Harvey, Fort Lewis University
Transcript of Geomorphology of the Grand Staircase Region of … of the Grand Staircase Region ... Hotel lodging...

2016 Rocky Mountain Friends of the Pleistocene Field Trip
Geomorphology
of the Grand Staircase Region
of the Colorado Plateau
October 14-16, 2016
Leaders:
Tammy Rittenour, Utah State University
Kerry Riley, Utah State University
Co-leaders:
Dave Wilkins, Boise State University
Rick Ford, Weber State University
Michelle Nelson, Utah State University
Joel Pederson, Utah State University
Jonathan Harvey, Fort Lewis University

General Itinerary:
2 | P a g e
Logistics
Following FOP tradition, we will keep up-front costs low by leaving participants responsible for transportation, food, campground fees, and printing of a personal hard copy of the guidebook. Each day you will need a water bottle, good hiking shoes, and your lunch.
Directions:
The trip will begin at Ponderosa Grove campground located ~7 miles southwest on Hancock Road from its junction with Highway 89 (see map 1 below). If you are camping at Coral Pink Sand Dunes State park, we will meet you at the first stop.
NOTE: if you are arriving in the area around dusk or after dark PLEASE be cautious about
deer crossing the roads on the drive down (it’s rut and hunting season so the deer are more
active). Also, note that there are black cattle at large on the final 10-20 miles of roads
heading into Coral Pink Dune / Ponderosa Grove campgrounds.
Contact Information of Leaders:
Tammy Rittenour Phone: 435-213-5756 Email: [email protected]
Kerry Riley Phone: 303-921-8241 Email: [email protected]
Camping and Lodging (see map 1)
Primitive Camping - There are many primitive campsites along Hancock Road. Look for pull-outs along the north and south side of Hancock Rd. Please be aware that some pullouts have deeper sands and 4WD may be required.
Ponderosa Grove Campground – Very nice, but does not have water.
Coral Pink Sand Dunes State Park Campground
Hotel lodging can be found in Kanab, Utah
Those arriving on Thursday can gather Ponderosa Grove Campground. This is where the FOP headquarters will be located and where Kerry Riley and Tammy Rittenour will be staying.

General Itinerary:
3 | P a g e
Figure 1 - Camping at and near Coral Pink Sand Dunes State Park and Ponderosa Grove Campground

General Itinerary:
4 | P a g e
Friday, 10/14 (see map 2): Total distance for the day = 40 miles round-trip Morning: Discuss history and constraints of the Coral Pink dune field 7:45 - 8 am: The trip will begin either by meeting at the FOP group headquarters at group
site #2 at the Ponderosa Grove BLM campground (7:45 am) or at the Star Dune overlook parking lot at Coral Pink Sand Dunes State Park (8:00 am) near the campground (see map 1).
Stop 1.1: Star Dune overlook (close to the campground) - Provides a great overview of
the active portion of the dune field. Discuss modern development of the star dunes as well as the ages and implications of the stands of ponderosa to the south. Walk to the top of the Star Dune for an easy and quick hike that will give more perspective of dune-field-organization.
Stop 1.2: The cattle guard pullout (about 3/4-mile north of the main park entrance). This
stop gives easy access to an overlook from one of the limbs of some parabolic dunes that are on the western edge of the dunefield. Discuss radargrams collected from this portion of the dunefield that indicate the western edge is underlain by a series of down to the SE normal faults that were mapped by our graduate student, Janna Rozar. View the boundary of the Sevier Normal
Fault and the dunes climbing up the fault scarp towards the NE. Stop 1.3: Lunch at Ponderosa Grove Campground. This site provides access to the
marginal dunes and an overlook of the upper dune-field, its organization, and the trees that exist up there.
Afternoon: Introduce arroyos, OSL dating, and discuss history of arroyo cut-fill
dynamics in Kanab Creek
Stop 1.4: Owl’s Eyes (latitude 37.065687, longitude -112.537198) is located ~1.4 miles on right, if headed south on HWY 89 after passing the weigh station. Go over cattle grate and park on dirt lot. View Holocene alluvial stratigraphy exposed in a 40m cut-bank along Kanab Creek.
In July of 1883, Utah’s Deseret News reported on the “The Great Washout”. Masses of earth as large as common houses floated down the stream with willows still standing. Extensive damage to crops, and all farming land in the canyon was destroyed. Some cattle killed. Canyon near old city dam was cut 50 feet down and 88 yards wide.

General Itinerary:
5 | P a g e
Stop 1.5: Best Friends Stratigraphic Section (latitude 37.113860, longitude -112.548073) is located ~0.5 miles down Angel Canyon Rd from junction with HWY 89. We will park in the RV parking area at the visitor’s center and walk to the arroyo wall exposure. We will discuss the terraces and alluvial stratigraphy at this site from the overlook, then walk down to look at the alluvial sediments up close.
Saturday, 10/15 (see map 3): Total distance for the day = 85 miles round-trip
Morning: Explore upper Kanab Creek at knickpoint, discuss Grand Staircase geology, and spatial and temporal distribution of erosion rates
8:00 am: Meet at the Ponderosa Grove Campground FOP group headquarters. Stop 2.1: Upper Kanab Falls (latitude 37.291173°, longitude -112.492507°) is a 30-mile
drive from Ponderosa Grove Campground. This is the location of a small knick-point outcropping in the upper basin-fill alluvium. Holocene alluvium is preserved and exposed in arroyo walls. Background information on the geology of the Grand Staircase will be introduced. Discuss spatial and temporal variability in catchment-average erosion rates. Walk to one stratigraphic section that has been dated and described (OSL and 14C, see Townsend 2015) and sampled for Beryllium-10.
Afternoon: Explore the adjacent watershed, Johnson Wash, discuss regional fire reconstruction, hydro-climate reconstructions, and compare arroyo chronologies throughout region.
Stop 2.2: Basalt Junction (latitude 37.231783°, longitude -112.364927°) is a 16-mile drive from Stop 2.1. We will have lunch here and discuss regional climate and fire reconstructions. After lunch we will enter Johnson Wash arroyo and walk ~1-mile downstream to a series of dated stratigraphic sections where we will discuss regional arroyo chronologies and potential drivers of arroyo cut-fill dynamics.
Evening celebration and planning for next FOP at Ponderosa Grove Campground.

General Itinerary:
6 | P a g e
Sunday, 10/16 (see map 4): Total distance for the day = 70 miles one-way Morning: Discuss aggradation versus paleo-flood deposits in Buckskin Wash. 8:00 am: Meet at the Ponderosa Grove Campground FOP group headquarters. OR if
staying in Kanab we will collect you as we drive through on our way to Buckskin Wash/Wire pass.
Stop 3.1: Wire Pass Trailhead is located on House Rock Valley Road (latitude
37.019224°, longitude -112.024835°). We will walk down to the confluence of Kitchen Corral Wash and Coyote Wash and up Buckskin Wash to backwater deposits. We will shoot to get back to the vehicles at 1 or 2 pm. On a pre-trip scouting mission, Joel made the following observations at Buckskin Wash:
“Buckskin was flashing with about 4 feet deep of flowing chocolate and
standing waves. Very cool. I camped there and smelled flowing mud all
night. By morning it was down to a gentle thin stream and I crossed
without much problem.”
The trip will end around 1:00 to 2:00 pm.

General Itinerary:
7 | P a g e
Figure 2 - Day 1 (Friday Oct 14) map route and location of stops.

General Itinerary:
8 | P a g e
Figure 3 - Day 2 (Saturday Oct 15) map route and location of stops.

General Itinerary:
Figure 4 - Day 3 (Sunday Oct 16) map route and location of last stop.

Day 1 - Friday Morning: Discuss history and constraints of the Coral Pink dune field
10 | P a g e
Figure 5 - Processed and interpreted GPR data for Line 305 (top) and Line 200 (bottom). Top: A S-N transect that reaches from the south flank of First Dune to the base of the star dune; (A) Migrated data; (B) Migrated data with AGC applied; (C) Interpretation for Line 305 shows that First Dune is a topographic feature comprised primarily of bedrock with sand cover that is less than 5 meters thick. Bottom: A) Migrated data; (B) Migrated data with AGC applied; (C) Interpretation for Line 200 shows a series of antithetic faults that have an apparent dip of approximately 39° to the east. Bedrock outcrops in the far west part of the transect and shows the contact between the upper “white” sandstone and middle “brown” sandstone of the Navajo Formation. Fault interpretations are based on offset in the bedrock and lack of bedrock reflectors between obvious bedrock reflectors. The bedrock drops off dramatically at 900 meters; this represents the western edge of the proposed paleo-channel. The sediments filling the paleo-channel onlap the bedrock, at this point. Caption modified from Rozar, 2015.

Day 1 - Friday Morning: Discuss history and constraints of the Coral Pink dune field
11 | P a g e
Figure 6 - Terrestrial Laser Scanning derived 3D visualization of the dune surface, the detrended underlying surface, and potential fault zones. (A) The current dune surface, based on the 5-m DEM, with 3 x vertical exaggeration. (B) The 5-m detrended surface, with 3 x vertical exaggeration, shows that the dunes are housed in a valley with a steep western side. Several scarp-like features are present, and are denoted with dotted black lines. (C) The location of scarp-like features on a Google Earth imagery show that the marginal parabolic dunes may rest on series of scarps. There is also scarp-like feature just east of the star dune and First Dune. (D) Potential fault zones were identified based on the presence of scarp-like features. GPR surveys were focused in these areas. (Rozar, 2015)

Day 1 - Friday Morning: Discuss history and constraints of the Coral Pink dune field
12 | P a g e
Figure 7 - Dune climbing the Sevier Normal Fault Escarpment.
Figure 8 - Radar image (100 mhz) of the dune climbing over the Sevier Normal Fault. The escarpment contact is clearly visible, and can be used to trace bedrock at depth. (Ford et al., 2010).

Day 1 - Friday Morning: Discuss history and constraints of the Coral Pink dune field
13 | P a g e
Figure 9 - Location of sampled ponderosa pine and their innermost ring dates. The star dune can be seen in the top middle of the image. The date classification range use Natural Breaks method. FYOG = First year of growth.

Day 1 - Friday Afternoon: Introduce arroyos and discuss history of arroyo cut-fill dynamics in Kanab
14 | P a g e
Figure 10 - Digital elevation model of the three watersheds we will visit during the field-trip. This does not include the sand dunes stops, which are in the Virgin River, the adjacent watershed to the west.

Day 1 - Friday Afternoon: Introduce arroyos and discuss history of arroyo cut-fill dynamics in Kanab
15 | P a g e
Figure 11 - Longitudinal profile of Kanab Creek with the underling geology annotated. In the upper right corner are two violin plots illustrating how area and elevation are related. Cliffs represent a larger range in elevation and less total catchment area, while benches compose greater areas with lower relief.

Day 1 - Friday Afternoon: Introduce arroyos and discuss history of arroyo cut-fill dynamics in Kanab
16 | P a g e
Figure 12 - Climate and hydrologic data near Kanab, UT. (a) Mean, maximum, and minimum daily discharge statistics, AD 1979-2014 for USGS Kanab Creek gage 9403600 (USGS, 2015). cms= cubic meters per second. (b) 30-year mean daily precipitation summary, AD 1981-2010 for Kanab station 424508 and Bryce Canyon National Park station 421008 (WRCC, 2015). (c) Peak annual streamflow 1959-2014, colors of bars relate to month of flood event. Inset histogram displays frequency of peak floods per month cluster/season.

Day 1 - Friday Afternoon: Introduce arroyos and discuss history of arroyo cut-fill dynamics in Kanab
17 | P a g e
Figure 13 - Alluvial chronostratigraphy of arroyo wall exposure across arroyo channel from stop 1-4. Age control from single-grain OSL and 14C of charcoal. From Townsend (2015)

Day 1 - Friday Afternoon: Introduce arroyos and discuss history of arroyo cut-fill dynamics in Kanab
18 | P a g e
Figure 14 - Kanab Creek 1934 and 2005 near stop 1-4. Viewed southwest down Kanab Creek about 150 yards below the dam north of the townsite .Woody riparian vegetation has increased dramatically. Cottonwoods and willows are common, as are tamarisk and Russian olive. The stream channel has narrowed and is more stable today than it was in the past. Pinyon and juniper have increased in the distance. U.S. Forest Service photograph (293830) taken by Reed W. Bailey in 1934; retake by Charles E. Kay on June 17, 2005. See Webb et al. (1991) for 1985 retake. Photos from http://extension.usu.edu/rra/.

Day 1 - Friday Afternoon: Introduce arroyos and discuss history of arroyo cut-fill dynamics in Kanab
19 | P a g e
Figure 15 - Surficial geologic map of Kanab and White Tower quadrangles 1:12000 (Summa, 2009).

Day 1 - Friday Afternoon: Introduce arroyos and discuss history of arroyo cut-fill dynamics in Kanab
20 | P a g e
Figure 16 - Generalized terrace and fill stratigraphy for the type locality within the middle reach of the study area. Five fill packages are present and four were dated
through OSL and radiocarbon dating. In this reach Qat4 is 40 meters above the modern channel, and is underlain by Qf1. Qat2 is ~20 m above the modern channel,
and is a compound cut-fill and fill-cut (alluvial strath) terrace underlain by Qf2, Qf3, Qf4. Where unconformities are observable Qat2 is a fill-cut terrace formed by
arroyo down-cutting from the top of Qat4 halfway into Qf1 alluvium, and it is composed of Qf1 overlain by a thin veneer of Qf2. Inset into Qf1 and Qf2 under the Qat2
terrace are two cut-fill units: Qf3 and Qf4 that are of similar thickness and represent two periods of fluvial aggradation separated by incision. It is hypothesized here
that the upstream veneer of Qf2 is correlative with similar-ages alluvium dated by Smith (1990) in the basin-fill reach. Note grey beds in photographs are prominent
stratigraphic markers and are fine-grained silty clay facies (Fsm/Fsmv). Qat1 is the lowest terrace at 3 to 5 m above the modern channel and underlain, at least in part,
by the older historical fill Qah1.
Day 1 - Friday Afternoon: Introduce arroyos and discuss history of arroyo cut-fill dynamics in Kanab
Page 21
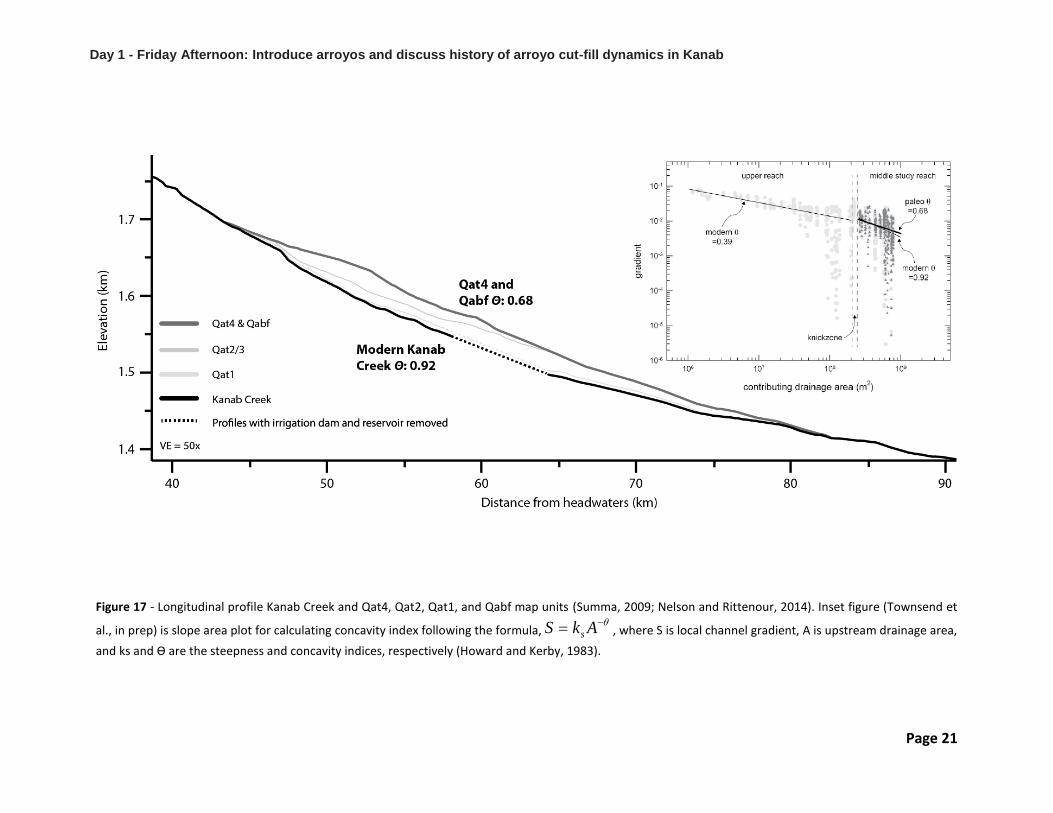
Figure 17 - Longitudinal profile Kanab Creek and Qat4, Qat2, Qat1, and Qabf map units (Summa, 2009; Nelson and Rittenour, 2014). Inset figure (Townsend et
al., in prep) is slope area plot for calculating concavity index following the formula, , where S is local channel gradient, A is upstream drainage area,
and ks and Ө are the steepness and concavity indices, respectively (Howard and Kerby, 1983).
AkS s

Day 2 - Saturday Morning: Explore upper Kanab Creek at knickpoint, discuss Grand Staircase geology, and temporal and spatial distribution of erosion rates.
Figure 18 - Spatial distribution of erosion rates. Black dots are locations where only modern sediment was sampled. White dots are locations where modern and paleo samples were collected. Yellow stars are the locations of field-trip stops.

Day 2 - Saturday Morning: Explore upper Kanab Creek at knickpoint, discuss Grand Staircase geology, and temporal and spatial distribution of erosion rates.
Page 23
Figure 19 - A) Boxplot comparing catchment-average erosion rates for different lithologic groups. Abbreviations for rock types are identified beside the longitudinal profile in the upper right corner of the figure. Scatter plot illustrates

Day 2 - Saturday Morning: Explore upper Kanab Creek at knickpoint, discuss Grand Staircase geology, and temporal and spatial distribution of erosion rates.
Page 24
relation between median elevation and catchment-average erosion rate and relation between median slope and catchment-average erosion rate.
Figure 20 - Comparison of Pleistocene, Holocene, and modern catchment average erosion rates estimated using in-situ 10Be. Paleo-rates have been corrected for bust burial Beryllium production.
Figure 21 – Comparison of three samples collected from the same location. The two paleo samples were collected form UKNB-3.

Day 2 - Saturday Morning: Explore upper Kanab Creek at knickpoint, discuss Grand Staircase geology, and temporal and spatial distribution of erosion rates.
Page 25
Figure 22 - Chronostratigraphy of arroyo-cut-fill exposure near site 2-1. Age control from single-grain OSL and 14C. From Townsend (2015).

Day 2 - Saturday Afternoon: Explore the adjacent watershed, Johnson Wash, compare arroyo chronologies throughout region, and discuss drivers of arroyo cut-fill chronologies.
Page 26
Figure 23 - Curves represent the summed probability distributions smoothed using a 20-year moving average for Escalante River (orange), Paria River (green), Johnson Wash (blue), and Kanab Creek (red). The inverted histogram below each curve is the sample count creating the above distribution.

Day 2 - Saturday Afternoon: Explore the adjacent watershed, Johnson Wash, compare arroyo chronologies throughout region, and discuss drivers of arroyo cut-fill chronologies.
Page 27
Figure 24 – Black curve represents the summed probability distributions smoothed using a 20-year moving average for all regional samples in the Grand Staircase. Red triangles identify multi-basin fires defined by statistically similar radiocarbon dated fires from two or more watersheds. The top three data sets are hyrdro-climate reconstructions derived from tree-rings.

Day 2 - Saturday Afternoon: Explore the adjacent watershed, Johnson Wash, compare arroyo chronologies throughout region, and discuss drivers of arroyo cut-fill chronologies.
Figure 25 - Map of stratigraphic sites in Johnson Wash used to make arroyo chronology.

Day 2 - Saturday Afternoon: Explore the adjacent watershed, Johnson Wash, compare arroyo chronologies throughout region, and discuss drivers of arroyo cut-fill chronologies.
Figure 26 - Stratigraphic section from Johnson Wash. Radiocarbon ages in blue text are age-over-estimates. OSL ages in yellow and green text are age reversals.

Day 2 - Saturday Afternoon: Explore the adjacent watershed, Johnson Wash, compare arroyo chronologies throughout region, and discuss drivers of arroyo cut-fill chronologies.
Figure 27 - Regional arroyo cut-fill chronology in comparison with regional hydroclimatic records. Note there appears to be a relationship between arroyo entrenchment and periods of drought followed by pluvial conditions (dry to wet). The two most extreme droughts in the last 1ka appear to correspond with the two most recent arroyo entrenchment events. Note that the drought/pluvial couplet ~400 yr ago did not cause arroyo entrenchment. Rittenour (2016).

Day 2 - Saturday Afternoon: Explore the adjacent watershed, Johnson Wash, compare arroyo chronologies throughout region, and discuss drivers of arroyo cut-fill chronologies.
Figure 28 - Conceptual diagram illustrating the idea that while floods are necessary to drive arroyo entrenchment, that geomorphic thresholds related to long profile slope (concavity) may be the ultimate driver of when streams entrench. Aggradation rates are linked to sediment supply and valley geometry.
- Timing of arroyo entrenchment may be controlled by geomorphic variables controlling grate of aggradation and when slope/concavity
thresholds are approached.
- After the system approaches a threshold slope, a sufficiently large discharge event can lead to arroyo entrenchment.
- Note that the system may not be sensitive to similar or even larger magnitude floods when not near a threshold.

Day 2 - Saturday Afternoon: Explore the adjacent watershed, Johnson Wash, compare arroyo chronologies throughout region, and discuss drivers of arroyo cut-fill chronologies.
Figure 29 - Examples of ubiquitous soils capped by more recent (post 200 yr) alluvium seen in the study
catchments. The exact age of these soils and overlying alluvium is not yet known, but results suggest
the overlying alluvium is < 200 yr old and may suggest that it could be associated with post-settlement
alluvium related to over grazing and forest clearing practices.

Day 3 - Sunday Morning: Discuss aggradation versus paleo-flood deposits in Buckskin Wash.
Figure 30 - Map of Buckskin Wash study area showing primary sites and geographic features. UT-Utah.

Day 3 - Sunday Morning: Discuss aggradation versus paleo-flood deposits in Buckskin Wash.
Figure 31 –Longitudinal profile of the greater Buckskin drainage. Profile constructed from field survey data (dark) and a 5-m DEM (light). Representative valley geometries are shown for Kitchen Corral Wash (a) and Buckskin Gulch (b). Bedrock representations are approximate and are based on Doelling and Davis (1989). Vertical Exaggeration = ~25x.

Day 3 - Sunday Morning: Discuss aggradation versus paleo-flood deposits in Buckskin Wash.
Page 35
Figure 32 – Chronostratigraphy (a) and facies associations (b) for study site BG-A. White circles and triangles are OSL and 14C samples, respectively. Facies associations: CB = channel-bottom, CM – channel-margin, VS = valley-surface.

Day 3 - Sunday Morning: Discuss aggradation versus paleo-flood deposits in Buckskin Wash.
Figure 33 – Chronostratigraphy for the study site BG-C. White triangles are 14C samples. Asterisk indicates that sample is from Ely (1992). All unites are interpreted as part of the CM (channel-margin) facies association.

Day 3 - Sunday Morning: Discuss aggradation versus paleo-flood deposits in Buckskin Wash.
Figure 34 – Temporal comparison of deposition at all six study sites. Black circles and triangles are OSL and radiocarbon ages from this study, respectively. Closed square represents a constrain from cultural material. White triangle represents over a dozen radiocarbon ages from Hereford (pers. Comm.).
Figure 35 – Results of 137Cs analysis. Units are shown in stratigraphic order and are labeled with package (Roman) and unit (Arabic) numbers, but this does not reflect actual landscape positions or depths. Corresponding 137Cs activities are shown in center, and clay content is shown in right column. A clear transition occurs at unit 6 in package III, after which point all units contain measurable amounts of the isotope.

Day 3 - Sunday Morning: Discuss aggradation versus paleo-flood deposits in Buckskin Wash.
Figure 36 – Contrasting reach geometries in the Buckskin Wash catchment. (A) Alluvial reach just downstream of the Vermillion Cliffs, and (B) constricted reach in the Navajo Sandstone slot canyon.

Day 3 - Sunday Morning: Discuss aggradation versus paleo-flood deposits in Buckskin Wash.
Figure 37 – Generalized chronostratigraphy of study site BG – B. Bottom panel is downstream extension of outcrop shown in top panel. Circles are optically stimulated luminescence ages, triangles are 14C ages (clack – from correlative unit away from main outcrop), and squares are 137Cs samples (open where absent; filled where detected). The entire site is interpreted as channel margin deposits.

Day 3 - Sunday Morning: Discuss aggradation versus paleo-flood deposits in Buckskin Wash.
Figure 38 – Relation between deposition and erosion in the alluvial and constricted reaches of Buckskin Wash over time.

Citations:
Clement, W. P., Wilkins, D. E., and Ford, R. L., 2006, Using Ground Penetrating Radar to Image Terrestrial Analogs of Martian Aeolian Deposition: The Coral Pink Sand Dunes, Kanab, Utah, EOS TRANS. AGU, 87 (52).
D’Arrigo, R.D., and Jacoby, G.C., 1991, A 1000-year record of winter precipitation from northwestern New Mexico, USA – A reconstruction from tree-rings and its relation to El Niño and the Southern Oscillation: The Holocene, v. 1, p. 95-101.
Doelling, H.H., 2008, Geologic map of the Kanab 30'x60' quadrangle, Kane and Washington Counties, Utah, and Coconino and Mohave Counties, Arizona: Utah Geological Survey MP-08-2DM, 1 sheet, scale 1:100,000.
Ford, R.L., Massoth, T.W., and Wilkins, D.E., 2012, Geologic road guides to Coral Pink Sand Dunes State Park and vicinity, Utah. In “Geologic Road, Trail, and Lake Guides to Utah’s Parks and Monuments,” P.B. Anderson and D.A. Sprinkel, eds. Utah Geological Association Publication 29 (third edition).
Ford, R.L., Gillman, S.L., Wilkins, D.E., Clement, W.P., and Nicoll, K. (2010). Geology and geomorphology of Coral Pink Sand Dunes State Park, Utah. In “Geology of Utah’s Parks and Monuments,” D.A. Sprinkel, T.C. Chidsey, Jr., and P.B. Anderson, eds. Utah Geological Association Publication 28 (third edition).
Hayden, J.M., 2011, Geologic map of the Kanab quadrangle, Kane County, Utah, and Mohave and Coconino Counties, Arizona: Utah Geological Survey Map 248DM, scale 1:24,000.
Howard, A.D., Kerby, G., 1983, Channel changes in badlands. Geological Society of America Bulletin. 94, 739-752.
Miall, A.D., 2000, Principles of sedimentary basin analysis: New York, Springer, 616 p.
Nelson, M.S., Rittenour, T.M., 2014, Middle to late Holocene chronostratigraphy of alluvial fill deposits along Kanab Creek in southern Utah. In: MacLean, J.S., Biek, R.F., Huntoon, J.E. (Eds.), Geology of Utah’s Far South. Utah Geological Association Publication, Utah, pp. 97–116.
Prothero, D.R., and Schwab, F., 2004, Sedimentary geology: An introduction to sedimentary rocks and stratigraphy, 2nd edition: New York, W.H. Freeman and Company, 557 p.
Reynolds, S.J., 1988, Geologic map of Arizona: Arizona Geological Survey, Map 26, scale 1:100,000.
Rozar, E.J.*, Bradford, J.H., Ford, R.L., and Wilkins, D.E., 2014, Using ground penetrating radar to image paleotopography and structural controls at Coral Pink Sand Dunes, Kane County, Utah, AbstractEP43B-3566 presented at 2014 Fall Meeting, AGU, San Francisco, Calif., 15-19 Dec.
Rozar, E.J., "Defining Antecedent Topography at Coral Pink Sand Dunes, Kane County, Utah: The Influence of Structural Controls on Dune-Field Boundary Conditions and Holocene Landscape Evolution" (2015). Boise State University Theses and Dissertations. Paper 987. http://scholarworks.boisestate.edu/td/987
Rozar, E.J.*, Wilkins, D.E., Glenn, Nancy F., and Spaete, L., 2014, Using ground-based terrestrial laser scanning to model antecedent topography: Coral Pink Sand Dunes, Kane County, Utah. Geological Society of America Abstracts with Programs. Vol. 46, No. 6, p.37.
Sable, E.G., and Hereford, R., 2004, Geologic Map of Kanab 30’ x 60’ quadrangle, Utah and Arizona: Utah Geological Survey, I-2655, scale 1:100,000.
Smith, S.S., 1990, Large floods and rapid entrenchment Kanab Creek, southern Utah: Tucson, University of Arizona, M.S. thesis, 82 p.
Summa, M.C., 2009, Geologic mapping, alluvial stratigraphy, and optically stimulated luminescence dating of the Kanab Creek area, southern Utah: Logan, Utah State University, M.S. thesis, 170 p.
Summa-Nelson, M.C., and Rittenour, T.M., 2012, Application of OSL dating to middle to late Holocene arroyo sediments in Kanab Creek, southern Utah, USA: Quaternary Geochronology, v. 10, p. 167-174.
Townsend, K., Nelson, M. S., Rittenour, T. M., Pederson, J., in prep, Fluvial architecture of episodic arroyo entrenchment and aggradation in Kanab Creek, southern Utah.

Page 42
U.S. Geological Survey, 2015, National Water Information System: Web Interface, USGS 09403600 Kanab Creek near Kanab, UT: Online, http://nwis.waterdata.usgs.gov/nwis/inventory/?site_no=09403600, accessed July 7, 2015.
Webb, R.H., Smith, S.S., and McCord, V.A., 1991, Historic channel change of Kanab Creek, Southern Utah and Northern Arizona: Grand Canyon Natural History Association Monograph, 91 p.
Western Regional Climate Center, 2015a, Kanab, UT Monthly Average of Average Daily Temperature (Degrees Fahrenheit) (424508): Online, http://www.wrcc.dri.edu/cgi-bin/cliMAIN.pl?ut4508, accessed July 7, 2015.
Western Regional Climate Center, 2015b, Kanab, UT Monthly Sum of Precipitation (Inches) (424508): Online, http://www.wrcc.dri.edu/cgi-bin/cliMAIN.pl?ut4508, accessed July 7, 2015.
Wilkins, D.E., 2005, Dendrochronology of dune activity in the Coral Pink Sand Dunes, Kane County, Utah. In “2005 Association of American Geographers Annual Meeting Abstracts with Programs.”
Wilkins, D.E. and Ford, R.L., 2003, GPR and GIS use in documenting a distinctive mode of star dune development. In “XVI INQUA Congress Program with Abstracts.”
Wilkins, D.E., and Ford, R.L., 2007, Measuring dune patterns using nearest-neighbor methods: the Coral Pink Sand Dunes, Kane County, Utah, USA. Geomorphology, 83, 48-57.
Wilkins, D.E., Ford, R.L., Clement, W.P., and Nicoll, K., 2005, Little Ice Age behavior of the Coral Pink Sand Dunes, Kane County, Utah. In “Geological Society of America 2005 Annual Meeting Abstracts with Program.”
Wilkins, D.E., Nicoll, K., and Ford, R.L., 2007, Multiproxy Evidence for Late Holocene Climate Change, Coral Pink Sand Dunes, Utah. In "2007 Association of American Geographers Annual Meeting Abstracts with Programs.”
Wobus, C.W., Whipple, K.X., Kirby, E., Snyder, N.P., Johnson, J., Spyropolou, K., Crosby, B., Sheehan, D., 2006, Tectonics from topography: procedures, promise and pitfalls, in: Willett, S., Hovius, N., Brandon, M., Fisher, D., (Eds.), GSA Special Penrose publication on Tectonics, Climate and Landscape Evolution, pp. 55-74.
Acknowledgments:
The work in Coral Pink Sand Dunes State Park was completed by Janna Rozar
(now Privette; Boise State University), John Bradford (Boise State University), Bill
Clement (former Boise State University research faculty), and Kathleen Nicoll (University
of Utah). There were many undergraduate field assistants from both Weber State and
Boise State. We had the cooperation of the Utah State Parks staff at Coral Pink Sand
Dunes State Park, and some funding through NASA and a GSA Farouk El-Baz Research
Award (to Janna). The work on arroyos was funded by a National Science Foundation
CAREER Grant to Tammy Rittenour. Five graduate students worked on the arroyo
chronologies including Jon Harvey (Fort Lewis College), Michelle Summa-Nelson (Utah
State University), Ann Hayden-Lesmeister (Southern Illinois University), Will Huff
(Chevron), Kirk Townsend (University of Michigan), and Kerry Riley (Utah State
University).