
Gaze Analytics Pipeline for Unity 3D Integrationceur-ws.org/Vol-1241/paper02.pdf · Gaze Analytics...
5
Gaze Analytics Pipeline for Unity 3D Integration Signal Filtering and Analysis Andrew T. Duchowski 1 Sabarish V. Babu 1 , Je↵ Bertrand 1 , and Krzysztof Krejtz 2 1 School of Computing, Clemson University, Clemson, SC, USA 2 National Information Processing Institute and University of Social Sciences and Humanities, Warsaw, Poland Abstract. A data processing pipeline is described for gaze analytics featuring velocity-based signal filtering leading to inferential statistics of fixation transi- tions. The approach is demonstrated on data collected from a virtual environment study conducted in Unity 3D testing the visibility of a wayfinding aid. Keywords: virtual environments, wayfinding, gaze analytics 1 Introduction & Background Analysis of human spatial cognition when navigating within physical or virtual environ- ments can be bolstered by collecting eye movements with the help of an eye tracker. In physical reality, a head-mounted tracker can be worn during navigation with recorded gaze data often mapped to the screen coordinates of a forward-facing camera. In virtual reality, gaze data can be recorded with a so-called remote, or table-mounted eye tracker placed in front of the display screen on which the virtual environment is presented. In both cases gaze data will eventually need to be processed in order to infer insights about human visual attention to elements in the environment. Application of inferential statistics to collected gaze data often relies on character- ization of the raw data into fixations, usually derived from some form of filtering, e.g., dispersion-based or velocity-based. Unfortunately, most commercial software packages provide only a limited choice of fixation detection algorithms (i.e., filters), often hiding implementation details or filter parameters from the user. Some systems (e.g., Ogama) still rely on the dispersion-based “fixation pickers” [7] which have been shown to be less than reliable, particularly when evaluating data captured on di↵erent platforms, at di↵erent sampling rates [10]. Velocity-based filters, or “saccade pickers”, while perhaps more difficult to tune, o↵er a more reliable alternative. Beyond the lack of sufficient con- trol over filtering parameters, commercial packages often do not include flexible means for statistical analysis. This is hardly surprising, however, since eye tracking vendors can hardly be expected to anticipate all possible experimental designs for which their devices are used. In this paper we describe a gaze analytics pipeline through which raw gaze data is processed. The pipeline consists of the following steps: 1. denoising and filtering raw gaze data g i = ( x i , y i , t i ), and classifying raw gaze into fixations f i = ( x i , y i , t i , d i ), where ( x i , y i ) coordinates indicate the position of the gaze ET4S 2014, September 23, 2014, Vienna, Austria Copyright © 2014 for the individual papers by the papers' authors. Copying permitted for private and academic purposes. This volume is published and copyrighted by its editors. ET4S 2014 7
Transcript of Gaze Analytics Pipeline for Unity 3D Integrationceur-ws.org/Vol-1241/paper02.pdf · Gaze Analytics...
Gaze Analytics Pipeline for Unity 3D Integration
Signal Filtering and Analysis
Andrew T. Duchowski1 Sabarish V. Babu1, Je↵ Bertrand1, and Krzysztof Krejtz2
1 School of Computing, Clemson University, Clemson, SC, USA2 National Information Processing Institute and University of Social Sciences and Humanities,
Warsaw, Poland
Abstract. A data processing pipeline is described for gaze analytics featuringvelocity-based signal filtering leading to inferential statistics of fixation transi-tions. The approach is demonstrated on data collected from a virtual environmentstudy conducted in Unity 3D testing the visibility of a wayfinding aid.
Keywords: virtual environments, wayfinding, gaze analytics
1 Introduction & Background
Analysis of human spatial cognition when navigating within physical or virtual environ-ments can be bolstered by collecting eye movements with the help of an eye tracker. Inphysical reality, a head-mounted tracker can be worn during navigation with recordedgaze data often mapped to the screen coordinates of a forward-facing camera. In virtualreality, gaze data can be recorded with a so-called remote, or table-mounted eye trackerplaced in front of the display screen on which the virtual environment is presented. Inboth cases gaze data will eventually need to be processed in order to infer insights abouthuman visual attention to elements in the environment.
Application of inferential statistics to collected gaze data often relies on character-ization of the raw data into fixations, usually derived from some form of filtering, e.g.,dispersion-based or velocity-based. Unfortunately, most commercial software packagesprovide only a limited choice of fixation detection algorithms (i.e., filters), often hidingimplementation details or filter parameters from the user. Some systems (e.g., Ogama)still rely on the dispersion-based “fixation pickers” [7] which have been shown to beless than reliable, particularly when evaluating data captured on di↵erent platforms, atdi↵erent sampling rates [10]. Velocity-based filters, or “saccade pickers”, while perhapsmore di�cult to tune, o↵er a more reliable alternative. Beyond the lack of su�cient con-trol over filtering parameters, commercial packages often do not include flexible meansfor statistical analysis. This is hardly surprising, however, since eye tracking vendorscan hardly be expected to anticipate all possible experimental designs for which theirdevices are used.
In this paper we describe a gaze analytics pipeline through which raw gaze data isprocessed. The pipeline consists of the following steps:
1. denoising and filtering raw gaze data gi = (xi, yi, ti), and classifying raw gaze intofixations fi= (xi, yi, ti, di), where (xi, yi) coordinates indicate the position of the gaze
ET4S 2014, September 23, 2014, Vienna, AustriaCopyright © 2014 for the individual papers by the papers' authors. Copying permitted for private and academic purposes. This volume is published and copyrighted by its editors.
ET4S 2014
7
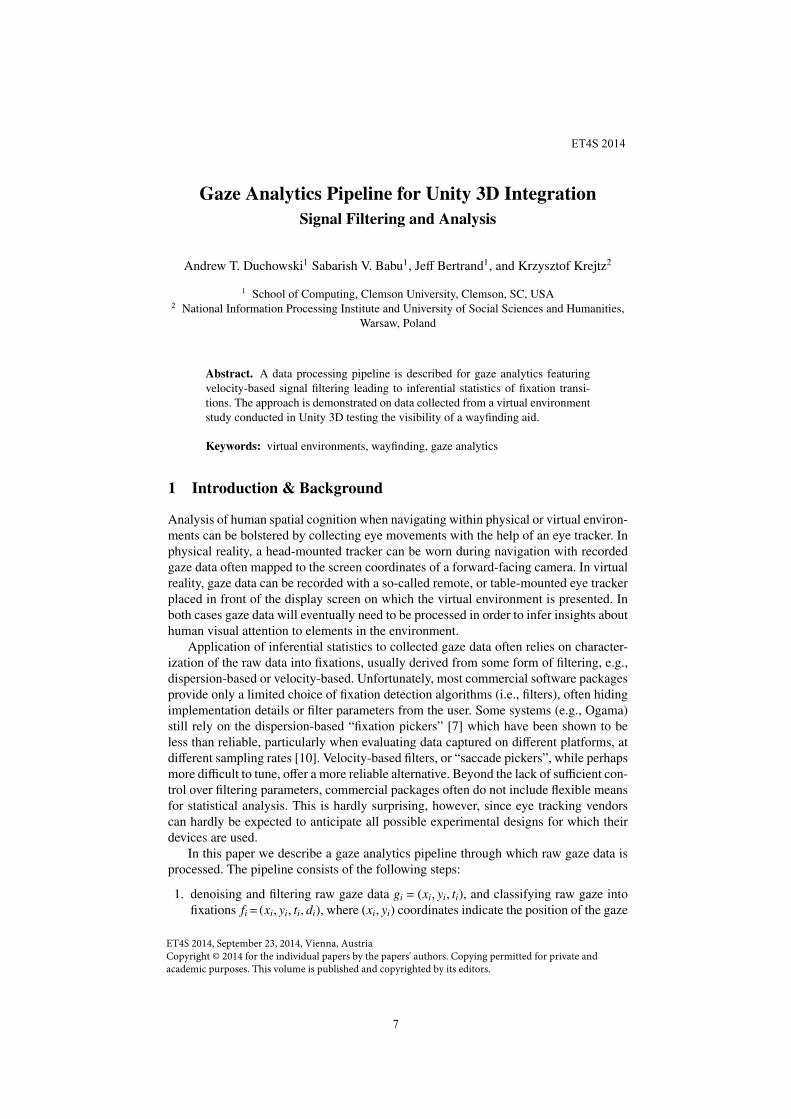
(a) No wayfinding aid (b) Wayfinding aid at bottom-right
Fig. 1. Representative screenshots of interactive virtual environment rendered in Unity 3D [2].
point or centroid of the fixation, with ti indicating the timestamp of the gaze pointor fixation and di the fixation’s duration,
2. collating fixation-related information for its subsequent statistical comparison,3. interpreting and visualizing statistical tests conducted on processed data.
Visualization of the data at each stage of the pipeline is particularly helpful in fine-tuning parameters, such as threshold levels for velocity-based filtering.
We demonstrate the utility of the analytics pipeline on data collected from a wayfind-ing study in a virtual environment (see Fig. 1) [2]. Previously, analysis was conductedonly on smoothed gaze data, with comparison of gaze time on, gaze transitions to, andproportion of gaze time over screen elements. Here, we revisit this data set and feed theraw data through the analytics pipeline, terminating in entropy transition matrix analysisof fixations captured on an Area Of Interest (AOI) grid overlaid atop the screen.
2 Fixation Filtering
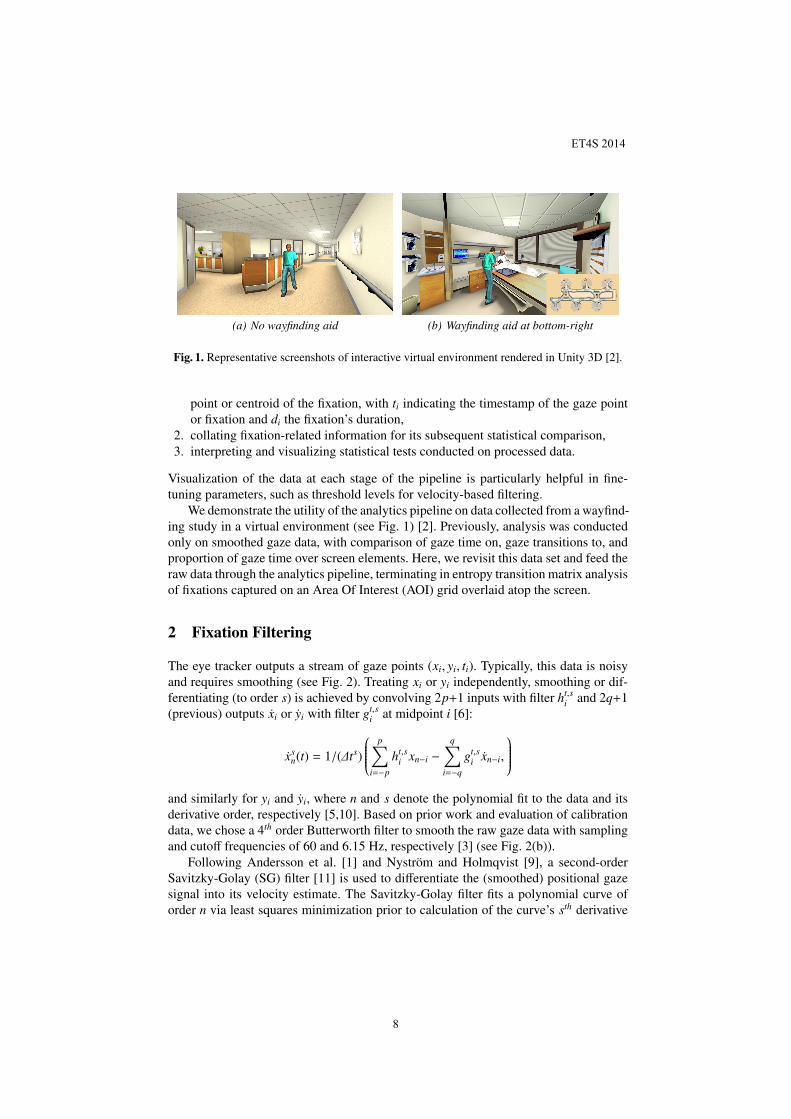
The eye tracker outputs a stream of gaze points (xi, yi, ti). Typically, this data is noisyand requires smoothing (see Fig. 2). Treating xi or yi independently, smoothing or dif-ferentiating (to order s) is achieved by convolving 2p+1 inputs with filter ht,s
i and 2q+1(previous) outputs xi or yi with filter gt,s
i at midpoint i [6]:
xsn(t) = 1/(�ts)
0BBBBBB@
pX
i=�p
ht,si xn�i �
qX
i=�q
gt,si xn�i,
1CCCCCCA
and similarly for yi and yi, where n and s denote the polynomial fit to the data and itsderivative order, respectively [5,10]. Based on prior work and evaluation of calibrationdata, we chose a 4th order Butterworth filter to smooth the raw gaze data with samplingand cuto↵ frequencies of 60 and 6.15 Hz, respectively [3] (see Fig. 2(b)).
Following Andersson et al. [1] and Nystrom and Holmqvist [9], a second-orderSavitzky-Golay (SG) filter [11] is used to di↵erentiate the (smoothed) positional gazesignal into its velocity estimate. The Savitzky-Golay filter fits a polynomial curve oforder n via least squares minimization prior to calculation of the curve’s sth derivative
ET4S 2014
8
(a) Raw gaze data (b) Smoothed gaze data
Fig. 2. Representative (individual) gaze data smoothing (35,024 points, approx. 20 min time in-terval). Blue discs indicate positions of 9 calibration points used in the study and the rectangulargrid shows the 4⇥3 rectangular AOIs used in the analysis.
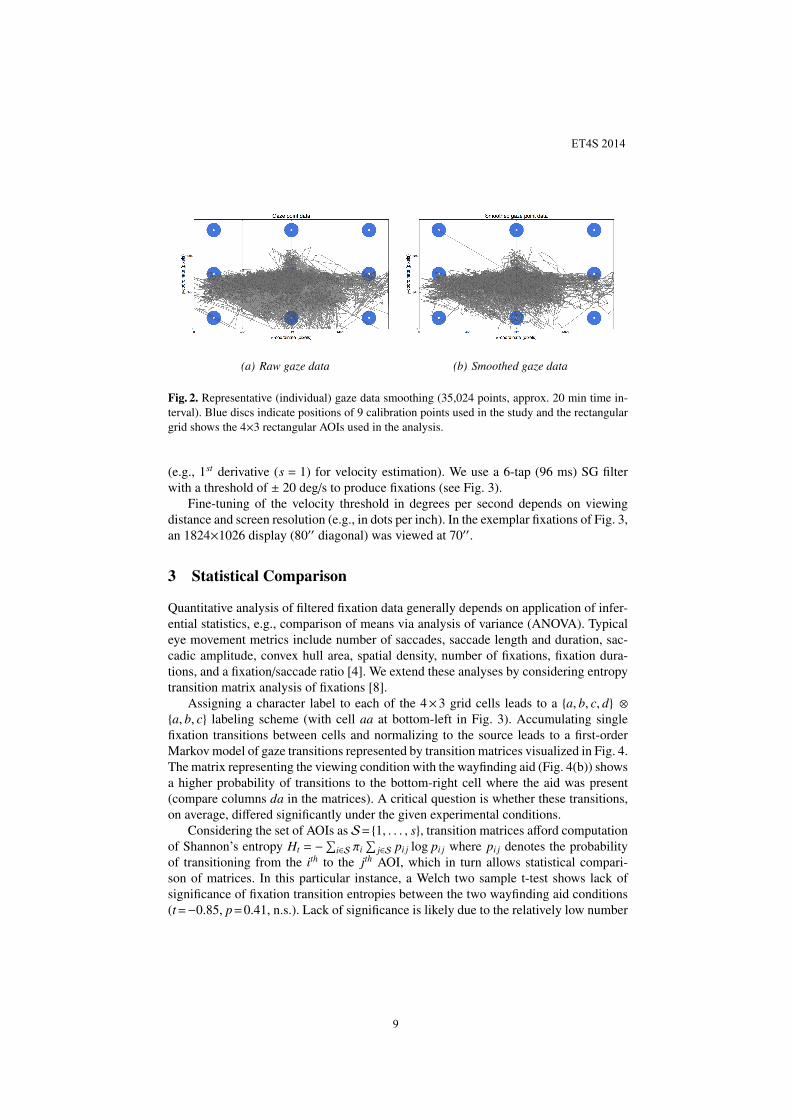
(e.g., 1st derivative (s = 1) for velocity estimation). We use a 6-tap (96 ms) SG filterwith a threshold of ± 20 deg/s to produce fixations (see Fig. 3).
Fine-tuning of the velocity threshold in degrees per second depends on viewingdistance and screen resolution (e.g., in dots per inch). In the exemplar fixations of Fig. 3,an 1824⇥1026 display (8000 diagonal) was viewed at 7000.
3 Statistical Comparison
Quantitative analysis of filtered fixation data generally depends on application of infer-ential statistics, e.g., comparison of means via analysis of variance (ANOVA). Typicaleye movement metrics include number of saccades, saccade length and duration, sac-cadic amplitude, convex hull area, spatial density, number of fixations, fixation dura-tions, and a fixation/saccade ratio [4]. We extend these analyses by considering entropytransition matrix analysis of fixations [8].
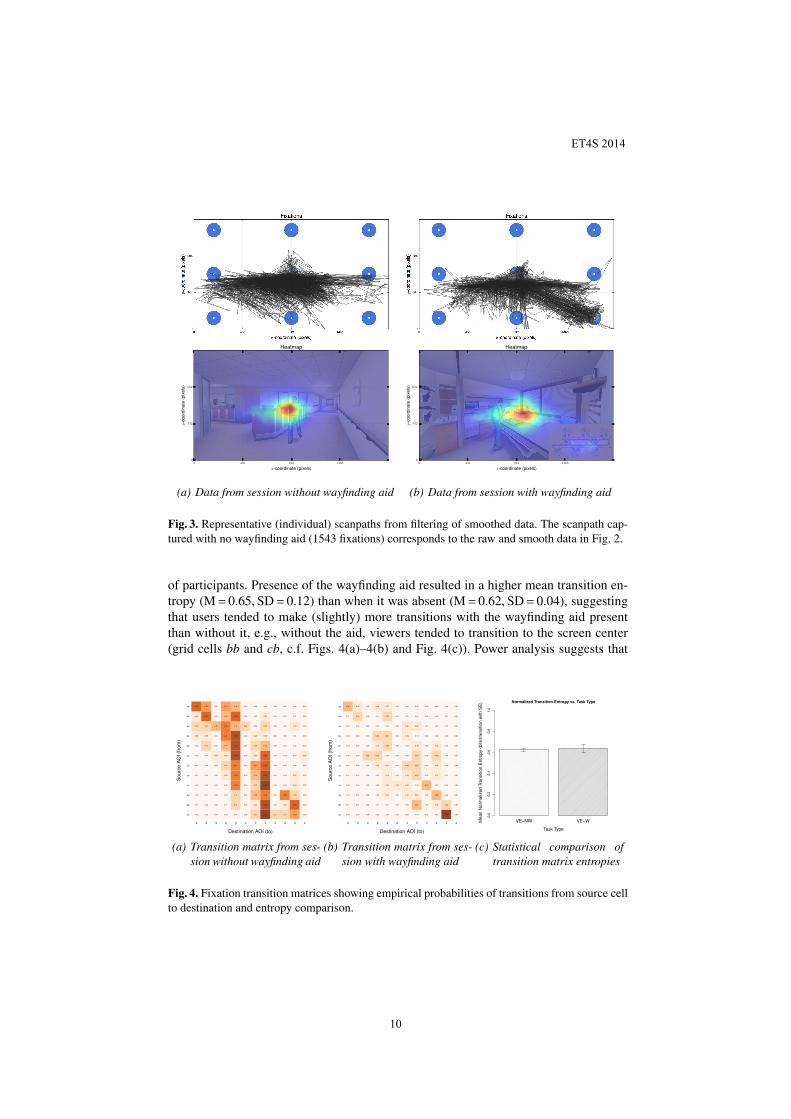
Assigning a character label to each of the 4⇥3 grid cells leads to a {a, b, c, d} ⌦{a, b, c} labeling scheme (with cell aa at bottom-left in Fig. 3). Accumulating singlefixation transitions between cells and normalizing to the source leads to a first-orderMarkov model of gaze transitions represented by transition matrices visualized in Fig. 4.The matrix representing the viewing condition with the wayfinding aid (Fig. 4(b)) showsa higher probability of transitions to the bottom-right cell where the aid was present(compare columns da in the matrices). A critical question is whether these transitions,on average, di↵ered significantly under the given experimental conditions.
Considering the set of AOIs as S= {1, . . . , s}, transition matrices a↵ord computationof Shannon’s entropy Ht = �
Pi2S ⇡i
Pj2S pi j log pi j where pi j denotes the probability
of transitioning from the ith to the jth AOI, which in turn allows statistical compari-son of matrices. In this particular instance, a Welch two sample t-test shows lack ofsignificance of fixation transition entropies between the two wayfinding aid conditions(t=�0.85, p=0.41, n.s.). Lack of significance is likely due to the relatively low number
ET4S 2014
9
0 456 912 1368
x-coordinate (pixels)
0
342
684
y-co
ordi
nate
(pix
els)
Heatmap
(a) Data from session without wayfinding aid
0 456 912 1368
x-coordinate (pixels)
0
342
684
y-co
ordi
nate
(pix
els)
Heatmap
(b) Data from session with wayfinding aid
Fig. 3. Representative (individual) scanpaths from filtering of smoothed data. The scanpath cap-tured with no wayfinding aid (1543 fixations) corresponds to the raw and smooth data in Fig. 2.
of participants. Presence of the wayfinding aid resulted in a higher mean transition en-tropy (M= 0.65, SD= 0.12) than when it was absent (M= 0.62, SD= 0.04), suggestingthat users tended to make (slightly) more transitions with the wayfinding aid presentthan without it, e.g., without the aid, viewers tended to transition to the screen center(grid cells bb and cb, c.f. Figs. 4(a)–4(b) and Fig. 4(c)). Power analysis suggests that
dc
db
da
cc
cb
ca
bc
bb
ba
ac
ab
aa
aa ab ac ba bb bc ca cb cc da db dc
Destination AOI (to)
Sou
rce
AOI (
from
)
0.00 0.00 0.00 0.00 0.00 0.00 0.11 0.44 0.11 0.11 0.22 0.00
0.01 0.02 0.00 0.01 0.14 0.00 0.07 0.35 0.00 0.07 0.33 0.00
0.00 0.01 0.00 0.03 0.10 0.00 0.16 0.26 0.01 0.28 0.14 0.00
0.00 0.00 0.00 0.02 0.25 0.02 0.14 0.41 0.04 0.04 0.06 0.02
0.01 0.03 0.00 0.05 0.28 0.00 0.16 0.36 0.01 0.03 0.07 0.00
0.01 0.02 0.00 0.11 0.27 0.00 0.21 0.32 0.00 0.04 0.02 0.00
0.00 0.00 0.08 0.08 0.38 0.00 0.05 0.32 0.00 0.03 0.00 0.05
0.03 0.10 0.00 0.17 0.38 0.00 0.10 0.19 0.00 0.01 0.02 0.00
0.08 0.09 0.00 0.26 0.39 0.00 0.09 0.08 0.00 0.00 0.01 0.00
0.10 0.10 0.15 0.25 0.15 0.10 0.00 0.10 0.00 0.00 0.05 0.00
0.09 0.32 0.00 0.15 0.32 0.00 0.03 0.07 0.00 0.01 0.01 0.00
0.30 0.20 0.00 0.24 0.18 0.00 0.03 0.04 0.00 0.00 0.00 0.00
(a) Transition matrix from ses-sion without wayfinding aid
dc
db
da
cc
cb
ca
bc
bb
ba
ac
ab
aa
aa ab ac ba bb bc ca cb cc da db dc
Destination AOI (to)
Sou
rce
AOI (
from
)
0.00 0.00 0.00 0.00 0.00 0.00 0.00 0.00 0.00 0.00 1.00 0.00
0.01 0.01 0.00 0.01 0.11 0.00 0.08 0.37 0.00 0.18 0.23 0.00
0.00 0.02 0.00 0.05 0.16 0.00 0.17 0.21 0.00 0.34 0.04 0.00
0.00 0.00 0.00 0.00 0.20 0.20 0.20 0.00 0.40 0.00 0.00 0.00
0.01 0.02 0.00 0.07 0.19 0.00 0.19 0.27 0.00 0.17 0.07 0.00
0.01 0.02 0.00 0.12 0.13 0.00 0.26 0.25 0.00 0.19 0.02 0.00
0.00 0.00 0.25 0.25 0.00 0.00 0.00 0.25 0.00 0.25 0.00 0.00
0.03 0.08 0.00 0.15 0.33 0.00 0.07 0.18 0.00 0.13 0.02 0.00
0.06 0.04 0.00 0.30 0.31 0.00 0.14 0.10 0.00 0.04 0.00 0.00
0.00 0.10 0.10 0.10 0.10 0.00 0.20 0.20 0.10 0.00 0.10 0.00
0.11 0.28 0.00 0.11 0.32 0.00 0.05 0.07 0.00 0.06 0.01 0.00
0.35 0.18 0.00 0.18 0.17 0.00 0.02 0.05 0.00 0.04 0.00 0.00
(b) Transition matrix from ses-sion with wayfinding aid
VE−NW VE−W
Normalized Transition Entropy vs. Task Type
Task Type
Mea
n N
orm
aliz
ed T
rans
ition
Ent
ropy
(bits
/tran
sitio
n w
ith S
E)
0.0
0.2
0.4
0.6
0.8
1.0
(c) Statistical comparison oftransition matrix entropies
Fig. 4. Fixation transition matrices showing empirical probabilities of transitions from source cellto destination and entropy comparison.
ET4S 2014
10
the e↵ect of the wayfinding aid on gaze transitions may reach significance (p < 0.05)with about 400 participants (per between-subjects group).
4 Discussion & Conclusions
A data pipeline was described for processing raw gaze data through filtering and velocity-based fixation classification followed by collation of fixations into transitions for entropy-based statistical comparison.
With gaze data recorded in individual XML files, the entire processing pipeline,complete with data visualizations, is readily implemented in Python and R, the freesoftware environment for statistical computing.
References
1. Andersson, R., Nystrom, M., Holmqvist, K.: Sampling frequency and eye-tracking measures:how speed a↵ects durations, latencies, and more. Journal of Eye Movement Research 3(3),1–12 (2010)
2. Bertrand, J., Ebrahimi, E., Wachter, A., Luo, J., Babu, S.V., Duchowski, A.T., Meehan, N.,Gramopadhye, A.K.: Visual Attention to Wayfinding Aids in Virtual Environments. In: Pro-ceedings of the Joint Virtual Reality Conference (JVRC) (11-13 December 2013)
3. Duchowski, A.T., Pelfrey, B., House, D.H., Wang, R.: Measuring Gaze Depth with an EyeTracker During Stereoscopic Display. In: Applied Perception in Graphics & Visualization(APGV). ACM, Toulouse, France (August 27-28 2011)
4. Goldberg, J.H., Kotval, X.P.: Computer Interface Evaluation Using Eye Movements: Meth-ods and Constructs. International Journal of Industrial Ergonomics 24, 631–645 (1999)
5. Gorry, P.A.: General Least-Squares Smoothing and Di↵erentiation by the Convolution(Savitzky-Golay) Method. Analytical Chemistry 62(6), 570–573 (1990), http://pubs.acs.org/doi/abs/10.1021/ac00205a007
6. Hollos, S., Hollos, J.R.: Recursive Digital Filters: A Concise Guide. Exstrom Laboratories,LLC., Longmont, CO (April 2014), iSBN: 9781887187244 (ebook), URL: http://www.abrazol.com/books/filter1/
7. Karn, K.S.: “Saccade Pickers” vs. “Fixation Pickers”: The E↵ect of Eye Tracker Choice onResearch Findings (Panel Discussion). In: ETRA ’00: Proceedings of the 2004 Symposiumon Eye Tracking Research & Applications. pp. 87–88. ACM, New York, NY (2000)
8. Krejtz, K., Szmidt, T., Duchowski, A.T., Krejtz, I.: Entropy-based Statistical Analysis of EyeMovement Transitions. In: Proceedings of the 2014 Symposium on Eye-Tracking Researchand Applications. ETRA ’14, ACM, New York, NY (2014), http://doi.acm.org/10.1145/2578153.2578168
9. Nystrom, M., Holmqvist, K.: An adaptive algorithm for fixation, saccade, and glissade de-tection in eyetracking data. Behaviour Research Methods 42(1), 188–204 (2010)
10. Ouzts, A.D., Duchowski, A.T.: Comparison of Eye Movement Metrics Recorded at Di↵erentSampling Rates. In: Proceedings of the 2012 Symposium on Eye-Tracking Research andApplications. ETRA ’12, ACM, New York, NY (March 28-30 2012)
11. Savitzky, A., Golay, M.J.E.: Smoothing and di↵erentiation of data by simplified least squaresprocedures. Analytical Chemistry 36(8), 1627–1639 (1964), http://pubs.acs.org/doi/abs/10.1021/ac60214a047
ET4S 2014
11