Futurestudents.mst.edu Founded 1870 | Rolla, Missouri Jay W. Goff Vice Provost and Dean of...
90
futurestudents.mst.edu Founded 1870 | Rolla, Missouri Jay W. Goff Vice Provost and Dean of Enrollment Management Missouri University of Science and Technology Rolla, Missouri, USA [email protected] Download today’s presentation: http://enrollment.mst.edu Using Data to Plan and Manage Admissions A View from the USA
-
Upload
asher-redfearn -
Category
Documents
-
view
214 -
download
1
Transcript of Futurestudents.mst.edu Founded 1870 | Rolla, Missouri Jay W. Goff Vice Provost and Dean of...

futurestudents.mst.edu
Founded 1870 | Rolla, Missouri
Jay W. GoffVice Provost and Dean of Enrollment Management
Missouri University of Science and TechnologyRolla, Missouri, USA
[email protected] today’s presentation:
http://enrollment.mst.edu
Using Data to Plan and Manage Admissions A View from the USA

The external environment colleges and universities operate in is changing quickly
• Dramatic changes in student markets
• Public expectations for a wide variety of high quality student services
• Shrinking government funding and increasing government oversight
• Greater needs for an institution-wide understanding of how to best react to the emerging student trends, needs and markets.

“University politics are vicious precisely because the stakes are so small.”
-Henry KissingerUS diplomat & Harvard scholar
STILL TRUE?
Strong Need for Degree Completion

Need for Completed Degrees in the US
Assuming current rates of college attendance, persistence and “off shoring” do not change, analyst Anthony P. Carnevale concludes that by 2012, the U.S. will face a cumulative 10-year shortage of:
850,000 associate degrees 3.2 million bachelor’s degrees 2.9 million graduate degrees
National Center for Higher Education Management Systems : 55% of the population will need college degrees by 2025 in order to equal degree attainment in top-performing countries, a potential “degree gap” of 15.6 million
SOURCE: College Board 2008 “Achieving the Dream of America”

CHALLENGE IN USA
Using Data to Redesign a University for the Future:
Managing Massive Change and Succeeding Along the Way

Today’s Admissions/Enrollment Manager
“Successful senior enrollment managers have to operate simultaneously on multiple levels. They need to be up to date, even on the cutting edge of technology, marketing, recruitment, the latest campus practices to enhance student persistence, and financial aid practices.” Don Hossler, University of Indiana
SOURCE: THE ENROLLMENT MANAGEMENT REVIEW Volume 23, Issue 1 Fall, 2007, Editor: Don Hossler Associate Editors: Larry Hoezee and Dan Rogalski

Hossler continued
“(Enrollment Managers) need to be able to guide and use research to inform institutional practices and strategies. Successful enrollment managers need to be good leaders, managers, and strategic thinkers.
Furthermore, to be effective, enrollment managers must also have a sense of how public, societal, and competitive forces are likely to move enrollment-related policies and practices in the future.”
SOURCE: THE ENROLLMENT MANAGEMENT REVIEW Volume 23, Issue 1 Fall, 2007, Editor: Don Hossler Associate Editors: Larry Hoezee and Dan Rogalski

The Admission/Enrollment Planning Model
MeetingGoals
Tactics
Strategies
Enrollment InfrastructureStructure, Staffing, Skills, Systems, Service
Data Collection and Analysis
Clear Mission and Goals
Typical Typical starting starting pointpoint
Starting Starting point for point for
long term long term successsuccess
bontragr

Don Hossler PhD,
Exec. Assoc. Dean for the School of Education at Indiana University Bloomington
Indiana UniversityJune 23, 2009
Association for Institutional Research Conference
“Good institutional research can either narrow a myriad of choices to a manageable few, or give many more options when just a few seem likely.”
Why data is important

Rolla, Missouri“The Middle of Everywhere”
160 km from St. Louis640 km from Chicago

Main Campus: 52 primary buildings on 284 acres
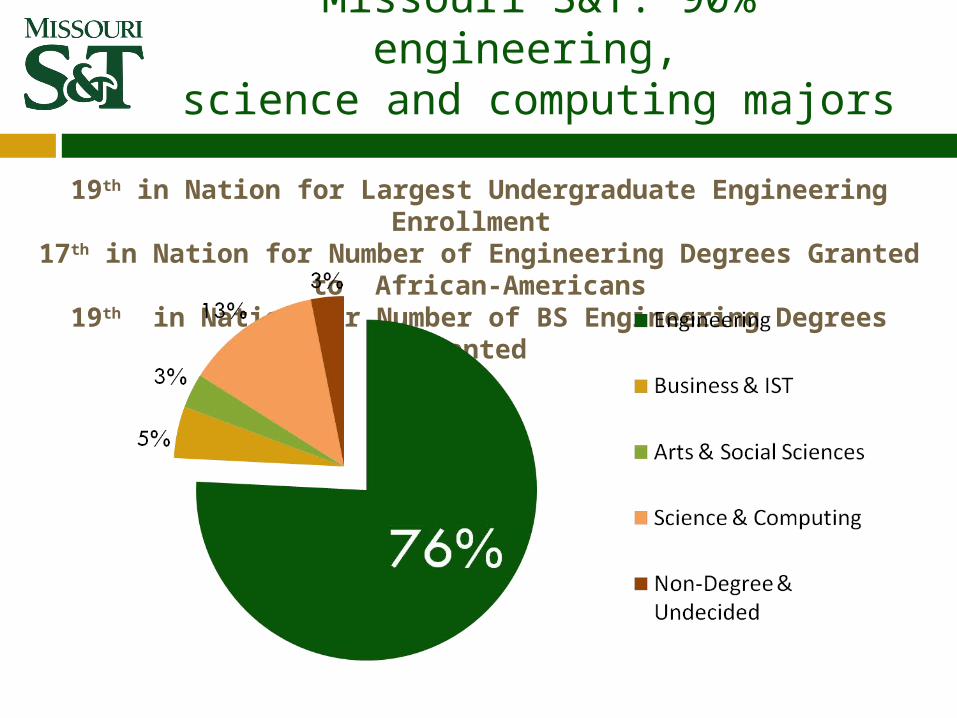
Missouri S&T: 90% engineering, science and computing majors
19th in Nation for Largest Undergraduate Engineering Enrollment 17th in Nation for Number of Engineering Degrees Granted to African-Americans
19th in Nation for Number of BS Engineering Degrees Granted

Missouri S&T
Michigan Tech
Colorado Mines
SD Mines
New Mexico Mining & Tech
IllinoisTech
CalTech
FloridaTech
GeorgiaTech
Clarkson
New JerseyTech
StevensTech
MIT
WPI
Rensselaer
America’s TechnologicalResearch Universities
U of A - Huntsville

1870: Founded as University of Missouri School of Mines and Metallurgy (MSM)
1964: University of Missouri-Rolla (UMR)expanded curriculum and research mission
2008: Missouri University of Science and Technology (Missouri S&T) emphasizes STEM focused mission
University History

All ACT Out-of-StateSenders State Senders
4,942 391 Central Missouri State University2,629 551 UM-Rolla4,241 651 Southeast Missouri State Univ.3,352 654 UMSL4,164 728 Truman State4,278 981 UMKC9,221 1,000 Missouri State University3,926 1,187 Northwest Missouri State Univ.
12,800 2,301 UMC5,382 2,591 St. Louis University7,343 5,331 Washington University in St. Louis
Name recognition among college-bound students outside of Missouri
SOURCE: ACT EIS, 2005

“Missouri S&T will better define the university as a leading technological research university. We believe the new name will help to differentiate this university in a highly competitive university market and provide a national competitive advantage.”
Dr. John F. Carney, IIIMissouri S&T Chancellor
ADMISSION DATA in ACTION:Why Change the University Name?

7 Years of Strategic and Dramatic ChangesJanuary 1, 2008 University Name Change
2007 Academic Reorganization by Eliminating Schools and Colleges
2003 and 2007 Updated the Mission, Vision and Strategic plans.
2004 Office of Technology Transfer and Economic Development
2001 to 2005 New Student and Business Information Systems
2002, 2004 & 2007 Three New Homepages and Platforms
2003 Student Diversity Initiative
The new goals resulted in three new units and champions: Student Diversity Programs, Women’s Leadership Institute Center for Pre-College Programs.
2002 New School of Management and Information Sciences
2002 Center for Education Research and Teaching Innovation (CERTI)
2002 - 2006 12 NEW Degree Programs and 19 Certificate Programs,
128 hour limited for BS Engineering Degrees
2001 Administrative Restructuring and Formal Enrollment Management Program
Enrollment Management, Research and Sponsored Programs Undergraduate and Graduate Programs


Role of the Chief Enrollment Manager
Enrollment leaders serve many roles throughout the change management process, such as that of a visionary, encourager, storyteller, facilitator, arbitrator, problem solver, manager and coach. Jim Black, AACRAO SEM 2003
CEMs are Systems Thinkers Adept at Influencing Change

The only person who likes change is a wet baby.
Attributed to Mark Twain

Change is inevitable – except from a vending machine.
Author unknown

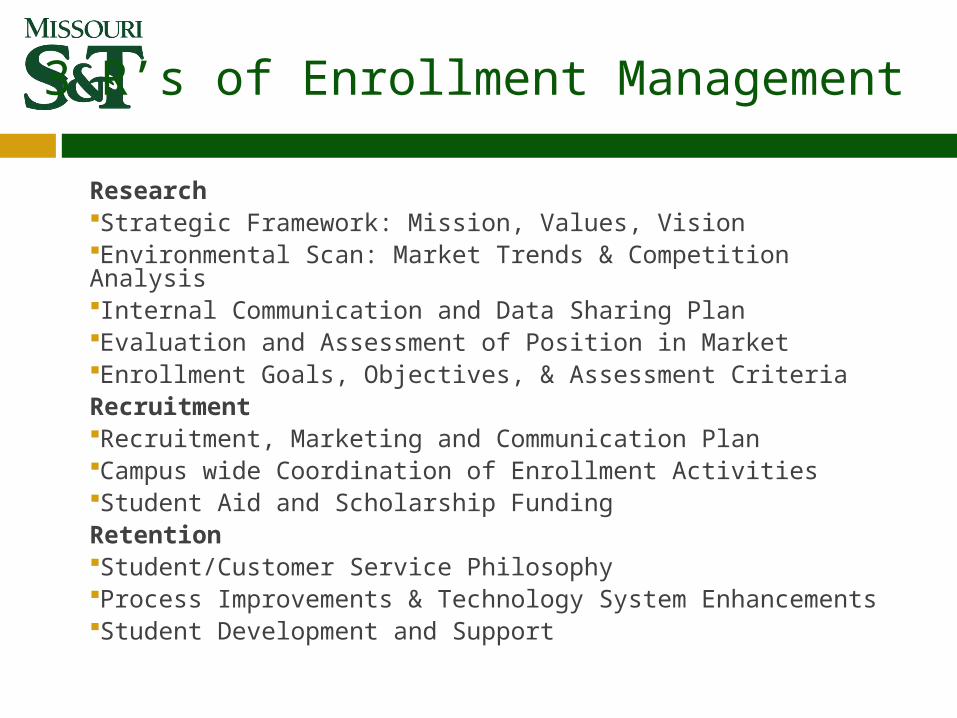
3 R’s of Enrollment Management
ResearchStrategic Framework: Mission, Values, VisionEnvironmental Scan: Market Trends & Competition AnalysisInternal Communication and Data Sharing PlanEvaluation and Assessment of Position in MarketEnrollment Goals, Objectives, & Assessment CriteriaRecruitmentRecruitment, Marketing and Communication PlanCampus wide Coordination of Enrollment ActivitiesStudent Aid and Scholarship FundingRetentionStudent/Customer Service PhilosophyProcess Improvements & Technology System EnhancementsStudent Development and Support
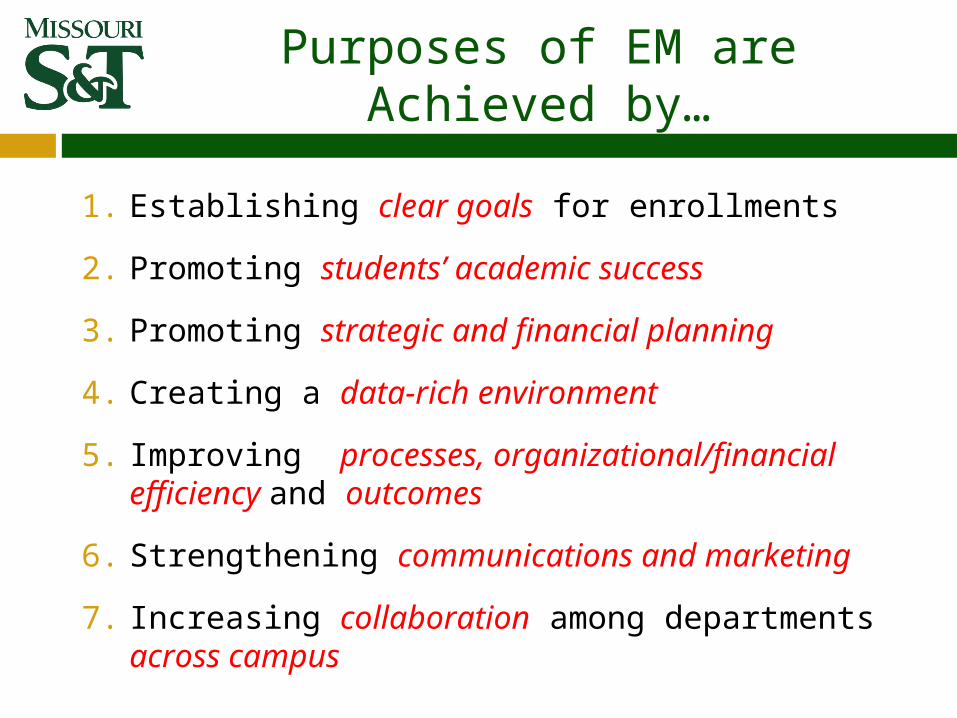
Purposes of EM are Achieved by…
1. Establishing clear goals for enrollments
2. Promoting students’ academic success
3. Promoting strategic and financial planning
4. Creating a data-rich environment
5. Improving processes, organizational/financial efficiency and outcomes
6. Strengthening communications and marketing
7. Increasing collaboration among departments across campus
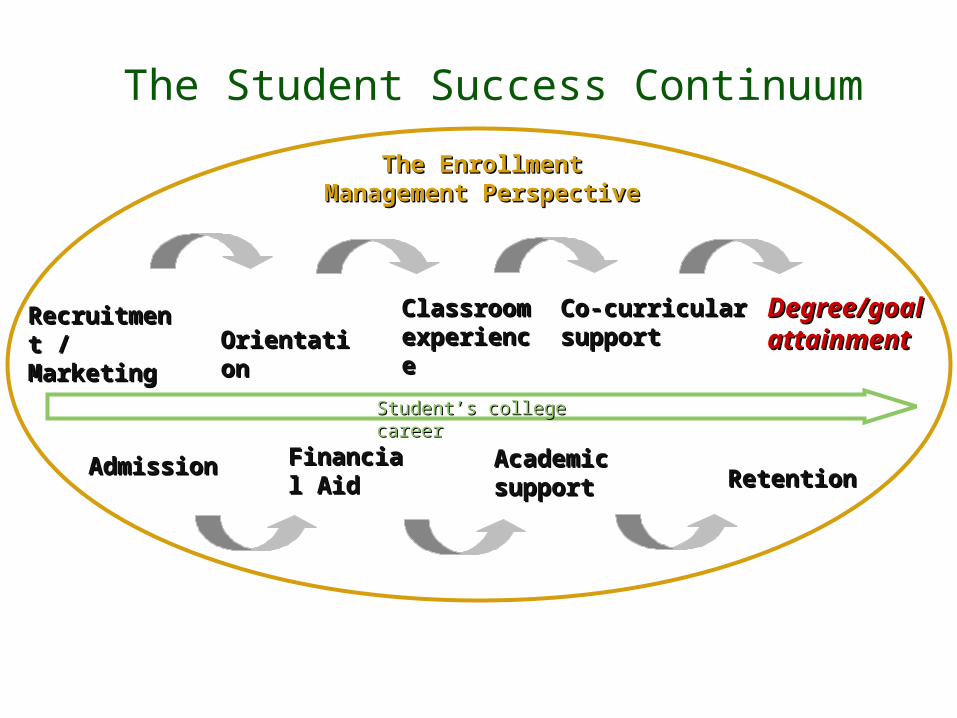
The Student Success Continuum
Recruitment / Recruitment / MarketingMarketing
AdmissionAdmission
OrientationOrientationCo-curricular Co-curricular supportsupport
Degree/goal Degree/goal attainmentattainment
Academic Academic supportsupport RetentionRetention
Financial Financial AidAid
Student’s college careerStudent’s college career
Classroom Classroom experienceexperience
The Enrollment The Enrollment Management PerspectiveManagement Perspective


Case Study: Missouri S&T

Our Mission:
To integrate
education and
research to
solve problems
for our state and the
technological world.
discover. create. innovate.
Learn Morevisions.mst.edu

A Top Public UniversityMissouri S&T ranked 59th among the nation’s top public universities (U.S. News & World Report, 2011 America’s Best Colleges, September 2010).
Top 3 starting salaries among public universities Missouri S&T named in payscale.com’s list of highest average starting salaries for graduates (www.payscale.com, Aug. 2010)
Top 5 best values among national public universitiesMissouri S&T ranked 5th among the nation’s national public universities and 37th overall (U.S. News & World Report, 2010 America’s Best Colleges Guidebook, September
2009).
Top 20 STEM research university Missouri S&T named in Academic Analytics’ “Top 20 Specialized Research Universities - STEM” (www.academicanalytics.com, Jan. 2008)
Top 25 entrepreneurial campus Missouri S&T ranked 22nd on Forbes ‘s list of “America’s Most Entrepreneurial Campuses” (www.forbes.com , Oct. 22, 2004).
Top 25 best college “return on investment” Missouri S&T ranked 22nd on Forbes ‘s list of “America’s Most Entrepreneurial Campuses” (www.forbes.com , Oct. 22, 2004).
Top 30 safest college campusesMissouri S&T ranked #27 in Reader’s Digest’s “Campus Safety Survey” (www.rd.com, 2008).
One of America’s Great Universities
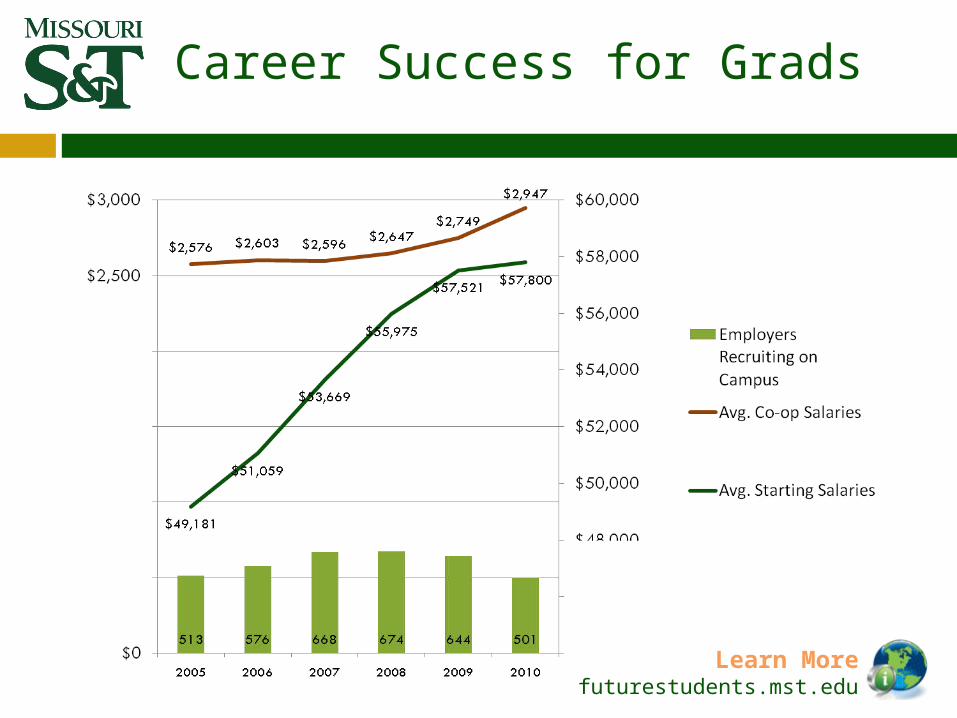
Career Success for Grads
Learn Morefuturestudents.mst.edu

Problem…

SOURCE: ACT EIS 2008
> 5%
20,000 Fewer potential engineering majors
College Bound ACT Tested Students Interested in Any Engineering Field

Tuition and Fees have replaced state support as the primary resource for the operating budget
* Budget
OPEN – GB – INFO 2

Percent For Whom Financing was a Major Concern
1992-93 to 2006-07 (Selected Years)
Source: CIRP
0%
5%
10%
15%
20%
25%
92-93 94-95 96-97 97-98 99-00 00-01 01-02 02-03 03-04 04-05 05-06 06-07
Public Univ Private Univ Public 4-Yr Private (Non-Sect) 4-Yr
College Board, 2007

Division of Enrollment Management
Data Specialists

Truly One of the Largest &BEST EVER Classes!!
CONGRATULATIONS
on Attracting an Outstanding Class and Exceeding the Goals

47% Total Enrollment Growth: 2000: 4,626
2009: 6,815
41% Undergraduate Growth: 1,214
additional students
73% Graduate Growth: 682 additional
students
Since 2004: 60% of
growth due to increased
retention
Goals met and exceeded!

Graduation Rates 2000 2010
General Student Body: 52% 66%
Student retention60% of S&T’s growth since 2004 has been due to increased retention

Enrollment diversity

Fall 201043
8
4
3
2
43
2941
19
556
128
3629
4,901
54
8125
7
4
20
20
45928
20
34
20
18
16 25
7
24
12
12
3
22
22
32
6
174
4
12
Total Enrollment
48 states & 51 nations
70% Missouri residents
10% minority students
9% international students
DC 1
4
Students’ Home States
1
2
Unofficial data until after 4th week census

International Student Enrollment

Students and Alumni fromOver 70 Countries
960 Students from China - Fall 2010

#1 Question:
How did you do it?

The Truth is……….

ResearchRecruitment Retention
Planning with Data

1. To target admissions efforts and predict enrollments2. To recommend changes to admissions policy3. To examine issues of how best to accommodate growth4. To improve the educational experience of students5. To identify needs of unique student groups6. To project and plan for student enrollment behavior7. To determine financial aid policies8. To assess student outcomes9. To improve retention 10. To build relationships with high schools and community colleges
How data/research is used inStrategic Enrollment Management
3 R’s of Enrollment Management
ResearchStrategic Framework: Mission, Values, VisionEnvironmental Scan: Market Trends & Competition AnalysisInternal Communication and Data Sharing PlanEvaluation and Assessment of Position in MarketEnrollment Goals, Objectives, & Assessment CriteriaRecruitmentRecruitment, Marketing and Communication PlanCampus wide Coordination of Enrollment ActivitiesStudent Aid and Scholarship FundingRetentionStudent/Customer Service PhilosophyProcess Improvements & Technology System EnhancementsStudent Development and Support

Research
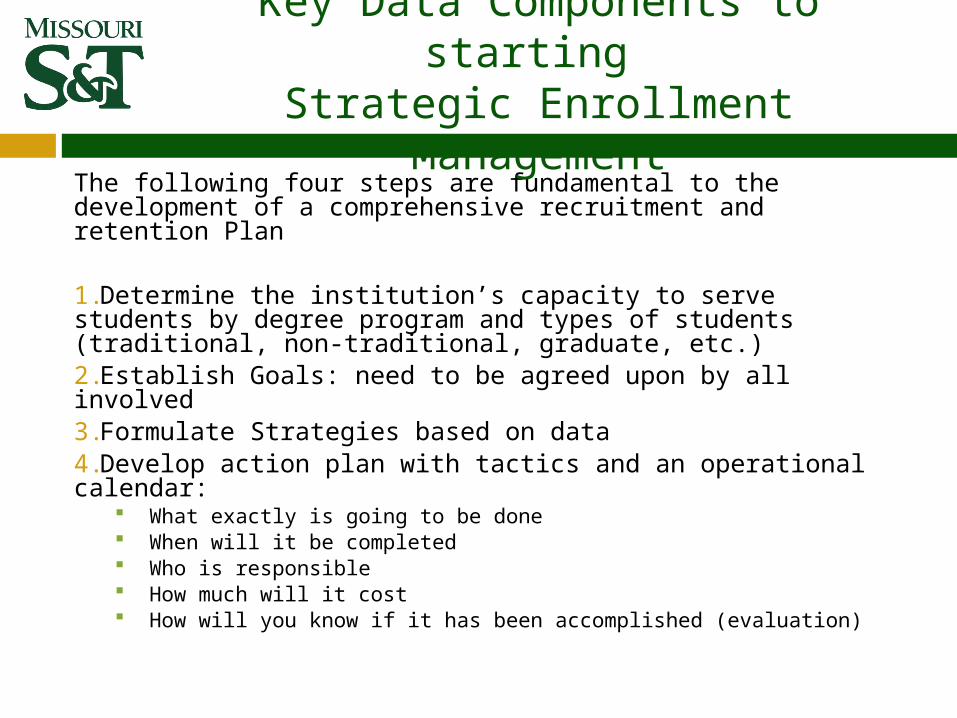
The following four steps are fundamental to the development of a comprehensive recruitment and retention Plan
1.Determine the institution’s capacity to serve students by degree program and types of students (traditional, non-traditional, graduate, etc.)2.Establish Goals: need to be agreed upon by all involved3.Formulate Strategies based on data4.Develop action plan with tactics and an operational calendar:
What exactly is going to be done When will it be completed Who is responsible How much will it cost How will you know if it has been accomplished (evaluation)
Key Data Components to starting Strategic Enrollment Management

Over 4200 Colleges & Universities:Heavy Competition for Students
Number of Colleges and Universities
SOURCE: U.S. Education Department
http://chronicle.com Section: The 2007-8 Almanac, Volume 54, Issue 1, Page 8

The NEW National Picture
SOURCE: WICHE, 2008

Challenge: Changes in the College-Bound Student Markets
The Midwest and Northeast will experience a 4% to 10% decline in high school graduates between 2009 – 2014 (WICHE)
The profile of college-bound students is rapidly becoming more ethnically diverse and female dominant (NCES, WICHE, ACT, College Board)
The number of students interested in engineering, computer science, and natural science degrees has declined to record lows (ACT, CIRP)
More full-time college freshmen are choosing to start at two-year colleges (IPED, MODHE)
More students are enrolling in more than one college at a time (National Student Clearinghouse)
Future student market growth will include more students requiring financial aid and loans to complete a degree (WICHE)

1050 to 1150 students with the following profile:
Academic Preparedness: 27 average ACT score (upper 10% in nation)90% having completed the full Missouri college-prep
curriculum 50% from the upper 20% of high school class
Geography: 70% in-state 25% out-of-state 5% internationalGender: 30% female 70% male Ethnicity: 13% under-represented minority studentsMajors: 70% Engineering (all programs)
5% Liberal Arts (psychology, history, English, technical communication, philosophy)
8% Business, Information Technology and Economics9% Natural Sciences and Mathematics (biology, chemistry, physics)
8% Computer ScienceSuccess Rate: 90% first to second year retention rate
80% return for third year65-70% graduate in six years
An ideal Missouri S&T freshman class

Strategic Enrollment Management Plan 2007-2011
Increase Success of Students Retention Rates Graduation Rates
Increase College Going Rate & Access1. Access & Affordability2. Pipeline of College Ready Students3. Strategic Partnerships4. Outreach/Education5. Scholarships
Expanding Current Markets & Capturing New Markets1. Out-of-state students2. Transfer Students3. Female Students4. Underrepresented Minority Students5. International Students6. Graduate Students7. Nontraditional Students

Do not discount the value of funnel management and analysis
ACT data makes the process much easier to engage on macro and micro levels
Basic enrollment funnel

High School Seniors: 72,467 High School Graduates: 61,752 ACT Testers/College Bound: 47,240 Any Engineering Interest (all testers): 1,768 Any Engineering Interest, (+21 testers): 1,256
(21 = MO average score / 50%) Engineering Interest, +24 comp. score: 961
(24 = UM minimum for auto admission) Missouri S&T Freshmen Engineering Enrollees: 681
Missouri’s 2008 student pipeline for engineering
SOURCES: MODESE 2009, ACT EIS 2008, PeopleSoft

Tight Markets for Minority & Female EngineersMissouri’s 2008 ACT Tested Seniors,
+24 ACT and Interested in Engineering
High School Senior Cohort: 72,467 High School Graduates: 61,752 All Engineering Interest, +24 comp. score: 961
(24 = UM minimum for auto admission)
Female Engineering, +24 comp. score: 176 African-Amer Engineering, +24 comp. score: 21 Asian-Amer Engineering, +24 comp. score: 25 Native Amer Engineering, +24 comp. score: 7 Hispanic Engineering, +24 comp. score: 24

FS2008 Domestic First Time College Freshman

Fall 2009 Inquiries – FreshmenGraphed by 3 Digit Zip Code

National Service Regions

Highest Yielding Enrollment Activities
Campus Visit/Summer Camps Over 70% of the students who visit campus or attend a camp apply About 61% of these applicants enroll, so about 42% of our high school level
camp attendees end up enrolling 2009’s freshmen report that around 26% of the students attending at least
one summer program
Telecounseling Increases students attendance at HS/CC visit, receptions & campus
visitation
Regular Communication/Relationship Development Current communication plans provide contacts every 2 to 4 weeks from
the end of the Junior Year to the April of Senior Year• General Plan: 14 to 18 contacts/communications• Minority or Women: 21 to 27 contacts/communications• Minority Women: 28 to 36 contact/communications

Recruitment

76% of families would be “somewhat” or “very likely” to consider a more
expensive institution if it could deliver greater value.
SOURCE: Longmire & Company, Inc. 2009 “Study of the Impact of the Economy on Enrollment”

Factors Most Noted in Choosing a College in the US
Majors & Career Programs Offered Location/Campus Characteristics Cost/Affordability Campus Size/Safety Characteristics of Enrolled Students Selectivity

Keys to Attracting and Retaining Students
1. Sending the right message to the right students, at the right time, in the right format
2. The development and management of a multi-level prospective student communication plans
3. Consistently sending our messages through well- trained, committed, caring individuals across the campus
4. Having the appropriate resources to implement the plans

Noel-Levitz 2010 e-expectations report
1 in 4 students reported removing a school from their prospective list because of a bad experience on that school’s Web site.
92% would be disappointed with a school or remove it entirely from their lists if they didn’t find the information they needed on the school’s Web site.

The Role of Parents & Communications
90% choose their kids' colleges on the web
82 % plan to play a pivotal role in helping their children make the final decision about college
17% entrust their child to make that decision independently
SOURCE: Circling Over Enrollment: The E-Expectations of the Parents of College-Bound Students, 2009

RECRUITMENT FUNNEL ACTIVITIES
PRE-FUNNELEARLY INTERVENTION, COMMUNITY SERVICE PROGRAMSSUMMER CAMPS, WEB REPLIES
EARLY FUNNELPSAT/ACT PLAN/TARGET MARKET SEARCHESACT/SAT SCORESDIRECT MAILTRAVELPUBLICATIONSON-CAMPUS PROGRAMSADVERTISING
MID FUNNELON- AND OFF-CAMPUS PROGRAMSDIRECT MAILSCHOLARSHIP/FINANCIAL AIDTRAVELTELECOUNSELINGPUBLICATIONS
LATE FUNNELON- AND OFF-CAMPUS PROGRAMSDIRECT MAILTELECOUNSELINGPUBLICATIONSSCHOLARSHIPSFINANCIAL AID
FEB - AUG
AUG - JAN
JAN - MAY
Apply
Enroll
Inquire

1. We’re one of America’s top
technological research universities.
2.Our students get great jobs
at great salaries.
3.Our students graduate with the
ability to address real-world problems.
4.We’re one of America’s
“30 safest campuses.”
5.S&T is one of the top 10
“best value” national public universities.
Focus Communications on Outcomes and Value

Over 600 Corporate Partners and Hiring Organizations

1. Produced an inventory of initiatives and their outcomes related to pre-college pipeline efforts (pre-kindergarten through 12th grade) that help prepare students to succeed in college and their careers
2. Identified Pre K-12 initiatives to improve college readiness and going rates
3. Outreach activities that emphasize reading
Embracing a P-20 Philosophy

Identify Existing Barriers and Support Along the Student Pipeline
Student LifecycleBarriers / Problems
Elementary School
Middle School
High School
College/University - Undergraduate
University – Graduate/Professional School
Pre K K 1 2 3 4 5 6 7 8 9 10 1112 - HS Diploma
13 - certificate
14 - AA/AS 15
16 - BS/BA
17 - Grad
18 - MS/MA/MFA/MBA/JD
19 - PhD/MD
20 - PhD/MD
Type of Support

SAMPLE: S&T’s Pre-College Programsby 2008, 26% of S&T’s freshman class attended an on-campus pre-college
program
Summer Programs 1 2 3 4 5 6 7 8 9 10 11 12 College Freshmen
C Camp Invention (1 week)
R Aerospace Camp (4 days)
R Robotics Camp (3 days)
R Missouri Academy for Youth Advancement (MAYA) (1 month)
R It's A Girl Thing! (3 day)
R Summer Solutions (girls) (1 week)
R Summer Research Experience
R Summer Research Academy
R Summer Transportation Instit. (1 month)
R Business Tech Week
R Jackling Introduction to Engineering (1 week)
R Minority Introduction to Technology & Engineering (1 week)
R Nuclear Engineering Camps (1 week)
R C.H.I.P. Camp Computer Highly Interactive Program (4 days)
R Materials Camp (1 week)
R Explosives (1 week)
R Hit the Ground Running (3 weeks)

Retention

Fundamental Student Retention Conclusions
1. Studies indicate that financial aid helps increase persistence for students who need and receive financial aid.
2. Studies indicate that certain student populations such as: Older students, African Americans & Hispanics, Students who work more than 30 hours weekly, and First generation college students have persistence problems
3. Schools can improve retention rates by: accurately determining when and why students withdraw Up-to-date information helps administrators determine better
strategies for increasing retention rates
SOURCE: DANA Center Retention Report, 1998

How well do you truly know your institution and students?
POLL

Average Age: 21.6 years old Gender:
23% Female 77% Male
First Generation College Students: 2005-06: 37%
Residency: Missouri Residents: 76% Out-State Students: 22% International: 2%
Ethnicity: African-American: 4% Asian-American: 3% Caucasian: 83% Hispanic: 2% Native-American: 1% Non-resident, International: 2% Not Disclosed: 5%
From a Community <40,000: 45% approx. Average Family Income: $82,000 Average Indebtedness at Graduation:
$23,500 USD approx. High Financial Need (Pell qualifier): 24% Freshmen with Credit Cards:
24% 6 arrive with over $1000 USD standing
balance Students with PCs:
94% +70% laptops 7% Macs
Students with Cell Phones 97%
Undergraduate demographics and psychographics

56% already considering graduate school 95% plan to join a student organization 54% want to assume a student leadership position 43% would like to study abroad 73% plan to be involved in intramural sports 70% plan to be involved in student design teams 51% plan to join a service or volunteer organization 30% plan to be involved in music and theatre
New Student Interests Fall 2010

Incoming students’ self-identified interests and needs
SOURCE: ACT’s AIM 2008
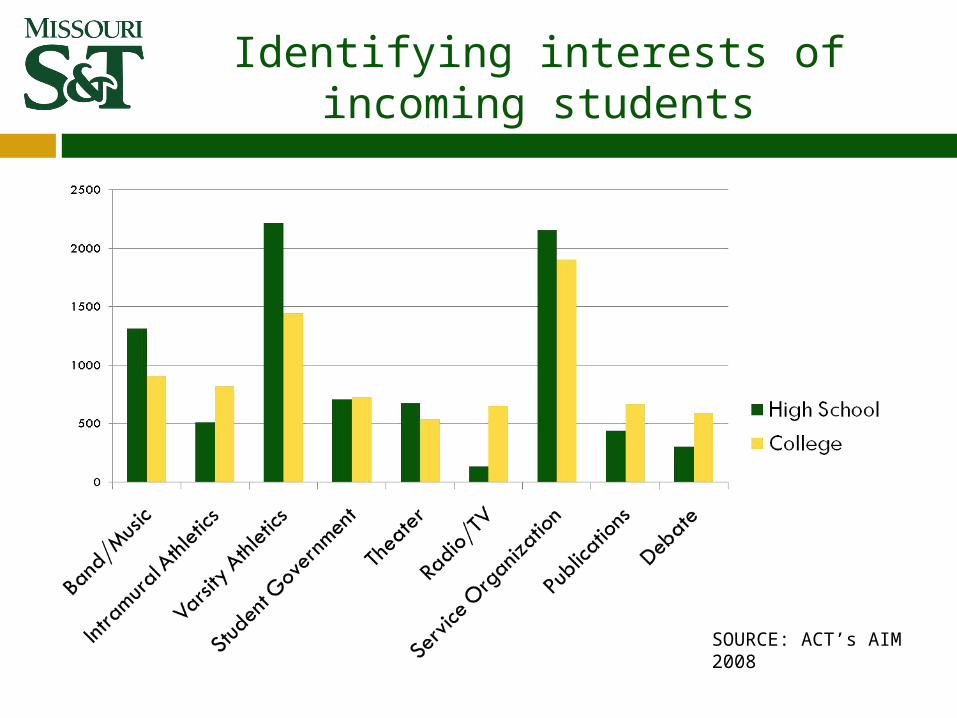
Identifying interests of incoming students
SOURCE: ACT’s AIM 2008

Primary Student Fears
Flunking out of college
Not making friends

Successful Students/Graduates Recommendations for New Students
Go to ClassLearn to Study
Ask for Help/Ask Questions

Income and Attainment

Financial Considerations the Most Common Reason for Leaving College
SOURCE: ELS:2002 “A First Look at the Initial Postsecondary Experiences of the High School Sophomore Class of 2002 (National Center for Education Statistics)

Summary Thoughts

It’s not about the data itself
It’s about identifying, helping frame and satisfying information needs: Understanding what information is needed, why
it is needed and what will be done with it Procuring relevant and timely data Analyzing data quickly and appropriately Packaging information effectively Guiding its use
Concluding data thoughts

No Admission or Enrollment Effort is Successful without QUALITY Academic Programs to Promote
Recruitment and Retention is an On-going, Multi-year PROCESS with Strong Access to Research and DATA
+80% of Enrollments come from REGIONAL student markets for BS/BA degrees
The Most Successful Recruitment Programs Clearly DIFFERENTIATE the Student Experience from Competitor’s Programs
The Most Successful Retention Programs Clearly Address Students’ Needs and Regularly ENGAGE Students in Academic and Non-Academic Programs
Core Data Driven Findings

“We are what we repeatedly do.
Excellence, therefore, is not an act but a habit.”
-Aristotle

futurestudents.mst.edu
Founded 1870 | Rolla, Missouri
Jay W. GoffVice Provost and Dean of Enrollment Management
Missouri University of Science and TechnologyRolla, Missouri, USA
[email protected] today’s presentation:
http://enrollment.mst.edu
Using Data to Plan and Manage Admissions A View from the USA