FUTURE DIRECTIONS FOR FIBER DEEP HFC DEPLOYMENTS … · future directions for fiber deep hfc...
35
FUTURE DIRECTIONS FOR FIBER DEEP HFC DEPLOYMENTS JOHN ULM ZORAN MARICEVIC A CASE STUDY ON HFC TO FTTX MIGRATION STRATEGIES
Transcript of FUTURE DIRECTIONS FOR FIBER DEEP HFC DEPLOYMENTS … · future directions for fiber deep hfc...
FUTUREDIRECTIONSFORFIBERDEEPHFCDEPLOYMENTS
JOHNULMZORANMARICEVIC
ACASESTUDYONHFCTOFTTXMIGRATIONSTRATEGIES

Copyright2016–ARRISEnterprisesLLC.Allrightsreserved. 2
TABLEOFCONTENTSINTRODUCTION.............................................................................................3NETWORKCAPACITY–PLANNINGFORTHENEXTDECADE..........................3Nielsen’sLawandCloonan’sCurves...............................................................................3
SelectiveSubscriberMigrationStrategy.........................................................................5
ACCESSNETWORKCASESTUDY....................................................................9ACCESSNETWORKUPGRADEOPTIONS:COSTIMPACTS.............................16HFCBAUvFTTH–PreviousFindings............................................................................16
CostComparisonofVariousHFCUpgradeOptions......................................................19
DOCSISPay-as-You-GrowStrategy...............................................................................23
CONCLUSION...............................................................................................27ACKNOWLEDGEMENTS...............................................................................28ABBREVIATIONS...........................................................................................29RELATEDREADINGS.....................................................................................32REFERENCES................................................................................................34

Copyright2016–ARRISEnterprisesLLC.Allrightsreserved. 3
INTRODUCTIONTodayingreenfieldscenarios,ithasbecomemorecommonforoperatorstoinstallfiberallthewaytothehomeorMDU(FibertothePremise-FTTP),asitisviewedastheultimateendgamefromaplantperspective.Withtheconstanttideofbroadbandspeedgrowth,operatorsarenowstartingtoconsidertheirHFCtransitiontoFTTPforbrownfieldscenariosaswell.ShouldtheystopinvestinginHFCandjustgorighttoFTTP?Thisisadauntingtaskgiventhecostsinvolved.
Thispaperdetailsacasestudyofseveralactualnodedesignsandexploresthecostimpactsofvariousplantupgrades;fromsimplysplittingnodestotacklebusinessasusualdemands,allthewaytoFTTP.ItalsohighlightssomeemerginginnovativeconceptsforadistributednodearchitecturethatcosteffectivelyenablesFiberDeep(FD)designssuchasFibertotheLastActive(FTTLA)orFibertotheCurb(FTTC).
Thepaperstartswithacomprehensivenetworkcapacityanalysisthatshowswhatcapacitiesmightbeneeded,andatwhattimeoverthecomingdecades.ThisallowsustolayoutanHFCmigrationstrategytoFTTxovera10+yearwindow.ANetPresentValueanalysisshowsthatthismulti-stepapproachismorecosteffectivethandivingheadfirstintoFTTP.Itwillalsoshowthatformanyormostsubscribersontoday’sHFC,FTTPmaynotnecessarilybetheendgame,ratherFTTLAorFTTCmaysuffice.
ThefindingsfromthispaperareimportantinallowingoperatorstoplantheirHFCtofiberjourneyinapayasyougomanner.Acompanionpapertothis[ULM_2016]discussestheenergyimpactstoboththeaccessnetworkandheadendfacilities.
NETWORKCAPACITY–PLANNINGFORTHENEXTDECADETheInternethasbeengrowingatabreakneckspeedsinceitsinception.Andwithit,wehaveseenacorrespondinggrowthindedicatednetworkcapacity.WhileMoore’sLawisinfamousinsiliconrealms,Nielsen’sLawofInternetBandwidthhasbecomerenowninthenetworkingworld.Itbasicallystatesthatnetworkconnectionspeedsforhigh-endhomeuserswouldincrease50%peryear.Thislawhasdrivenmuchofthetrafficengineeringandnetworkcapacityplanningintheserviceproviderworld.Ithasalsoledtomuchresearchonthosetopics.
Nielsen’sLawandCloonan’sCurvesIn[CLOONAN_2014,EMM_2014],thisresearchwasexpandedtoalsoincludetrafficutilizationinadditiontothenetworkconnectionspeed.Inhischartbelow,knownas

Copyright2016–ARRISEnterprisesLLC.Allrightsreserved. 4
Cloonan’sCurves,Nielsen’sLawisrepresentedbythebluelineinthemiddle.Sinceitisalogscale,the50%CompoundedAnnualGrowthRate(CAGR)appearsasastraightline.Aninterestingfactisthatthegraphstartsin1982witha300-baudphonemodem.Wearenowinthefourthdecadeofcloselyfollowingthistrend.
Figure1–Cloonan’sCurves
Cloonannotedthattheprimetimeaveragesubscriberconsumption(a.k.a.Tavg)hasalsobeenfollowingthissamebasictrendasshownintheFigure1.Forserviceproviders,animportantmetricisthetrafficutilizationinaServiceGroup(SG).TheSGtrafficutilizationisafunctionofthenumberofsubscribers(Nsub)timestheaveragebandwidthpersub(Tavg)andisshowninaseriesoflinesaboveNielsen’sline.
IntheearlyDOCSISdays,manynodeswerecombinedtogetherandaSGmightconsistofthousandsofsubscribers.Atthistime,theSGtrafficwasanorderofmagnitudehigherthanthemaximumnetworkconnectionspeed(a.k.a.TmaxaftertheDOCSISparameterthatdictatesmaxnetworkrates).Overtime,theSGsizehasbeenshrinkingandwithittheratiobetweenNsub*TavgtoTmax.Asshowninthechartabove,theSGtrafficeventuallyapproachesthatofTmax.AsSGsizesdipbelow100subs,thenTmaxstartstodominatethetrafficengineering.
Wehavebeenmonitoringsubscriberusageformanyyearsnow.ThechartbelowshowsTavg,theaveragesubscriberdownstreamconsumptionduringpeakbusyhours,foranumberofMSOsoverthelastsixyears.Atthestartof2016,Tavgwasapproximately850Kbps.Overthissixyearperiod,Tavghasgrownat~45%CAGR.Weareexpecting
8000 Subs/SG (Many Nodes)
2000 Subs/SG (Many Nodes)
512 Subs/SG
128 Subs/SG (256 HHP Nodes)
32 Subs/SG (64 HHP Nodes)64 Subs/SG (128 HHP Nodes)
16 Subs/SG (32 HHP Nodes)116 DOCSIS 3.0 Chans.32 DOCSIS 3.0 Chans.
256 Subs/SG (512 HHP Nodes)512 Subs/SG (2x 512 HHP Nodes)
64 DOCSIS 3.0 Chans.
1.2 GHz of DOCSIS 3.1 Chans.
DS BW as a function of time(w/ ~50% Annual Growth Rate)
DS
BW
for M
odem
s (b
ps)
1982 1986 1990 1994 19981
10
100
1k
2002 2006
10k
100k
1M
10M
100M
1G
2010 2014
10G
100G
2018
The Era of
CableModems
The Era of
Dial-Up Modems
2022
D3.0 DS Limit = 4.9 Gbps (750 MHz)
2026 2030
D3.1 DS Limit = 10.8 Gbps (1200 MHz)
1 DOCSIS 3.0 Chan.
4 DOCSIS 3.0 Chans.
16 DOCSIS 3.0 Chans.
~100 kbpsin 2010
Nielsen’s Law’sTmax
Avg BW/SG
300 bpsin 1982
~500 bpsin 1997
~332 Mbpsin 2030
8 DOCSIS 3.0 Chans.
The Eraof3.0
Modems
~150 kbpsin 1997
Avg BW/sub
The Eraof
3.1Modems
Consumption-Oriented Period(Tmax < 1 Ch &Tmax < Avg SGConsumption)
Consumption+ Tmax-
Oriented Period(Tmax =~ Avg SG
Consumption)
Tmax-OrientedPeriod
(Tmax >> Avg SGConsumption)
Avg BW/SG
Max BW/sub
2 DOCSIS 3.0 Chans.
Year
1000 Subs/SG
16000 Subs/SG (Many Nodes)
4000 Subs/SG (Many Nodes)
Avg BW/SG
~100Gbpsin 2030
Proposed Human Factors Formula:
Required SG Capacity =K* Max BW/sub + Num_subs * Avg BW/sub
(K=1 may yield acceptable QoE)
~30Mbpsin 2010
Copyright2016–ARRISEnterprisesLLC.Allrightsreserved. 5
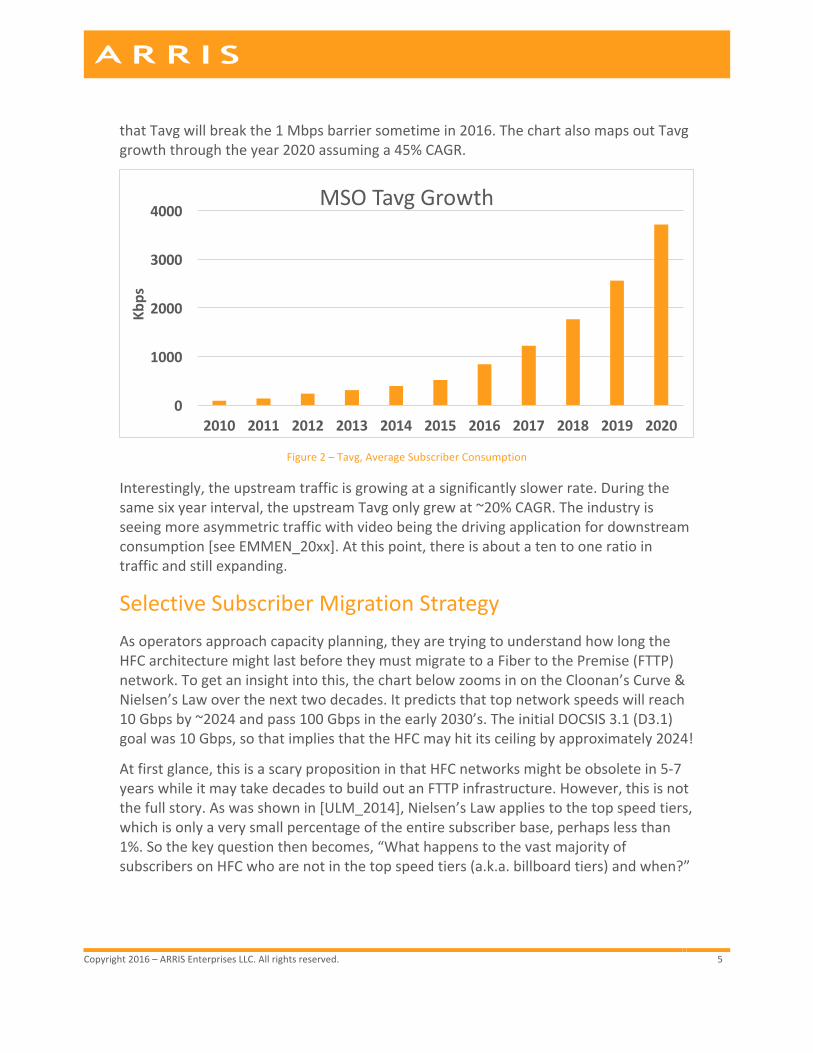
thatTavgwillbreakthe1Mbpsbarriersometimein2016.ThechartalsomapsoutTavggrowththroughtheyear2020assuminga45%CAGR.
Figure2–Tavg,AverageSubscriberConsumption
Interestingly,theupstreamtrafficisgrowingatasignificantlyslowerrate.Duringthesamesixyearinterval,theupstreamTavgonlygrewat~20%CAGR.Theindustryisseeingmoreasymmetrictrafficwithvideobeingthedrivingapplicationfordownstreamconsumption[seeEMMEN_20xx].Atthispoint,thereisaboutatentooneratiointrafficandstillexpanding.
SelectiveSubscriberMigrationStrategyAsoperatorsapproachcapacityplanning,theyaretryingtounderstandhowlongtheHFCarchitecturemightlastbeforetheymustmigratetoaFibertothePremise(FTTP)network.Togetaninsightintothis,thechartbelowzoomsinontheCloonan’sCurve&Nielsen’sLawoverthenexttwodecades.Itpredictsthattopnetworkspeedswillreach10Gbpsby~2024andpass100Gbpsintheearly2030’s.TheinitialDOCSIS3.1(D3.1)goalwas10Gbps,sothatimpliesthattheHFCmayhititsceilingbyapproximately2024!
Atfirstglance,thisisascarypropositioninthatHFCnetworksmightbeobsoletein5-7yearswhileitmaytakedecadestobuildoutanFTTPinfrastructure.However,thisisnotthefullstory.Aswasshownin[ULM_2014],Nielsen’sLawappliestothetopspeedtiers,whichisonlyaverysmallpercentageoftheentiresubscriberbase,perhapslessthan1%.Sothekeyquestionthenbecomes,“WhathappenstothevastmajorityofsubscribersonHFCwhoarenotinthetopspeedtiers(a.k.a.billboardtiers)andwhen?”
0
1000
2000
3000
4000
2010 2011 2012 2013 2014 2015 2016 2017 2018 2019 2020
Kbps
MSOTavgGrowth

Copyright2016–ARRISEnterprisesLLC.Allrightsreserved. 6
Figure3–DownstreamGrowthoverNextTwoDecades
The[ULM_2014]casestudytookalookatservicetierevolutionatafewMSOs.Table1laysoutresultsfromthatstudy.Perhapsthekeyfindingfromthisstudyisthatthedifferentservicetiersaregrowingatdifferentrates.WhilethetopbillboardtiercontinuestofollowNielsen’sLaw50%,eachsubsequentlowerspeedtierisgrowingataslowerrate.Hence,thelowertheservicetierrate,theloweritsCAGR.
Table1–MSOCaseStudyonMultipleServiceTierLevels
2014 Service Tier Levels on HFC % of Subs Tmax (Mbps)
Tmax CAGR
Top Tier – Billboard Rate 1% 300 50%
Performance Tier 14% 75 32%
Basic Tier 65% 25 26%
Economy Tier 20% 5 15%
Figure4mapsoutthevariousservicetiergrowthoverthenexttwodecades.Whilethe1%ofsubsinthetopbillboardtierhit10Gbpsin~2024,the14%ofsubsintheperformancetierdon’thitthatmarkuntil~2032.Noticethat85%ofsubscribersintheflagshipbasictierandeconomytierstaybelowthismarkforseveraldecades.
100
1000
10000
100000
2015
2016
2017
2018
2019
2020
2021
2022
2023
2024
2025
2026
2027
2028
2029
2030
2031
2032
2033
2034
Mbp
s
DownstreamGrowth
Tmax
Tavg
Tmax+Tavg
Hits10GCeilingby2024

Copyright2016–ARRISEnterprisesLLC.Allrightsreserved. 7
Figure4–DownstreamGrowthwithMultipleServiceTiers
DatawasinputintotheARRISNetworkCapacitymodeltotakeacloserlookatthenetworktrafficgrowth.Table2showstheTmaxmigrationusedforeachtierleveloverthenextdecade.Notethatby2021,thetopbillboardtierstartstoexceedthecapacityoftheinitialD3.1modemsthatarebeingusedtoday.Andby2026,thistierisforecasttohit40Gbps.Thiswillrequirenewtechnology,whichmightbeanewergenerationofDOCSIS(e.g.ExtendedSpectrum)orpossiblyanextgenerationofPONtechnology(e.g.100GEPON).
Table2–ServiceTierMigrationforNetworkCapacityModel
MSO Case Study DS Service Tiers
% of Subs
Tmax CAGR 2014 2016 2021 2026
Top Billboard Tier <1% 50% 300 675 5G 40G
Performance Tier 14% 32% 75 125 500 2G
Basic Tier 65% 26% 25 40 150 400
Economy Tier 20% 15% 5 10 20 50
Itisimportanttonotethat99%ofthesubscribersarestillcomfortablyusingtoday’sDOCSIStechnologyonHFCadecadefromnow.
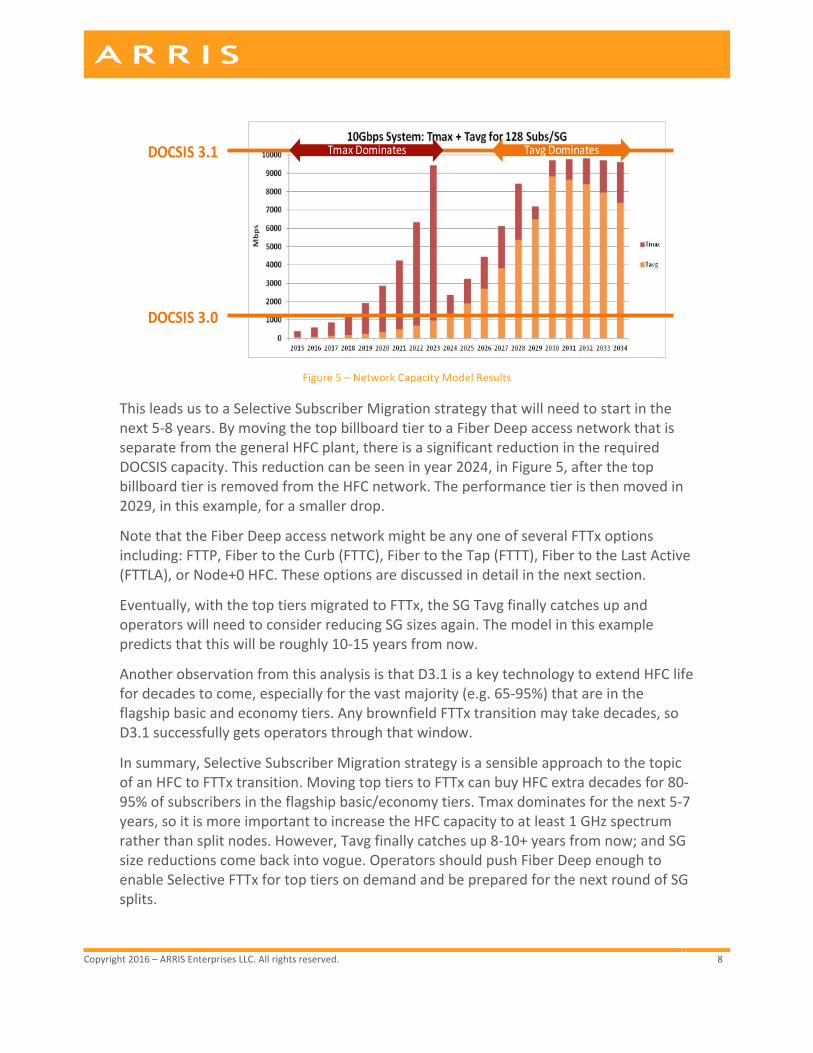
SomeresultsfromtheARRISNetworkCapacitymodelareshowninFigure5.ItprovidesaninsightintobothTmaxandSGTavgbehavior.Duringthenext5-7years,theTmaxcomponentdominatestrafficengineeringasitisdrivenbyNielsen’sLaw.ThebandwidthneededbythetopbillboardtierdominatescomparedtotheSGTavg.
Copyright2016–ARRISEnterprisesLLC.Allrightsreserved. 8
Figure5–NetworkCapacityModelResults
ThisleadsustoaSelectiveSubscriberMigrationstrategythatwillneedtostartinthenext5-8years.BymovingthetopbillboardtiertoaFiberDeepaccessnetworkthatisseparatefromthegeneralHFCplant,thereisasignificantreductionintherequiredDOCSIScapacity.Thisreductioncanbeseeninyear2024,inFigure5,afterthetopbillboardtierisremovedfromtheHFCnetwork.Theperformancetieristhenmovedin2029,inthisexample,forasmallerdrop.
NotethattheFiberDeepaccessnetworkmightbeanyoneofseveralFTTxoptionsincluding:FTTP,FibertotheCurb(FTTC),FibertotheTap(FTTT),FibertotheLastActive(FTTLA),orNode+0HFC.Theseoptionsarediscussedindetailinthenextsection.
Eventually,withthetoptiersmigratedtoFTTx,theSGTavgfinallycatchesupandoperatorswillneedtoconsiderreducingSGsizesagain.Themodelinthisexamplepredictsthatthiswillberoughly10-15yearsfromnow.
AnotherobservationfromthisanalysisisthatD3.1isakeytechnologytoextendHFClifefordecadestocome,especiallyforthevastmajority(e.g.65-95%)thatareintheflagshipbasicandeconomytiers.AnybrownfieldFTTxtransitionmaytakedecades,soD3.1successfullygetsoperatorsthroughthatwindow.
Insummary,SelectiveSubscriberMigrationstrategyisasensibleapproachtothetopicofanHFCtoFTTxtransition.MovingtoptierstoFTTxcanbuyHFCextradecadesfor80-95%ofsubscribersintheflagshipbasic/economytiers.Tmaxdominatesforthenext5-7years,soitismoreimportanttoincreasetheHFCcapacitytoatleast1GHzspectrumratherthansplitnodes.However,Tavgfinallycatchesup8-10+yearsfromnow;andSGsizereductionscomebackintovogue.OperatorsshouldpushFiberDeepenoughtoenableSelectiveFTTxfortoptiersondemandandbepreparedforthenextroundofSGsplits.
DOCSIS3.0
DOCSIS3.1 TmaxDominates TavgDominates

Copyright2016–ARRISEnterprisesLLC.Allrightsreserved. 9
AndwhichFTTxisthebestoptionisanotherinterestingdebate.DOCSIScontinuestoevolvewithworkonFullDuplex(FDX)andExtendedSpectrumDOCSIS.Someofthisresearchwashighlightedin[CLOONAN_2016].ThesenewtechnologiespromisetodoforDOCSIS&cablewhatG.fastisattemptingtodoforDSLandtwistedpair.Figure6showssomeresultsfromthatpaperforbothFTTCandFTTLAsystems.Ascanbeseen,thesystemcapacitycanincreasesignificantlyasfiberispushedclosertothepremise.
Figure6–NetworkCapacityModelResults
ACCESSNETWORKCASESTUDYThenetworkcapacityplanningshowsthatoperatorswillneedtoevolvetheirexistingHybridFiberCoax(HFC)networkstoremaincompetitivewithFTTPserviceproviderssuchasGoogleFiberandVerizonFiOS[VENK_2016,VENK_2015andULM_2015].Forcableoperators,theycanutilizetheirexistingfiberinvestmentsasastartingpointtogetajumpstartcomparedtonewentrantsthatmuststarttheirfiberinstallationfromscratch.Butthecriticalquestionforcableoperatorsishowdeepshouldtheypullthefiber?Theyarepresentedwithatoolboxofarchitecturalchoicestoconsider:
• “Businessasusual”(BAU)–anodesplitwhereneeded,andarefreshoftheHFCfieldactives,withperhapsanupgradeto5-85MHzinthereturnand104-1002MHzintheforward
• FiberDeep(FD)Node+0(N+0)pushesfibermuchdeeperintotheHFCandeliminatesalloftheactiveRFelements.Thereisanarrayofpotentialoptionsincluding:
o TraditionalFiberDeepNode+0“FDN+0”whichredesignsexistingHFC(e.g.N+3toN+6with3-6activesafterthefibernode)into“nodeasthelastactive”.Thetypicalwaytodothisistorewirethecoaxplantinawaytominimizehowmanyofthesestandard-sizenewnodesneedtobeadded.Eachnewnodemayultimatelybecomeitsownservicegroup,andinadditiontotheRFandopticalmodules,itmayhouseRemotePHYDevices(RPDs)andPONOLTs
0
5
10
15
20
25
30
35
0 2 4 6 8
Capa
city[G
bps]
SpectrumSize[GHz]
CapacityinanFTTLAsystem
100ft
150ft
200ft
250ft
400ft
500ft
Dropcablelength
0
50
100
150
200
250
300
0 5 10 15 20 25 30
Throughp
ut(G
bps)
SpectrumSize[GHz]
CapacityinanFTTCSystem
100ft
150ft
200ft
250ft
400ft
500ft
DropcableLength

Copyright2016–ARRISEnterprisesLLC.Allrightsreserved. 10
o Fibertothelastactive(FTTLA)isavariantoftheFiberDeepN+0architecture.However,inthiscasethenodesarelocatedpreciselyatlegacyRFamplocations.Thesenodesthengetaggregatedintoaproperly-sizedservicegroup.Thisaggregationcanbedonebyusingan“activesplitter/combiner”,housedinavirtualhub,whichislocatedpreciselyatthelegacynodelocationtosaveonopticscosts&spaceinthefacility
o Fibertothecurb(FTTC)orFibertothetap(FTTT)wherefiberisrundownthestreetbuttheexistingcabledropcablesarereused
• FibertothePremise(FTTP)–thisiswhatisbeingdeployedtodaywithtraditionalPONsystemsaswellasRFoGsystems
Collectively,thesefiberdeeperoptionsarereferredtoasFTTxorFibertothe“x”,where“x”mightbePremise,Curb,Tap,LastActive,orFiberDeepnode.Forcableoperatorstobuildoutanyoftheabovearchitecturesintoday’sbrownfields,thenewfiberconstructionbeginsfromanexistingfibernode;unlikethenewentrantswhomustbuildthefiberconstructionfromthecentraloffice/headend.
EachMSOwillmakechangestotheirownHFCplanttooptimizefortheattributesthattheydeemtobethemostimportant.DifferentMSOswilllikelyprioritizethemanyattributesindifferentways.Forexample,someMSOsmaychoosetooptimizetheirnetworkevolutionbymovingasrapidlyaspossibletoend-statetechnologiesofthefuture.TheseMSOswilllikelymoverapidlytowards(passiveopticalnetwork)PONorPoint-to-PointEthernetsolutions.OtherMSOswillchoosetooptimizetheirnetworkevolutiontoreduceheadendpowerandrack-spacerequirementsbymovingtowardsFiberDeeparchitectureswithDistributedAccessArchitecturesub-systemsthatremovefunctionalityfromtheheadend.TheseMSOswilllikelydeploy(RemotePHY)RPHYor(RemoteMACPHY)RMACPHYsub-systemswithintheirnodes.OtherMSOswillwanttopreservemuchoftheircurrentarchitectureswhilecapitalizingonimprovedtechnologies.
Inordertocalibrateourconceptualthinkingagainstreality,asetoffivereal-lifeHFCnodeswasidentifiedforevaluation,representingadiversityofimplementations.Thesearerepresentativeoflow,medium,andhighdensities,asmeasuredbyhowmanyhomesarepassedpermileineacharea.Thefivenodeareas,labeledA,B,C,D,&Epossessotherattributesofinterest:milesofhardlinecoaxplant,percentageofaerialplant,numberofRFactives,numberofhomespassedpernode,andHP/mile,asshowninTable3.
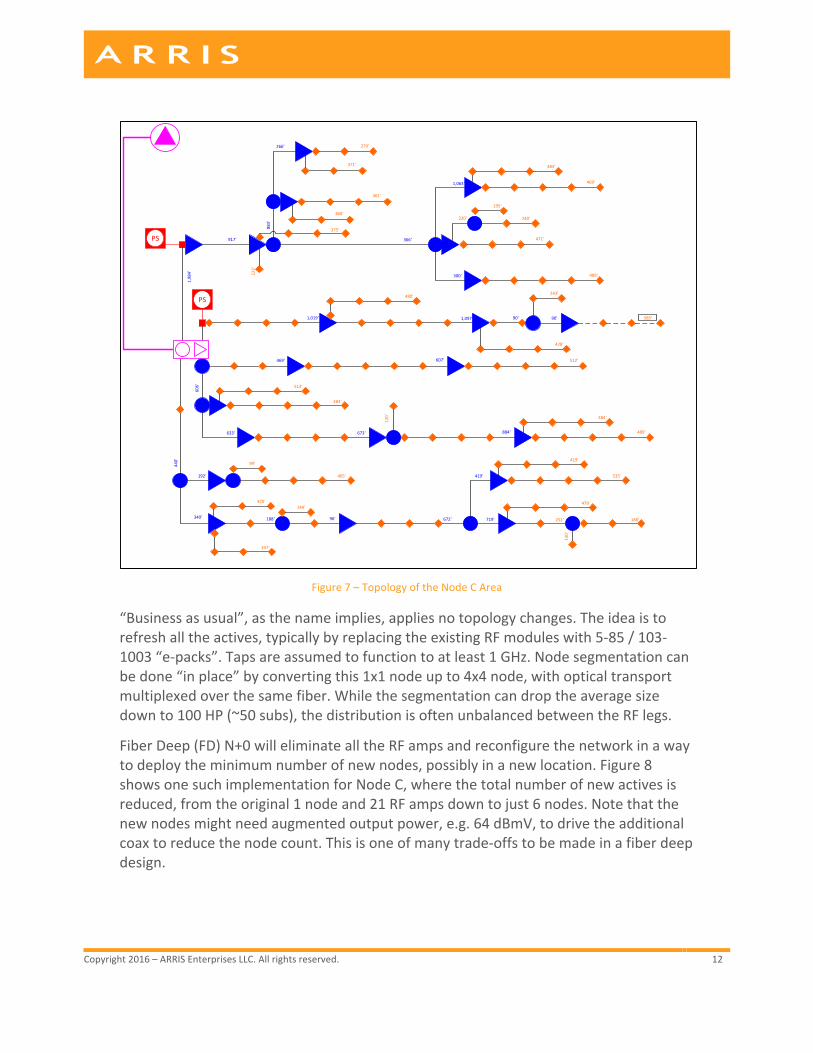
Figure7showsthetopologyofoneofthenodes:NodeC.Theheadend(upperleft)isfiber-linkedtothenode(center-leftinpink),whichRF-feedsintoRFamps(bluetriangles)RFsplitters(bluecircles),andtaps(orangediamonds).Two15Afieldpowersuppliesprovideenoughpowerforthewholenodearea.NodeCcontains3.5milesof

Copyright2016–ARRISEnterprisesLLC.Allrightsreserved. 11
coaxplant(excludingdropcables)with21activesand398HomesPassed(HP).Sothismightrepresent~200subscribers@50%penetration.
NodeCwillbeusedasabaselineexampletoshowhowtheotherarchitecturesmightbeimplemented.
Table3–Propertiesof5NodeAreasUnderStudy
Node A B C D E Overall Average
Plant Coax Mileage 4.2 6.2 3.5 2.5 1.9 18.3 3.7
% Aerial 20% 77% 97% 87% 91% 70% 70%
Total Active 21 30 21 19 14 105 21
Actives/Mile 5.0 4.9 5.9 7.6 7.4 5.7 5.7
Cascade Depth N+3 N+3 N+3 N+3 N+2 N+3
Total Homes Passed 153 352 398 469 520 1892 378
HP/Mile 37 57 112 187 274 104 104
Copyright2016–ARRISEnterprisesLLC.Allrightsreserved. 12
Figure7–TopologyoftheNodeCArea
“Businessasusual”,asthenameimplies,appliesnotopologychanges.Theideaistorefreshalltheactives,typicallybyreplacingtheexistingRFmoduleswith5-85/103-1003“e-packs”.Tapsareassumedtofunctiontoatleast1GHz.Nodesegmentationcanbedone“inplace”byconvertingthis1x1nodeupto4x4node,withopticaltransportmultiplexedoverthesamefiber.Whilethesegmentationcandroptheaveragesizedownto100HP(~50subs),thedistributionisoftenunbalancedbetweentheRFlegs.
FiberDeep(FD)N+0willeliminatealltheRFampsandreconfigurethenetworkinawaytodeploytheminimumnumberofnewnodes,possiblyinanewlocation.Figure8showsonesuchimplementationforNodeC,wherethetotalnumberofnewactivesisreduced,fromtheoriginal1nodeand21RFampsdowntojust6nodes.Notethatthenewnodesmightneedaugmentedoutputpower,e.g.64dBmV,todrivetheadditionalcoaxtoreducethenodecount.Thisisoneofmanytrade-offstobemadeinafiberdeepdesign.
512'607'469'
483'
513'
606'
633' 673'
120'
884' 489'
484'
192' 465'
99'
340'
440'
188' 96' 672' 719' 188'252'
130'
479'
419'
419'
535'
144'470'
337'
1,019' 1,097' 90' 90'
243'
585'
428'
480'
1,984'
917' 366'
1,063' 469'
483'
300' 489'
471'
220'
195'
240'
883'
361'
360'
266' 279'
371'
PS
PS
375'
123'

Copyright2016–ARRISEnterprisesLLC.Allrightsreserved. 13
Figure8–NodeCAreaReconfiguredasFiberDeepN+0
Inadditiontothenewfiberrequiredtofeedthosenodes,thereisaneedtoaddsomecoaxplant,too.Thenewcoaxsegmentsareshowningreen.Asignificantredesignofthetapvaluesandorientationsisrequired,too.However,ifanoperatoralreadyplanstoupgradethetapsto1.2GHzperformance,thentheargumentisthetapreworkmaynotbesoonerousofanextrastep.Theadditionalnewfibertoconnectthenewnodesisthereasonthisapproachiscalled“FiberDeep”.ForFDN+0inNodeC,thissteptakesfibertoascloseas195feettothelasttap,whilethefurthesttapisat1,448feet.Onaverage,tapsare1,007feetawayfromthefiberplant.ThenewnodesarealsocapableofhousingRemotePHYDevices(RPDs)andPONOLTs,ifandwhenneeded.
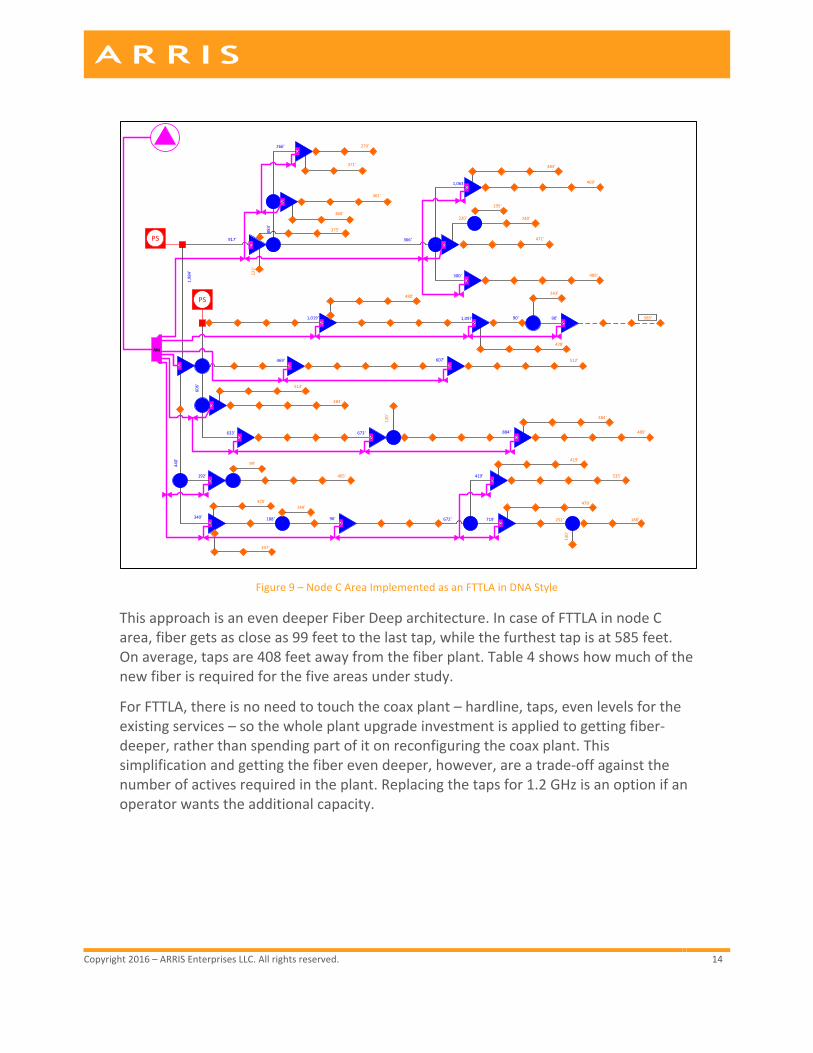
Fibertothelastactive(FTTLA)isalsoanN+0implementation.However,thenumberofactivesisnotminimized.Rather,thelocations(andeventhehousings,ifwarranted)oftheexistingRFactivesarepreserved–andreservedforthelast-activenodes.Figure9showstopologyofsuchanetwork,ifimplementedforNodeC.Thisresultsin21nodesforthisdesignreplacingtheoriginalactives.
131'NewCoax
633' 489'
484'
465'
99'
719' 188'
130'
419'
419'
535'
470'
337'
585'
480'
401'NewCoax
946'NewCoax
PowerOnly
PSPS
123'NewCoaxSS
300'
NewCoax
360'NewCoax
S
S
S816'NewCoax
120'NewCoax
872'NewCoax
240'NewCoax
S
Note:PSLocationdidnotchange
426'NewCoax
S
Copyright2016–ARRISEnterprisesLLC.Allrightsreserved. 14
Figure9–NodeCAreaImplementedasanFTTLAinDNAStyle
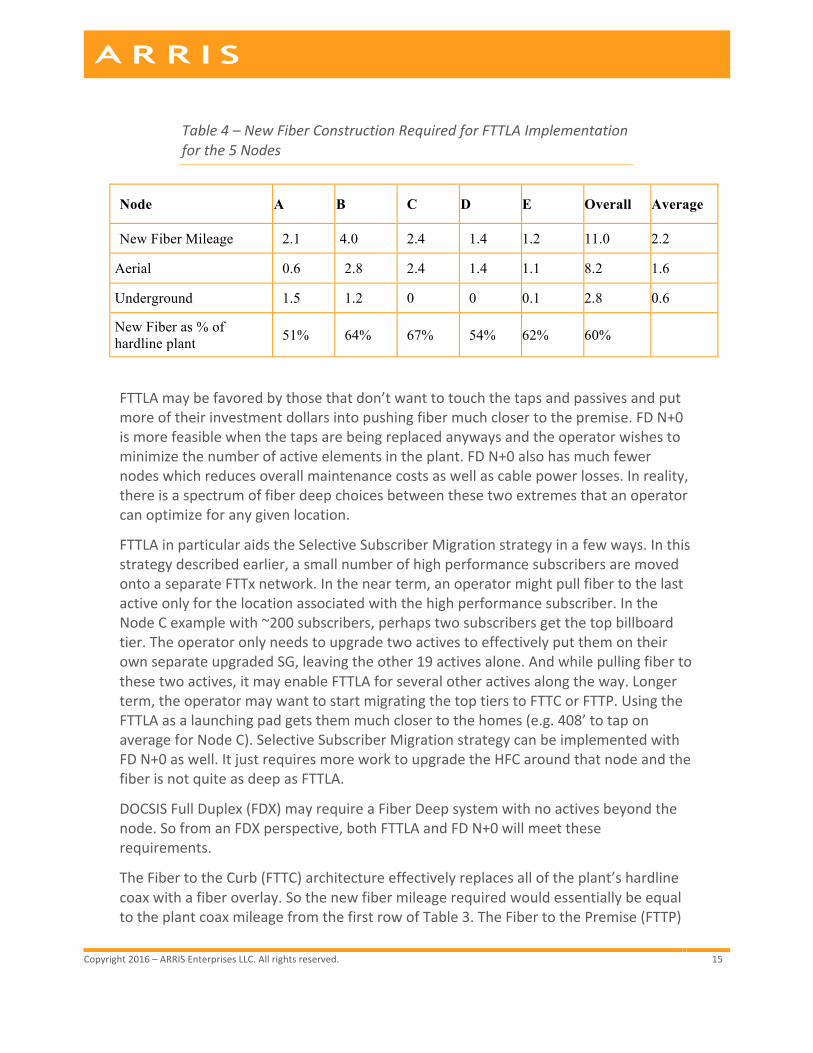
ThisapproachisanevendeeperFiberDeeparchitecture.IncaseofFTTLAinnodeCarea,fibergetsascloseas99feettothelasttap,whilethefurthesttapisat585feet.Onaverage,tapsare408feetawayfromthefiberplant.Table4showshowmuchofthenewfiberisrequiredforthefiveareasunderstudy.
ForFTTLA,thereisnoneedtotouchthecoaxplant–hardline,taps,evenlevelsfortheexistingservices–sothewholeplantupgradeinvestmentisappliedtogettingfiber-deeper,ratherthanspendingpartofitonreconfiguringthecoaxplant.Thissimplificationandgettingthefiberevendeeper,however,areatrade-offagainstthenumberofactivesrequiredintheplant.Replacingthetapsfor1.2GHzisanoptionifanoperatorwantstheadditionalcapacity.
512'607'469'
483'
513'
606'
633' 673'
120'
884' 489'
484'
192' 465'
99'
340'
440'
188' 96' 672' 719' 188'252'
130'
479'
419'
419'
535'
144'470'
337'
1,019' 1,097' 90' 90'
243'
585'
428'
480'
1,984'
917' 366'
1,063' 469'
483'
300' 489'
471'
220'
195'
240'
883'
361'
360'
266' 279'
371'
AM
PS
PS
375'
123'
Copyright2016–ARRISEnterprisesLLC.Allrightsreserved. 15
Table4–NewFiberConstructionRequiredforFTTLAImplementationforthe5Nodes
Node A B C D E Overall Average
New Fiber Mileage 2.1 4.0 2.4 1.4 1.2 11.0 2.2
Aerial 0.6 2.8 2.4 1.4 1.1 8.2 1.6
Underground 1.5 1.2 0 0 0.1 2.8 0.6
New Fiber as % of hardline plant 51% 64% 67% 54% 62% 60%
FTTLAmaybefavoredbythosethatdon’twanttotouchthetapsandpassivesandputmoreoftheirinvestmentdollarsintopushingfibermuchclosertothepremise.FDN+0ismorefeasiblewhenthetapsarebeingreplacedanywaysandtheoperatorwishestominimizethenumberofactiveelementsintheplant.FDN+0alsohasmuchfewernodeswhichreducesoverallmaintenancecostsaswellascablepowerlosses.Inreality,thereisaspectrumoffiberdeepchoicesbetweenthesetwoextremesthatanoperatorcanoptimizeforanygivenlocation.
FTTLAinparticularaidstheSelectiveSubscriberMigrationstrategyinafewways.Inthisstrategydescribedearlier,asmallnumberofhighperformancesubscribersaremovedontoaseparateFTTxnetwork.Inthenearterm,anoperatormightpullfibertothelastactiveonlyforthelocationassociatedwiththehighperformancesubscriber.IntheNodeCexamplewith~200subscribers,perhapstwosubscribersgetthetopbillboardtier.TheoperatoronlyneedstoupgradetwoactivestoeffectivelyputthemontheirownseparateupgradedSG,leavingtheother19activesalone.Andwhilepullingfibertothesetwoactives,itmayenableFTTLAforseveralotheractivesalongtheway.Longerterm,theoperatormaywanttostartmigratingthetoptierstoFTTCorFTTP.UsingtheFTTLAasalaunchingpadgetsthemmuchclosertothehomes(e.g.408’totaponaverageforNodeC).SelectiveSubscriberMigrationstrategycanbeimplementedwithFDN+0aswell.ItjustrequiresmoreworktoupgradetheHFCaroundthatnodeandthefiberisnotquiteasdeepasFTTLA.
DOCSISFullDuplex(FDX)mayrequireaFiberDeepsystemwithnoactivesbeyondthenode.SofromanFDXperspective,bothFTTLAandFDN+0willmeettheserequirements.
TheFibertotheCurb(FTTC)architectureeffectivelyreplacesalloftheplant’shardlinecoaxwithafiberoverlay.SothenewfibermileagerequiredwouldessentiallybeequaltotheplantcoaxmileagefromthefirstrowofTable3.TheFibertothePremise(FTTP)
Copyright2016–ARRISEnterprisesLLC.Allrightsreserved. 16
architecturewouldrequirealloftheFTTCfiberplusthedropcableforeachsubscriber.NopictureisneededasthesesimplyoverlaytheexistingHFCcoaxwithfiber.
ACCESSNETWORKUPGRADEOPTIONS:COSTIMPACTSAswasnotedin[VENK_2015],gettingfiberdeepisajourney,notasingleevent.Venkshowsthatatcurrentplantinvestmentrates,itwilltakeatleastseveraldecadestoachieveFTTPeverywhere.Soitisaslowandsteadyevolution,asopposedtoarevolution.ThisnextsectiontakesalookatthecostimplicationsforthevariousHFCupgradeoptions.ItfirstreviewssomepreviousfindingsoncomparingFTTHdeploymentsvs.“Businessasusual”(BAU),HFCupgrades.Thepaperthenlooksatthecostimpactsforeachupgradeoptionforthefivenodeareasunderstudy.
HFCBAUvFTTH–PreviousFindingsTherehasbeenextensiveanalysisdonepreviouslyin[EMM_2016,EMM_2015]oncomparinginvestmentsintoHFCwithacompleteswitchtoafullFibertotheHome(FTTH)overlayinexistingbrownfieldareas.Thesereportstakealookattheentiresystemcostfromheadendfacilitycosts,toplantinvestments,andincludesthehome/CPEinvestmentsaswell.
Twoseparatebusinessmodelsarediscussedtooffer1Gservicesacrosstheoperator’sfootprint.Thefirstapproachisknownassystemwideandthesecondisknownassuccessbasedbuilds.Thesystemwideapproachisusedforgreenfieldbuildsandmayalsobeusedforbrownfieldoverbuilds.Itskeyadvantageisthatitofferstheservicesacrossanoperator’sentirefootprint.Ifanycustomercallstogettheservice,itcanbeturnedonrapidly.Thisrequiresthattheoperatorbuildoutenoughoftheplanttoenablethisservice.Thisisknownastheenablementcosts.Oncethecustomercallstoobtaintheservice,thereareadditionalcostssuchasthetruckroll,CPEcosts,andthefiberdropinstallationforFTTH.Thesearereferredtoassuccess-basedcosts.
Forthesuccessbasedapproach,noenablementcostsareincurredinadvance.Itisonlyoncethecustomerorderstheservicethattheplantisbuiltoutandtheothersuccess-basedcostsareshouldered.Thekeybenefithereisthatitsavestheoperatortremendousupfrontinvestment,butitnowrequiresapotentiallylengthyperiodtoinstallandactivateservices.Thisismoreeffectivewhenthepenetrationrateontheseservicesareverylow.
DescribedlaterinthispaperisamiddlegroundapproachthatcanbereachedonthesetwobusinessmodelsusingfiberdeeptechnologysuchasFDN+0orFTTLA.FiberdeepHFCisasystemwideapproachforofferingsymmetricgigabitserviceswithoutthetotal

Copyright2016–ARRISEnterprisesLLC.Allrightsreserved. 17
costofFTTP.Butitalsoenablesasuccess-basedFTTPapproachsincethefiberispulledmuchclosertoeveryhomes(e.g.lessthan1000’).Sointhissense,itbecomesablendofthetwoapproachesdescribedbyEmmendorfer.
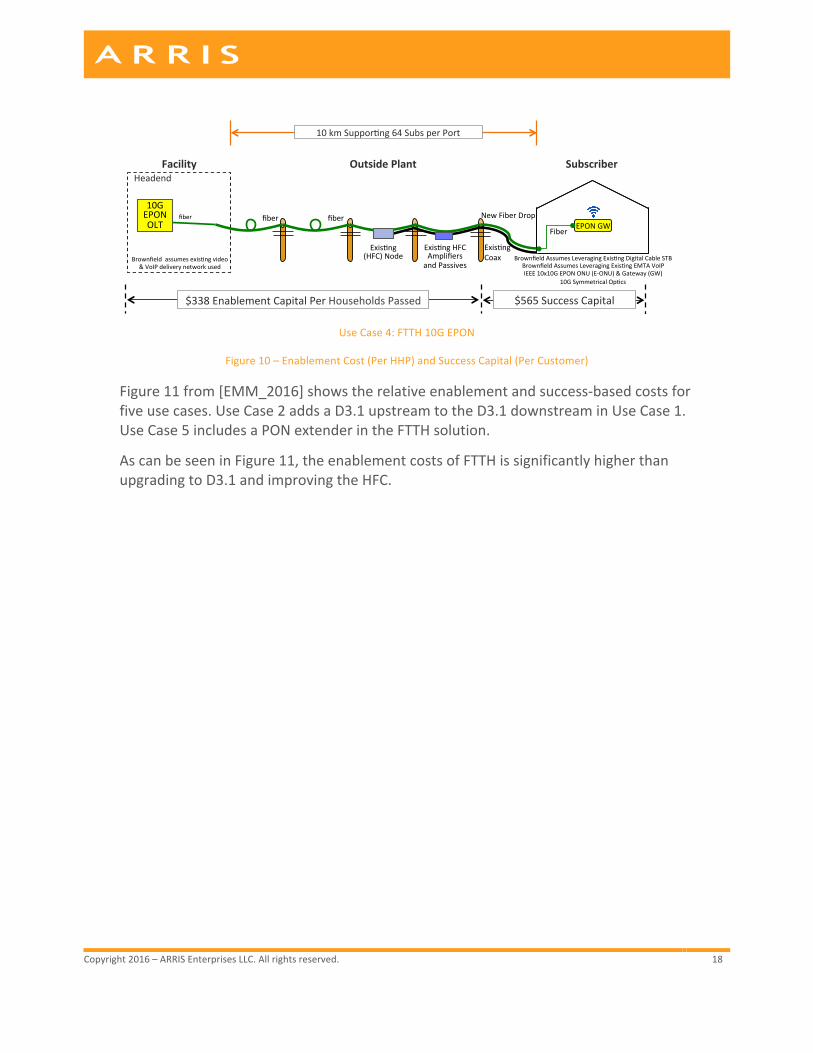
Figure10showsthreedifferentusecasesfrom[EMM2016].Usecases1and2areasimpleupgradetoDOCSIS3.1intheCMTS/CCAPplatform.Thisonlyimpactstheheadendfacilitytoenable1GservicesacrosstheentireHFCfootprint.TheD3.1upgradeistheenablementcosts.ThesuccesscapitalincludesthecostoftheD3.1modemalongwithatruckrolltoinstallit.
UseCase3inFigure10upgradestheHFCinadditiontotheD3.1CMTS/CCAPupgrade.TheHFCisupgradedto1002/85MHz.Thenodeisalsosplitandasmallamountoffiberisalsoinstalled.Theenablementcostsriseaccordinglywhilethesuccessbasedcapitalremainsunchanged.
UseCase4looksata10GEPONFTTHsolution.TheenablementcostsincludetheOLTinthefacilityalongwiththecostofbuildingoutfibertoeveryneighborhood.Thefibercostsdominate.Thefiberisnowcloseenoughtothehometoallowatimelyinstallationonceacustomerorderstheservice.Thesuccess-basedcapitalismoreexpensiveforthisapproachasitalsoincludestheinstallationofthefiberdropcabletothehome.
UseCase1and2:HFC2GDOCSIS
UseCase3:HFCMid-split2Gx500MDOCSIS
$40EnablementCapitalPerHouseholdsPassed $235SuccessCapital
fiber coax
HybridFiberCoax(HFC)Node
HFCAmplifiersandPassives
CoaxDrop
Telephone
fiber
Headend
coax
DOCSISCMTS
OpKcalTransport
coax
OutsidePlantFacility Subscriber
BrownfieldassumesexisKngvideodeliverynetworkused
EMTAGW
EmbeddedMulKmediaTerminalAdapter(EMTA)&Gateway(GW)BrownfieldAssumesLeveragingExisKngDigitalCableSTB
DOCSIS3.032x8
$145EnablementCapitalPerHouseholdsPassed $235SuccessCapital
fiber coax
HybridFiberCoax(HFC)Node
HFCAmplifiersandPassives
fiber
Headend
DOCSISCMTS
OpKcalTransport
coax
OutsidePlantFacility Subscriber
BrownfieldassumesexisKngvideodeliverynetworkused
CoaxDrop
EmbeddedMulKmediaTerminalAdapter(EMTA)&Gateway(GW)BrownfieldAssumesLeveragingExisKngDigitalCableSTB
DOCSIS3.032x8andDOCSIS3.1DS2x192MHzandUS2x96MHz
Telephone
coaxEMTAGW
Copyright2016–ARRISEnterprisesLLC.Allrightsreserved. 18
UseCase4:FTTH10GEPON
Figure10–EnablementCost(PerHHP)andSuccessCapital(PerCustomer)
Figure11from[EMM_2016]showstherelativeenablementandsuccess-basedcostsforfiveusecases.UseCase2addsaD3.1upstreamtotheD3.1downstreaminUseCase1.UseCase5includesaPONextenderintheFTTHsolution.
AscanbeseeninFigure11,theenablementcostsofFTTHissignificantlyhigherthanupgradingtoD3.1andimprovingtheHFC.
$338EnablementCapitalPerHouseholdsPassed $565SuccessCapital
fiber NewFiberDropfiber
Headend
10GEPONOLT
OutsidePlantFacility Subscriber
fiber
ExisHng(HFC)Node
ExisHngHFCAmplifiersandPassives
ExisHngCoaxBrownfieldassumesexisHngvideo
&VoIPdeliverynetworkused
EPONGWFiber
10GSymmetricalOpHcs
BrownfieldAssumesLeveragingExisHngEMTAVoIPBrownfieldAssumesLeveragingExisHngDigitalCableSTB
IEEE10x10GEPONONU(E-ONU)&Gateway(GW)
10kmSupporHng64SubsperPort

Copyright2016–ARRISEnterprisesLLC.Allrightsreserved. 19
EnablementCapitalComposition(PerHHP)
SuccessCapitalComposition(PerCustomer)
Figure11–CostComparison:EnablementandSuccessBased
CostComparisonofVariousHFCUpgradeOptionsHFCplantsvarysignificantly.Notonlydotheyvaryoperatortooperator,buttheircharacteristicscanvarydramaticallyfromnodetonodewithinthesamecommunity.Thecostanalysisin[EMM_2016]wasdoneononeparticularsamplenodewhosecharacteristicsaredescribedinthatpaper,andforonetypeofHFCupgrade.
OneofthekeyconsiderationsforthispaperwastoinvestigatetheimpactofthesevariousHFCarchitectureupgradesacrossaverywidespectrumofnodes.AswasshowninTable3,thefivenodesunderstudyvariedfromaveryrural37HP/miletoaverydenseurbansettingof274HP/mile.Thiscandramaticallyimpactthecostofupgrades.
$-
$100.00
$200.00
$300.00
$400.00
$500.00
$600.00
UseCase1:HFC2GDOCSIS
UseCase2:HFC2Gx200MDOCSIS
UseCase3:HFCMid-split2Gx500M
DOCSIS
UseCase4:FTTH10GEPON
UseCase5:FTTH10GEPON+PON
Extender
OSPLabor
OSPMaterials
OSPEquipment
FacilityLabor
FacilityEquipment
$-
$100.00
$200.00
$300.00
$400.00
$500.00
$600.00
UseCase1:HFC2GDOCSIS
UseCase2:HFC2Gx200MDOCSIS
UseCase3:HFCMid-split2Gx500M
DOCSIS
UseCase4:FTTH10GEPON
UseCase5:FTTH10GEPON+PON
Extender
DropLabor
DropMaterials
In-homeLabor
In-homeEquipment

Copyright2016–ARRISEnterprisesLLC.Allrightsreserved. 20
Inthissection,thefocusisonanalyzingvariousHFCupgradeoptionsforthefivenodesunderstudy.Ittakesalookatthefollowingupgradescenarios:
1. UpgradingHFCactivesto1002/85MHzwithouttouchingthetapsandpassives2. UpgradingHFCactives,tapsandpassivesto1218/85MHz3. UpgradingHFCactivesto1002/85MHz;add2nd&3rdnode;don’ttouch
taps/passives4. UpgradingHFCactives,tapsandpassivesto1218/85MHz;add2nd&3rdnode5. UpgradingHFCtoFTTLAwithouttouchingthetapsandpassives6. UpgradingHFCtoFTTLAwithnewtaps/passives
Figure12showstherelativecostsforthesesixscenarios.Foreachscenario,itshowstherangeofcostsacrossthefivenodesunderstudyalongwiththeaveragecostsacrossthefivenodes.
Figure12–RelativeCostperMileforVariousHFCUpgradeOptions
Relativecostsareusedsincelaborisasignificantcostvariableandvariestremendouslyfromlocationtolocation.Theaveragecostforscenario1wasarbitrarilychosentoequal100.Tonosurprise,theaveragecostsincreaseasfiberispusheddeeperintothenetwork.Andascanbeseenfromscenarios2,4,and6,touchingthetapsnotonlyaddsadditionalexpense,butthevariabilityincreasessignificantlyaswell.
ForFTTLAinFigure12,thefiberinstallationcostsaresignificantandpulledoutseparately.The“FTTLA,noTaps/Fiber”andthe“FTTLA+Taps,noFiber”includeseverythingexceptanycostsassociatedwiththefiberinstallation.TheFTTLAfiber
0
100
200
300
400
500
600
1GHzonly 1.2GHz+Taps
1GHz+3*N 1.2GHz+3*N
FTTLA,noTaps/Fiber
FTTLA+Taps,noFiber
FTTLAFiberOnly
Relativ
eCo
st/Mile
HFCUpgradeOptions
Min Max Avg

Copyright2016–ARRISEnterprisesLLC.Allrightsreserved. 21
installationcostsareshownseparatelyontherightinFigure12.Thefiberinstallationcostsvarydramaticallyonwhethertheplantisaerialorunderground.Inthisstudy,theundergroundfiberinstallationcostswerealmost8Xthatofaerial.Separatingthefiberinstallationcomponentwilllettheoperatormoreeasilyapplytheseresultstotheirownscenarios.
Theupgradecostsarenottheonlystoryhere.Asfiberispulleddeeperandmorenodesareinstalled,theoverallsystemcapacityisincreasing.Thetotalsystemcapacityisafunctionofboththenumberofnodes(i.e.potentialDOCSISSG)andthecapacityofeachlink.Figure13showsboththeaverageplantupgradecostsandthetotalsystemcapacityforeachscenario.Inthisfigure,theFTTLAscenariosincludetheassociatedfiberinstallationcosts.
Figure13–RelativeCostandCapacityforVariousHFCUpgradeOptions
Figure13alsoincludesaFTTPscenariowith10GEPON.Thisrepresentstheexpectedaveragecostofinstallingthefiber.ThisdoesnotincludeOLTorONUcostsandtheirinstallation.NotethatthetotalsystemcapacityforFTTLAwithupdatedtapsisidenticalto10GEPON.Bothofferidenticallinkcapacityof~8.6Gbpsandprovideforabout30to60homespassedperservinggroup.
FiberinstallationisalargevariableincomparingthesevariousFiberDeepapproaches.Foreachnodeinthecasestudy,howmuchfiberneedstobeinstalledforFTTLA,FTTC,andFTTHsystemswasanalyzed.ThisisshowninFigure14.TheFTTCandFTTPshowtheincrementaladditionalfiberrequired.
0
2
4
6
8
10
12
1GHzonly 1.2GHz+Taps
1GHz+3*N 1.2GHz+3*N FTTLA,noTaps
FTTLA+Taps FTTP-10GEPON
Relativ
eto
1GH
zUpgrade
HFCUpgradeOptions-CostandDownstreamCapacity
AvgPlantCosts TotalSystemCapacity
Copyright2016–ARRISEnterprisesLLC.Allrightsreserved. 22
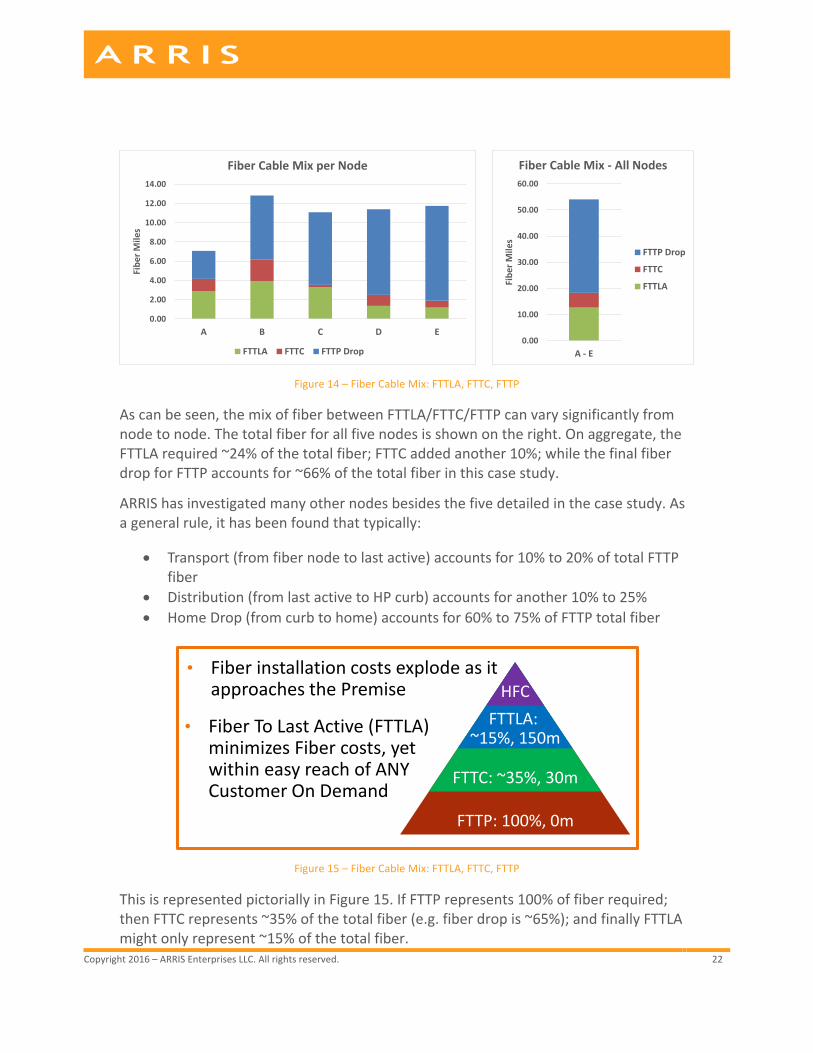
Figure14–FiberCableMix:FTTLA,FTTC,FTTP
Ascanbeseen,themixoffiberbetweenFTTLA/FTTC/FTTPcanvarysignificantlyfromnodetonode.Thetotalfiberforallfivenodesisshownontheright.Onaggregate,theFTTLArequired~24%ofthetotalfiber;FTTCaddedanother10%;whilethefinalfiberdropforFTTPaccountsfor~66%ofthetotalfiberinthiscasestudy.
ARRIShasinvestigatedmanyothernodesbesidesthefivedetailedinthecasestudy.Asageneralrule,ithasbeenfoundthattypically:
• Transport(fromfibernodetolastactive)accountsfor10%to20%oftotalFTTPfiber
• Distribution(fromlastactivetoHPcurb)accountsforanother10%to25%• HomeDrop(fromcurbtohome)accountsfor60%to75%ofFTTPtotalfiber
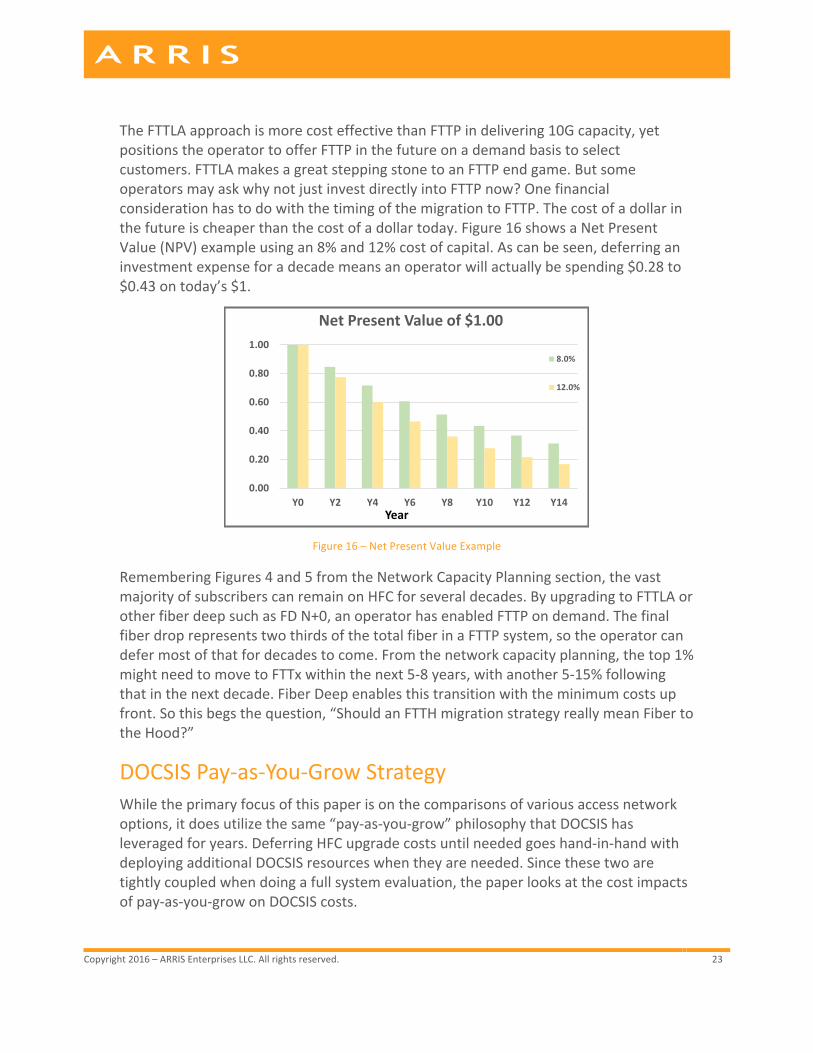
Figure15–FiberCableMix:FTTLA,FTTC,FTTP
ThisisrepresentedpictoriallyinFigure15.IfFTTPrepresents100%offiberrequired;thenFTTCrepresents~35%ofthetotalfiber(e.g.fiberdropis~65%);andfinallyFTTLAmightonlyrepresent~15%ofthetotalfiber.
0.00
2.00
4.00
6.00
8.00
10.00
12.00
14.00
A B C D E
Fibe
rMiles
FiberCableMixperNode
FTTLA FTTC FTTPDrop0.00
10.00
20.00
30.00
40.00
50.00
60.00
A-E
Fibe
rMiles
FiberCableMix- AllNodes
FTTPDrop
FTTC
FTTLA
• FiberinstallationcostsexplodeasitapproachesthePremise
FTTP:100%,0m
FTTC:~35%,30m
FTTLA:~15%,150m
HFC
• FiberToLastActive(FTTLA)minimizesFibercosts,yetwithineasyreachofANYCustomerOnDemand
Copyright2016–ARRISEnterprisesLLC.Allrightsreserved. 23
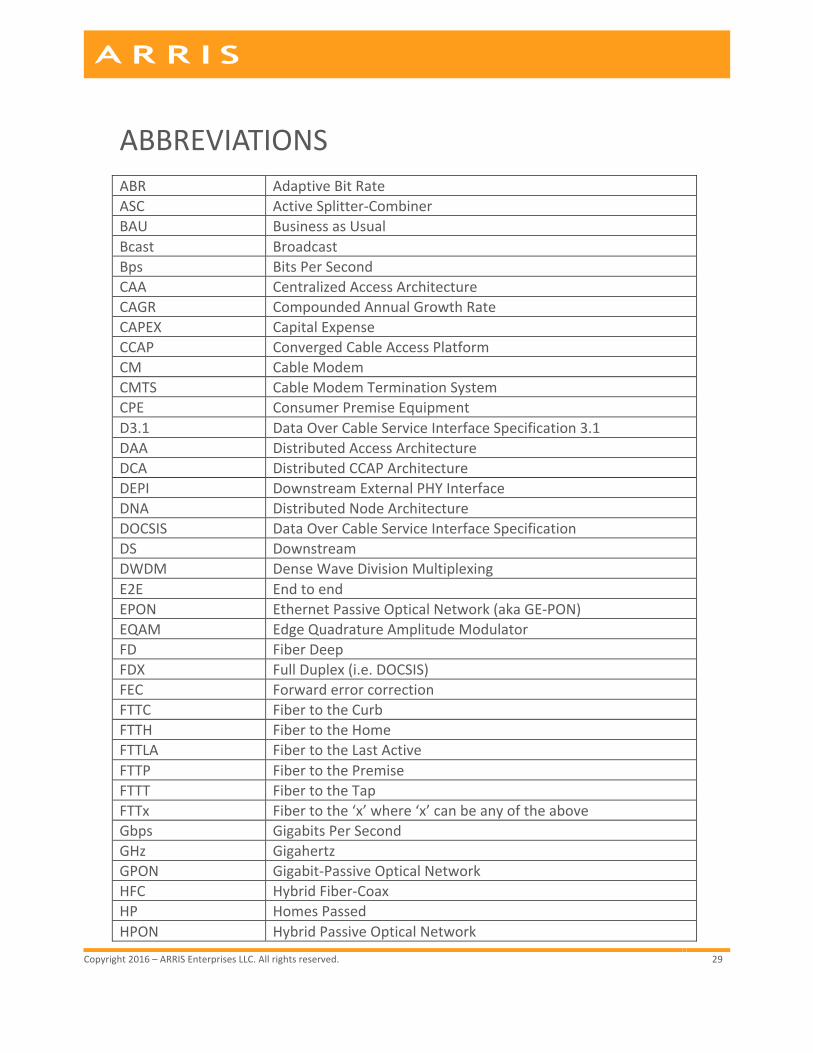
TheFTTLAapproachismorecosteffectivethanFTTPindelivering10Gcapacity,yetpositionstheoperatortoofferFTTPinthefutureonademandbasistoselectcustomers.FTTLAmakesagreatsteppingstonetoanFTTPendgame.ButsomeoperatorsmayaskwhynotjustinvestdirectlyintoFTTPnow?OnefinancialconsiderationhastodowiththetimingofthemigrationtoFTTP.Thecostofadollarinthefutureischeaperthanthecostofadollartoday.Figure16showsaNetPresentValue(NPV)exampleusingan8%and12%costofcapital.Ascanbeseen,deferringaninvestmentexpenseforadecademeansanoperatorwillactuallybespending$0.28to$0.43ontoday’s$1.
Figure16–NetPresentValueExample
RememberingFigures4and5fromtheNetworkCapacityPlanningsection,thevastmajorityofsubscriberscanremainonHFCforseveraldecades.ByupgradingtoFTTLAorotherfiberdeepsuchasFDN+0,anoperatorhasenabledFTTPondemand.ThefinalfiberdroprepresentstwothirdsofthetotalfiberinaFTTPsystem,sotheoperatorcandefermostofthatfordecadestocome.Fromthenetworkcapacityplanning,thetop1%mightneedtomovetoFTTxwithinthenext5-8years,withanother5-15%followingthatinthenextdecade.FiberDeepenablesthistransitionwiththeminimumcostsupfront.Sothisbegsthequestion,“ShouldanFTTHmigrationstrategyreallymeanFibertotheHood?”
DOCSISPay-as-You-GrowStrategyWhiletheprimaryfocusofthispaperisonthecomparisonsofvariousaccessnetworkoptions,itdoesutilizethesame“pay-as-you-grow”philosophythatDOCSIShasleveragedforyears.DeferringHFCupgradecostsuntilneededgoeshand-in-handwithdeployingadditionalDOCSISresourceswhentheyareneeded.Sincethesetwoaretightlycoupledwhendoingafullsystemevaluation,thepaperlooksatthecostimpactsofpay-as-you-growonDOCSIScosts.
0.00
0.20
0.40
0.60
0.80
1.00
Y0 Y2 Y4 Y6 Y8 Y10 Y12 Y14Year
NetPresentValueof$1.00
8.0%
12.0%

Copyright2016–ARRISEnterprisesLLC.Allrightsreserved. 24
ThisphilosophyreallytookholdwiththeadventofDOCSIS3.0andchannelbonding.DOCSIShasembracedapay-as-you-growmentalitysincethen.Itbasicallysaystoinstallenoughcapacitynowtosatisfycustomerrequirements;thengrowcapacitylaterleveragingnewertechnologyandinnovations.Somefactorsthatallowthisworkinclude:
• Minimizeinitialup-frontinvestments• Addadditionalcapacityonlywhenandasmuchasyouneed• Takeadvantageofreducingcostsovertime
Figure17providesahistoricalperspectiveonCMTS/CCAPcostsoverthelastdecade.ThisisfromdatathathasbeencollectedovertheyearsbyInfonetics[IHS_2010-16].ThechartontheleftshowsCMTSrevenueperdownstreamchanneloverthelastdecade.Itisshownonalogscalebecauseofthemagnitudeandalsotoshowtheconsistentdecreaseinprices.
Figure17–CMTS/CCAPCosts–HistoricalPerspective
ThechartontherightinFigure17zoomsinonthelast5yearsandshowsseveralproductsincluding:CMTS,CCAP,EQAM,andCMC.TherevenueperdownstreamDOCSISchannelhasdropped~25%peryearoverlast5years.Thisisdownfrom~32%peryearforprevious5years.EventherelativelymatureEQAMmarkethasdropped~13%peryearoverlast5years.
WillDOCSISrevenueperdownstreamchannelcontinuetodecline?Asanystockbrokerwilltellyou,itisimpossibletopredictfuturepricesbasedonpastperformances.Togetahandleonthisitisimportanttoconsider:IsDOCSIStechnologymaturingorisitinnovating?Ifitismaturing,thentherateofdeclinemayslow.Ifitisinnovating,thennewtechnologiescanfuelfurtherdecreases.LookingatrecentDOCSIStechnologies,DOCSIS3.1isnowenteringitsproductionphaseandwilldramaticallyincreaseDOCSIScapacityfrom1Gbpsto10Gbps.
Additionally,therearealotofotherinnovationsgoingonintheDOCSISworld.NewdistributedarchitecturessuchasRemotePHY,RemoteMACPHY,andRemoteCCAParebringingnewsolutionsandnewcompetitorstotheDOCSISworld.Thereisasignificant
$100
$1,000
$10,000
CY05 CY07 CY09 CY11 CY13 CY15
CMTSRevenueperDownstreamChannel-10yrView
$0
$200
$400
$600
$800
$1,000
$1,200
CY11 CY12 CY13 CY14 CY15
RevenueperDownstreamChannel- 5yearview
CMTS CCAP CMC EdgeQAM

Copyright2016–ARRISEnterprisesLLC.Allrightsreserved. 25
effortatCableLabstofinalizetheDOCSISFull-duplexspecification.ThisissignificantasitenablessymmetricGbpsservices.ItalsorequiresanN+0/FTTLAplantforoperation.Andwithfiberpushingdeeper,DOCSISwillalsoseespectrumextendedasdescribedin[CLOONAN_2016].FTTLAcouldenable25GbpsDOCSISsystemswhileFTTCmightenable100Gbpsorhigher.
Finally,muchindustryworkisgoingintoSoftwareDefinedNetworks(SDN)andNetworkFunctionVirtualization(NFV).ThiswillhelpdrivethevirtualizationofDOCSISplatforms.
DOCSIShasseenmoreinnovationinlastcoupleyearsthanprevioustwodecadescombined.ThisshouldhelpcontinuethedownwardpressureonDOCSIScosts.
So,whatisthecostimpactofthispay-as-you-growphilosophy?Toanalyzethis,ahypotheticalcaseisconsideredthatstartswith16-bonded3.0channelsinYear0.TheDOCSIScapacityisthenroughlydoubledeveryotheryeartokeepupwithnetworktrafficgrowthasdescribedearlierinthispaper.Attheendof8years,theDOCSISsystemhasreached32-bonded3.0channelswith4x192MHzOFDMchannels.Thisrepresentsadatarateof~8.6Gbpswhichispracticallyidenticalto10GEPON.ThiscapacitygrowthisshowninFigure18.Thecapacityhasgrownbyafactorof14overthe8years.
Figure18–DOCSISCapacityMigrationExample
AscanbeseeninFigure18,mostofthenetworkcapacityisaddedinlateryears.SomemaysaythatthetotalDOCSIScostswillendupbeing14timestheYear0costsusingtoday’sDOCSISprices.Let’stakealookattheimpactoncostperbitofdelayingthosecapacitypurchases.Thisisvastlydifferentthan10GEPONwheretheentirecapacitymustbepurchasedupfront.
Therearetwoimportantfactorsthatwillaffecttheoverallcost.ThesearethecontinuingdeclineofCMTS/CCAPpricesandtheeffectofNPV.TheseareshowninFigure19.
0
2000
4000
6000
8000
10000
Y0 Y2 Y4 Y6 Y8
Mbp
s
Year
DOCSISCapacityoverTime

Copyright2016–ARRISEnterprisesLLC.Allrightsreserved. 26
Figure19–DOCSISChannelCosts,NPVOveran8YearPeriod
ForfutureDOCSIScosts,arangeofvaluesareconsidered.Ononeend,acontinuationofthe25%peryeardeclineisassumed.Ontheotherend,aslowingto15%peryearisused,similartowhathasbeenexperiencedintheEQAMmarket.ThisisshownontheleftofFigure18.NotethatbyYear8whenthelargestamountofDOCSIScapacityisadded,DOCSISChannelcostsareprojectedtobe10%to27%oftheoriginalYear0costs.
TherighthandsideofFigure19showsthecostimpactofNPVfor8%and12%costofcapital.NotethatbyYear8,theNPVisbetween$0.36and$0.51ontoday’s$1.BothofthesefactorsworktogethertoreducethecostperbitofDOCSIS.ThiscausestherelativecostperDOCSISbittofallasshownontherightinFigure20.Onecaselooksat15%ayearDOCSISpricedeclineswith8%costofcapitalwhiletheothercaseuses25%ayearand12%respectively.ByYear8,therelativecostperDOCSISbitintoday’sdollarshasfallentosomewherebetween4%and14%oftheoriginalcostforthelargestpurchasesofDOCSISresources.
Figure20–DOCSISWeightedCostperBit
TheweightedaverageoftheDOCSISinvestmentsovertheentireeightyearperiodisshownontheleftinFigure20.Theinitialinvestmentof16DOCSISchannelsinYear0isusedasabaselineandassignedavalueof100.IftheentireDOCSIScapacityis
0.0%
20.0%
40.0%
60.0%
80.0%
100.0%
Y0 Y2 Y4 Y6 Y8Year
DSDOCSISChannelCostsoverTime
15.0%
25.0%
0.00
0.20
0.40
0.60
0.80
1.00
Y0 Y2 Y4 Y6 Y8Year
NetPresentValueof$1.00
8.0%
12.0%
0.0%
20.0%
40.0%
60.0%
80.0%
100.0%
Y0 Y2 Y4 Y6 Y8Year
RelativeCostperBit
15%/8%
25%/12%
100
1,435
643
395
0
250
500
750
1000
1250
1500
TotalInvestmentFactoringCostDeclines&NPV
Initial=100
0%/0%
15%/8%
25%/12%

Copyright2016–ARRISEnterprisesLLC.Allrightsreserved. 27
purchasedupfrontinYear0,itwouldcostmorethan14Xtheinitialinvestment.However,factoringdownstreamchannelcostreductionsandNPVreducestotalinvestmentfor8.6Gbpstotherangeof4xto6.4xtheinitialinvestment.
Thisshowsthebenefitsofpay-as-you-growoverinitialupfrontinvestmentofthefullcapacity.Somefolkswillarguethatthecostperbitismuchlessfortechnologylike10GEPON.Therearesomecaveatswiththislineofthought.Inreality,costperbitisactuallycostperbandwidthorcapacity.
Let’stakealookatthevalidityofthismetric.Fromautilizationperspective,itwasnotedthatresidentialsubscribersarebarelyconsuming1Mbpsonaverageasdiscussedearlierinthispaper.Fora32subGPONsystem,thisis~1%utilization,whilea64sub10GEPONisbeingutilizedlessthanone-halfof1%!So,isthisavalidmetricif99%+ofbitsaregoingunused?!
Whataboutpeakspeeds?Streamingvideoisthedominantresidentialapplicationtoday.AdaptiveBitRate(ABR)protocolsoperateoptimallywhengiven2-3Xaveragevideorate.Sothedominantapplication,evenwith4KUHDstreams,caneasilyhandleacoupleUHDstreamswitha100Mbpsservicetier.Theneedforwidespread2.5Gor10Gburstratesarestillonthehorizon.
WhileCostperBitisaninterestingdatapoint,oneshouldnotusethisinisolation.AlsoconsiderTotalCostofOperation(TCO)andcostpersubscriberaswellwhencomparingsolutions.
CONCLUSIONInsummary,SelectiveSubscriberMigrationstrategyisasensibleapproachforanHFCtoFTTxtransition.MovingtoptierstoFTTxcanbuyHFCextradecadesfor80-95%ofsubscribersintheflagshipbasic/economytiers.Tmaxdominatesforthenext5-7years,soitismoreimportanttoincreasetheHFCcapacitytoatleast1GHzspectrumratherthansplitnodes.However,Tavgfinallycatchesup8-10+yearsfromnow;andSGsizereductionscomebackintovogue.OperatorsshouldpushfiberdeepenoughtoenableSelectiveFTTxfortoptiersondemandandbepreparedforthenextroundofSGsplits.
Tounderstandwhatthebestoptionistoenablethismigration,thepaperanalyzedindetail5veryuniquerealnodesthatvariedfromsparseruralnodetoaverydenseurbannode.Designworkwasthendoneonthesefivenodesforeachofthefollowingscenarios:
• “Businessasusual”1GHzactivedropinupgradewithnodesplitasneeded• FiberDeep–FTTLA• FTTC• FTTP

Copyright2016–ARRISEnterprisesLLC.Allrightsreserved. 28
Theresultsshowthatthereissignificantcostvariationsfromusecasetousecase.Everyoperatormustlookateachindividualscenariotodeterminewhatisbestforthatsituation.However,sometrendsdidemergethatshouldhelpguidetheoperators.ThefiberdeepapproachessuchasFTTLAprovidesomesignificantbenefitssuchas:
1. MaximizesDOCSIS3.1performancea. Datacapacitythatmatches10GbpsPON
2. ProvidesexcellentsteppingstonetoFTTPon-demanda. SelectiveSubscriberMigrationtoFTTPasneededb. Onaverage,fiberislessthan1000’fromanytap
3. ProvidesfinegranularityforoptimizingDOCSISSGsizesa. SameSGsizesasPON:~30-60homesb. MaximizeDOCSISCMTS/CCAPresources
4. Reducesmaintenance,power,andoperationalexpensescomparedtotoday’sHFC
5. Futureproofarchitecturea. N+0enablesDOCSISFull-duplex(FDX)andextendedspectrumb. ThesenewtechnologiespromisetodoforDOCSIS&cablewhatG.fastis
attemptingtodoforDSLandtwistedpair.
TheFTTLAanalysisshowsthatitisaneffectivefiberdeepFTTxmigrationstrategythatisaneconomicalsteppingstonetoFTTP.ItcanadddecadestothelifeofthevastmajorityofcustomersremainingonHFCwhileenablingaselectivemigrationofthetoptierstoFTTP.OtherN+0fiberdeepapproacheswerenotexplicitlydiscussedinthispaperbutareexpectedthattheywouldshowsimilarcostsandbenefitsasFTTLA.
ACKNOWLEDGEMENTSTheauthorswouldliketogratefullyacknowledgetheassistanceofStuartEastmanandmembersofhisteamwhohelpedimmenselywithanalyzing,dissecting,andcreatingdataandmaterialfortheusecasesthatarethebackboneofthispaper.WealsowouldliketoacknowledgeVenkMutalikforhisinputsonFTTLAandotherfiberdeeparchitecturalchoices.
Copyright2016–ARRISEnterprisesLLC.Allrightsreserved. 29
ABBREVIATIONSABR AdaptiveBitRateASC ActiveSplitter-CombinerBAU BusinessasUsualBcast BroadcastBps BitsPerSecondCAA CentralizedAccessArchitectureCAGR CompoundedAnnualGrowthRateCAPEX CapitalExpenseCCAP ConvergedCableAccessPlatformCM CableModemCMTS CableModemTerminationSystemCPE ConsumerPremiseEquipmentD3.1 DataOverCableServiceInterfaceSpecification3.1DAA DistributedAccessArchitectureDCA DistributedCCAPArchitectureDEPI DownstreamExternalPHYInterfaceDNA DistributedNodeArchitectureDOCSIS DataOverCableServiceInterfaceSpecificationDS DownstreamDWDM DenseWaveDivisionMultiplexingE2E EndtoendEPON EthernetPassiveOpticalNetwork(akaGE-PON)EQAM EdgeQuadratureAmplitudeModulatorFD FiberDeepFDX FullDuplex(i.e.DOCSIS)FEC ForwarderrorcorrectionFTTC FibertotheCurbFTTH FibertotheHomeFTTLA FibertotheLastActiveFTTP FibertothePremiseFTTT FibertotheTapFTTx Fibertothe‘x’where‘x’canbeanyoftheaboveGbps GigabitsPerSecondGHz GigahertzGPON Gigabit-PassiveOpticalNetworkHFC HybridFiber-CoaxHP HomesPassedHPON HybridPassiveOpticalNetwork
Copyright2016–ARRISEnterprisesLLC.Allrightsreserved. 30
HSD HighSpeedDataI-CCAP IntegratedConvergedCableAccessPlatformIEEE InstituteofElectricalandElectronicsEngineersIEQ IntegratedEdgeQAMLDPC LowDensityParityCheckFECCodeMAC MediaAccessControlinterfaceMACPHY DCAinstantiationthatplacesbothMAC&PHYintheNodeMbps MegaBitsPerSecondMDU MultipleDwellingUnitMHz MegahertzMSO MultipleSystemOperatorN+0 Node+0activesNcast NarrowcastNFV NetworkFunctionVirtualizationNPV NetPresentValueNSI NetworkSideInterfaceOBI OpticalBeatInterferenceODN OpticalDistributionNetworkOFDM OrthogonalFrequencyDivisionMultiplexingOFDMA OrthogonalFrequencyDivisionMultiplexingAccess(Upstream)OLT OpticalLineTerminationONU OpticalNetworkUnitOOB OutofBandOPEX OperatingExpenseOTT OvertheTopPHY PhysicalinterfacePNM ProactiveNetworkMaintenancePON PassiveOpticalNetworkQAM QuadratureAmplitudeModulationQoE QualityofExperienceQoS QualityofServiceRF RadiofrequencyRFoG RFOverGlassROI ReturnonInvestmentR-OLT RemoteOLTRPD RemotePHYDeviceR-MACPHY RemoteMAC-PHYR-PHY RemotePHYRX ReceiveSDN SoftwareDefinedNetworkSG ServiceGroup

Copyright2016–ARRISEnterprisesLLC.Allrightsreserved. 31
SCTE SocietyofCableTelecommunicationsEngineersSNR SignaltoNoiseRatioTaFDM TimeandFrequencyDivisionMultiplexingTavg AveragebandwidthpersubscriberTCO TotalCostofOperationTmax MaximumSustainedTrafficRate–DOCSISServiceFlow
parameterTX TransmitUHD UltraHighDefinitionUS UpstreamVOD VideoondemandWDM WavelengthDivisionMultiplexing
Copyright2016–ARRISEnterprisesLLC.Allrightsreserved. 32
RELATEDREADINGS• TheYinandtheYangofaMovetoAllFiber:TransformingHFCtoanAllFiber
NetworkWhileLeveragingtheDeployedHFCAssets–ThispaperprovidescriticalinsightsintotheinnovationsthatenableOBIfreeRFoGtransmissionsanddiscussesintrinsiccapabilitiesofHybridPON(HPON)technology,explaininghowthistechnologyworkswithexistingHFCanalogandQAMvideoandD3.0andD3.1signalswhilealsobeingcompletelytransparentwithtraditionalPONstandardssuchasthe10GEPON,1GEPON,GPONandXGPON1.
• PoweringPONwithHFC-AHybridforaNewGeneration–Inthepast10-15years,fiber-to-the-premises(FTTP)networkshavebeendeployedinmanyregionsoftheworld.Thispapercomparesthetotalend-to-endcostsandthroughputofthemostcommontypesofPONsanddemonstrateshowtheHFCnodecanbeusedtoenablecableoperatorstodeliverHFCandfiber-to-the-premises(FTTP)servicessimultaneouslyfromthesamenode.
• ComparingtheDOCSIS3.1andHFCEvolutiontotheFTTHRevolution–Thispaperdescriberstheexistingnetworkmigrationoptionsincludingdifferentmigrationpathsfortheexistingcoax-to-the-home(CTTH)networksupportingmoreIP/datacapacitywithDOCSIS3.0/3.1overHFC.

Copyright2016–ARRISEnterprisesLLC.Allrightsreserved. 33
MEETONEOFOUREXPERTS:JohnUlmJohnUlmholdsthepositionofEngineeringFellow,BroadbandSystemsforARRISwithintheNetworkSolutionsCTOgroup.InthisroleheinvestigatesAdvancedTechnologiesforBroadbandSystemsincludingstrategictechnicaldirectionsformultiscreenservicesandbandwidthexpansion.RecentactivitiesincluderesearchintonextgenerationCCAParchitectures;HFCtoFTTxmigrationincludingHybridPON(HPON),distributedaccessarchitecturessuchasRemote-CCAPandRemote-PHY;nextgenerationprotocolsincludingDOCSIS3.1andNG-EPON;andMulti-screenIPVideosolutionsincludingmulticast-assistedABR.John’sthreedecadesintheBroadbandindustrybeganasdesigner,architect,andMACprotocoldeveloperatLANcity,pioneeringtheindustry’sfirstcablemodemsystems.HewasprimaryauthorfortheCableIndustry’sDOCSIS1.0and1.1specificationsthatdroveearlycablemodemsuccess.HealsospenttimeasNetworkProcessorarchitectforNortelandasseniortechnicalconsultanttotheBroadbandindustrywithYASCorp. JohnholdsaBSEEandMSEEfromRPIandhasamultitudeofpapersandpatentstohisname.
Copyright2016–ARRISEnterprisesLLC.Allrightsreserved. 34
REFERENCES(1) [AYHAM_2014]“TheSpectralEfficiencyofDOCSIS3.1Systems,”AyhamAl-Bannaet.al.,SCTECableTecExpo’14,SCTE,2014
(2) [AYHAM_2015]“Measurement-BasedEoLStochasticAnalysisandDOCSIS3.1SpectralGain”;AyhamAl-Bannaet.al.,TheNCTACableShowSpringTechnicalForum,INTX2015
(3) [CLOONAN_2014]“PredictionsontheEvolutionofAccessNetworkstotheYear2030&Beyond”;T.Cloonan,M.Emmendorfer,J.Ulm,A.Al-Banna,S.Chari,TheCableShowNCTA/SCTETechnicalSessionsSpring2014
(4) [CLOONAN_2015]“LessonsfromTelcoandWirelessProviders:ExtendingtheLifeoftheHFCPlantwithNewTechnologies,”TomCloonanet.al.,TheNCTACableShowSpringTechnicalForum,May,INTX2015
(5) [CLOONAN_2016]“UsingDOCSIStoMeettheLargerBandwidthDemandofthe2020decadeandBeyond”TomCloonan,AyhamAl-Banna,FrankO’Keeffe;TheNCTACableShowSpringTechnicalForum,INTX2016
(6) [CL_D3.1_PHY]Data-Over-CableServiceInterfaceSpecificationsDOCSIS3.1PhysicalLayerSpecification;CM-SP-PHYv3.1-I05-150326,CableLabs
(7) [CL_RMACPHY]Data-Over-CableServiceInterfaceSpecificationsDCA-RemoteMACPHY;RemoteMAC-PHYTechnicalReportCM-TR-R-MACPHY-V01-150730,CableLabs
(8) [EMM_2014]“Nielson’sLawvs.NielsonTVViewershipforNetworkCapacityPlanning,”MikeEmmendorfer,TomCloonan;TheNCTACableShowSpringTechnicalForum,April,2014
(9) [EMM2_2014]“ASide-by-sideComparisonofCentralizedvsDistributedAccessArchitectures”,MikeEmmendorferet.al.,2014SCTESpringTechnicalForum,SCTE
(10) [EMM_2015]“ComparingtheDOCSIS3.1andHFCEvolutiontotheFTTHRevolution”MikeEmmendorfer;2015SCTESpringTechnicalForum,SCTE
(11) [EMM2_2015]“EstimatingDownstreamPerformanceandDOCSIS3.1CapacityinCAAandDAASystems”,MikeEmmendorferet.al,TheNCTACableShowSpringTechnicalForum,INTX2015
(12) [EMM_2016]“AnEconomicAnalysisofBrownfieldMigrationCTTHvs.FTTH”,MikeEmmendorfer,TheNCTACableShowSpringTechnicalForum,INTX2016
Copyright2016–ARRISEnterprisesLLC.Allrightsreserved. 35
(13) [EMM2_2016]“AComparisonofCentralizedvs.DistributedAccessArchitectureforPON”,MichaelEmmendorfer,SebnemZorluOzer;TechnicalForum,INTX2016
(14) [IHS_2010-16]“IHSTechnology(formerlyInfonetics)CableBroadbandHardwareQuarterlyMarketTracker”from1Q2010through1Q2016
(15) [ULM_2013]“CCAPCaseStudy:EnablingConvergedVideo+DatathruSpace&PowerSavings”JohnUlm,SaifRahman,JorgeSalinger,JeffFinkelstein,2013SCTECable-TecExpo
(16) [ULM_2014]“IsNielsenReadytoRetire?LatestDevelopmentsinBandwidthCapacityPlanning”,JohnUlm,T.Cloonan,M.Emmendorfer,J.Finkelstein,JPFioroni;2014SCTECable-TecExpo
(17) [ULM2_2014]“ScalingTraditionalCCAPToMeetTheCapacityNeedsOfTheNextDecade”JohnUlm,TomCloonan;2014SCTECable-TecExpo
(18) [ULM_2015]“HFCTransformationtoFTTP:TheRoleofRFoG,PONandHybridsolutions”,JohnUlm,VenkMutalik;2015SCTECable-TecExpo
(19) [ULM_2016]“GivingHFCaGreenThumb:ACaseStudyonAccessNetworkandHeadendEnergy&SpaceConsiderationsforToday&FutureArchitectures”JohnUlm,ZoranMaricevic;2016SCTECable-TecExpo
(20) [ULM2_2016]“AddingtheRightAmountofFibertoYourHFCDiet:ACaseStudyonHFCtoFTTxMigrationStrategies”,JohnUlm,ZoranMaricevic;2016SCTECable-TecExpo
(21) [VENK_2015]“TheYinandtheYangofaMovetoAllFiber:TransformingHFCtoanAllFiberNetworkwhileLeveragingtheDeployedHFCAssets”;VenkMutalik,MarcelShemmann,ZoranMaricevic,JohnUlm;2015INTXNCTASpringTechnicalForum
(22) [VENK_2016]“Cable’sSuccessisinitsDNA:DesigningNextGenerationFiberDeepNetworkswithDistributedNodeArchitecture”VenkMutalik,ZoranMaricevic;2016SCTECable-TecExpo
(23) [ZORLU_2015]“FromOBIandSNRtoOoklaandNetflix:HowNetworkImpairmentsaffectCustomerPerceptions:TheroleofLeadingandLaggingIndicatorsasWeEvolveHFCtoFTTP”;SebnemZorluOzer,Ph.D.,VenkMutalik,A.Vieira,Ph.D.,J.Chrostowski;SCTECable-TecExpo2015