Data Virtualization Deployments: How to Manage Very Large Deployments
39
How To Manage Large Deployments Juan Lozano, Principal Technical Account Manager
-
Upload
denodo -
Category
Technology
-
view
120 -
download
4
Transcript of Data Virtualization Deployments: How to Manage Very Large Deployments

How To Manage Large DeploymentsJuan Lozano, Principal Technical Account Manager

Agenda1.Introduction
2.Environment Management
3.Metadata Synchronization and migrations
4.Monitoring
5.Resource Management

Introduction

4
Introduction
Denodo deployments can go from a few developers and users
executing thousands of queries a day to hundreds of developers and
users executing hundreds of thousands of queries a day. In order to
manage both types of deployments Denodo provides multiple
features that simplify this task.
These features will help with the management of environments,
metadata synchronization, migrations, resource management and
monitoring.

5
Challenges in Large Deployments
Managing multiple environments with different dependent parameters such as
connectivity credentials
Migration process between different stages of the release lifecycle can be time
consuming and prone to errors
Resources can be over loaded based on the number of users or queries
Finding and diagnosing an issue in one of the servers of the deployment can
be difficult as there are multiple environments and/or servers that can be part
of a cluster

6
Solutions
Denodo fully integrates with a version control system
Dependent parameters are organized by environments
Simple migration process between different environments by providing both a GUI and
a set of scripts that can be fully automated and integrated with a current migration
protocol
Resource manager integrated in the administration tool to control the system
resources with a big level of granularity
Denodo monitoring and diagnosing web allows to configure a set of environments or
servers so all the information for each node, including historical, is available from a
single interface
7
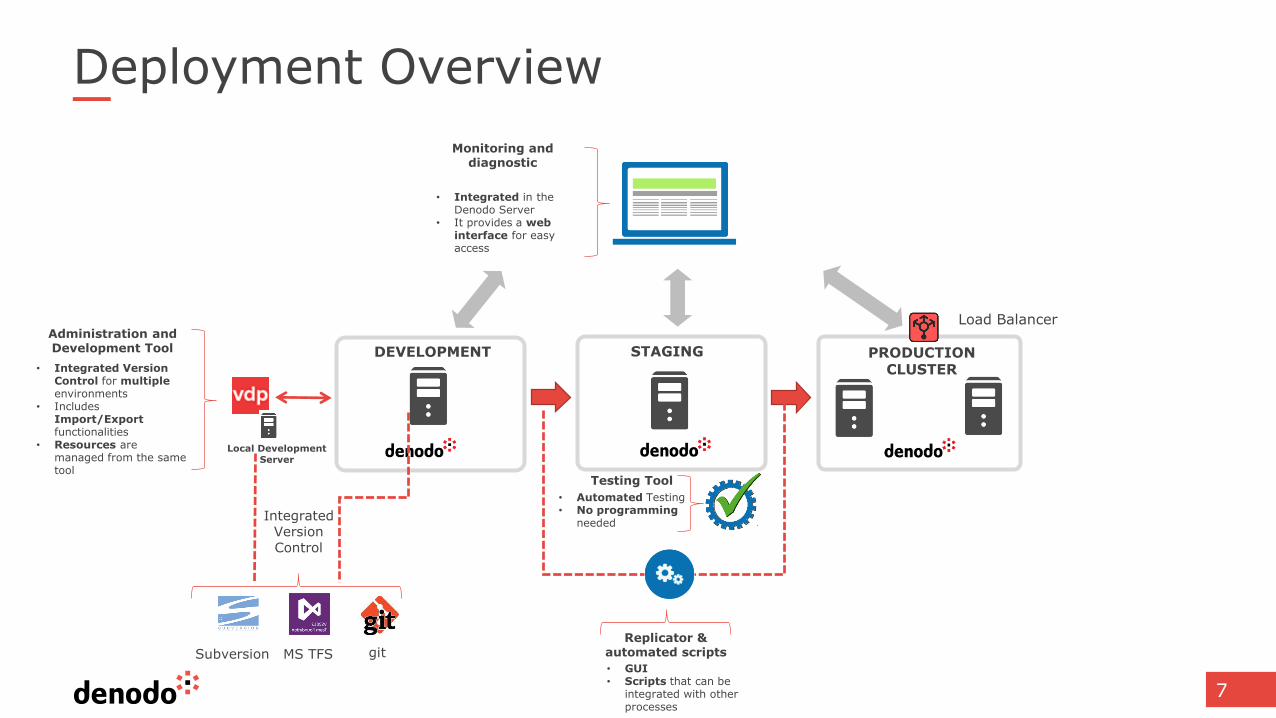
Deployment Overview
Administration and Development Tool DEVELOPMENT
• Integrated Version Control for multipleenvironments
• Includes Import/Exportfunctionalities
• Resources are managed from the same tool
Load Balancer
STAGING PRODUCTION CLUSTER
• Integrated in the Denodo Server
• It provides a webinterface for easy access
Monitoring and diagnostic
Replicator & automated scripts
• GUI • Scripts that can be
integrated with other processes
Testing Tool
• Automated Testing• No programming
neededIntegrated
Version Control
MS TFSSubversion git
Local DevelopmentServer

Environment Management

9
Version Control
Built-in integration with version control systems: Subversion, Git and MS TFS
Support for team development and multiple environment migrations
Integrated dependency management and conflicts control

10
Version Control
Bob Alice
DevelopmentServer
StagingServer
Demo_svn_Bob Demo_svn_Alice
Demo_svn Demo_svn
VCS Repository
Demo_svn(consolidated Development
database)
Replicator & Scripts

11
Dependent parameters and Environments
Denodo includes the concept of environment for manage dependent metadata
such as the data sources connection properties (e.g. login/passwords)
Environments can represent, for example, different development servers for
different groups and/or different geographical locations
When loading metadata from a different environment, the process can be
configured to use the properties of the target environment instead of the origin
ones

12
Version Control Environments
By following this approach we can easily maintain all our dependent
metadata organized and ready to be used

13
Version Control
Bob Alice
DevelopmentServer in New York
StagingServer
Demo_svn_Bob Demo_svn_Alice
Demo_svn Demo_svn
VCS Repository
Demo_svn(consolidated Development
database)
Replicator & Scripts
Local Development Server in Palo Alto
PA EnvironmentProperties
NY EnvironmentProperties
Staging EnvironmentProperties

Metadata Synchronization and Migrations

15
Metadata Synchronization and Migrations
Denodo provides different tools to help with metadata synchronization and migration process:
VDP Administration Tool GUI
Shell Scripts
Denodo Replicator
Denodo Testing Tool

16
VDP Administration Tool GUI
Denodo admin tool provides graphical wizards to export/import
metadata and environment dependent properties

17
Shell Scripts
Denodo provides scripts for performing periodical backup copies and import metadata
to a list of servers
These scripts offer the same options as the VDP admin interface for import and export
The scripts can be found in the Denodo_Home\bin folder but also as an standalone tool
in the DENODO_HOME\tools\db\denodo-db-tools folder
These scripts can be used to automate the promotion/migration process adding any
validation rules as needed
18
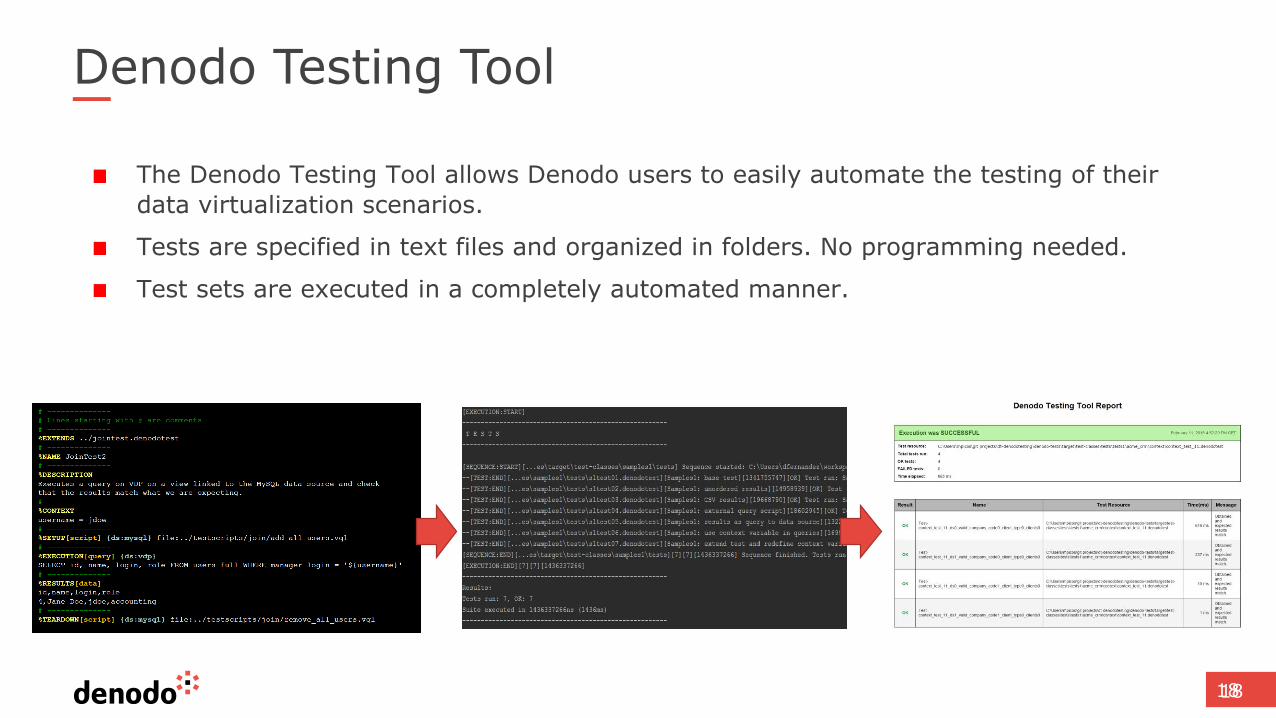
Denodo Testing Tool
18
The Denodo Testing Tool allows Denodo users to easily automate the testing of their
data virtualization scenarios.
Tests are specified in text files and organized in folders. No programming needed.
Test sets are executed in a completely automated manner.

19
Creating an automated script
We can combine the shell scripts with the Testing Tool and create a fully automated
process, for example our script can:
Obtain the consolidated version (VCS) from the development server
Load that version into the staging server but using the environment dependent
parameters file
Execute the Denodo Testing Tool group of tests
In case of error inform of tests that failed
In other case tag the version

20
Denodo Replicator
Denodo Replicator can be used to graphically manage an
environment and synchronize the metadata among its members
Metadata replication

Monitoring and diagnosis
22
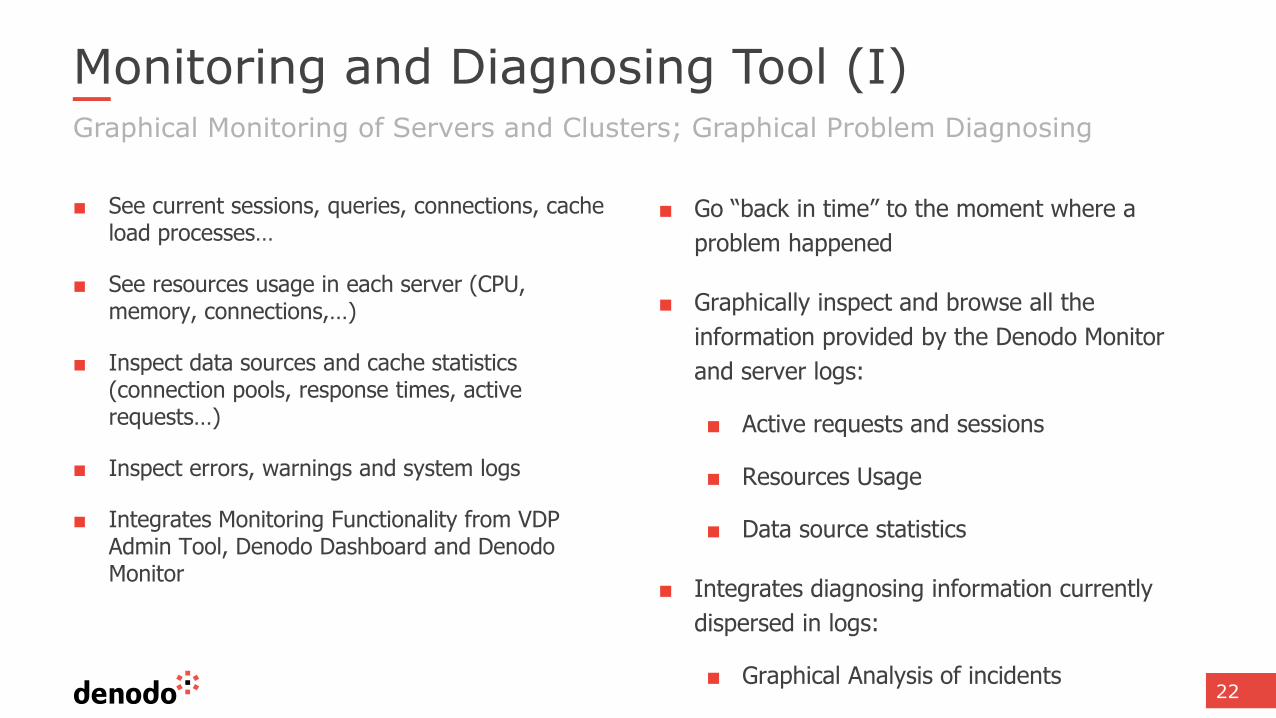
■ See current sessions, queries, connections, cache load processes…
■ See resources usage in each server (CPU, memory, connections,…)
■ Inspect data sources and cache statistics (connection pools, response times, active requests…)
■ Inspect errors, warnings and system logs
■ Integrates Monitoring Functionality from VDP Admin Tool, Denodo Dashboard and Denodo Monitor
■ Go “back in time” to the moment where a
problem happened
■ Graphically inspect and browse all the
information provided by the Denodo Monitor
and server logs:
■ Active requests and sessions
■ Resources Usage
■ Data source statistics
■ Integrates diagnosing information currently
dispersed in logs:
■ Graphical Analysis of incidents
Monitoring and Diagnosing Tool (I)Graphical Monitoring of Servers and Clusters; Graphical Problem Diagnosing

23
Monitoring and Diagnosing Tool (II)

24
Monitoring and Diagnosing Tool (III)
Environments and servers can be created
Servers can be added to an environment
Start monitoring a server/environment by double clicking in an item or by right clicking in the desired item and choosing the desired option
Diagnostic information about an specific server can be loaded by an option of the right context menu (new “child” of this server appears in the tree)

25
Monitoring and Diagnosing Tool (and IV)
Data of monitoring and diagnosing is organized in 8 categories:
State: Summary information of the state of the server/environment
Resources: Information about physical resources (memory, cpu,…)
Requests: Information about requests, including real-time execution trace
Session: Currently opened sessions, including client application
Cache: Information about cache load processes and cache contents
Datasources:Information about activity in the datasources
Threads: Information about threads (priorities, CPU usage)
Errors: Inspect logged errors and warnings
… and many others
Filter and sort information by any criteria: e.g. see data sources used by a query, see requests from a given session,…

Use Case Scenario: Slow queries (I)
This sample scenario shows a possible use case in diagnostic
mode
Users have reported performance problems with VDP server
‘server1’ during query execution times are bigger than expected
The issues were reported between 19:15 and 21:00 on March 3
The goal is to detect the root cause of the problem
26

Use Case Scenario: Slow queries (II)
The diagnostic logs saved during March 3 are loaded
A new main tab “Server1 March 3” is opened with data for the loaded diagnostic data
27

Use Case Scenario: Slow queries (III)
A time filter is created for the conflicting time period
Now you can inspect all the metrics of the system during that
period
28

Use Case Scenario: Slow queries (IV)
The ‘State’ tab shows a clear increment of the ‘waiting requests’
29

Use Case Scenario: Slow queries (V)
A filter on ‘Requests’ Tab shows that a significant number of queries failed or finished with timeout in that period
We explore the data sources used by some of the failed queries
30

Use Case Scenario: Slow queries (VI)
The connection pool of the data source is frequently full during
the period -> requests are being queued
Suggests pool is too small or more queries than usual
31

Use Case Scenario: Slow queries (VII)
We continue the analysis and order the requests by client
application. We notice the application ’single_customer’ view
executed many long-running requests during the period
32

Use Case Scenario: Slow queries (VIII)
We examine the query plan of some of the queries and notice that
they are complex, long-running reports
33

Use Case Scenario: Slow queries (and IX)
Possible solutions:
Use Resource Manager to limit the maximum number of concurrent
requests from the “Single Customer View” application, so they do not
monopolize the data source
Ask the administrators of the “Single Customer View” application to
distribute the execution of reports in a longer time period
Cache part of the data to distribute the workload
Increase the size of the pool if the data source can support the workload
34

Resources Management

Workload Management
Ensure fair distribution of resources among applications / users
Allocate available resources according to business priorities
Sessions classified into groups according to criteria such as user/role,
application, time,…
Sessions are assigned to resource groups, which establish restrictions:
Apply always or only under heavy CPU usage
Example restrictions:
Change execution priorities
Max. number of concurrent queries
Limit execution time
36

■ Create plan restrictions.
Denodo Resource Manager (I)

■ Rules Classify Sessions into Groups (e.g. by user, application,…)
■ E.g. Sessions from application ‘single customer view’ are assigned to plan called ‘limit_concurrent_queries_to_10’
Denodo Resource Manager (II)

Thanks!
www.denodo.com [email protected]
© Copyright Denodo Technologies. All rights reservedUnless otherwise specified, no part of this PDF file may be reproduced or utilized in any for or by any means, electronic or mechanical, including photocopying and microfilm, without prior the written authorization from Denodo Technologies.