
FORWARD-LOOKING STATEMENT
22
description
FORWARD-LOOKING STATEMENT. - PowerPoint PPT Presentation
Transcript of FORWARD-LOOKING STATEMENT

2
FORWARD-LOOKING STATEMENT
The information contained in this presentation may include forward-looking statements that reflect Regions’ current views with respect to future events and financial performance. You should not place undue reliance on these statements as the forward-looking statements are based on current expectations and general assumptions and are subject to various risks, uncertainties, and other factors that may cause actual results to differ materially from the views, beliefs, and projections expressed in such statements. Such forward-looking statements are made in good faith by Regions pursuant to the “safe harbor” provisions of the Private Securities Litigation Reform Act of 1995.
The words “believe”, “expect”, “anticipate”, “project”, and similar expressions signify forward-looking statements. Readers are cautioned not to place undue reliance on any forward-looking statements made by or on behalf of Regions. Any such statement speaks only as of the date the statement was made. Regions undertakes no obligation to update or revise any forward-looking statements.
Some factors which may affect the accuracy of our projections apply generally to the financial services industry, including: (a) the easing of restrictions on participants in the financial services industry, such as banks, securities brokers and dealers, investment companies, and finance companies, may increase our competitive pressures: (b) possible changes in interest rates may increase our funding costs and reduce our earning asset yields, thus reducing our margins; (c) possible changes in general economic and business conditions in the United States and the South in general and in the communities we serve in particular may lead to a deterioration in credit quality, thereby increasing our provisioning costs, or a reduced demand for credit, thereby reducing our earning assets; (d) the existence or exacerbation of general geopolitical instability and uncertainty, including the threat or occurrence of acts of terror or the occurrence or escalation of hostilities; (e) possible changes in trade, monetary and fiscal policies, laws, and regulations, and other activities of governments, agencies, and similar organizations, including changes in accounting standards, may have an adverse effect on our business; and (f) possible changes in consumer and business spending and saving habits and in employment levels could have an effect on our ability to grow our assets and to attract deposits.
Other factors which may affect the accuracy of our projections are specific to Regions, including (i) the cost and other effects of material contingencies, including litigation contingencies; (ii) our ability to expand into new markets and to maintain profit margins in the face of pricing pressures; (iii) our ability to keep pace with technological changes; (iv) our ability to develop competitive new products and services in a timely manner and the acceptance of such products and services by Regions customers and potential Regions customers; (v) our ability to effectively manage interest rate risk, credit risk and operational risk; (vi) our ability to manage fluctuations in the value of our assets and liabilities and off-balance sheet exposures so as to maintain sufficient capital liquidity to support our business; and (vii) our ability to achieve the earnings expectations related to the businesses that we have recently acquired or may acquire in the future, which in turn depends on a variety of factors, including: our ability to achieve anticipated cost savings and revenue enhancements with respect to acquired operations: the assimilation of acquired operations to the Regions corporate culture, including the ability to instill our credit practices and efficient approach to acquired operations; and the continued growth of the markets that the acquired entities serve, consistent with recent historical experience.
3
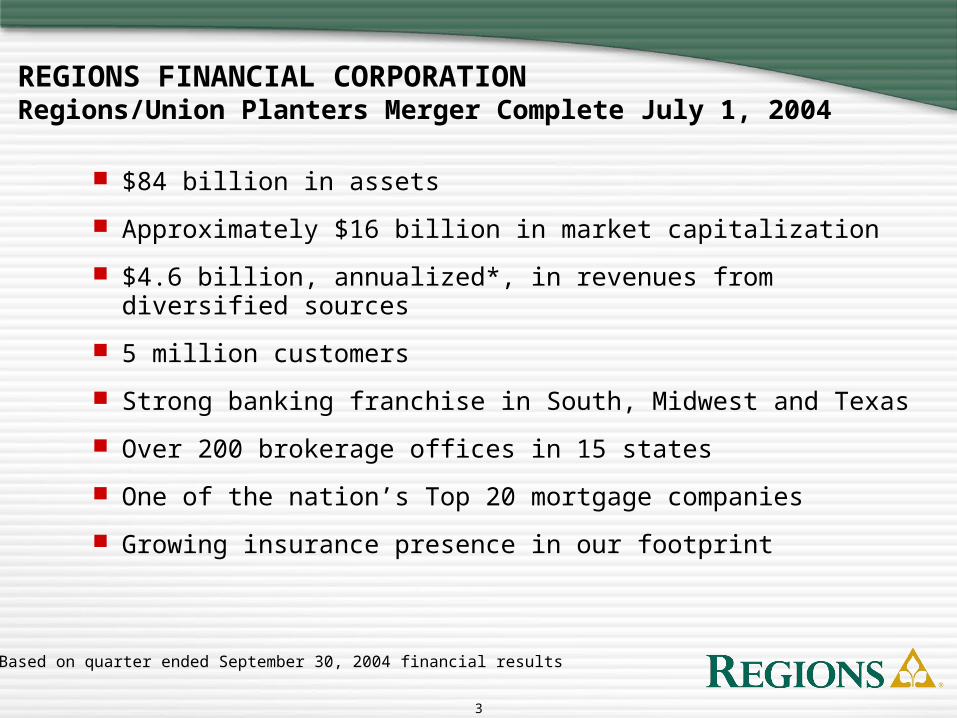
REGIONS FINANCIAL CORPORATIONRegions/Union Planters Merger Complete July 1, 2004
$84 billion in assets
Approximately $16 billion in market capitalization
$4.6 billion, annualized*, in revenues from diversified sources
5 million customers
Strong banking franchise in South, Midwest and Texas
Over 200 brokerage offices in 15 states
One of the nation’s Top 20 mortgage companies
Growing insurance presence in our footprint
* Based on quarter ended September 30, 2004 financial results

4
REGIONS FINANCIAL CORPORATIONBroader and Stronger Distribution Capability
Distribution Strength5mm Customers
1,400 Branches
1,700 ATMs
975 Financial Advisors
1900 Insurance Licensees
450K Online Customers
5
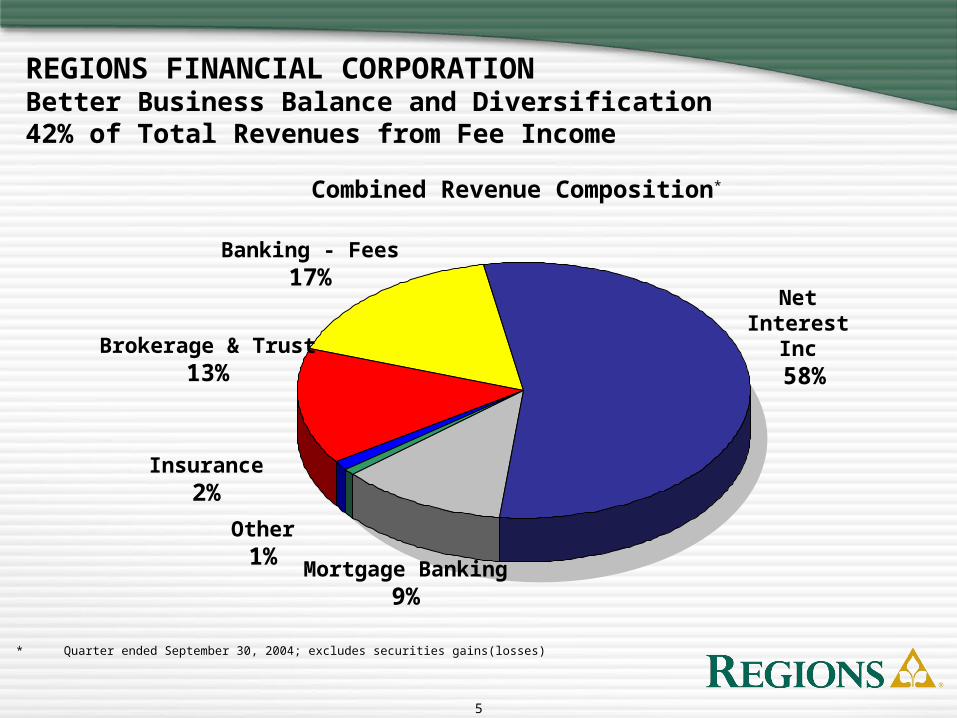
REGIONS FINANCIAL CORPORATION Better Business Balance and Diversification42% of Total Revenues from Fee Income
Combined Revenue Composition*
* Quarter ended September 30, 2004; excludes securities gains(losses)
Insurance2%
Net Interest Inc
58%
Mortgage Banking9%
Brokerage & Trust13%
Other1%
Banking - Fees17%

6
WHY SCALE DOES MAKE A DIFFERENCE!
7
LARGER MARKET CAP IS A POSITIVE
More recognition in customer base
More recognition by institutional shareholders
Better currency for acquisitions
8
LARGER IS BETTER IN TODAY’S REGULATORY ENVIRONMENT
Better able to afford and attract – strong directors
– top level compliance professionals
– high quality internal audit professionals
9
LARGER MEANS MORE PRODUCTS AND SERVICES Significant Morgan Keegan Growth Prospects
Individual wealth management business
– Brokerage
– Trust
– Asset Management
Corporate clients
– Mergers and acquisitions
– Equity and debt financings
– Other investment banking services
Municipal clients
– Debt offerings
– Advisory services
10
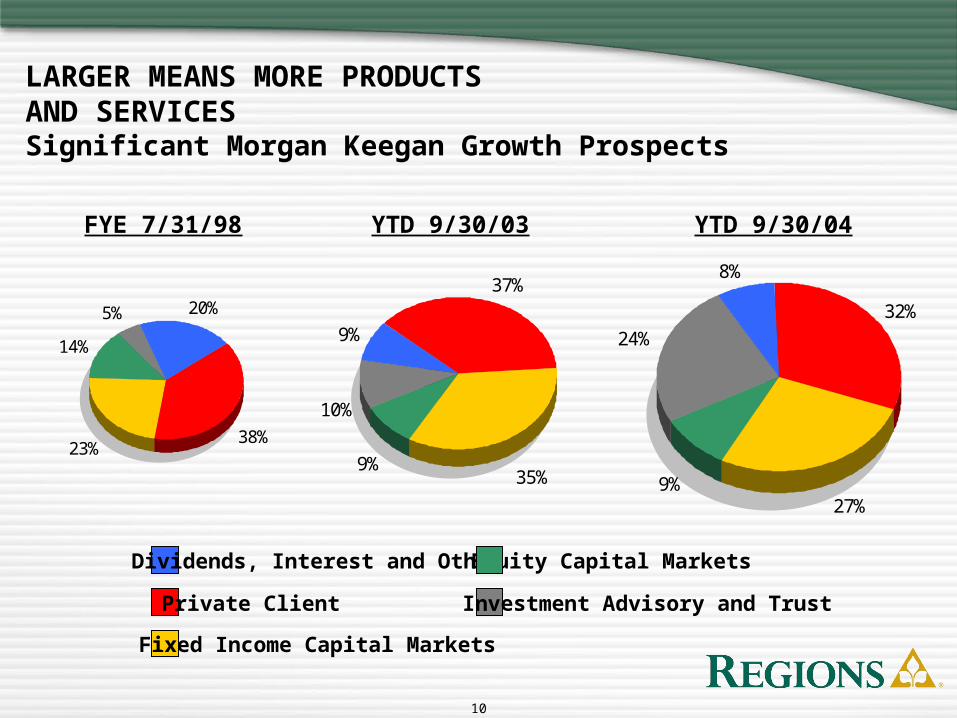
9%
37%
35%9%
10%
24%
8%
32%
27%9%
LARGER MEANS MORE PRODUCTS AND SERVICES Significant Morgan Keegan Growth Prospects
20%
38%23%
14%
5%
FYE 7/31/98 YTD 9/30/03 YTD 9/30/04
Equity Capital Markets Dividends, Interest and Other
Private Client
Fixed Income Capital Markets
Investment Advisory and Trust
11
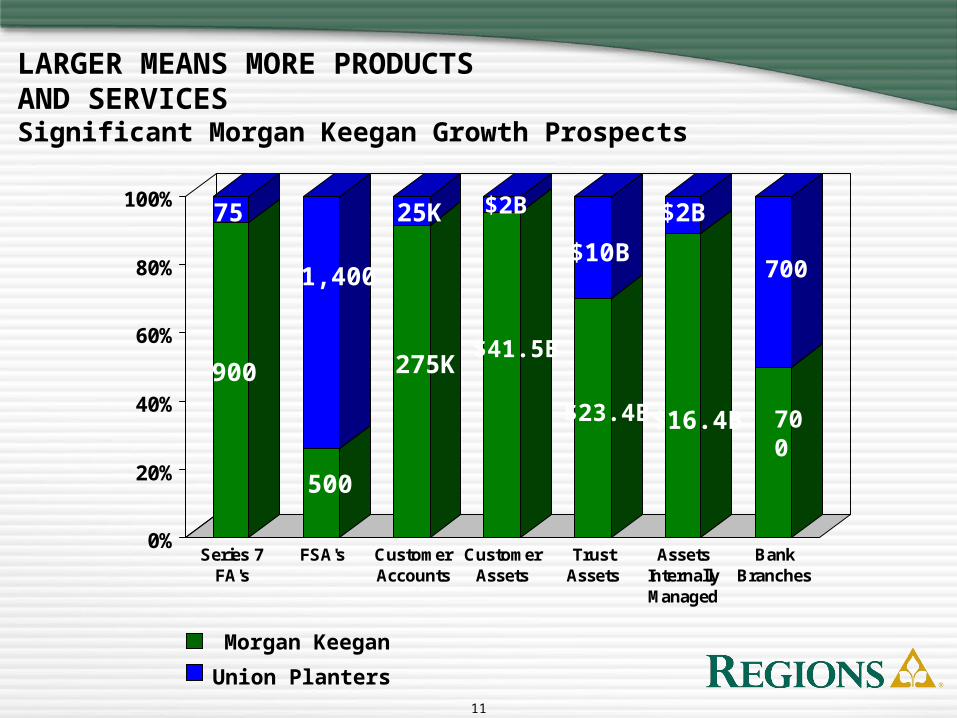
LARGER MEANS MORE PRODUCTS AND SERVICES Significant Morgan Keegan Growth Prospects
Morgan Keegan
Union Planters
0%
20%
40%
60%
80%
100%
Series 7FA's
FSA's CustomerAccounts
CustomerAssets
TrustAssets
AssetsInternallyManaged
BankBranches
900
700
$16.4B
$2B
$23.4B
$10B
500
$41.5B
$2B
275K
25K
1,400
75
700
12
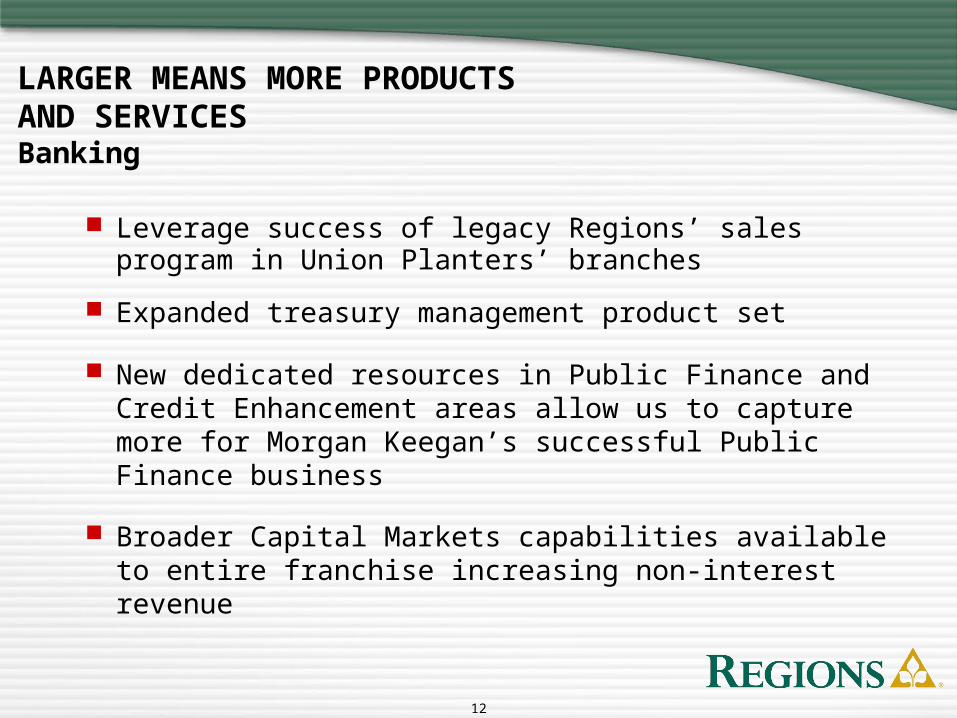
LARGER MEANS MORE PRODUCTS AND SERVICES Banking
Leverage success of legacy Regions’ sales program in Union Planters’ branches
Expanded treasury management product set
New dedicated resources in Public Finance and Credit Enhancement areas allow us to capture more for Morgan Keegan’s successful Public Finance business
Broader Capital Markets capabilities available to entire franchise increasing non-interest revenue

13
SCALE PROVIDES REGIONS WITH A MORE BALANCED MORTGAGE OPERATION
Regions Mortgage– Primarily conforming loans
– $39 billion in servicing portfolio at 9/30/04 (down from $44 billion at 6/30/04)
– $3.8 billion in production in 3Q04
EquiFirst– Non-conforming loans
– Sold on a whole loan basis at a premium, servicing released
– $1.3 billion in production in 3Q04

14
LARGER MEANS ENJOYING THE CAPABILITIES TO HAVE AND MAINTAIN MARKET SHARE Leading Market Share in the Mid-South1
Rank Company Deposits
($mm) Deposit Market Share
(%)
1. Wachovia2 $36,975 8.97%
2. Regions2 35,923 8.72
3. SunTrust2 33,058 8.02
4. Bank of America 23,100 5.61
5. AmSouth 22,922 5.56
6. First Horizon 15,751 3.82
7. Synovus 13,008 3.16
8. Hibernia 12,376 3.00
9. JPMorgan Chase 9,113 2.21
10. BancorpSouth 8,281 2.01 Source: FDIC, as of 6/30/04
Note:
1 Includes Alabama, Arkansas, Georgia, Louisiana, Mississippi and Tennessee
2 Reflects pro forma deposit data for transactions that closed after June 30, 2004
15
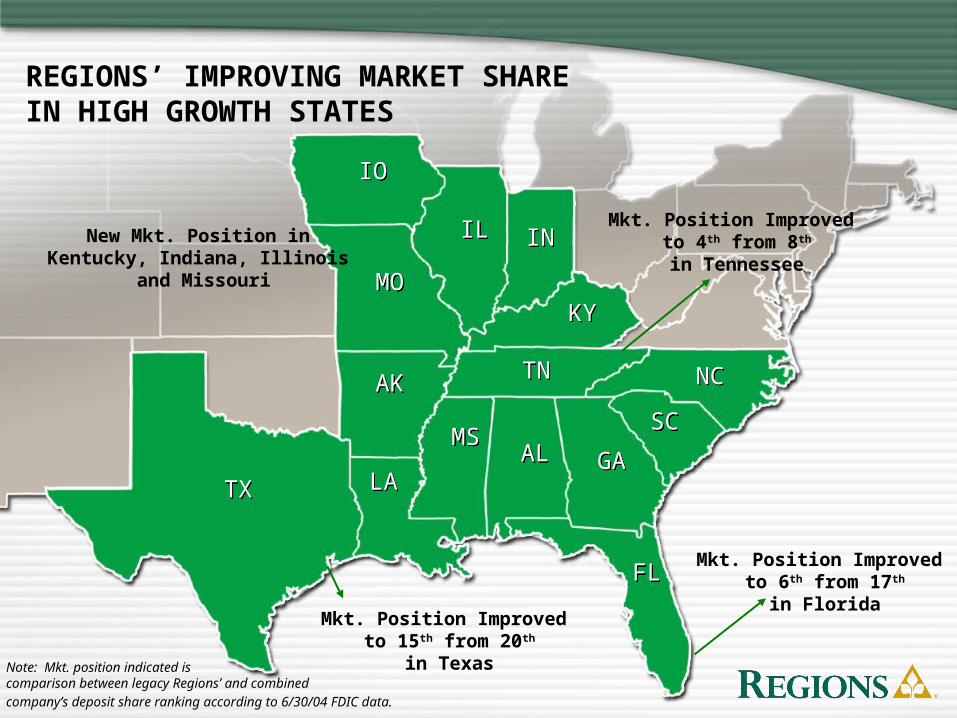
REGIONS’ IMPROVING MARKET SHARE IN HIGH GROWTH STATES
TXTX
AKAK
LALA
TNTN
ALAL GAGA
SCSC
NCNC
FLFL
MOMO
IOIO
ILIL ININ
KYKY
MSMS
Mkt. Position Improved to 6th from 17th
in FloridaMkt. Position Improved
to 15th from 20th
in Texas
Mkt. Position Improved to 4th from 8th
in Tennessee
New Mkt. Position in Kentucky, Indiana, Illinois
and Missouri
Note: Mkt. position indicated is comparison between legacy Regions’ and combined
company’s deposit share ranking according to 6/30/04 FDIC data.
16
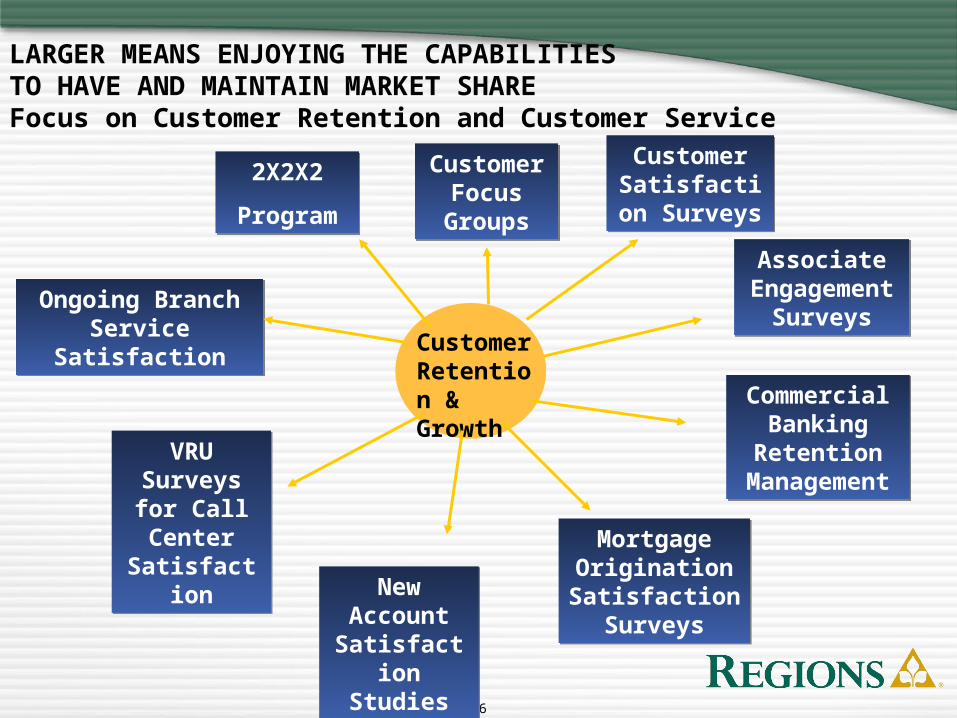
Customer Retention & Growth
Ongoing Branch Service Satisfaction
Ongoing Branch Service Satisfaction
2X2X2
Program
2X2X2
Program
CustomerFocus
Groups
CustomerFocus
Groups
Customer Satisfaction
Surveys
Customer Satisfaction
Surveys
Commercial Banking
Retention Management
Commercial Banking
Retention Management
Associate Engagement
Surveys
Associate Engagement
Surveys
Mortgage Origination Satisfaction
Surveys
Mortgage Origination Satisfaction
Surveys
New Account
Satisfaction Studies
New Account
Satisfaction Studies
VRU Surveys for Call Center Satisfaction
VRU Surveys for Call Center Satisfaction
LARGER MEANS ENJOYING THE CAPABILITIES TO HAVE AND MAINTAIN MARKET SHARE Focus on Customer Retention and Customer Service
17
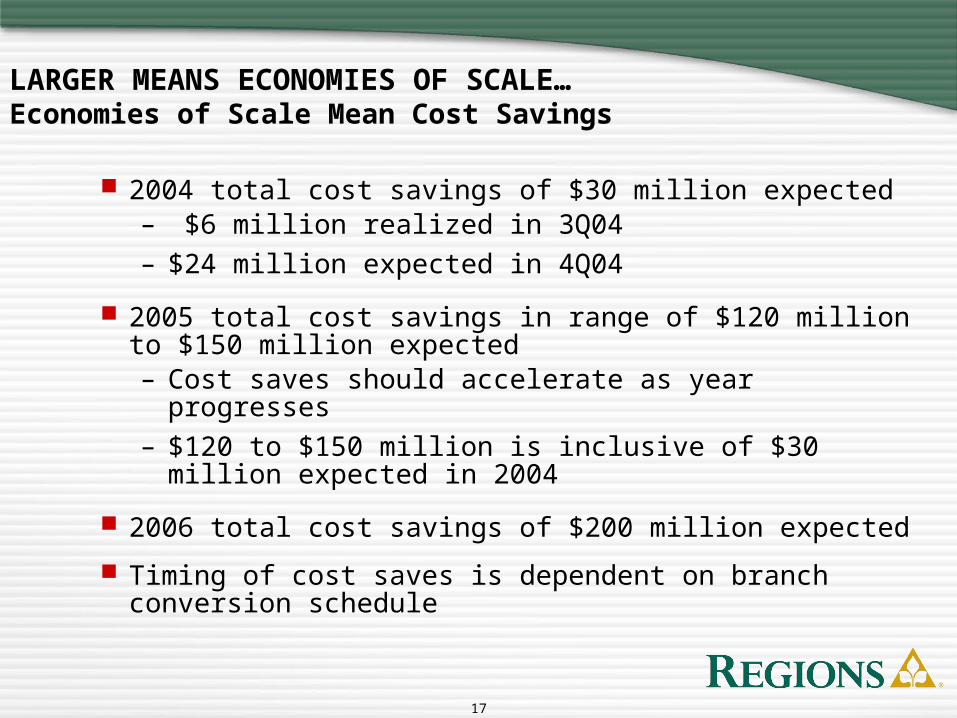
LARGER MEANS ECONOMIES OF SCALE…Economies of Scale Mean Cost Savings
2004 total cost savings of $30 million expected– $6 million realized in 3Q04
– $24 million expected in 4Q04
2005 total cost savings in range of $120 million to $150 million expected– Cost saves should accelerate as year progresses
– $120 to $150 million is inclusive of $30 million expected in 2004
2006 total cost savings of $200 million expected
Timing of cost saves is dependent on branch conversion schedule

18
LARGER MEANS ECONOMIES OF SCALE…Economies of Scale Mean Cost Savings
Leverage in negotiation of contracts
Consolidation of operations centers and administrative functions (e.g., HR, Finance, Credit Operations)
Mortgage
– Sale of $5 billion of non-footprint mortgage servicing rights
– Sale of non-footprint retail mortgage production offices
– Consolidation of operation centers
– Consolidation of servicing platforms – closing of Montgomery servicing center in 2004
Personnel savings
19
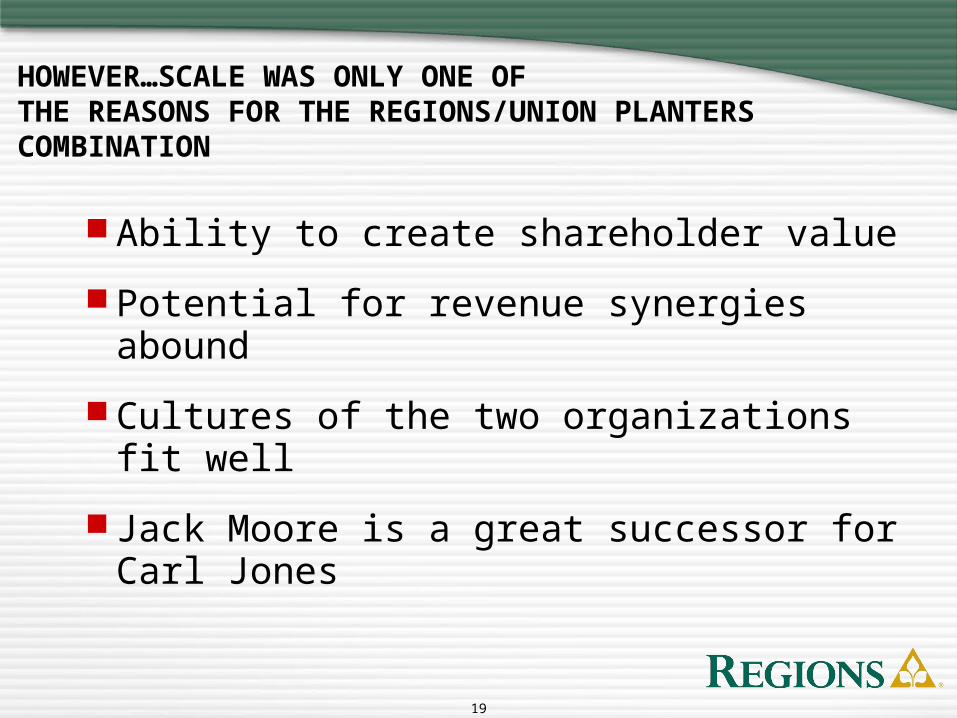
HOWEVER…SCALE WAS ONLY ONE OF THE REASONS FOR THE REGIONS/UNION PLANTERS COMBINATION
Ability to create shareholder value
Potential for revenue synergies abound
Cultures of the two organizations fit well
Jack Moore is a great successor for Carl Jones
20
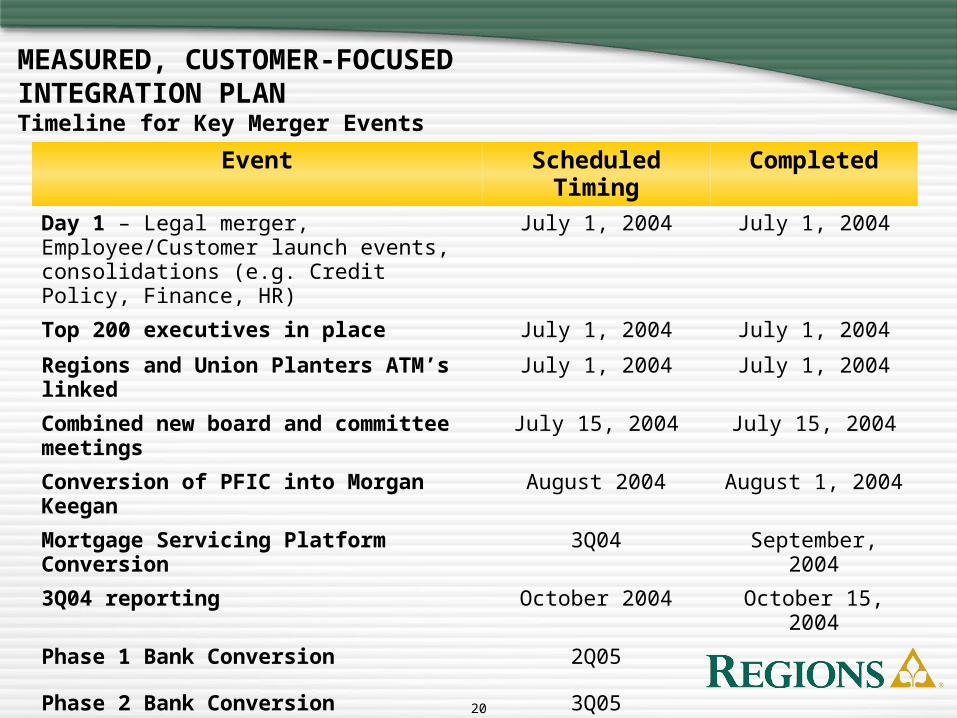
Event Scheduled Timing Completed
Day 1 – Legal merger, Employee/Customer launch events, consolidations (e.g. Credit Policy, Finance, HR)
July 1, 2004 July 1, 2004
Top 200 executives in place July 1, 2004 July 1, 2004
Regions and Union Planters ATM’s linked July 1, 2004 July 1, 2004
Combined new board and committee meetings
July 15, 2004 July 15, 2004
Conversion of PFIC into Morgan Keegan August 2004 August 1, 2004
Mortgage Servicing Platform Conversion 3Q04 September, 2004
3Q04 reporting October 2004 October 15, 2004
Phase 1 Bank Conversion 2Q05
Phase 2 Bank Conversion 3Q05
Phase 3 Bank Conversion 4Q05
MEASURED, CUSTOMER-FOCUSED INTEGRATION PLANTimeline for Key Merger Events
21
REGIONS FINANCIAL CORPORATION
Regions/Union Planters merger offers numerous opportunities
Merger is on track and going well
Regions is positioned for growth in earnings and increasing shareholder value
Excited about 2005 and beyond