Forward-looking Statement · 2 Forward-looking Statement Certain statements contained in this...
34
1
Transcript of Forward-looking Statement · 2 Forward-looking Statement Certain statements contained in this...

1

2
Forward-looking Statement
Certain statements contained in this document may be viewed as “forward-
looking statements” within the meaning of Section 27A of the U.S. Securities Act of 1933, as amended, and Section 21E of the U.S. Securities Exchange Act of 1934, as amended. Such forward-looking statements involve known and
unknown risks, uncertainties and other factors, which may cause the actual performance, financial condition or results of operations of China Mobile Limited (the “Company”) to be materially different from those implied by such
forward-looking statements. In addition, we do not intend to update these forward-looking statements. Further information regarding these risks, uncertainties and other factors is included in the Company’s most recent
Annual Report on Form 20-F filed and other filings with the U.S. Securities and Exchange Commission.

3
Management Present
Mr. SHANG Bing Executive Director & Chairman
Mr. LI Yue Executive Director & CEO
Mr. SHA Yuejia Executive Director & Vice President
Executive Director, Vice President & CFO Mr. DONG Xin

4
Agenda
01
02
03
Operating Performance
Financial Results
Overall Results and Outlook
5
01 Overall Results
and Outlook
Mr. SHANG Bing
Executive Director & Chairman
6
Highlights
Outstanding operating results
Enhanced shareholder returns
Continuously creating value for shareholders with 2017 full-year dividend payout ratio rising to 48%
Industry-leading revenue growth rate with stable-to-rising profitability
Effective strategy implementation
Underpinned development capabilities
Solidly implementing the “Big Connectivity” strategy with the “four growth engines” achieving remarkable results
Constantly enhancing development capabilities and sustainability with an ongoing boost to investment efficiency

7
Key Performance Indicators
(RMB Mil) 2016 2017 Change YoY
Operating revenue 708,421 740,514 4.5%
of which: service revenue 623,422 668,351 7.2%
EBITDA 256,677 270,421 5.4%
EBITDA margin 36.2% 36.5% 0.3pp
EBITDA as % of service revenue 41.2% 40.5% -0.7pp
Net profit 108,741 114,279 5.1%
Net profit margin 15.3% 15.4% 0.1pp
Basic earnings per share (RMB) 5.31 5.58 5.1%
8
2016 2017
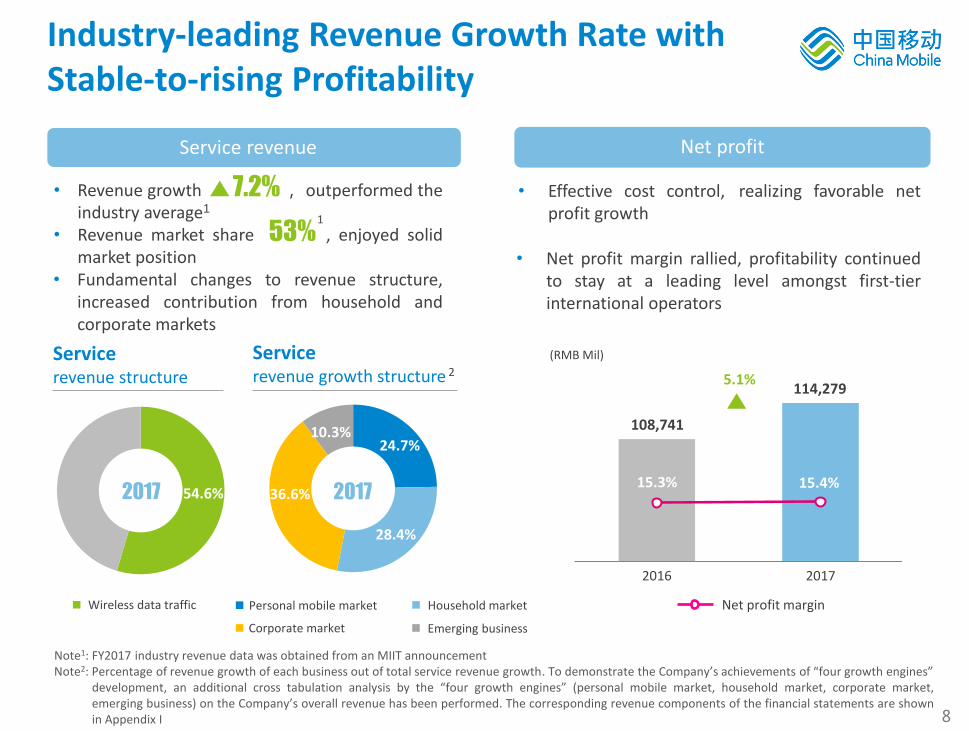
• Effective cost control, realizing favorable net profit growth
Industry-leading Revenue Growth Rate with Stable-to-rising Profitability
Service revenue
• Revenue growth , outperformed the industry average1
• Revenue market share , enjoyed solid market position
7.2%
Net profit
53% 1
114,279 5.1%
108,741
15.3% 15.4% 2017
Wireless data traffic
24.7%
2017
28.4%
10.3%
36.6%
Service revenue growth structure 2
Service revenue structure
Net profit margin
(RMB Mil)
Note1: FY2017 industry revenue data was obtained from an MIIT announcement Note2: Percentage of revenue growth of each business out of total service revenue growth. To demonstrate the Company’s achievements of “four growth engines”
development, an additional cross tabulation analysis by the “four growth engines” (personal mobile market, household market, corporate market, emerging business) on the Company’s overall revenue has been performed. The corresponding revenue components of the financial statements are shown in Appendix I
Personal mobile market
Corporate market
Household market
Emerging business
• Fundamental changes to revenue structure, increased contribution from household and corporate markets
54.6%
• Net profit margin rallied, profitability continued to stay at a leading level amongst first-tier international operators
9
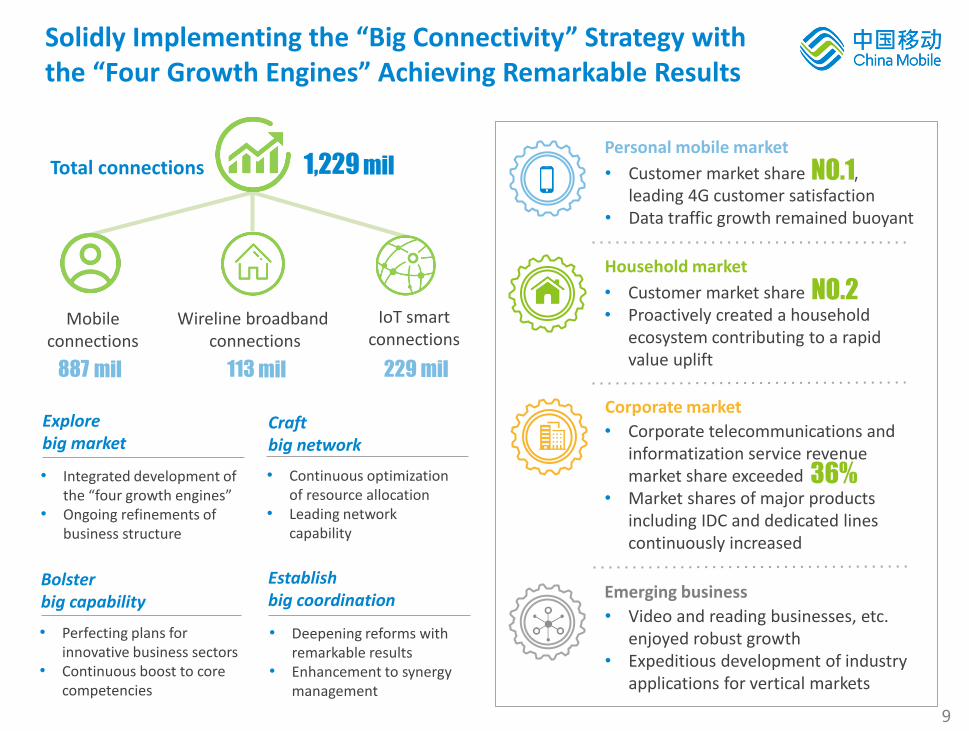
Solidly Implementing the “Big Connectivity” Strategy with the “Four Growth Engines” Achieving Remarkable Results
Mobile connections
887 mil 229 mil 113 mil
Personal mobile market
Household market
Corporate market
Emerging business
Total connections 1,229 mil
Wireline broadband connections
IoT smart connections
Explore big market
Craft big network
Establish big coordination
Bolster big capability
• Integrated development of the “four growth engines”
• Ongoing refinements of business structure
• Continuous optimization of resource allocation
• Leading network capability
• Perfecting plans for innovative business sectors
• Continuous boost to core competencies
• Deepening reforms with remarkable results
• Enhancement to synergy management
• Customer market share , leading 4G customer satisfaction
• Data traffic growth remained buoyant
NO.1
• Customer market share • Proactively created a household
ecosystem contributing to a rapid value uplift
NO.2
• Corporate telecommunications and informatization service revenue market share exceeded
• Market shares of major products including IDC and dedicated lines continuously increased
36%
• Video and reading businesses, etc. enjoyed robust growth
• Expeditious development of industry applications for vertical markets

10
2016 2017 2018E
177.5 166.1
CAPEX
-5.2%
Constantly Enhancing Development Capabilities and Sustainability with an Ongoing Boost to Investment Efficiency
187.3
30.0% 26.6%
Major components
2017
2018E
(RMB Bil)
CAPEX as % of service revenue
• 1.87 mil 4G base stations, industry-leading network quality satisfaction
• Leap in transmission capacity, proportion of customers with fibre access exceeded 98%, CDN covered 340 cities in China
• NB-IoT launched in 346 cities, achieving end-to-end scale commercial use
• Rising proportion of cloud-based IT system with enhanced supporting capability
• Continuously enhance 4G network quality and VoLTE customer experience
• Construct a full-fibre broadband network as a move to further popularize 100Mbps products and aim for the 1,000Mbps target
• Extend continuous NB-IoT network coverage to all cities at county-level and above in China
• Propel NFV/SDN network transformation and upgrade, perform 5G scale tests and application demonstrations
2017 2018E
4G 65.7 58.5
Household broadband access
18.4 7.4
Transmission (excluding access part)
49.7 44.5
(RMB Bil)
-6.4%

11
2016 2017 2017(including special
dividend)
Continuously Creating Value for Shareholders
2018 Dividend policy Dividend per share
2.732
46% 48%
3.205
6.405 Taking into account the Company’s financial position, its ability to generate cash flow and its capital demands for future development, the Company will maintain a stable dividend payout ratio for 2018 and strive to attain a stable-to-rising dividend payout ratio, while also securing the Company’s development and maintaining shareholder value in the longer-term
Dividend payout ratio
(HKD)
17.3%
12
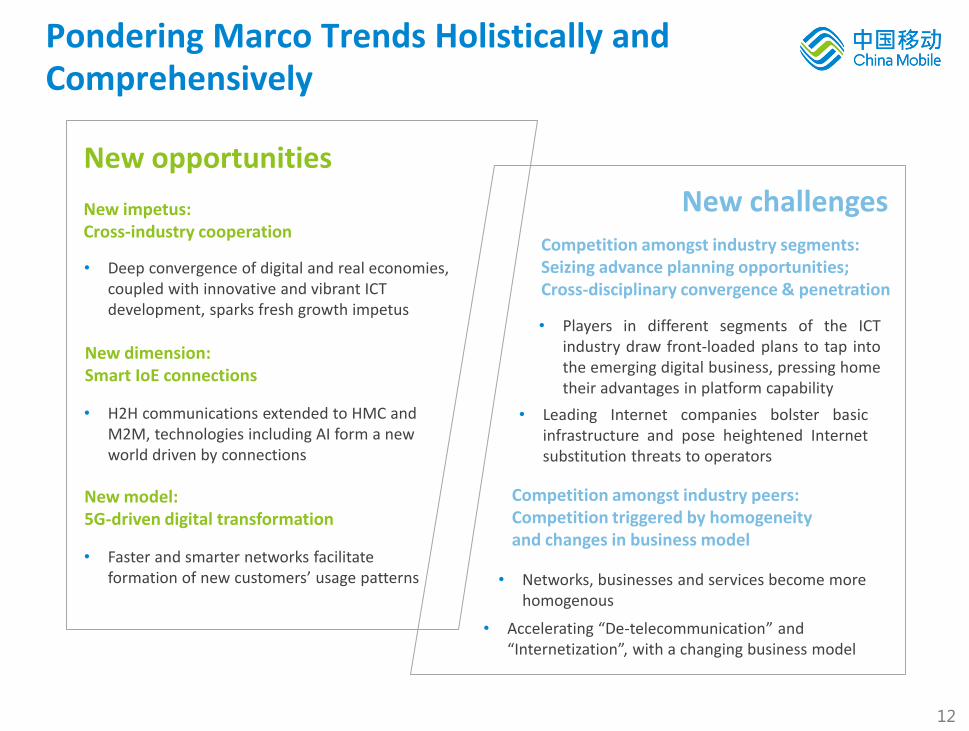
Pondering Marco Trends Holistically and Comprehensively
New opportunities
New challenges
Competition amongst industry peers: Competition triggered by homogeneity and changes in business model
Competition amongst industry segments: Seizing advance planning opportunities; Cross-disciplinary convergence & penetration
• Leading Internet companies bolster basic infrastructure and pose heightened Internet substitution threats to operators
• Accelerating “De-telecommunication” and “Internetization”, with a changing business model
• Players in different segments of the ICT industry draw front-loaded plans to tap into the emerging digital business, pressing home their advantages in platform capability
• Networks, businesses and services become more homogenous
New model: 5G-driven digital transformation
• Deep convergence of digital and real economies, coupled with innovative and vibrant ICT development, sparks fresh growth impetus
• Faster and smarter networks facilitate formation of new customers’ usage patterns
New impetus: Cross-industry cooperation
• H2H communications extended to HMC and M2M, technologies including AI form a new world driven by connections
New dimension: Smart IoE connections
13
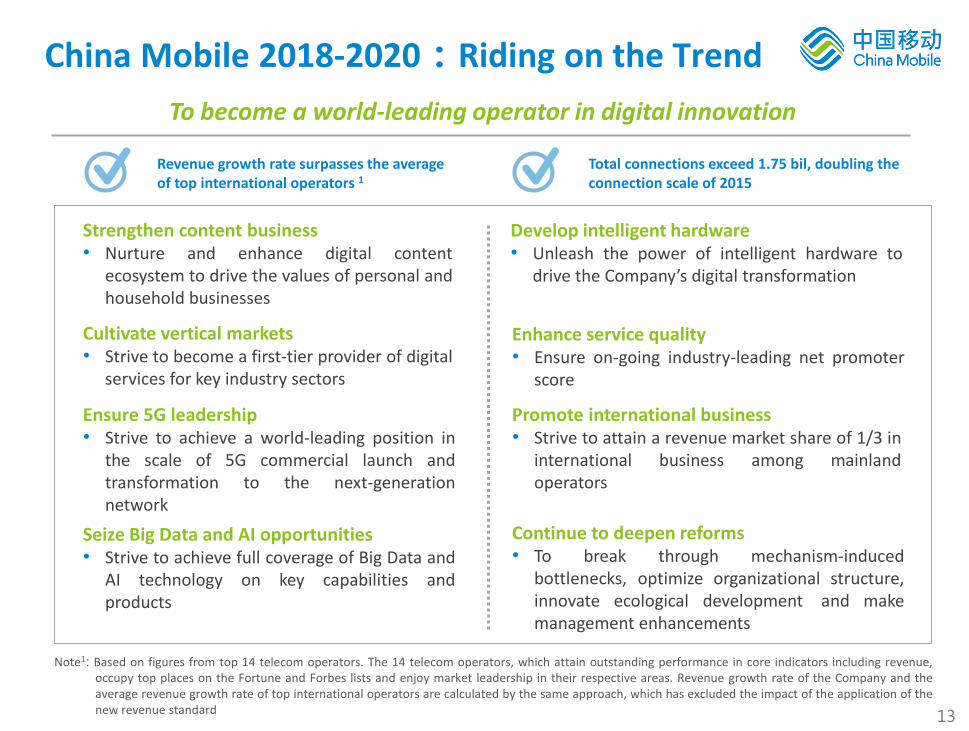
China Mobile 2018-2020:Riding on the Trend
Strengthen content business • Nurture and enhance digital content
ecosystem to drive the values of personal and household businesses
Cultivate vertical markets • Strive to become a first-tier provider of digital
services for key industry sectors
Ensure 5G leadership • Strive to achieve a world-leading position in
the scale of 5G commercial launch and transformation to the next-generation network
Seize Big Data and AI opportunities • Strive to achieve full coverage of Big Data and
AI technology on key capabilities and products
Develop intelligent hardware • Unleash the power of intelligent hardware to
drive the Company’s digital transformation
Enhance service quality • Ensure on-going industry-leading net promoter
score
Promote international business • Strive to attain a revenue market share of 1/3 in
international business among mainland operators
Continue to deepen reforms • To break through mechanism-induced
bottlenecks, optimize organizational structure, innovate ecological development and make management enhancements
To become a world-leading operator in digital innovation
Revenue growth rate surpasses the average of top international operators 1
Total connections exceed 1.75 bil, doubling the connection scale of 2015
Note1: Based on figures from top 14 telecom operators. The 14 telecom operators, which attain outstanding performance in core indicators including revenue, occupy top places on the Fortune and Forbes lists and enjoy market leadership in their respective areas. Revenue growth rate of the Company and the average revenue growth rate of top international operators are calculated by the same approach, which has excluded the impact of the application of the new revenue standard

14
02 Operating Performance
Mr. LI Yue
Executive Director & CEO

15
(RMB Mil) 2017 Change YoY As % of revenue2
Service revenue1 668,351 7.2% 100.0%
1. Personal mobile market revenue 518,317 2.2% 77.6%
of which:handset data traffic 347,329 27.0% 52.0%
voice, SMS & MMS 154,836 -27.7% 23.2%
2. Household market revenue 35,271 56.6% 5.3%
3. Corporate market revenue 67,628 32.1% 10.1%
of which:corporate wireless data traffic
16,043 63.2% 2.4%
corporate voice, SMS & MMS
27,787 24.6% 4.2%
Dedicated lines, IDC 19,614 40.4% 2.9%
4. Emerging business revenue 47,135 10.9% 7.0%
Revenue Structure of the “Four Growth Engines”
Note2: Refers to % of service revenue
Note1: To demonstrate the Company’s achievements of “four growth engines” development, an additional cross tabulation analysis by the “four growth engines” (personal mobile market, household market, corporate market, emerging business) on the Company’s overall revenue has been performed. The corresponding revenue components of the financial statements are shown in Appendix I
16
4G customers NPS
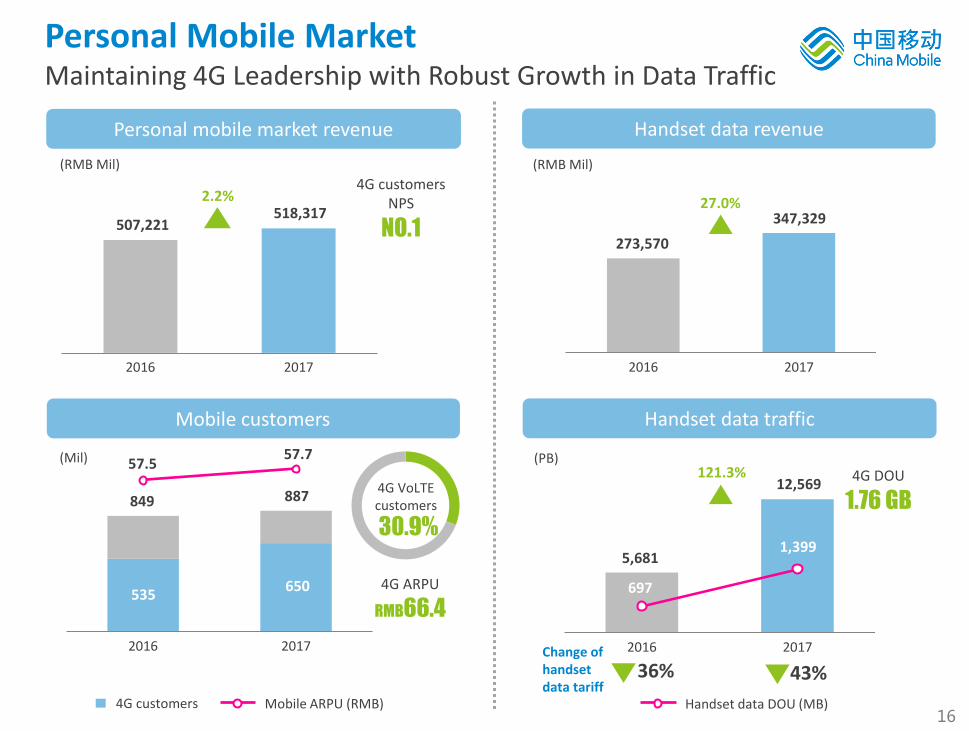
Personal Mobile Market Maintaining 4G Leadership with Robust Growth in Data Traffic
Mobile customers
2016 2017
849 887
535 650
4G customers
57.5 57.7
2016 2017
Handset data traffic
(PB) 4G DOU
5,681
12,569 121.3%
697
1,399
2016 2017
Personal mobile market revenue
2.2%
507,221 518,317
1.76 GB 30.9%
4G VoLTE customers
NO.1
2016 2017
Handset data revenue
27.0% 347,329
273,570
4G ARPU
RMB66.4
Handset data DOU (MB)
(RMB Mil) (RMB Mil)
Mobile ARPU (RMB)
43% 36% Change of handset data tariff
(Mil)

17
2016 2017
68.1%
2016 2017
Household Market Dual breakthroughs in Value and Scale
22,523
35,271 56.6%
Household broadband blended ARPU1 (RMB)
Household market revenue Household broadband customers
≥50Mbps
74.46
28.3
33.3
(Mil)
Market share
• Committed to boosting network speed and quality with a focus on targeted development, revenue from the household market grew rapidly
(RMB Mil)
• Household broadband customer market share , household broadband blended ARPU1 increased by yoy, proportion of high-value customers increased
NO.2
• Created an integrated household ecosystem, promoted new family multi-media and digital surveillance products including “Mobaihe” (home digital set-top box), “Smart gateway” and “and-Mu” (family surveillance camera)
Note1: Household broadband blended ARPU = (revenue of household broadband business+ household revenue from emerging business) / average number of household broadband customers. Household revenue from emerging business mainly consists of revenue from Mobaihe. Wireline broadband ARPU, which includes revenues of household broadband business and Internet dedicated lines, stood at RMB35.1
17.5%
30%
37%
109.40
18
Dedicated Lines
IDC
IoT
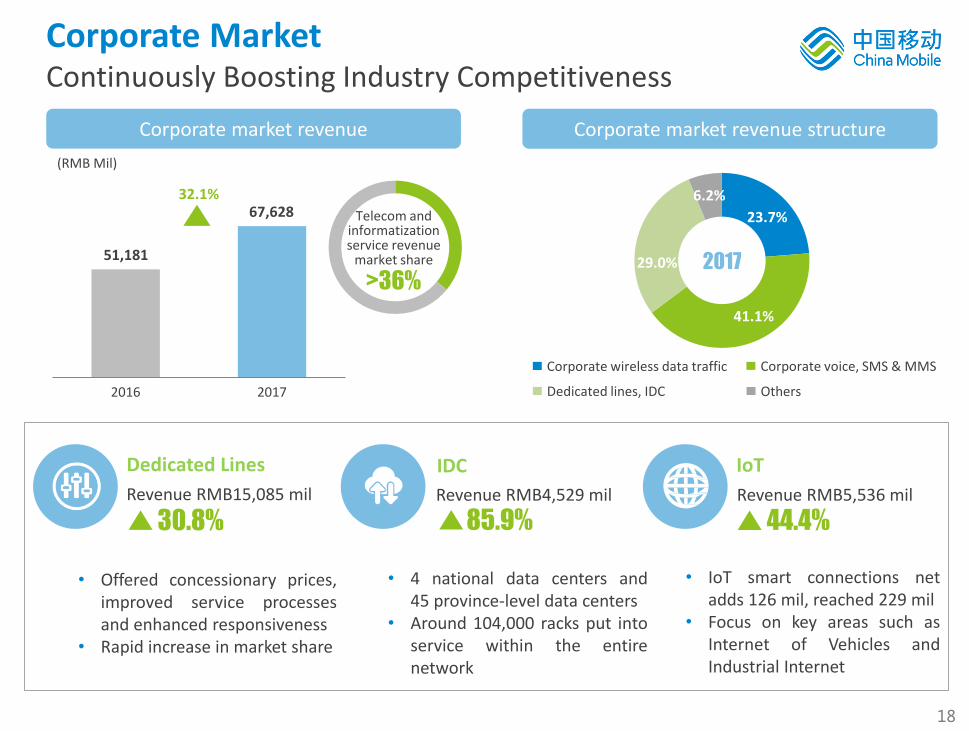
30.8% 85.9% 44.4%
Revenue RMB5,536 mil
Corporate market revenue
32.1%
Corporate market revenue structure
Corporate Market Continuously Boosting Industry Competitiveness
2017
(RMB Mil)
Telecom and informatization service revenue
market share
Revenue RMB4,529 mil Revenue RMB15,085 mil
• Offered concessionary prices, improved service processes and enhanced responsiveness
• Rapid increase in market share
• 4 national data centers and 45 province-level data centers
• Around 104,000 racks put into service within the entire network
• IoT smart connections net adds 126 mil, reached 229 mil
• Focus on key areas such as Internet of Vehicles and Industrial Internet
2016 2017
51,181
67,628
>36%
6.2%
29.0%
23.7%
41.1%
6.2%
Corporate voice, SMS & MMS
Dedicated lines, IDC Others
Corporate wireless data traffic
29.0%

19
74.2%
2017
2016 2017
Emerging Business Expanding the Scale of Digital Business
Emerging business revenue
10.9%
42,495
Personal Household Corporate
47,135 17.4%
8.4%
Emerging business revenue structure
“and-Video” revenue
“and-Reading” revenue
Transaction amount > RMB2,100
10.3%
67.2%
Mobaihe
Customers mil
34.45
Revenue 179.3%
Industrial Informatization Solutions
industry applications with respective annual revenue > RMB100 mil
9
“and-Education”
MIGU
and-Wallet
Penetration >
(RMB Mil)
Public Administration
Finance Transportation Healthcare Education Industry Agriculture
Note: The personal, household and corporate revenues as shown above are non-channel type revenues
bil
RMB 4.0 bil 52.3%
annual revenue >
20
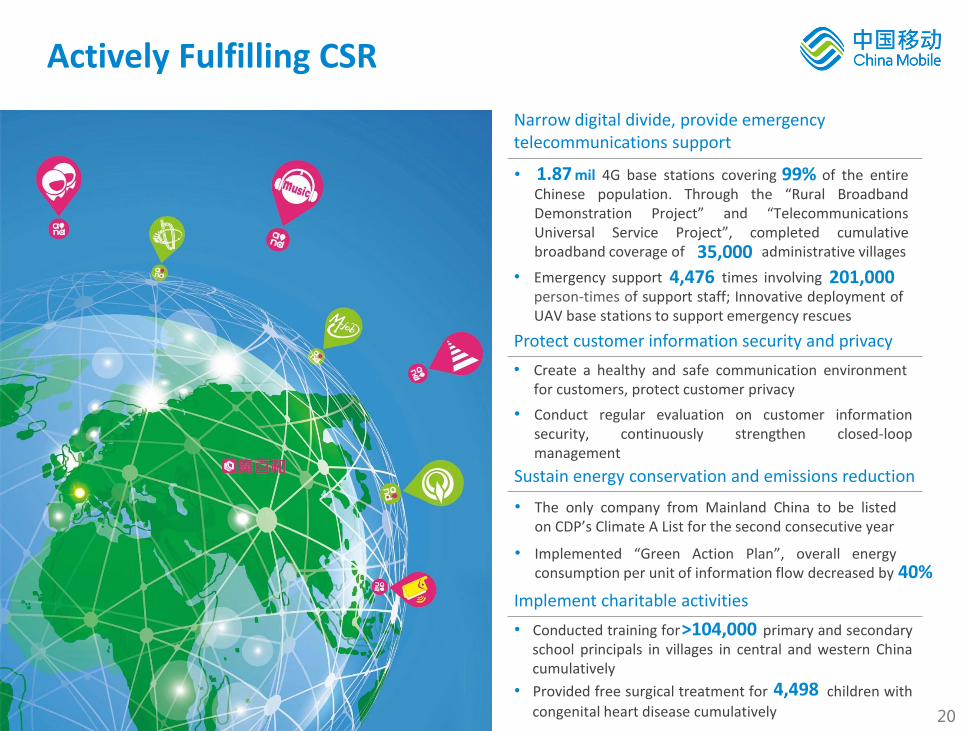
Narrow digital divide, provide emergency telecommunications support
40%
• mil 4G base stations covering of the entire Chinese population. Through the “Rural Broadband Demonstration Project” and “Telecommunications Universal Service Project”, completed cumulative broadband coverage of administrative villages
• Conducted training for primary and secondary school principals in villages in central and western China cumulatively
• Provided free surgical treatment for children with
congenital heart disease cumulatively
Implement charitable activities
Sustain energy conservation and emissions reduction
• The only company from Mainland China to be listed on CDP’s Climate A List for the second consecutive year
• Implemented “Green Action Plan”, overall energy consumption per unit of information flow decreased by
>104,000
4,498
Protect customer information security and privacy
Actively Fulfilling CSR
• Emergency support times involving . person-times of support staff; Innovative deployment of UAV base stations to support emergency rescues
4,476
• Create a healthy and safe communication environment for customers, protect customer privacy
201,000
1.87
35,000
• Conduct regular evaluation on customer information security, continuously strengthen closed-loop management
99%
21
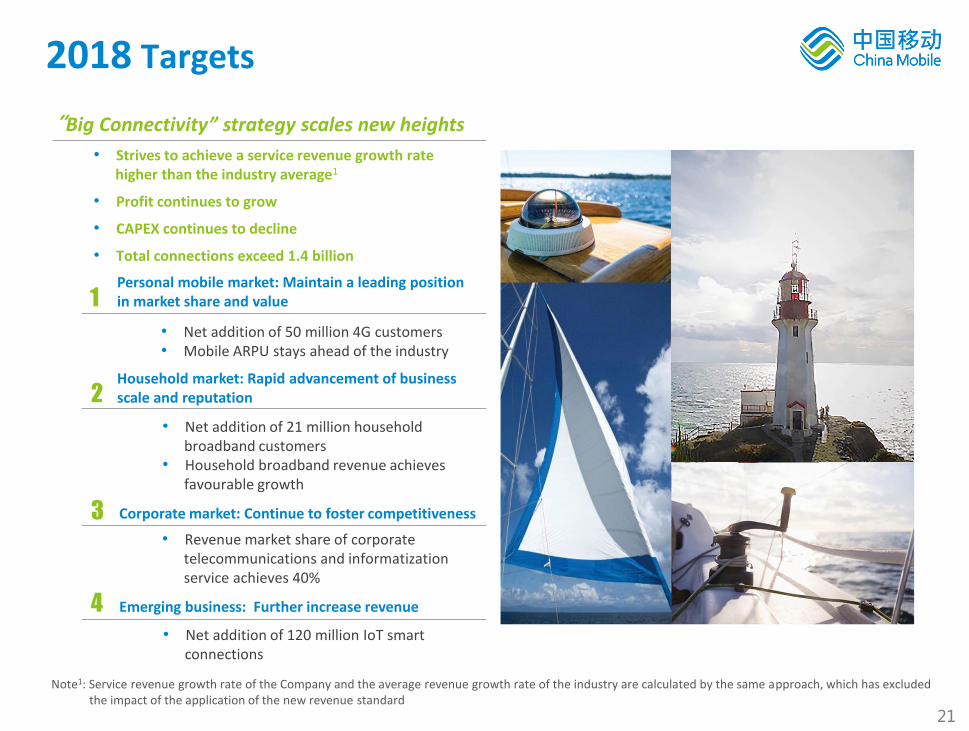
2018 Targets
1
2
4
3
• Net addition of 21 million household broadband customers • Household broadband revenue achieves favourable growth
• Net addition of 120 million IoT smart connections
• Net addition of 50 million 4G customers • Mobile ARPU stays ahead of the industry
Personal mobile market: Maintain a leading position in market share and value
Household market: Rapid advancement of business scale and reputation
Emerging business: Further increase revenue
• Strives to achieve a service revenue growth rate higher than the industry average1
• Profit continues to grow
• CAPEX continues to decline
• Total connections exceed 1.4 billion
“Big Connectivity” strategy scales new heights
Corporate market: Continue to foster competitiveness
• Revenue market share of corporate telecommunications and informatization service achieves 40%
Note1: Service revenue growth rate of the Company and the average revenue growth rate of the industry are calculated by the same approach, which has excluded the impact of the application of the new revenue standard
22
Financial Results
Mr. DONG Xin
Executive Director, Vice President & CFO
03
23
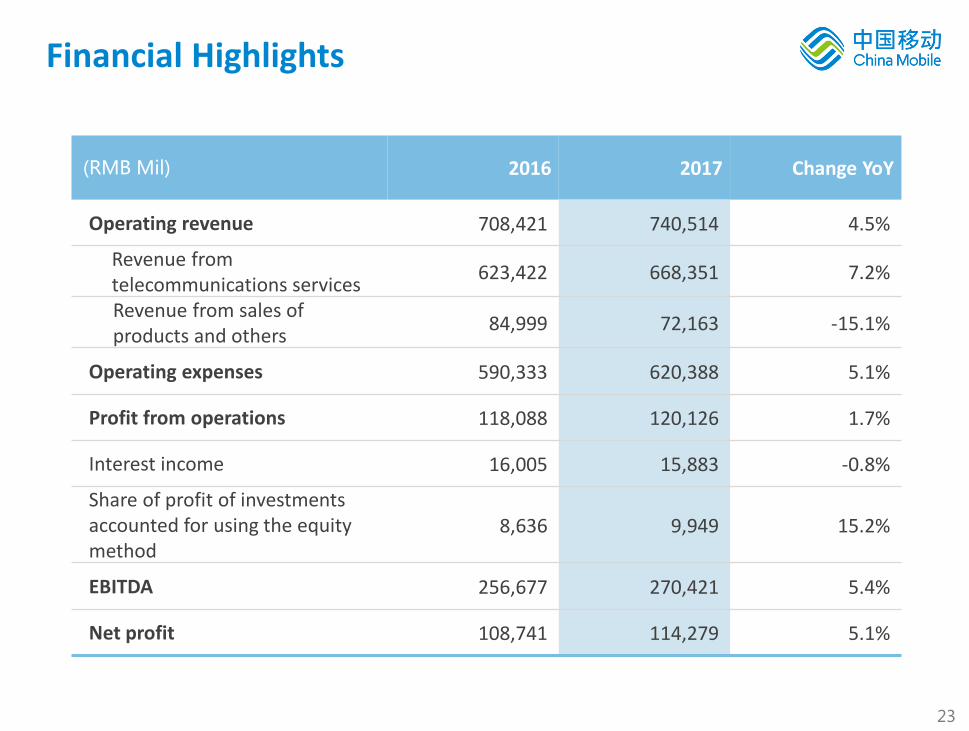
(RMB Mil) 2016 2017 Change YoY
Operating revenue 708,421 740,514 4.5%
Revenue from telecommunications services
623,422 668,351 7.2%
Revenue from sales of products and others
84,999 72,163 -15.1%
Operating expenses 590,333 620,388 5.1%
Profit from operations 118,088 120,126 1.7%
Interest income 16,005 15,883 -0.8%
Share of profit of investments accounted for using the equity method
8,636 9,949 15.2%
EBITDA 256,677 270,421 5.4%
Net profit 108,741 114,279 5.1%
Financial Highlights

24
Note: % of revenue from telecommunications services
2017 2.7%
Revenue from telecommunications services
Voice
Wireless data traffic
Applications and
information services
2017 2016 Others SMS & MMS
(RMB Mil)
-453
668,351 8,069
-53,031
623,422 76,728
-497
Wireline broadband
14,113
2017 2016 2015
SMS & MMS revenue 4.2% 4.6% 5.2%
Wireless data traffic revenue 54.6% 46.2% 34.5%
Wireline broadband services revenue
5.9% 4.1% 3.1%
Applications and information services revenue
9.1% 8.4% 9.2%
Data services revenue 73.8% 63.3% 52.0%
Refined Revenue Structure
Data services Voice services Others
73.8%
23.5%
25
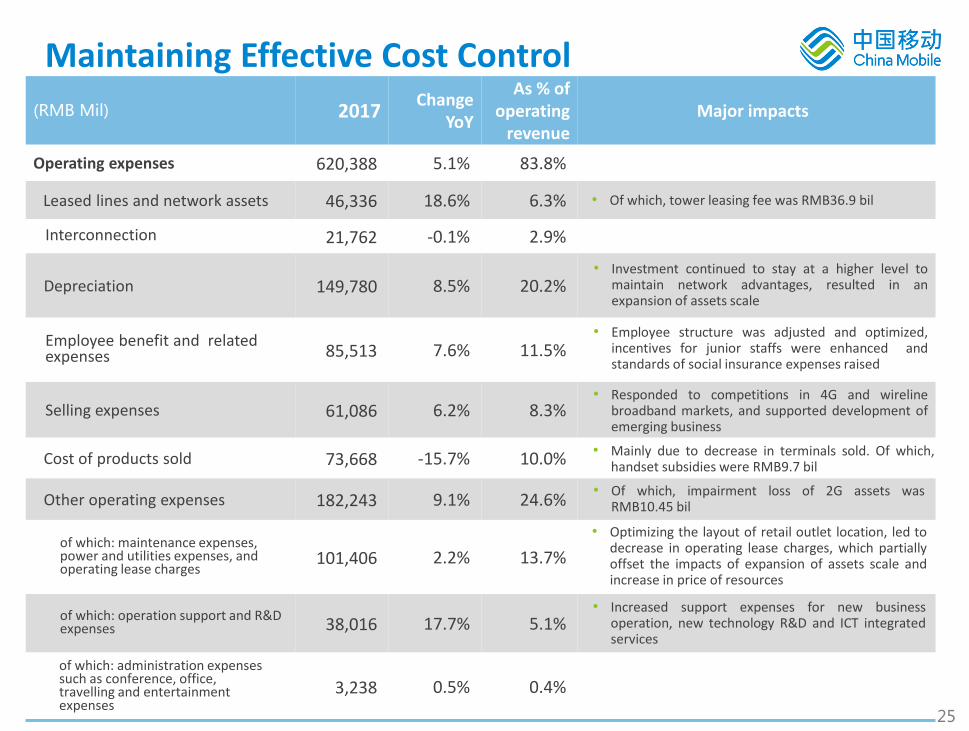
(RMB Mil) 2017 Change
YoY
As % of operating
revenue Major impacts
Operating expenses 620,388 5.1% 83.8%
Leased lines and network assets 46,336 18.6% 6.3%
Interconnection 21,762 -0.1% 2.9%
Depreciation 149,780 8.5% 20.2%
Employee benefit and related expenses 85,513 7.6% 11.5%
Selling expenses 61,086 6.2% 8.3%
Cost of products sold 73,668 -15.7% 10.0%
Other operating expenses 182,243 9.1% 24.6%
of which: maintenance expenses, power and utilities expenses, and operating lease charges
101,406 2.2% 13.7%
of which: operation support and R&D expenses 38,016 17.7% 5.1%
of which: administration expenses such as conference, office, travelling and entertainment expenses
3,238 0.5% 0.4%
Maintaining Effective Cost Control
• Of which, tower leasing fee was RMB36.9 bil
• Investment continued to stay at a higher level to maintain network advantages, resulted in an expansion of assets scale
• Employee structure was adjusted and optimized, incentives for junior staffs were enhanced and standards of social insurance expenses raised
• Responded to competitions in 4G and wireline broadband markets, and supported development of emerging business
• Mainly due to decrease in terminals sold. Of which, handset subsidies were RMB9.7 bil
• Increased support expenses for new business operation, new technology R&D and ICT integrated services
• Optimizing the layout of retail outlet location, led to decrease in operating lease charges, which partially offset the impacts of expansion of assets scale and increase in price of resources
• Of which, impairment loss of 2G assets was RMB10.45 bil
26
2016 2017 2018E
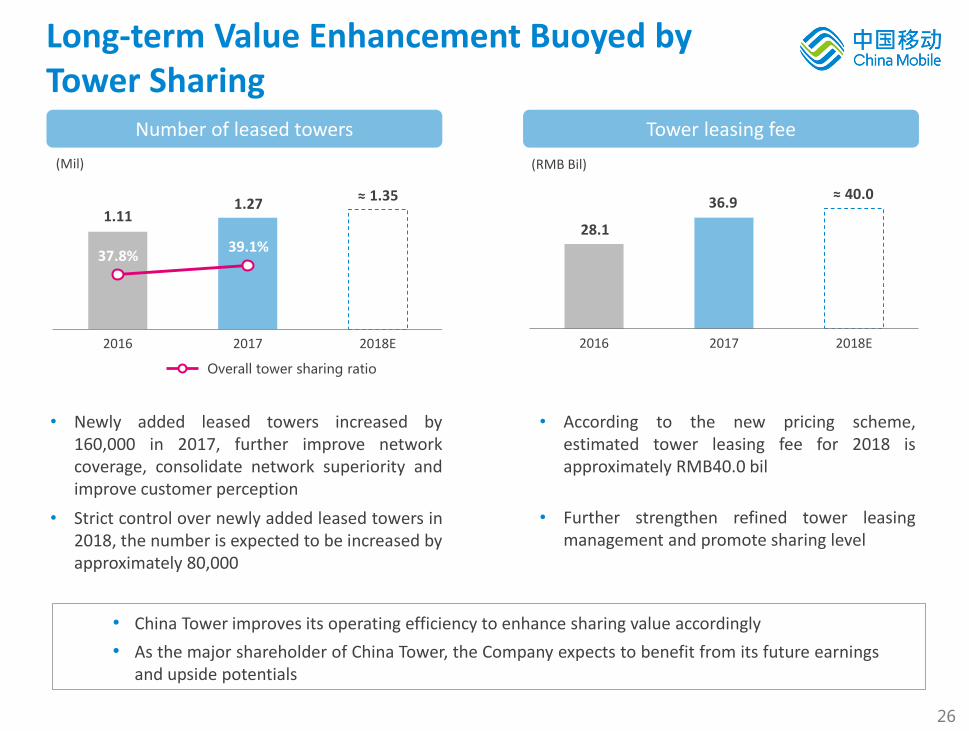
Long-term Value Enhancement Buoyed by Tower Sharing
(Mil)
Number of leased towers
37.8% 39.1%
Overall tower sharing ratio
2016 2017 2018E
(RMB Bil)
Tower leasing fee
• Newly added leased towers increased by 160,000 in 2017, further improve network coverage, consolidate network superiority and improve customer perception
• China Tower improves its operating efficiency to enhance sharing value accordingly
• As the major shareholder of China Tower, the Company expects to benefit from its future earnings and upside potentials
• According to the new pricing scheme, estimated tower leasing fee for 2018 is approximately RMB40.0 bil
• Strict control over newly added leased towers in 2018, the number is expected to be increased by approximately 80,000
• Further strengthen refined tower leasing management and promote sharing level
28.1
40.0 36.9 1.35 ≈ ≈
1.27 1.11

27
Sustaining Strong Cash Flow
• With revenue growth and cost control, profitability maintained steady growth,
EBITDA recorded a favourable increase, cash flow remained strong
2016 2017
67,981
(RMB Mil)
Free cash flow
66,410 2.4%
Note: The Company defines free cash flow as net cash generated from operating activities less capital expenditure incurred
2016 2017
5.4%
(RMB Mil)
EBITDA
41.2% 40.5%
36.2% 36.5%
270,421 256,677
EBITDA / revenue from telecommunications services
EBITDA margin
28
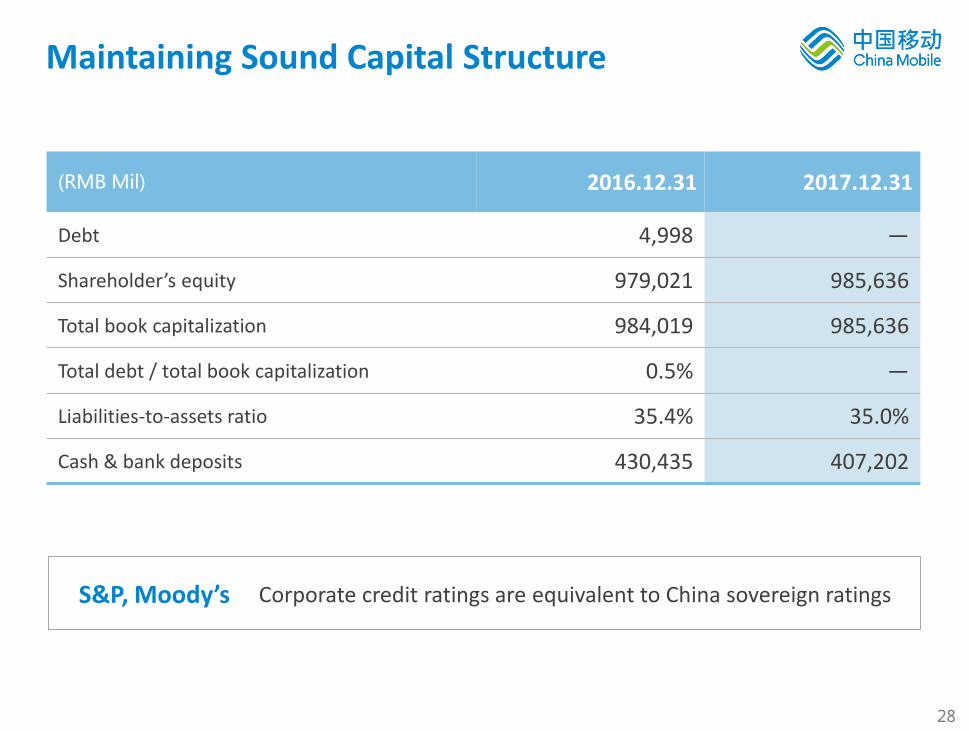
(RMB Mil) 2016.12.31 2017.12.31
Debt 4,998 —
Shareholder’s equity 979,021 985,636
Total book capitalization 984,019 985,636
Total debt / total book capitalization 0.5% —
Liabilities-to-assets ratio 35.4% 35.0%
Cash & bank deposits 430,435 407,202
Maintaining Sound Capital Structure
Corporate credit ratings are equivalent to China sovereign ratings S&P, Moody’s
29
Thank you!
“Corporate Governance Excellence Awards 2017”
“The Chamber of Hong Kong Listed Companies”
“National Science and Technology Progress Awards”
“Outstanding Prize on the TD-LTE key technology and application for 4G project”
“Sustainability Excellence Awards 2017”
“Asia’s Icon on Corporate Governance”
“Asian Corporate Director Recognition Award”
“The Asset Platinum Award”
《The Asset》
《Corporate Governance Asia》
“Asia’s Best Investor Relations Company”
“Asia’s Best CEO”
For more information, please contact:
Investor Relations Department: [email protected]
Or visit the Company’s website: www.chinamobileltd.com

30
2.1 SMS &MMS revenue - Personal 2.2 SMS &MMS revenue - Corporate
Revenue from Telecommunications Services - Financial Statement and “Four Growth Engines” Mapping – Appendix I
Financial Statement
1. Voice services revenue
Data services revenue
of which: 2. SMS & MMS
3. Wireless data traffic
4. Wireline broadband
5. Applications and information services
6. Other revenue
“Four Growth Engines”
I. Personal mobile market revenue
=1.1+2.1+3.1+6.1
II. Household market revenue
=1.2+3.2+4.1+6.2
III. Corporate market revenue
=1.3+2.2+3.3+4.2+5.4+6.3
IV. Emerging business revenue
=5.1+5.2+5.3+6.4
1.1 Voice services revenue - Personal 1.2 Fixed-line revenue - Household 1.3 Voice services revenue - Corporate
3.1 Wireless data traffic revenue - Personal 3.2 Wireless data traffic revenue - Household 3.3 Wireless data traffic revenue - Corporate
4.1 Wireline broadband revenue - Household 4.2 Internet access revenue - Corporate
5.1 Applications and information services - Personal 5.2 Applications and information services - Household 5.3 Applications and information services - Corporate 5.4 IDC, network resource services
6.1 Interconnection revenue - Personal 6.2 Interconnection revenue - Household 6.3 Interconnection revenue - Corporate 6.4 Technical support and services revenue
1
2
3
4
5
6
Note: To demonstrate the Company’s achievements of “four growth engines” development, revenue from telecommunications services are separated into two categories, “channel” revenue and “non-channel” revenue by business nature. “Channel” revenue includes personal mobile, household and corporate markets according to customer nature. “Non-channel” revenue is emerging business market revenue. All these above constitute the “four growth engines”

31
New Revenue Standard (IFRS 15) Interpretation – Appendix II
Principal model bundle package
Subsidies to agents bundle package
Points reward
Sales commissions
Sales commissions which qualify as incremental cost and of which the benefit period is over one year will be capitalized when sales commissions occur and then amortized evenly throughout the benefit period
Revenue from points reward and E-Coupon will be deferred at the date of grant, and the classification of revenue is depending on the type of goods or services being exchanged at the date of redemption: 1. exchanging for telecom services provided by the Company,
recognized as revenue from telecommunications services 2. exchanging for goods or non-telecom services of the
Company, recognize as revenue from sales of products and others
3. exchanging for goods or services of 3rd parties, revenue from telecommunications services will be net off
Subsidies to agents will net off revenue from telecommunications services evenly throughout the contract period
Allocate revenue to telecommunications services and handsets on relative stand-alone selling price basis
Major accounting event Accounting method under original revenue standard Accounting method under new revenue standard
Selling expense is recognized when sales commissions occur
Revenue recognition is deferred when points reward is granted, and revenue is recognized when points reward is redeemed
Subsidies to agents are recognized as handset subsidies
Adopt residual value approach, determine the revenue from the sale of the mobile handset by deducting the fair value of the service element from the total contract consideration
• According to the static impact assessment based on the Company’s business structure in 2017, the Company expected the operating revenue would decrease by approximately 2.2% while the revenue from telecommunications services would decrease by approximately 3.2% in 2017
• The new standard has little effect on profit from operations in the long run
Note: The International Accounting Standards Board published <International Financial Reporting Standard 15 — Revenue from Contracts with Customers>(IFRS 15) in May 2014 . The Company adopts IFRS 15 in accounting and disclosure since 1 Jan 2018. Please refer to 2017 Annual Report for the introduction to the new revenue standard
E-coupon Selling expense is recognized when E-coupon is granted

32
Extracts from Audited Consolidated Statement of Comprehensive Income for the Year Ended 31 December 2017 – Appendix III
(RMB Mil) 2016 2017
Operating revenue 708,421 740,514
Revenue from telecommunications services
623,422 668,351
Voice services 209,949 156,918
Data services 394,937 493,350
Others 18,536 18,083
Revenue from sales of products and others
84,999 72,163
Operating expenses 590,333 620,388
Leased lines and network assets
39,083 46,336
Interconnection 21,779 21,762
Depreciation 138,090 149,780
Employee benefit and related expenses
79,463 85,513
Selling expenses 57,493 61,086
Cost of products sold 87,352 73,668
Other operating expenses 167,073 182,243
(RMB Mil) 2016 2017
Profit from operations 118,088 120,126
Other gains 1,968 2,389
Interest income 16,005 15,883
Finance costs (235) (210)
Share of profit of investments accounted for using the equity method
8,636 9,949
Taxation (35,623) (33,723)
Profit for the year 108,839 114,414
Profit attributable to:
Equity shareholders of the Company
108,741 114,279
Non-controlling interests 98 135
Profit for the year 108,839 114,414

33
Extracts from Audited Consolidated Balance Sheet as at 31 December 2017 – Appendix IV
(RMB Mil) 2016.12.31 2017.12.31
Current assets 586,645 558,196
Non-current assets 934,349 963,917
Total assets 1,520,994 1,522,113
Current liabilities 536,389 529,982
Non-current liabilities 2,467 3,250
Total liabilities 538,856 533,232
Total equity 982,138 988,881
34
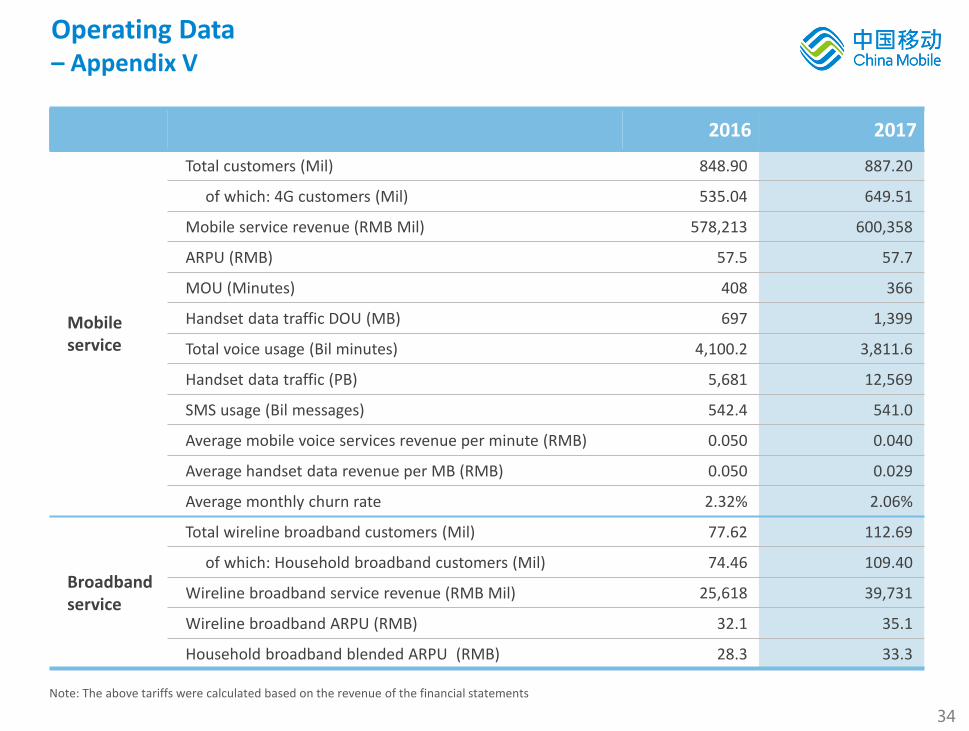
Operating Data – Appendix V
2016 2017
Mobile service
Total customers (Mil) 848.90 887.20
of which: 4G customers (Mil) 535.04 649.51
Mobile service revenue (RMB Mil) 578,213 600,358
ARPU (RMB) 57.5 57.7
MOU (Minutes) 408 366
Handset data traffic DOU (MB) 697 1,399
Total voice usage (Bil minutes) 4,100.2 3,811.6
Handset data traffic (PB) 5,681 12,569
SMS usage (Bil messages) 542.4 541.0
Average mobile voice services revenue per minute (RMB) 0.050 0.040
Average handset data revenue per MB (RMB) 0.050 0.029
Average monthly churn rate 2.32% 2.06%
Broadband service
Total wireline broadband customers (Mil) 77.62 112.69
of which: Household broadband customers (Mil) 74.46 109.40
Wireline broadband service revenue (RMB Mil) 25,618 39,731
Wireline broadband ARPU (RMB) 32.1 35.1
Household broadband blended ARPU (RMB) 28.3 33.3
Note: The above tariffs were calculated based on the revenue of the financial statements