November 10, 2017 Forward looking statements and non-GAAP measures Caution Regarding Forward-Looking...
31
November 10, 2017
Transcript of November 10, 2017 Forward looking statements and non-GAAP measures Caution Regarding Forward-Looking...

November 10, 2017
2
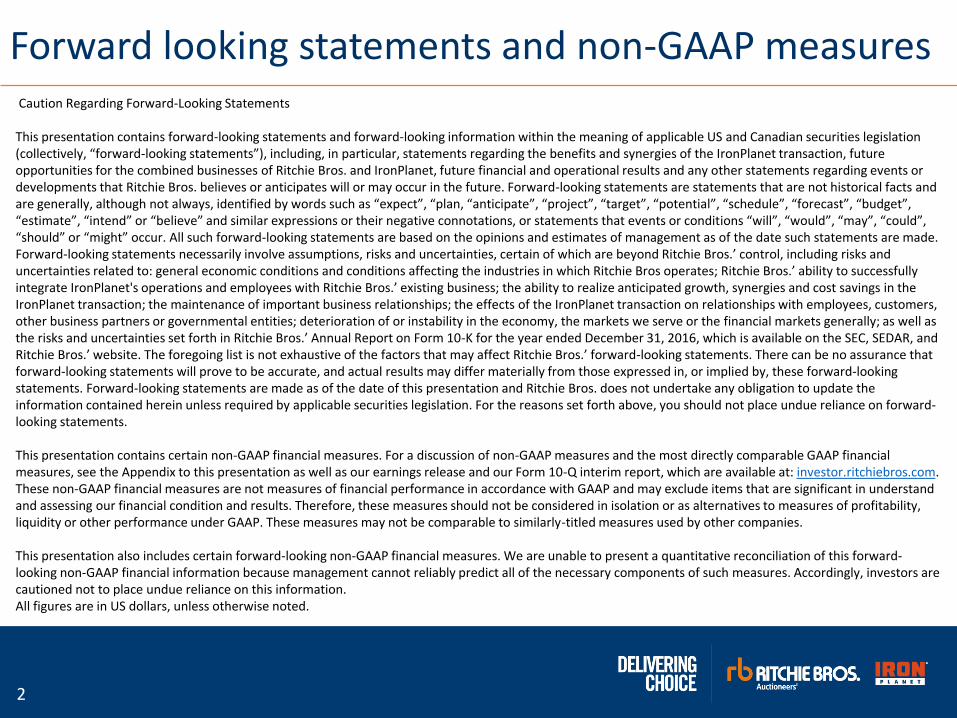
Forward looking statements and non-GAAP measuresCaution Regarding Forward-Looking Statements
This presentation contains forward-looking statements and forward-looking information within the meaning of applicable US and Canadian securities legislation (collectively, “forward-looking statements”), including, in particular, statements regarding the benefits and synergies of the IronPlanet transaction, future opportunities for the combined businesses of Ritchie Bros. and IronPlanet, future financial and operational results and any other statements regarding events or developments that Ritchie Bros. believes or anticipates will or may occur in the future. Forward-looking statements are statements that are not historical facts and are generally, although not always, identified by words such as “expect”, “plan, “anticipate”, “project”, “target”, “potential”, “schedule”, “forecast”, “budget”, “estimate”, “intend” or “believe” and similar expressions or their negative connotations, or statements that events or conditions “will”, “would”, “may”, “could”, “should” or “might” occur. All such forward-looking statements are based on the opinions and estimates of management as of the date such statements are made. Forward-looking statements necessarily involve assumptions, risks and uncertainties, certain of which are beyond Ritchie Bros.’ control, including risks and uncertainties related to: general economic conditions and conditions affecting the industries in which Ritchie Bros operates; Ritchie Bros.’ ability to successfully integrate IronPlanet's operations and employees with Ritchie Bros.’ existing business; the ability to realize anticipated growth, synergies and cost savings in the IronPlanet transaction; the maintenance of important business relationships; the effects of the IronPlanet transaction on relationships with employees, customers, other business partners or governmental entities; deterioration of or instability in the economy, the markets we serve or the financial markets generally; as well as the risks and uncertainties set forth in Ritchie Bros.’ Annual Report on Form 10-K for the year ended December 31, 2016, which is available on the SEC, SEDAR, and Ritchie Bros.’ website. The foregoing list is not exhaustive of the factors that may affect Ritchie Bros.’ forward-looking statements. There can be no assurance that forward-looking statements will prove to be accurate, and actual results may differ materially from those expressed in, or implied by, these forward-looking statements. Forward-looking statements are made as of the date of this presentation and Ritchie Bros. does not undertake any obligation to update the information contained herein unless required by applicable securities legislation. For the reasons set forth above, you should not place undue reliance on forward-looking statements.
This presentation contains certain non-GAAP financial measures. For a discussion of non-GAAP measures and the most directly comparable GAAP financial measures, see the Appendix to this presentation as well as our earnings release and our Form 10-Q interim report, which are available at: investor.ritchiebros.com. These non-GAAP financial measures are not measures of financial performance in accordance with GAAP and may exclude items that are significant in understand and assessing our financial condition and results. Therefore, these measures should not be considered in isolation or as alternatives to measures of profitability, liquidity or other performance under GAAP. These measures may not be comparable to similarly-titled measures used by other companies.
This presentation also includes certain forward-looking non-GAAP financial measures. We are unable to present a quantitative reconciliation of this forward-looking non-GAAP financial information because management cannot reliably predict all of the necessary components of such measures. Accordingly, investors are cautioned not to place undue reliance on this information.All figures are in US dollars, unless otherwise noted.
Opening Remarks Ravi Saligram, Chief Executive Officer
4
Q3 2017 Business & Financial ReviewSharon Driscoll, Chief Financial Officer
5
Q3 Consolidated Financial Performance Overview
GROSSTRANSACTION
VALUE(GTV)
OPERATINGINCOME
REVENUE DILUTEDEPS
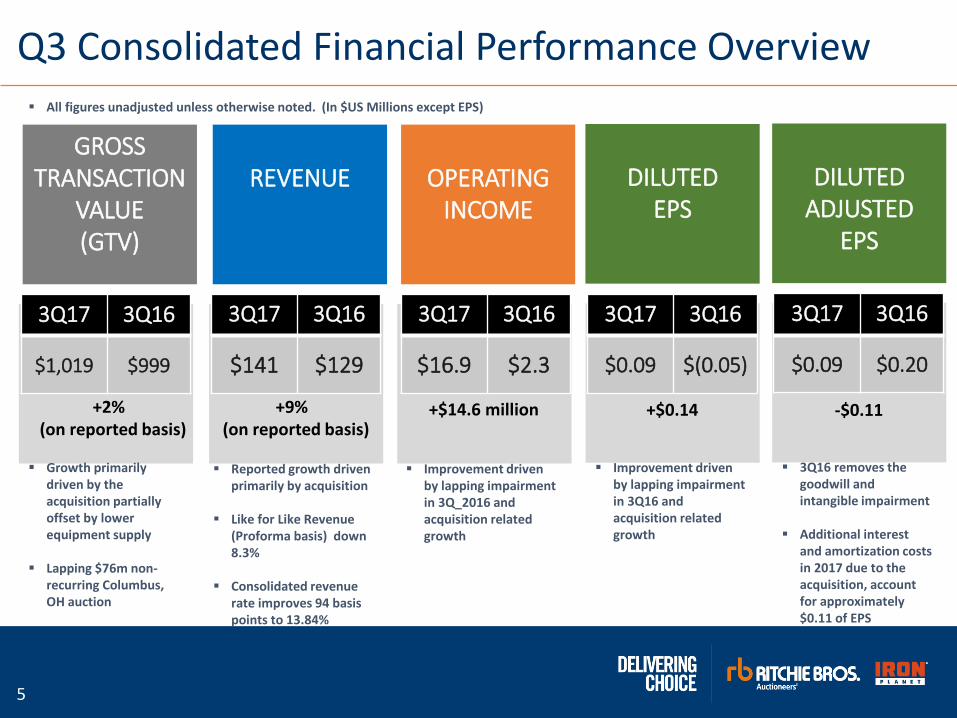
▪ Reported growth driven primarily by acquisition
▪ Like for Like Revenue (Proforma basis) down 8.3%
▪ Consolidated revenue rate improves 94 basis points to 13.84%
3Q17 3Q16
$1,019 $999
3Q17 3Q16
$141 $129
3Q17 3Q16
$16.9 $2.3
3Q17 3Q16
$0.09 $(0.05)
▪ Improvement driven by lapping impairment in 3Q_2016 and acquisition related growth
▪ Improvement driven by lapping impairment in 3Q16 and acquisition related growth
▪ Growth primarily driven by the acquisition partially offset by lower equipment supply
▪ Lapping $76m non-recurring Columbus, OH auction
▪ All figures unadjusted unless otherwise noted. (In $US Millions except EPS)
+2% (on reported basis)
+9% (on reported basis)
+$14.6 million +$0.14
DILUTEDADJUSTED
EPS
3Q17 3Q16
$0.09 $0.20
▪ 3Q16 removes the goodwill and intangible impairment
▪ Additional interest and amortization costs in 2017 due to the acquisition, account for approximately $0.11 of EPS
-$0.11
6
Consolidated Operating Expenses
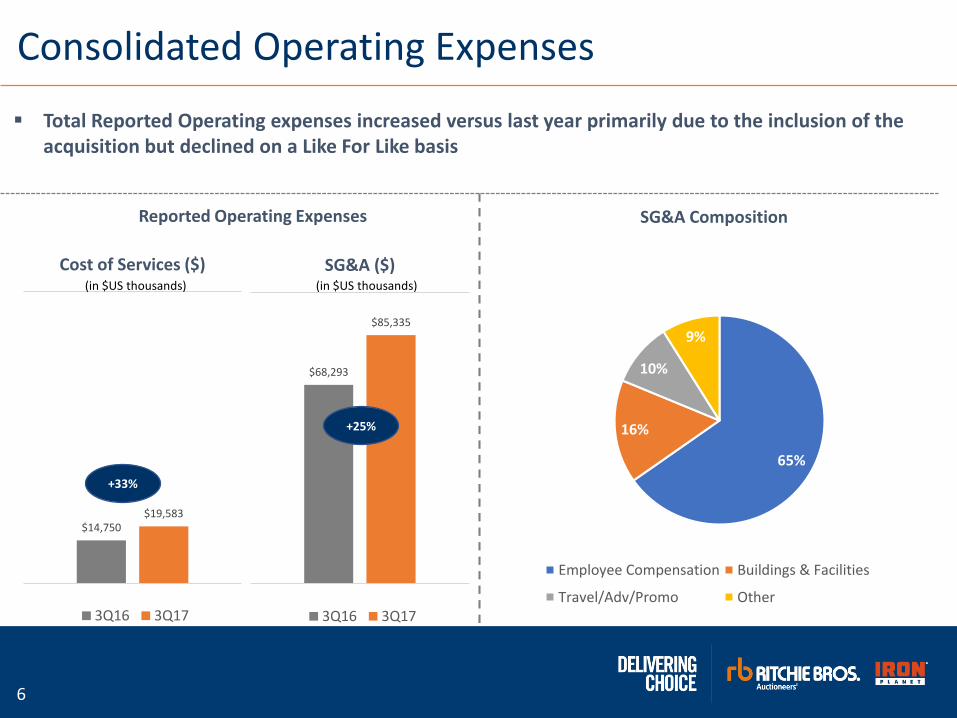
▪ Total Reported Operating expenses increased versus last year primarily due to the inclusion of the acquisition but declined on a Like For Like basis
$68,293
$85,335
SG&A ($)
3Q16 3Q17
Reported Operating Expenses
+25%
$14,750 $19,583
Cost of Services ($)
3Q16 3Q17
+33%
(in $US thousands) (in $US thousands)
SG&A Composition
65%
16%
10%
9%
Employee Compensation Buildings & Facilities
Travel/Adv/Promo Other
7
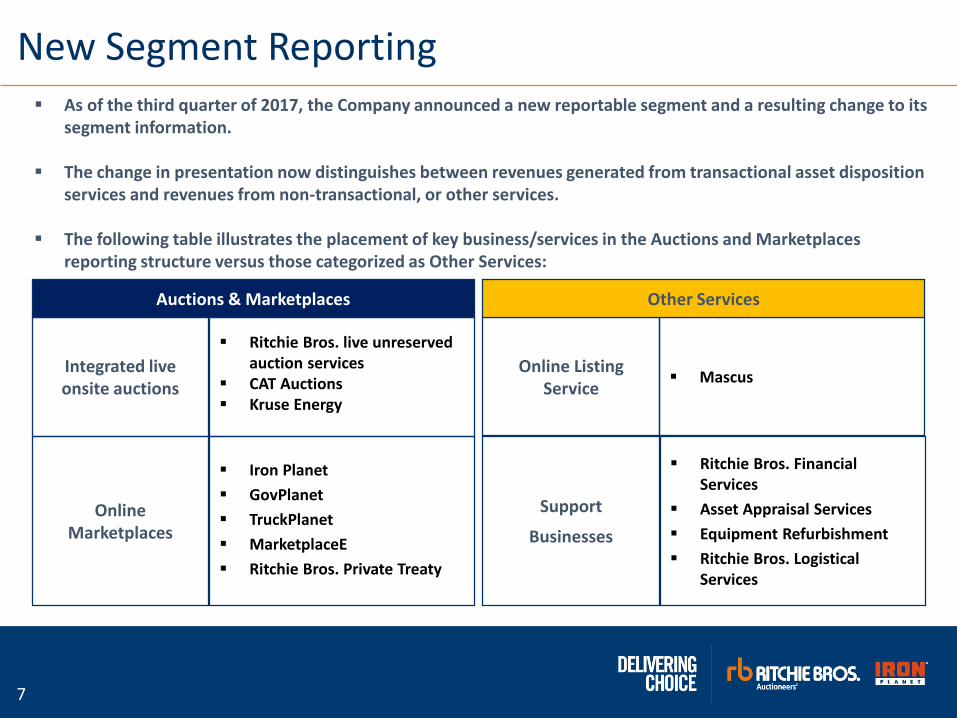
New Segment Reporting▪ As of the third quarter of 2017, the Company announced a new reportable segment and a resulting change to its
segment information.
▪ The change in presentation now distinguishes between revenues generated from transactional asset disposition services and revenues from non-transactional, or other services.
▪ The following table illustrates the placement of key business/services in the Auctions and Marketplaces reporting structure versus those categorized as Other Services:
Integrated live onsite auctions
▪ Ritchie Bros. live unreserved auction services
▪ CAT Auctions▪ Kruse Energy
Online Marketplaces
▪ Iron Planet
▪ GovPlanet
▪ TruckPlanet
▪ MarketplaceE
▪ Ritchie Bros. Private Treaty
Online Listing Service
▪ Mascus
Support
Businesses
▪ Ritchie Bros. Financial Services
▪ Asset Appraisal Services
▪ Equipment Refurbishment
▪ Ritchie Bros. Logistical Services
Auctions & Marketplaces Other Services
8
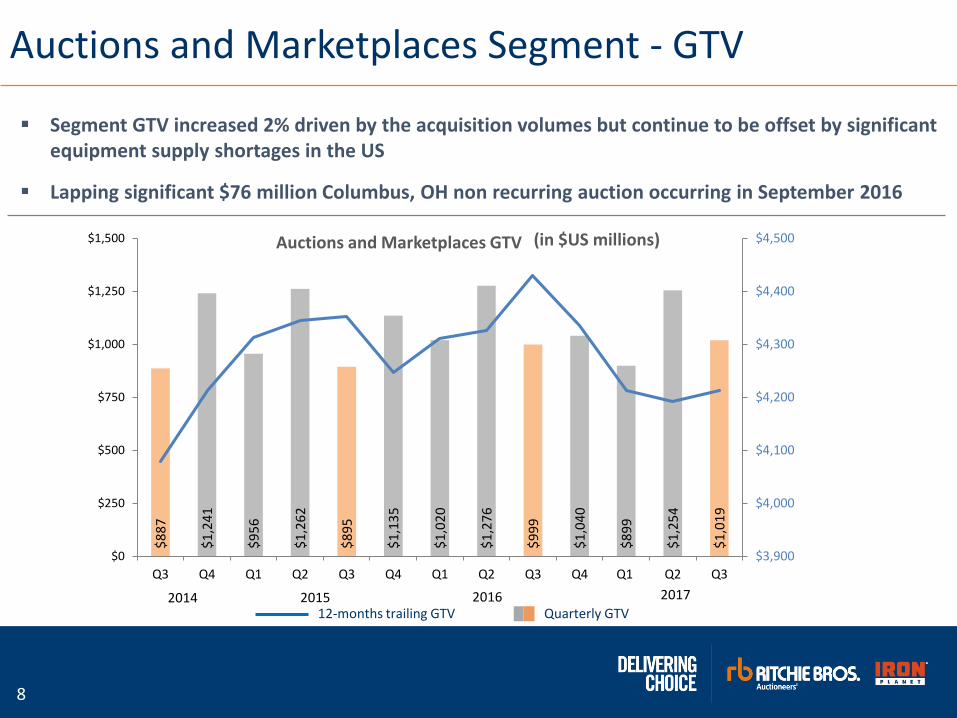
Auctions and Marketplaces Segment - GTV
Auctions and Marketplaces GTV ( in $US thousands)
▪ Segment GTV increased 2% driven by the acquisition volumes but continue to be offset by significant equipment supply shortages in the US
▪ Lapping significant $76 million Columbus, OH non recurring auction occurring in September 2016
$8
87
$1
,24
1
$9
56
$1
,26
2
$8
95
$1
,13
5
$1
,02
0
$1
,27
6
$9
99
$1
,04
0
$8
99
$1
,25
4
$1
,01
9
$3,900
$4,000
$4,100
$4,200
$4,300
$4,400
$4,500
$0
$250
$500
$750
$1,000
$1,250
$1,500
Q3 Q4 Q1 Q2 Q3 Q4 Q1 Q2 Q3 Q4 Q1 Q2 Q3
12-months trailing GTV Quarterly GTV
2017201620152014
(in $US millions)
9
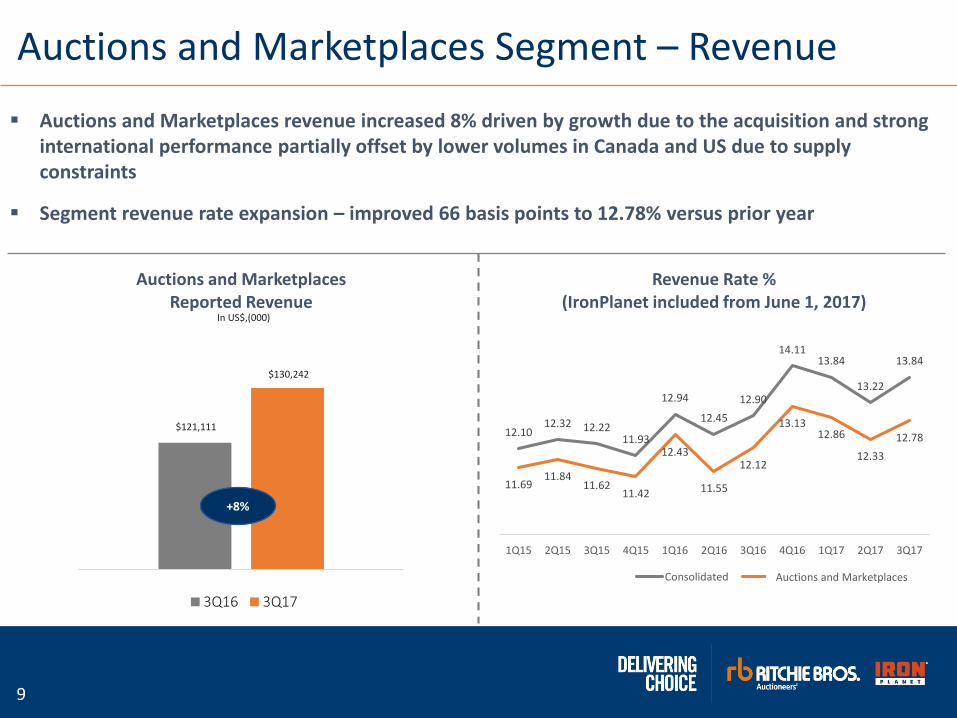
Auctions and Marketplaces Segment – Revenue
▪ Auctions and Marketplaces revenue increased 8% driven by growth due to the acquisition and strong international performance partially offset by lower volumes in Canada and US due to supply constraints
▪ Segment revenue rate expansion – improved 66 basis points to 12.78% versus prior year
12.1012.32 12.22
11.93
12.94
12.45
12.90
14.1113.84
13.22
13.84
11.6911.84
11.6211.42
12.43
11.55
12.12
13.1312.86
12.33
12.78
1Q15 2Q15 3Q15 4Q15 1Q16 2Q16 3Q16 4Q16 1Q17 2Q17 3Q17
Revenue Rate % (IronPlanet included from June 1, 2017)
Consolidated TADS
$121,111
$130,242
Auctions and Marketplaces Reported Revenue
3Q16 3Q17
+8%
In US$,(000)
Auctions and Marketplaces

10
Other Services Category – 3rd Quarter Insights
$2,852
$3,415
RBFS Revenue
3Q16 3Q17
In Thousands
$56,264
$64,963
RBFS Funded Volume
3Q16 3Q17
In Thousands
$2,033
$2,415
MascusRevenue
3Q16 3Q17
In Thousands
▪ RBFS Revenues delivered solid 20% growth in the quarter
▪ RBFS Funded volume improved 15%
▪ Mascus delivering strong revenue growth of 19% driven by new customer acquisition
11
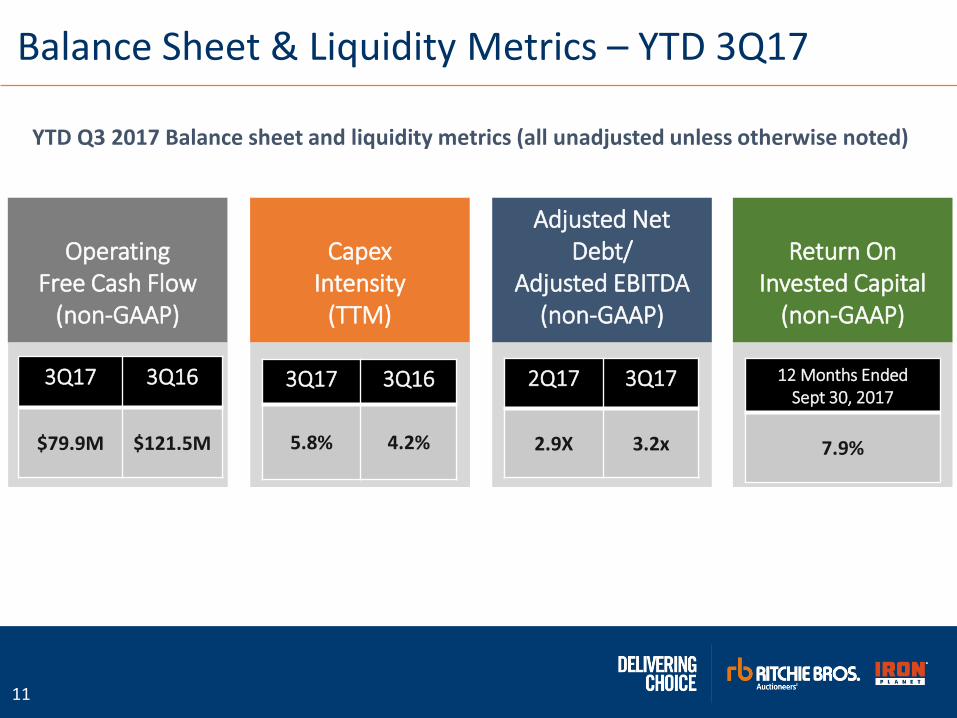
Balance Sheet & Liquidity Metrics – YTD 3Q17
Operating Free Cash Flow
(non-GAAP)
CapexIntensity
(TTM)
Adjusted Net Debt/
Adjusted EBITDA(non-GAAP)
Return OnInvested Capital
(non-GAAP)
3Q17 3Q16
$79.9M $121.5M
3Q17 3Q16
5.8% 4.2%
2Q17 3Q17
2.9X 3.2x
12 Months Ended Sept 30, 2017
7.9%
YTD Q3 2017 Balance sheet and liquidity metrics (all unadjusted unless otherwise noted)
12
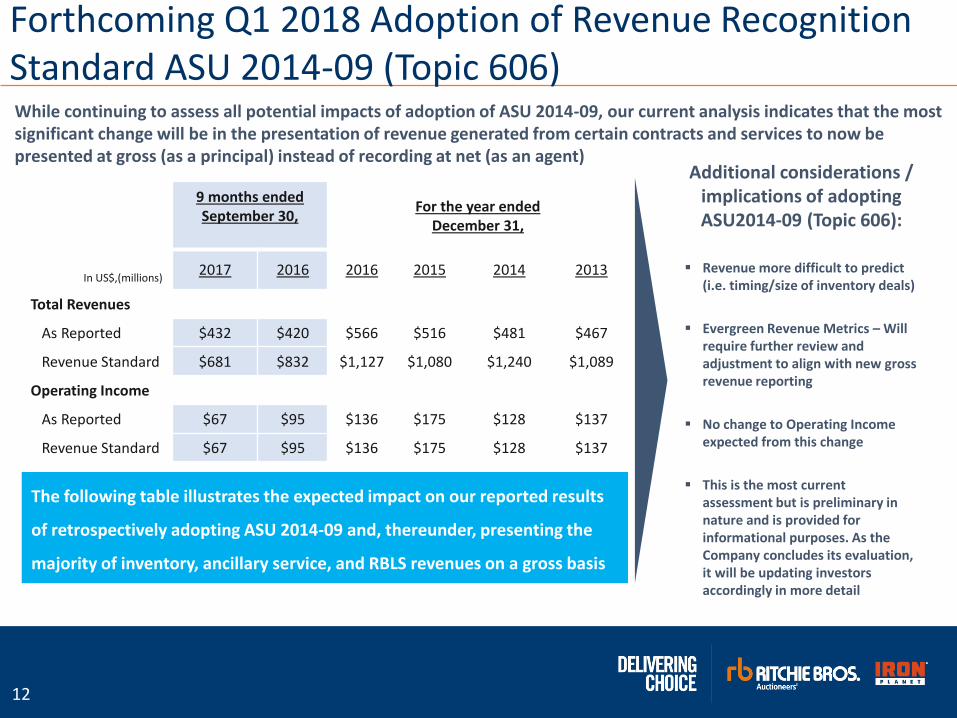
While continuing to assess all potential impacts of adoption of ASU 2014-09, our current analysis indicates that the most significant change will be in the presentation of revenue generated from certain contracts and services to now be presented at gross (as a principal) instead of recording at net (as an agent)
Forthcoming Q1 2018 Adoption of Revenue Recognition Standard ASU 2014-09 (Topic 606)
9 months ended September 30,
For the year ended December 31,
In US$,(millions)2017 2016 2016 2015 2014 2013
Total Revenues
As Reported $432 $420 $566 $516 $481 $467
Revenue Standard $681 $832 $1,127 $1,080 $1,240 $1,089
Operating Income
As Reported $67 $95 $136 $175 $128 $137
Revenue Standard $67 $95 $136 $175 $128 $137
Additional considerations / implications of adopting ASU2014-09 (Topic 606):
▪ Revenue more difficult to predict (i.e. timing/size of inventory deals)
▪ Evergreen Revenue Metrics – Will require further review and adjustment to align with new gross revenue reporting
▪ No change to Operating Income expected from this change
▪ This is the most current assessment but is preliminary in nature and is provided for informational purposes. As the Company concludes its evaluation, it will be updating investors accordingly in more detail
The following table illustrates the expected impact on our reported results
of retrospectively adopting ASU 2014-09 and, thereunder, presenting the
majority of inventory, ancillary service, and RBLS revenues on a gross basis
13
Integration & Strategic UpdateRavi Saligram, Chief Executive Officer
14
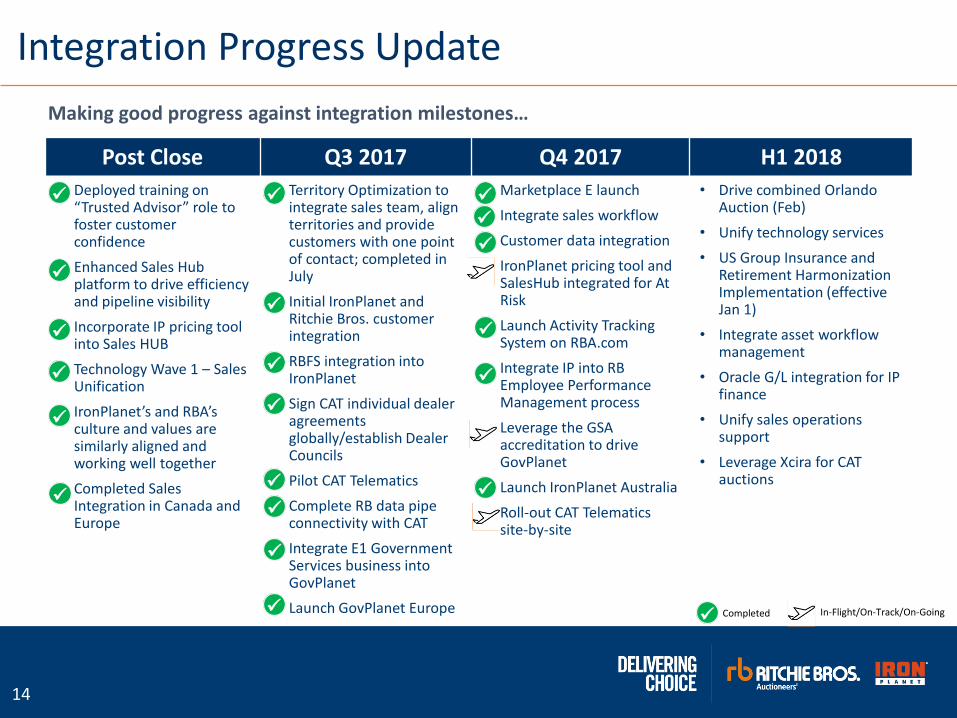
Integration Progress Update
Post Close Q3 2017 Q4 2017 H1 2018
• Deployed training on “Trusted Advisor” role to foster customer confidence
• Enhanced Sales Hub platform to drive efficiency and pipeline visibility
• Incorporate IP pricing tool into Sales HUB
• Technology Wave 1 – Sales Unification
• IronPlanet’s and RBA’s culture and values are similarly aligned and working well together
• Completed Sales Integration in Canada andEurope
• Territory Optimization to integrate sales team, align territories and provide customers with one point of contact; completed in July
• Initial IronPlanet and Ritchie Bros. customer integration
• RBFS integration into IronPlanet
• Sign CAT individual dealer agreements globally/establish Dealer Councils
• Pilot CAT Telematics
• Complete RB data pipe connectivity with CAT
• Integrate E1 Government Services business into GovPlanet
• Launch GovPlanet Europe
• Marketplace E launch
• Integrate sales workflow
• Customer data integration
• IronPlanet pricing tool and SalesHub integrated for At Risk
• Launch Activity Tracking System on RBA.com
• Integrate IP into RB Employee Performance Management process
• Leverage the GSA accreditation to drive GovPlanet
• Launch IronPlanet Australia
• Roll-out CAT Telematics site-by-site
• Drive combined Orlando Auction (Feb)
• Unify technology services
• US Group Insurance and Retirement Harmonization Implementation (effective Jan 1)
• Integrate asset workflow management
• Oracle G/L integration for IP finance
• Unify sales operations support
• Leverage Xcira for CAT auctions
✓
✓
✓
✓
✓
✓
✓
✓
✓
✓
✓
✓
✓
✓
✓
✓
✓
✓
Making good progress against integration milestones…
✓ Completed In-Flight/On-Track/On-Going
✓
✓
15
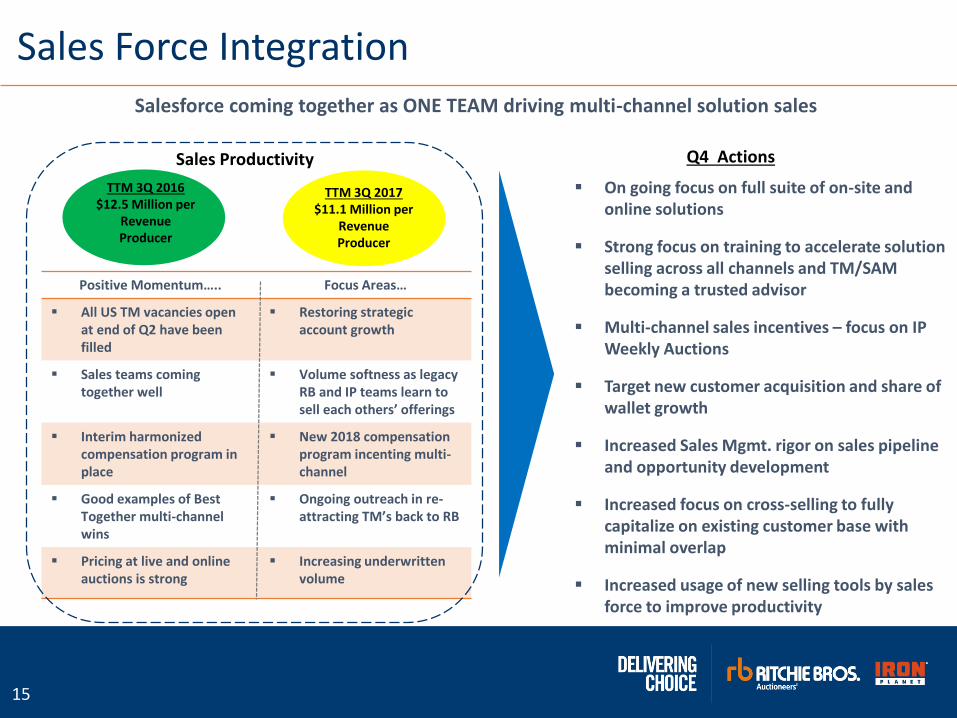
TTM 3Q 2017$11.1 Million per
Revenue Producer
Sales Productivity
Sales Force IntegrationSalesforce coming together as ONE TEAM driving multi-channel solution sales
Positive Momentum….. Focus Areas…
▪ All US TM vacancies open at end of Q2 have been filled
▪ Restoring strategic account growth
▪ Sales teams coming together well
▪ Volume softness as legacy RB and IP teams learn to sell each others’ offerings
▪ Interim harmonized compensation program in place
▪ New 2018 compensation program incenting multi-channel
▪ Good examples of Best Together multi-channel wins
▪ Ongoing outreach in re-attracting TM’s back to RB
▪ Pricing at live and online auctions is strong
▪ Increasing underwritten volume
TTM 3Q 2016$12.5 Million per
Revenue Producer
▪ On going focus on full suite of on-site and online solutions
▪ Strong focus on training to accelerate solution selling across all channels and TM/SAM becoming a trusted advisor
▪ Multi-channel sales incentives – focus on IP Weekly Auctions
▪ Target new customer acquisition and share of wallet growth
▪ Increased Sales Mgmt. rigor on sales pipeline and opportunity development
▪ Increased focus on cross-selling to fully capitalize on existing customer base with minimal overlap
▪ Increased usage of new selling tools by sales force to improve productivity
Q4 Actions
16
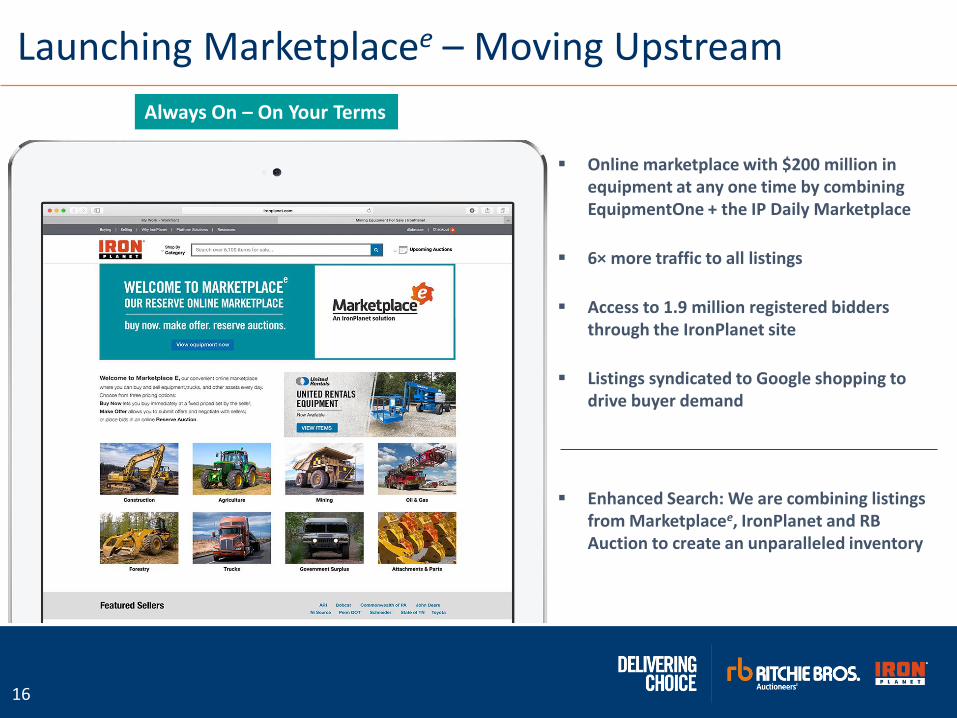
Launching Marketplacee – Moving Upstream
▪ Online marketplace with $200 million in equipment at any one time by combining EquipmentOne + the IP Daily Marketplace
▪ 6× more traffic to all listings
▪ Access to 1.9 million registered bidders through the IronPlanet site
▪ Listings syndicated to Google shopping to drive buyer demand
▪ Enhanced Search: We are combining listings from Marketplacee, IronPlanet and RB Auction to create an unparalleled inventory
Always On – On Your Terms
17
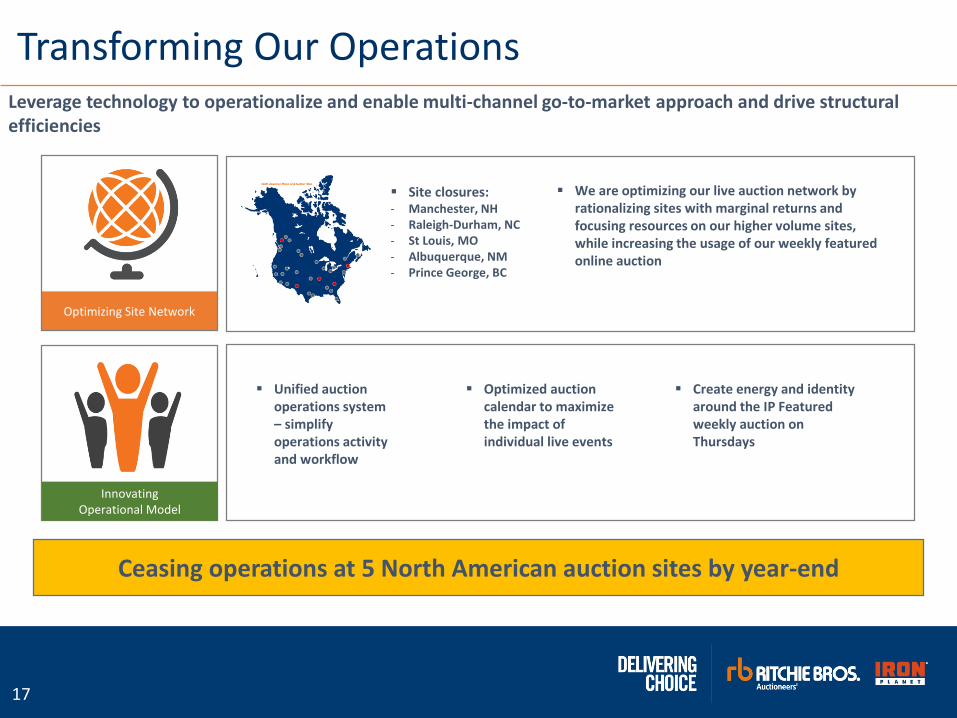
Transforming Our OperationsLeverage technology to operationalize and enable multi-channel go-to-market approach and drive structural efficiencies
▪ Site closures:- Manchester, NH- Raleigh-Durham, NC- St Louis, MO - Albuquerque, NM- Prince George, BC
▪ Unified auction operations system – simplify operations activity and workflow
▪ Optimized auction calendar to maximize the impact of individual live events
▪ Create energy and identityaround the IP Featuredweekly auction on Thursdays
Optimizing Site Network
InnovatingOperational Model
▪ We are optimizing our live auction network by rationalizing sites with marginal returns and focusing resources on our higher volume sites, while increasing the usage of our weekly featured online auction
Ceasing operations at 5 North American auction sites by year-end
18
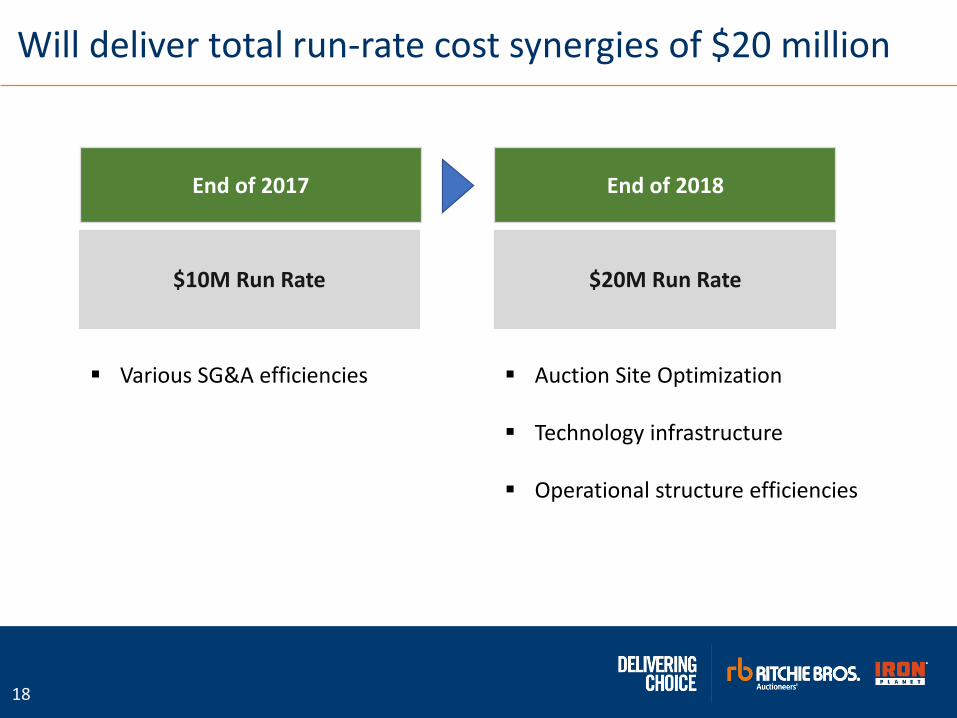
Will deliver total run-rate cost synergies of $20 million
End of 2017 End of 2018
$10M Run Rate $20M Run Rate
▪ Various SG&A efficiencies ▪ Auction Site Optimization
▪ Technology infrastructure
▪ Operational structure efficiencies
19
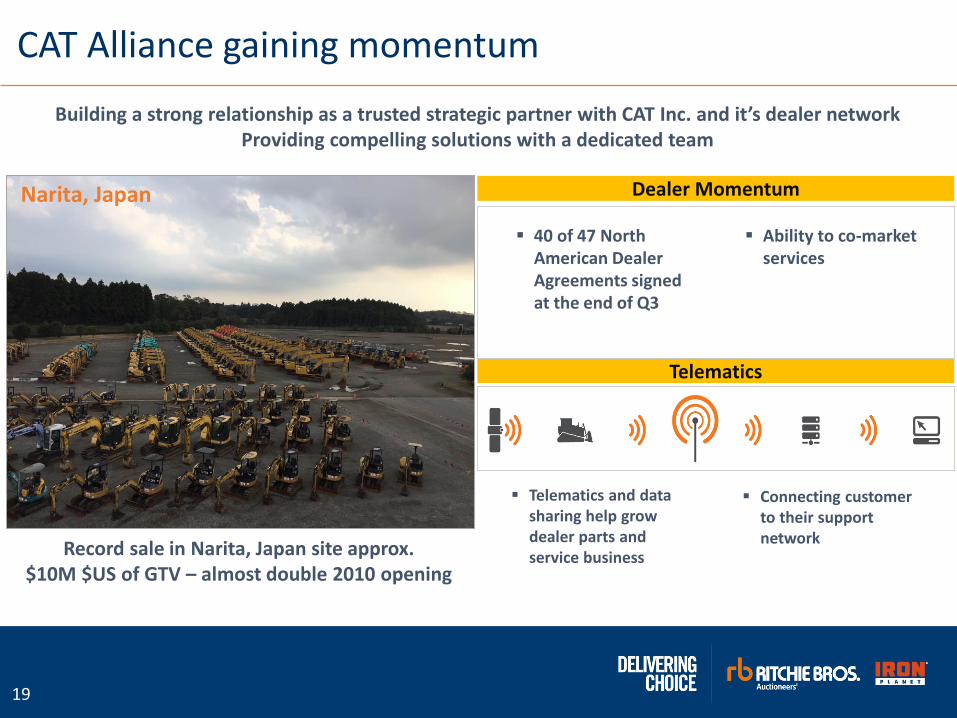
CAT Alliance gaining momentum
Telematics
Dealer Momentum
Building a strong relationship as a trusted strategic partner with CAT Inc. and it’s dealer network Providing compelling solutions with a dedicated team
▪ 40 of 47 North American Dealer Agreements signed at the end of Q3
▪ Telematics and data sharing help grow dealer parts and service business
▪ Connecting customer to their support network
▪ Ability to co-market services
Narita, Japan
Record sale in Narita, Japan site approx. $10M $US of GTV – almost double 2010 opening
20
Q&AMembers of the RBA Management Team
21
Appendix
22
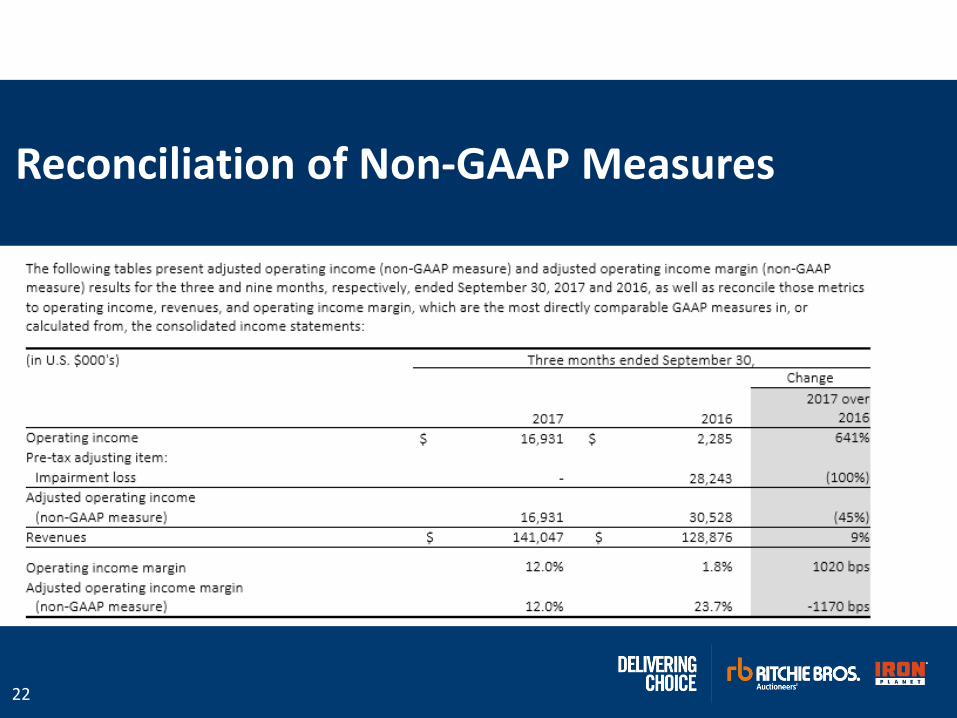
Reconciliation of Non-GAAP Measures
23
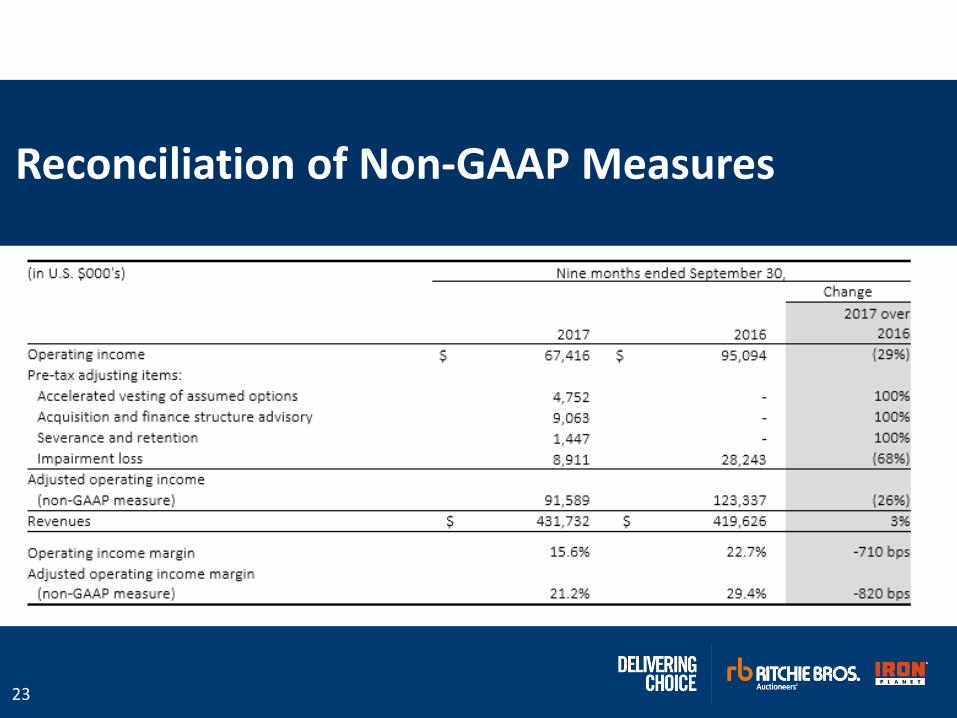
Reconciliation of Non-GAAP Measures
24
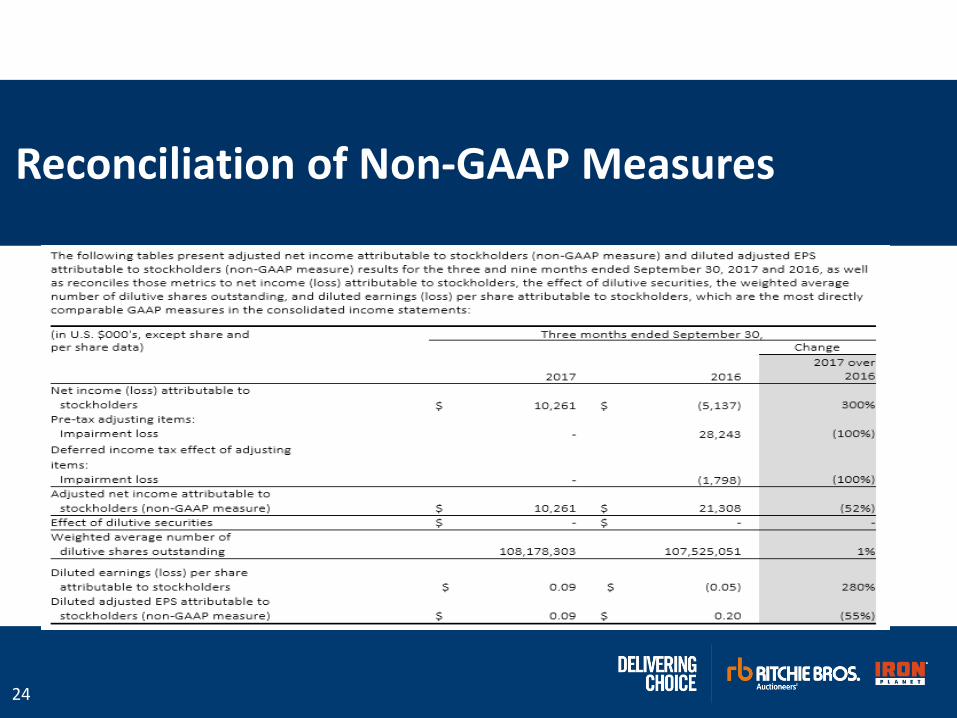
Reconciliation of Non-GAAP Measures
25
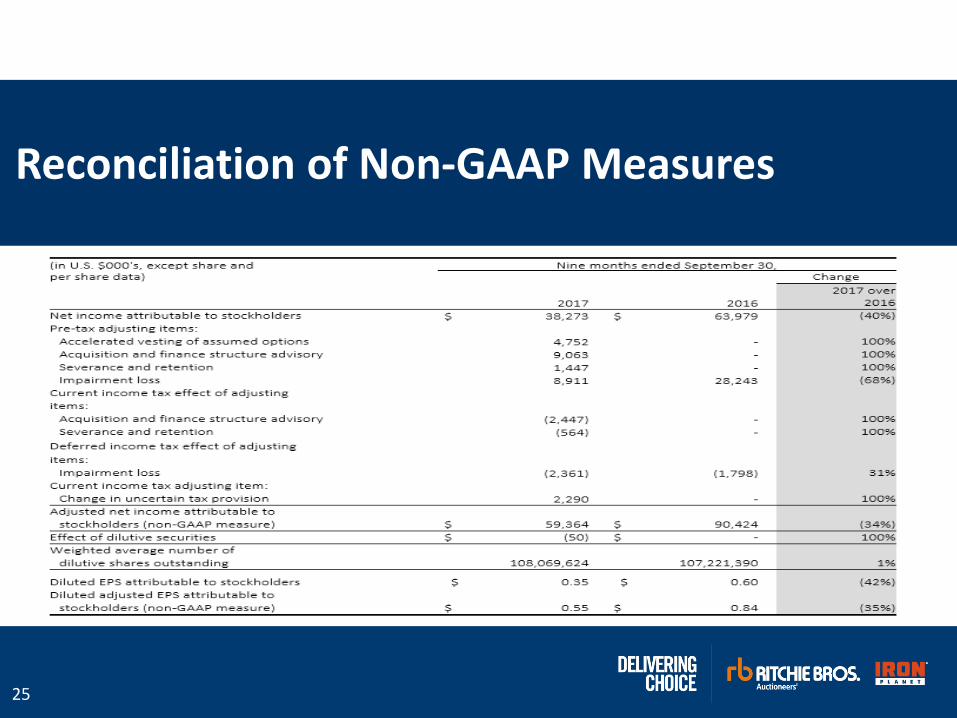
Reconciliation of Non-GAAP Measures
26
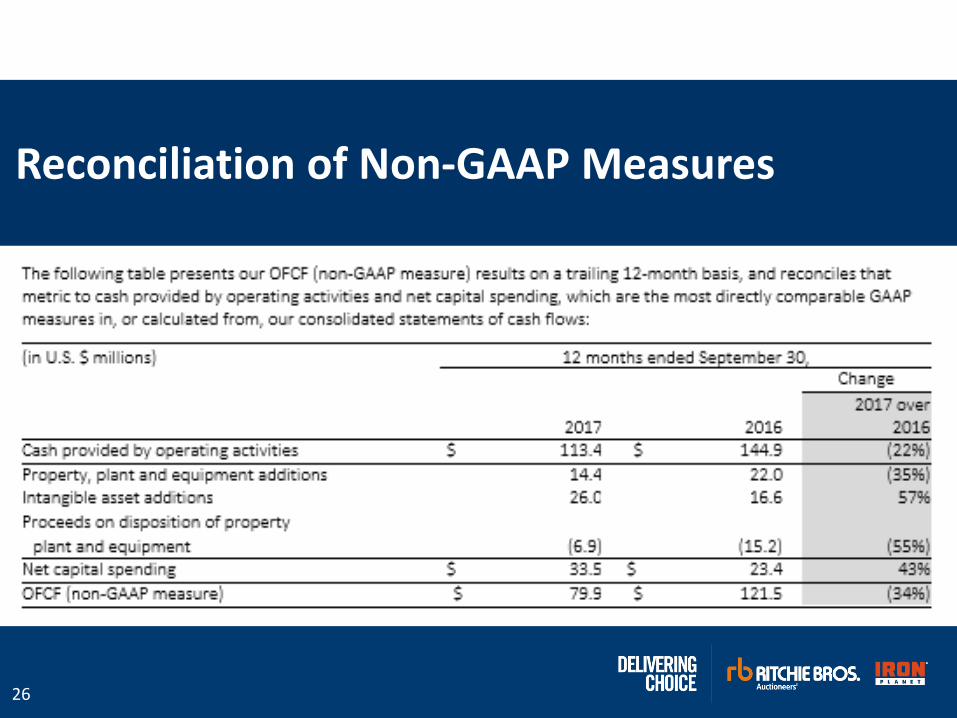
Reconciliation of Non-GAAP Measures
27
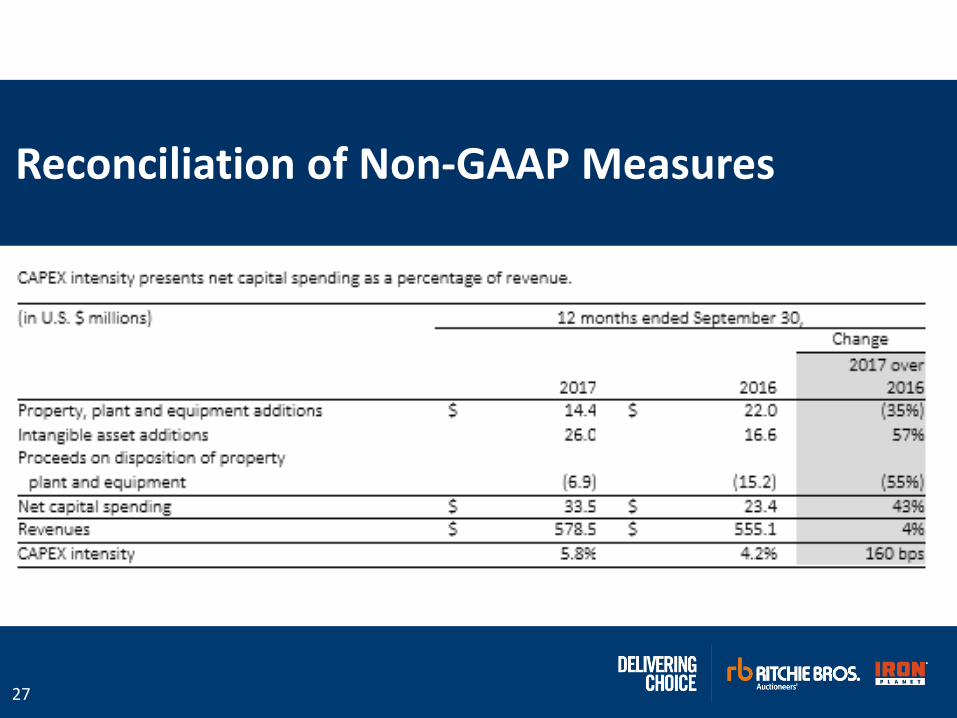
Reconciliation of Non-GAAP Measures
28
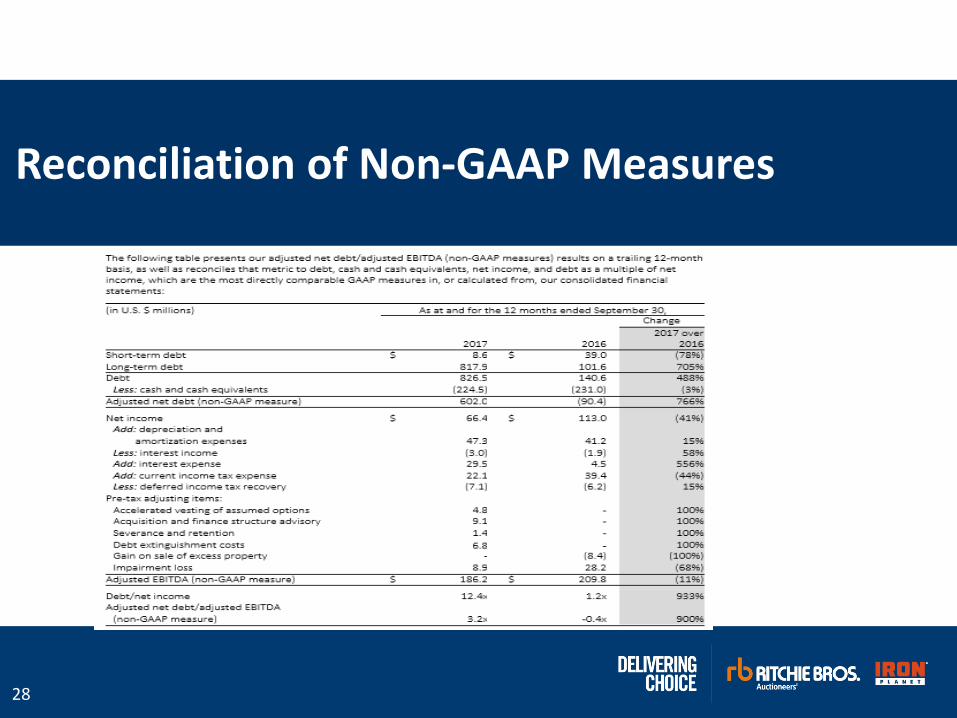
Reconciliation of Non-GAAP Measures
29
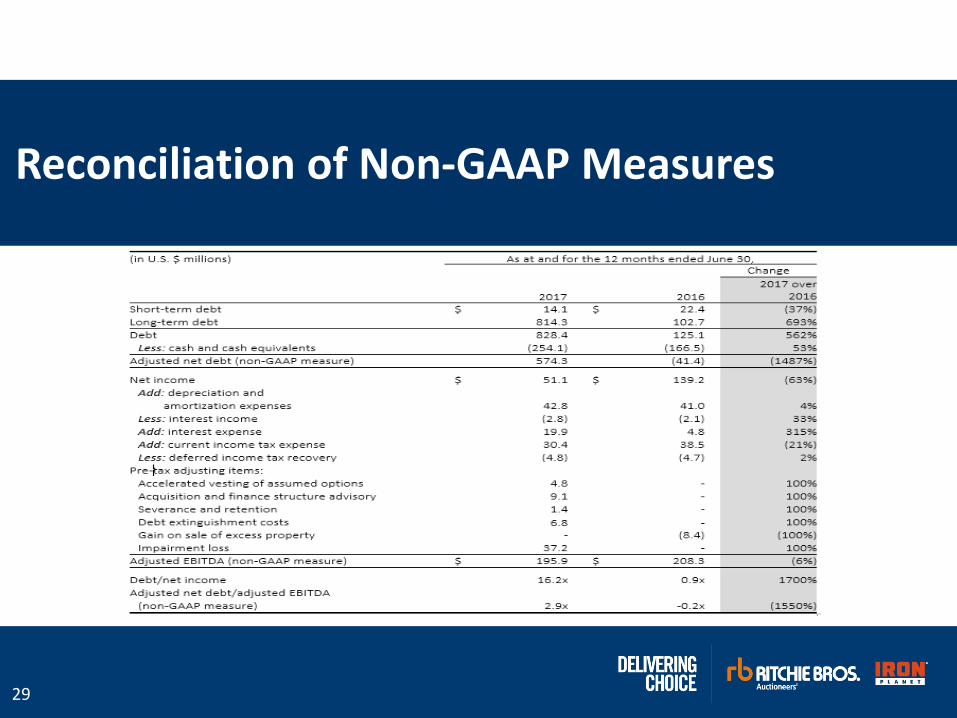
Reconciliation of Non-GAAP Measures
30
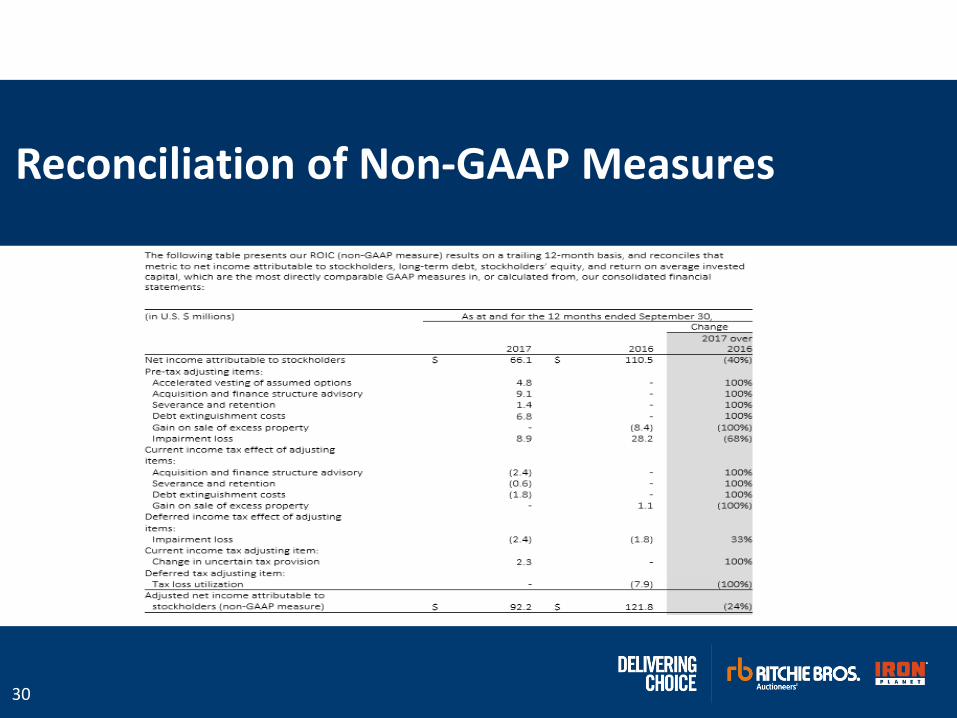
Reconciliation of Non-GAAP Measures
31
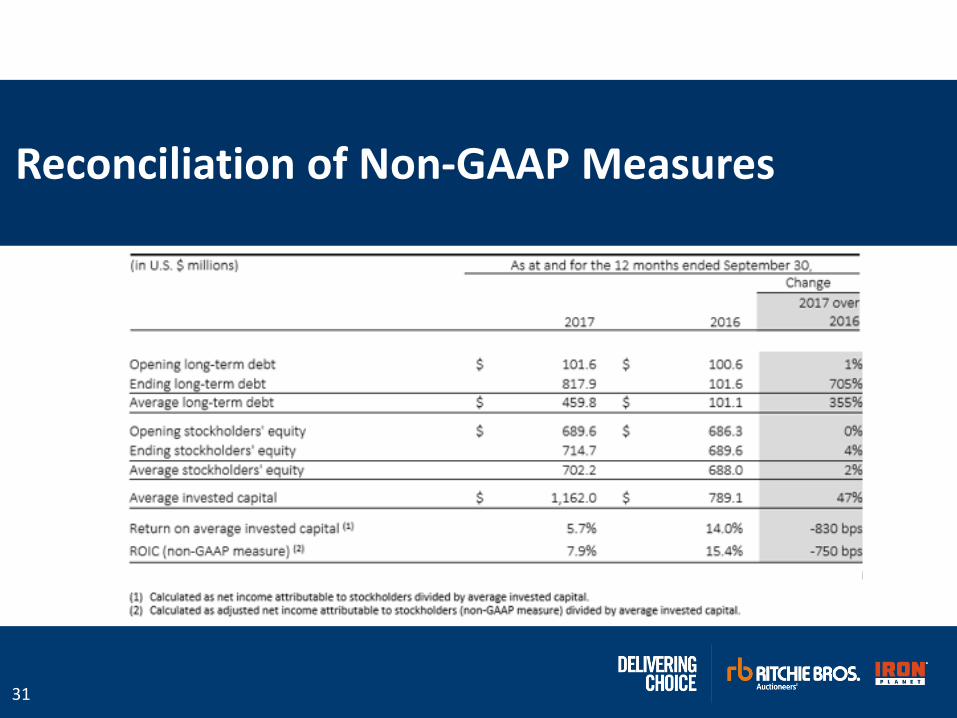
Reconciliation of Non-GAAP Measures