Forecast Value Added Analysis - · PDF fileForecast Value Added Analysis ... Worst Practices...
41
Forecast Value Added Analysis Michael Gilliland Product Marketing Manager - Forecasting SAS
Transcript of Forecast Value Added Analysis - · PDF fileForecast Value Added Analysis ... Worst Practices...
Forecast Value Added Analysis Michael Gilliland Product Marketing Manager - Forecasting SAS

Copyright © 2009, SAS Institute Inc. All rights reserved.
APICS - Chicago 09/20/2011
About SAS
World’s largest private software company
• $2.43 billion revenue in 2010
• 50,000 customer sites / offices in 56 countries
• Leader in advanced analytics software
–35.2% market share (per IDC) – more
than double its nearest competitor
2
Ranked #1 in Fortune’s 100 Best Companies to Work For the past two years. Find more at www.sas.com.

Copyright © 2009, SAS Institute Inc. All rights reserved.
APICS - Chicago 09/20/2011
Agenda
Why Are Forecasts So Wrong?
Worst Practices in Business Forecasting
Forecast Value Added Analysis
• Case Studies
3
Copyright © 2009, SAS Institute Inc. All rights reserved.
APICS - Chicago 09/20/2011
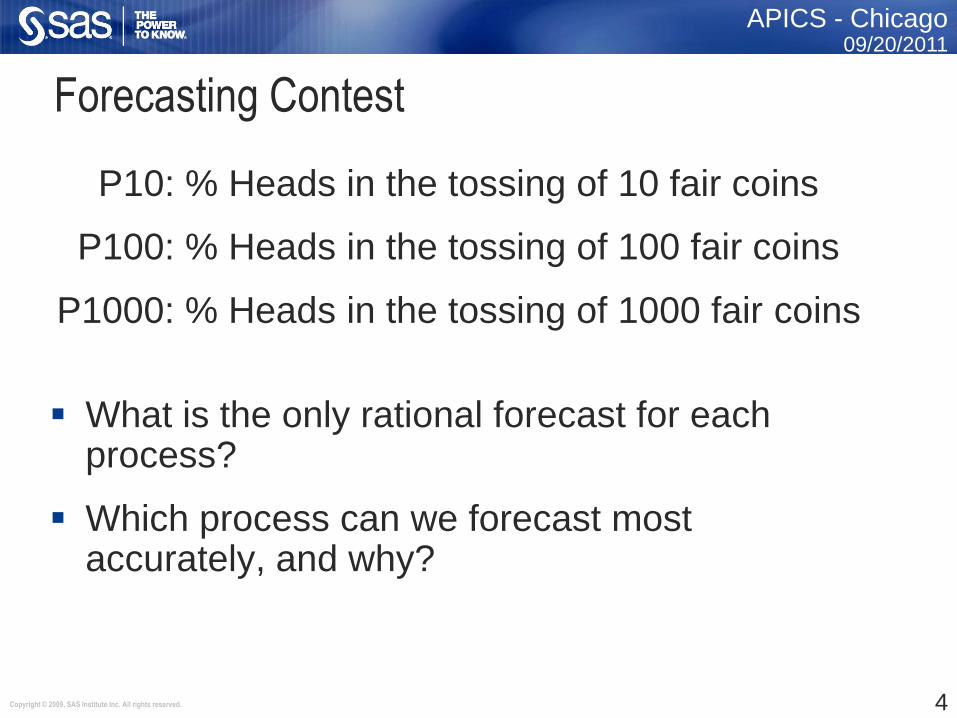
Forecasting Contest
P10: % Heads in the tossing of 10 fair coins
P100: % Heads in the tossing of 100 fair coins
P1000: % Heads in the tossing of 1000 fair coins
What is the only rational forecast for each process?
Which process can we forecast most accurately, and why?
4

Copyright © 2009, SAS Institute Inc. All rights reserved.
APICS - Chicago 09/20/2011
Forecasting Contest
The nature of the behavior – the degree of randomness – has determined the level of
accuracy we will achieve 5

Copyright © 2009, SAS Institute Inc. All rights reserved.
APICS - Chicago 09/20/2011
Why Are Forecasts So Wrong?
6

Copyright © 2009, SAS Institute Inc. All rights reserved.
APICS - Chicago 09/20/2011
Why Are Forecasts So Wrong?
Inadequate / unsound / misused software
• Lacks necessary capabilities • Mathematical errors • Inappropriate methods • Sound but misused
Unskilled / inexperienced forecasters
Contaminated / politicized / overly elaborate forecasting process
Unforecastable demand
7

Copyright © 2009, SAS Institute Inc. All rights reserved.
APICS - Chicago 09/20/2011
Why Are Forecasts So Wrong?
Inadequate / unsound / misused software
Unskilled / inexperienced forecasters • Use inappropriate models • Over-adjustment (Deming’s “fiddling”) • Research on adjustments
Contaminated / politicized / overly elaborate forecasting process
Unforecastable demand
8

Copyright © 2009, SAS Institute Inc. All rights reserved.
APICS - Chicago 09/20/2011
Why Are Forecasts So Wrong?
Inadequate / unsound / misused software
Unskilled / inexperienced forecasters
Contaminated / politicized / overly elaborate forecasting process • Should be objective, scientific, dispassionate • What management wants (should be
“unbiased best guess”) • Ignores voice of the marketplace • Too many “touch points”
Unforecastable demand
9

Copyright © 2009, SAS Institute Inc. All rights reserved.
APICS - Chicago 09/20/2011
Why Are Forecasts So Wrong?
Inadequate / unsound / misused software
Unskilled / inexperienced forecasters
Contaminated / politicized / overly elaborate forecasting process
Unforecastable demand • Not forecastable to accuracy desired • Nature of the behavior determines limit on accuracy
of forecast (e.g. coin tossing)
10

Copyright © 2009, SAS Institute Inc. All rights reserved.
APICS - Chicago 09/20/2011
Worst Practices in Business Forecasting
11

Copyright © 2009, SAS Institute Inc. All rights reserved.
APICS - Chicago 09/20/2011
Inappropriate Accuracy Expectations
Despite promises from vendors, there is no magic formula to assure accurate forecasts
• (Banish “accurate” from forecasting conversation?)
Accuracy is determined more by the nature of behavior you are forecasting (smooth & stable vs. wild & erratic) than by the method
Sophisticated methods don’t help with unforecastable demand
12

Copyright © 2009, SAS Institute Inc. All rights reserved.
APICS - Chicago 09/20/2011
Better Practice: Utilize Naïve Forecast
The “naïve forecast” sets the baseline against which all other methods are evaluated
Random Walk – using last known actual as your forecast
Seasonal Random Walk – using actual from prior year as your forecast
Something “free” – no elaborate system or process
13

Copyright © 2009, SAS Institute Inc. All rights reserved.
APICS - Chicago 09/20/2011
Selecting Model Solely by Historical Fit
14
• Based on 4 weeks of data, what is forecast for week 7?

Copyright © 2009, SAS Institute Inc. All rights reserved.
APICS - Chicago 09/20/2011
Assuming Model Fit = Forecast Accuracy
Just noted the worst practice of selecting model based solely on fit to history
Forecast accuracy will almost always be worse – and often much much worse – than the fit of the model to history
A “dirty trick of selling” is to only show you the fit to history (and never show you the accuracy of the forecasts)
15

Copyright © 2009, SAS Institute Inc. All rights reserved.
APICS - Chicago 09/20/2011
Inappropriate Performance Objectives
When you assign unachievable goals (e.g. call coin toss 60%), people either give up or cheat
Forecasting performance goals must be based on what accuracy is reasonable to expect given the nature of the demand patterns
• Baseline for this is the naïve model
Goals should not be based on:
• What accuracy is “needed”
• Industry benchmarks 16

Copyright © 2009, SAS Institute Inc. All rights reserved.
APICS - Chicago 09/20/2011
The Perils of Industry Benchmarks
Forecasting performance benchmarks available from several sources
Can you trust them?
• Survey responses or audited data?
Is measurement consistent across respondents?
• Using the same formula, same time bucket, same granularity
Is the comparison relevant?
• Is demand equally forecastable?
17

Copyright © 2009, SAS Institute Inc. All rights reserved.
APICS - Chicago 09/20/2011
The Perils of Industry Benchmarks
Worst case example:
• Benchmark study shows Company X has lowest forecast error
• Consultants and academics converge on Company X to study its forecasting process and publish reports on forecasting “best practices”
• Other companies begin to copy X’s “best practices”
Upon further review…
• FVA analysis reveals that Company X had easy to forecast demand and would have had lower error had they used a moving average
18

Copyright © 2009, SAS Institute Inc. All rights reserved.
APICS - Chicago 09/20/2011
Better Practice: Beat the Naïve Forecast
Ignore industry benchmarks – companies at top probably have easiest to forecast demand
Do not set arbitrary forecast accuracy objectives
• E.g. “MAPE < 20%” – consider forecastability instead
The only reasonable forecasting performance objective is to beat the naïve forecast (or at least do no worse!) and to continuously improve the process
19

Copyright © 2009, SAS Institute Inc. All rights reserved.
APICS - Chicago 09/20/2011
Adding Variation to Demand
Volatility (CV)
Fo
reca
st A
ccu
racy
20

Copyright © 2009, SAS Institute Inc. All rights reserved.
APICS - Chicago 09/20/2011
Forecast Value Added Analysis
21

Copyright © 2009, SAS Institute Inc. All rights reserved.
APICS - Chicago 09/20/2011
What is Forecast Value Added?
Forecast Value Added is defined as
The change in a forecasting performance metric (such as MAPE, Accuracy, or Bias) that can be attributed to a particular step or
participant in the forecasting process
FVA is measured by comparing the results of a process activity to the results you would have achieved without doing the activity
FVA can be positive or negative
22
Copyright © 2009, SAS Institute Inc. All rights reserved.
APICS - Chicago 09/20/2011
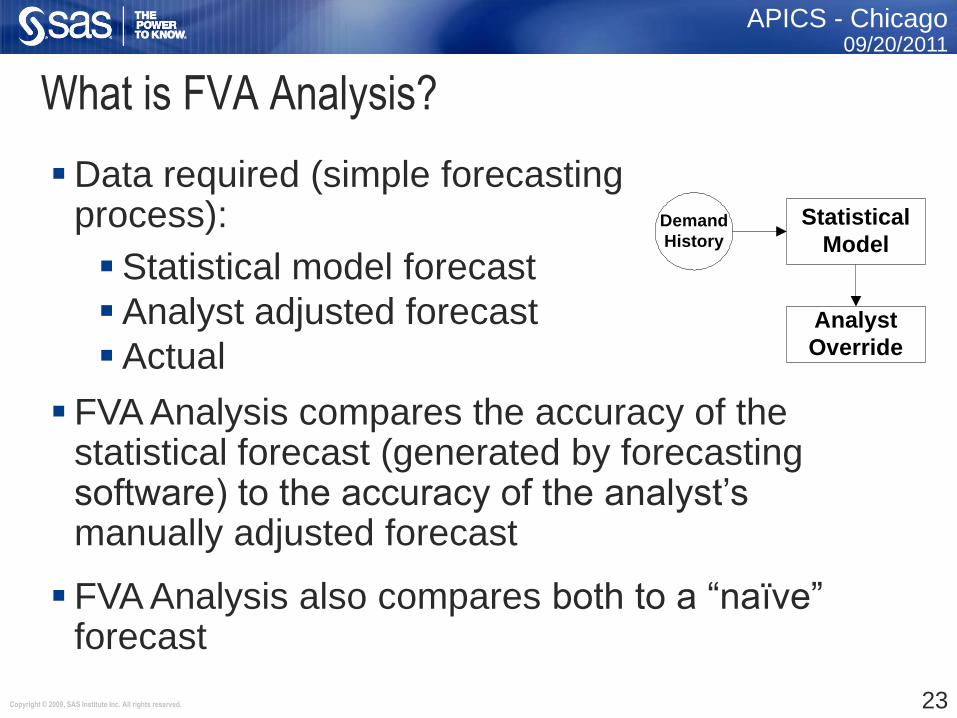
What is FVA Analysis?
Statistical
ModelDemand
History
Analyst
Override
Data required (simple forecasting process):
Statistical model forecast
Analyst adjusted forecast
Actual
FVA Analysis compares the accuracy of the statistical forecast (generated by forecasting software) to the accuracy of the analyst’s manually adjusted forecast
FVA Analysis also compares both to a “naïve” forecast
23

Copyright © 2009, SAS Institute Inc. All rights reserved.
APICS - Chicago 09/20/2011
FVA Analysis: The Naïve Forecast
FVA Analysis is based on simple scientific method
• For example, evaluate drug performance by comparing to a control group (receiving a placebo)
A naïve forecast serves as the placebo in evaluating forecasting process performance
• Something simple to compute, requiring the minimum amount of effort and manipulation to prepare a forecast
− Random Walk (using last known actual)
− Seasonal Random Walk (using year ago actual)
− Moving Average
24
Copyright © 2009, SAS Institute Inc. All rights reserved.
APICS - Chicago 09/20/2011
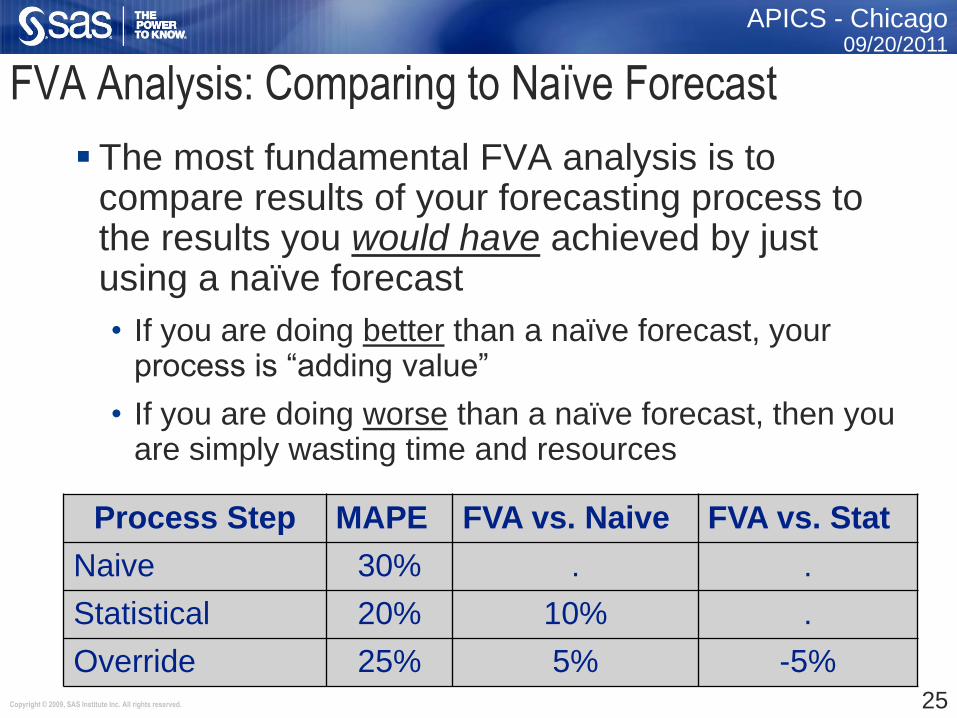
FVA Analysis: Comparing to Naïve Forecast
The most fundamental FVA analysis is to compare results of your forecasting process to the results you would have achieved by just using a naïve forecast
• If you are doing better than a naïve forecast, your process is “adding value”
• If you are doing worse than a naïve forecast, then you are simply wasting time and resources
Process Step MAPE FVA vs. Naive FVA vs. Stat
Naive 30% . .
Statistical 20% 10% .
Override 25% 5% -5%
25

Copyright © 2009, SAS Institute Inc. All rights reserved.
APICS - Chicago 09/20/2011
Why Use FVA Analysis: Eliminate Waste
FVA Analysis is used to identify and eliminate non-value adding activities
• Streamline the process by eliminating wasted efforts
• Direct resources to more productive activities
• Potentially achieve better forecasts
By eliminating those activities that are making the forecast worse, you get better forecasts
for free!
26

Copyright © 2009, SAS Institute Inc. All rights reserved.
APICS - Chicago 09/20/2011
Why Use FVA Analysis: Compare Performance
Which Analyst is the best forecaster?
Analyst MAPE
A 20%
B 30%
C 40%
Traditional analysis based on MAPE says Analyst A is best
27

Copyright © 2009, SAS Institute Inc. All rights reserved.
APICS - Chicago 09/20/2011
Why Use FVA Analysis: Compare Performance
FVA Analysis may reveal that having the lowest MAPE is not necessarily the same as being the best forecaster!
Analyst Item Type Item Lifecycle
Seasonal Promos New Items Demand Volatility
MAPE Naïve MAPE
FVA
A Basic Long No None None Low 20% 10% -10%
B Basic Long Some Few Few Medium 30% 30% 0%
C Fashion Short Highly Many Many High 40% 50% 10%
The Perils of Benchmarking:
Do not compare your performance to others if you do not know the underlying “forecastability” of their data
28

Copyright © 2009, SAS Institute Inc. All rights reserved.
APICS - Chicago 09/20/2011
FVA Analysis: Reporting the Results
Naïve forecasts can be surprisingly difficult to beat
Results can be embarrassing to those participants failing to add value
• Present the results tactfully – your purpose is to improve the process, not necessarily to humiliate anyone
• Present the results privately – if they will be embarrassing to your boss or other executive managers
Or….if you want to end your career with a bang:
• Find the most embarrassing results you can and surprise your boss and executive management by presenting them in a large meeting
29

Copyright © 2009, SAS Institute Inc. All rights reserved.
APICS - Chicago 09/20/2011
Be cautious in interpreting your FVA results
• Don’t draw conclusions without sufficient evidence
One period of data is not enough!
• Over short time periods, results may just be due to chance
Use Donald Wheeler’s book Understanding Variation: The Key to Managing Chaos to guide the analysis
FVA Analysis: Reporting the Results
30
If you haven’t conducted FVA analysis and know that you are beating a naïve forecast…
then maybe you aren’t!!!

Copyright © 2009, SAS Institute Inc. All rights reserved.
APICS - Chicago 09/20/2011
FVA Case Studies
FVA has been applied by companies in several major industries:
• Pharmaceuticals
• Retail
• Technology Manufacturing
• Home Furnishings
• Transportation
• Apparel
• Food & Beverage
31

Copyright © 2009, SAS Institute Inc. All rights reserved.
APICS - Chicago 09/20/2011
Case Study: Academic Research
Source: “Good and Bad Judgment in Forecasting.” Fildes and Goodwin, Foresight, Fall 2007.
Improvement in Accuracy by Size of
Adjustment (at one company)
-5%
0%
5%
10%
15%
20%
25%
Quartile1 Quartile2 Quartile3 Quartile4
Size of Override%
Im
pro
vem
en
t Positive Override
Negative Override
Studied 60,000 forecasts at four supply chain companies
75% of statistical forecasts were manually adjusted
Large adjustments tended to be beneficial
Small adjustments did not significantly improve accuracy and sometimes made the forecast worse
Downward adjustments were more likely to improve the forecast than upward adjustments
32

Copyright © 2009, SAS Institute Inc. All rights reserved.
APICS - Chicago 09/20/2011
Case Study: Premium Bedding Manufacturer
Collaborative forecasting process
• Baseline Model + Market Intelligence = Collaborative Forecast
Benefits of FVA
• Visibility into forecasting process
• Identifies opportunities for improvement
• Sales learns not to forecast but to “add value”
• More accurate forecasts!
FVA appeals to competitive nature of sales reps – beat the nerd running the statistical software
Source: “How to Speak Sales.” J. Eric Wilson, IBF Supply Chain Forecasting Conference, February 2008. 33

Copyright © 2009, SAS Institute Inc. All rights reserved.
APICS - Chicago 09/20/2011
Case Study: Pharmaceutical
Uses FVA as part of Forecast Quality Dashboard
• Governance – was the forecast on time and complete
• Behavior – was forecast followed, or tampered with
• Accuracy – forecast accuracy, bias, and value-added
Attention to “forecastability” of products
• Stable vs. unstable demand
• Assess risk, and build plans accounting for the risk
Source: “Measuring and Reporting Forecasting Performance.” Joseph & Gilliland, IBF Supply Chain Forecasting Conference, October 2007.
34

Copyright © 2009, SAS Institute Inc. All rights reserved.
APICS - Chicago 09/20/2011
Case Study: Automotive Supplier
Focus on the cost of forecast error to get management support
Developed a “Cost of Inaccuracy” metric
• Too high: cost of carrying slow-moving goods
• Too low: cost of back orders (lost revenue, loss of credibility as a supplier)
Evaluated management adjustments using FVA
Applied COI to determine cost / benefit of management participation
Source: “How to Optimize Management Input to Statistical Forecasting.” Jonathon Karelse, IBF Supply Chain Forecasting Conference, October 2007. 35
Copyright © 2009, SAS Institute Inc. All rights reserved.
APICS - Chicago 09/20/2011
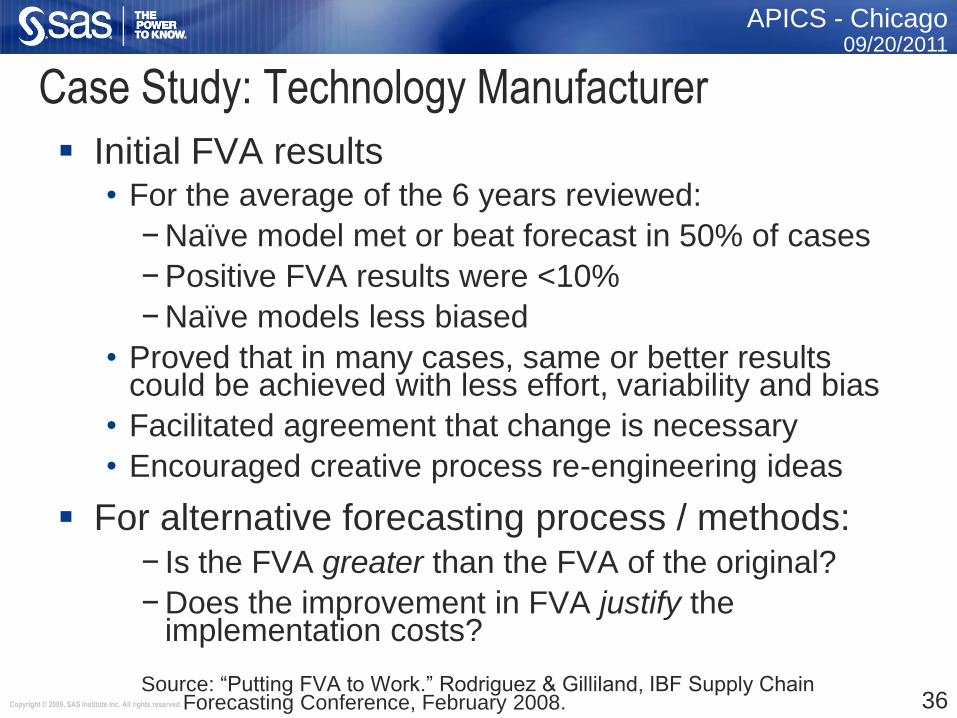
Case Study: Technology Manufacturer
Initial FVA results • For the average of the 6 years reviewed:
− Naïve model met or beat forecast in 50% of cases
− Positive FVA results were <10%
− Naïve models less biased
• Proved that in many cases, same or better results could be achieved with less effort, variability and bias
• Facilitated agreement that change is necessary
• Encouraged creative process re-engineering ideas
For alternative forecasting process / methods: − Is the FVA greater than the FVA of the original?
− Does the improvement in FVA justify the implementation costs?
Source: “Putting FVA to Work.” Rodriguez & Gilliland, IBF Supply Chain Forecasting Conference, February 2008. 36

Copyright © 2009, SAS Institute Inc. All rights reserved.
APICS - Chicago 09/20/2011
Case Study: Specialty Retailer
Benchmark process capability (how process performed vs. naïve model) • Compare statistical vs. judgmental forecasting
− 75% of analyst overrides failed to beat 5-week moving average
Validate process improvement prototypes • Measure FVA Prior to Process Improvement
• Implement Process Improvement on Pilot Basis
• Measure FVA After Improvement
• If FVA is Positive, Proceed with Total Process Improvement
Compare software packages
Source: “Simple Tools to Assess and Improve Forecasting Performance.” Harwell & Gilliland, IBF Best Practices Forecasting Conference, April 2006. 37

Copyright © 2009, SAS Institute Inc. All rights reserved.
APICS - Chicago 09/20/2011
Case Study: Food & Beverage
Overall process added 4 percentage points of improvement (from 64% to 68% accuracy at DC/Item/Week level)
Most of improvement was due to statistical forecast beating the naïve forecast
• Analyst overrides made forecast worse 60% of the time
Determined that sales inputs to forecasting process were not adding value (did not improve DC/Item forecast)
38

Copyright © 2009, SAS Institute Inc. All rights reserved.
APICS - Chicago 09/20/2011
Lean Approach to Forecasting
Lean is all about identify and eliminating process waste
FVA analysis is one tool in the lean approach
The objective is to generate forecasts as accurate an unbiased as you can reasonably expect them to be, and do this as efficiently as possible
Focus on process efficiency and elimination of process waste – getting rid of those activities that just make the forecast worse
You can get better forecasts for free! 39

Copyright © 2009, SAS Institute Inc. All rights reserved.
APICS - Chicago 09/20/2011
Additional Resources on FVA Analysis
“Forecast Value Added Analysis: Step-by-Step”
• SAS on-demand webcast http://www.sas.com/events/cm/176129/index.html
• SAS white paper http://www.sas.com/reg/wp/corp/6216
Blog: The Business Forecasting Deal (blogs.sas.com/content/forecasting)
Book: The Business Forecasting Deal (available on amazon.com)
Contact: [email protected] 40

Copyright © 2009, SAS Institute Inc. All rights reserved.
APICS - Chicago 09/20/2011