FNB House Price Index - Entegral Property...FNB House Price Index Year-on-year house price growth...
5
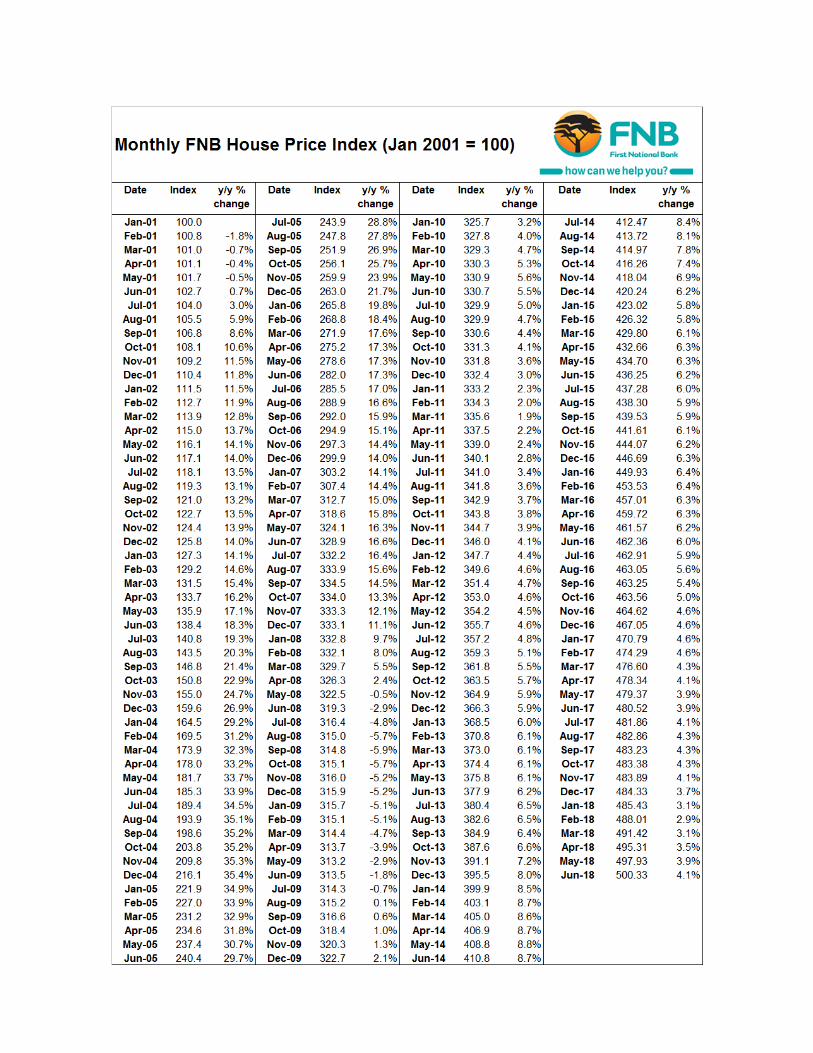
PROPERTY BAROMETER FNB House Price Index Year-on-year house price growth accelerated in June, but in real terms (adjusting for CPI), house prices are still in decline June 2018 saw the FNB House Price Index growing by a faster 4.1%, year-on- year, up from the previous month’s 3.9%, and from a February 2018 low of 2.9%. This is the 4 th consecutive month of house price growth acceleration. However, signals from the FNB Estate Agent Survey suggest that the acceleration in year-on-year house price growth may be short-lived FNB HOUSE PRICE INDEX RESULTS FOR JUNE 2018 – ACCELERATION, BUT FOR HOW LONG? On a year-on-year basis, the FNB House Price Index’s growth rate continued to accelerate mildly in June 2018, reaching 4.1%, up from a revised 3.9% in May, and the 4 th consecutive month of growth acceleration since the 2.9% low point reached in February. We believe this recent mild acceleration in house price growth to be the lagged impact of that brief sentiment improvement in the country early in 2018 on the back of the major political leadership changes in the country, notably a change in President. That sentiment improvement led to a noticeable 1 st quarter increase in residential market activity and demand according to the FNB Estate Agent Survey, and this has arguably fed through into price growth of late. In real terms, however, when adjusting for CPI (Consumer Price Index) inflation, house prices remain in decline. As at May 2018 (June CPI not yet available) real house prices declined year-on-year by -0.5%, with CPI inflation at 4.4% in that month and house price growth at 3.9%. 2 July 2018 MARKET ANALYTICS AND SCENARIO FORECASTING UNIT JOHN LOOS: HOUSEHOLD AND PROPERTY SECTOR STRATEGIST 087-328 0151 [email protected] THULANI LUVUNO: ANALYST 087-730 2254 [email protected] ZHARINA FRANCIS: STATISTICIAN 087-730 2313 [email protected] The information in this publication is derived from sources which are regarded as accurate and reliable, is of a general nature only, does not constitute advice and may not be applicable to all circumstances. Detailed advice should be obtained in individual cases. No responsibility for any error, omission or loss sustained by any person acting or refraining from acting as a result of this publication is accepted by Firstrand Group Limited and / or the authors of the material. First National Bank – a division of FirstRand Bank Limited. An Authorised Financial Services provider. Reg No. 1929/001225/06
Transcript of FNB House Price Index - Entegral Property...FNB House Price Index Year-on-year house price growth...
PROPERTY BAROMETER
FNB House Price Index
Year-on-year house price growth accelerated in June,
but in real terms (adjusting for CPI), house prices are
still in decline
June 2018 saw the FNB House Price Index growing by a faster 4.1%, year-on-
year, up from the previous month’s 3.9%, and from a February 2018 low of
2.9%. This is the 4th consecutive month of house price growth acceleration.
However, signals from the FNB Estate Agent Survey suggest that the
acceleration in year-on-year house price growth may be short-lived
FNB HOUSE PRICE INDEX RESULTS FOR JUNE 2018 –
ACCELERATION, BUT FOR HOW LONG?
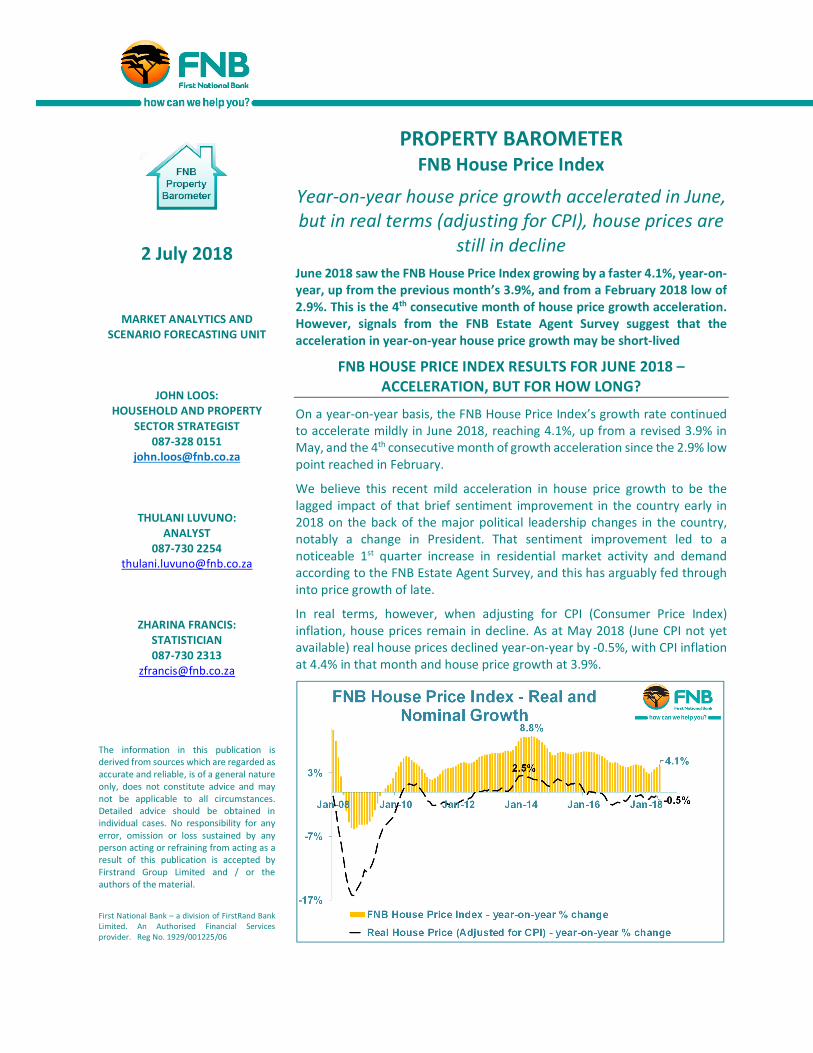
On a year-on-year basis, the FNB House Price Index’s growth rate continued
to accelerate mildly in June 2018, reaching 4.1%, up from a revised 3.9% in
May, and the 4th consecutive month of growth acceleration since the 2.9% low
point reached in February.
We believe this recent mild acceleration in house price growth to be the
lagged impact of that brief sentiment improvement in the country early in
2018 on the back of the major political leadership changes in the country,
notably a change in President. That sentiment improvement led to a
noticeable 1st quarter increase in residential market activity and demand
according to the FNB Estate Agent Survey, and this has arguably fed through
into price growth of late.
In real terms, however, when adjusting for CPI (Consumer Price Index)
inflation, house prices remain in decline. As at May 2018 (June CPI not yet
available) real house prices declined year-on-year by -0.5%, with CPI inflation
at 4.4% in that month and house price growth at 3.9%.
2 July 2018
MARKET ANALYTICS AND
SCENARIO FORECASTING UNIT
JOHN LOOS:
HOUSEHOLD AND PROPERTY
SECTOR STRATEGIST
087-328 0151
THULANI LUVUNO:
ANALYST
087-730 2254
ZHARINA FRANCIS:
STATISTICIAN
087-730 2313
The information in this publication is
derived from sources which are regarded as
accurate and reliable, is of a general nature
only, does not constitute advice and may
not be applicable to all circumstances.
Detailed advice should be obtained in
individual cases. No responsibility for any
error, omission or loss sustained by any
person acting or refraining from acting as a
result of this publication is accepted by
Firstrand Group Limited and / or the
authors of the material.
First National Bank – a division of FirstRand Bank
Limited. An Authorised Financial Services
provider. Reg No. 1929/001225/06
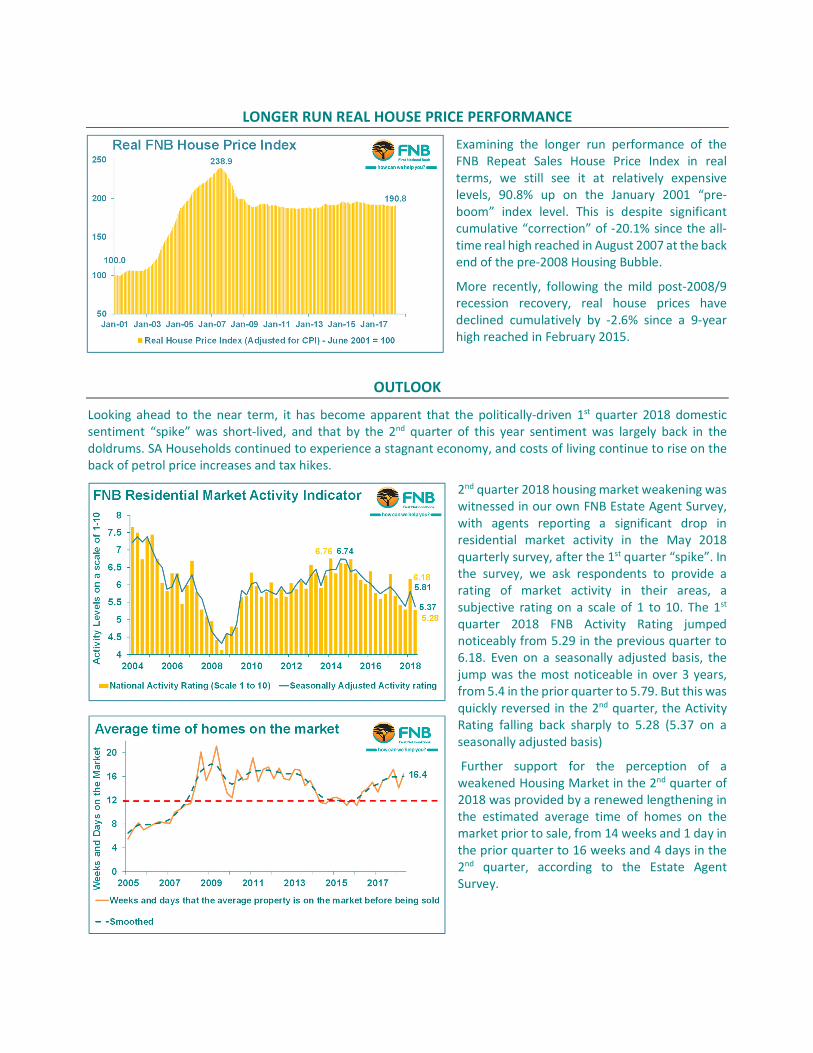
LONGER RUN REAL HOUSE PRICE PERFORMANCE
Examining the longer run performance of the
FNB Repeat Sales House Price Index in real
terms, we still see it at relatively expensive
levels, 90.8% up on the January 2001 “pre-
boom” index level. This is despite significant
cumulative “correction” of -20.1% since the all-
time real high reached in August 2007 at the back
end of the pre-2008 Housing Bubble.
More recently, following the mild post-2008/9
recession recovery, real house prices have
declined cumulatively by -2.6% since a 9-year
high reached in February 2015.
OUTLOOK
Looking ahead to the near term, it has become apparent that the politically-driven 1st quarter 2018 domestic
sentiment “spike” was short-lived, and that by the 2nd quarter of this year sentiment was largely back in the
doldrums. SA Households continued to experience a stagnant economy, and costs of living continue to rise on the
back of petrol price increases and tax hikes.
2nd quarter 2018 housing market weakening was
witnessed in our own FNB Estate Agent Survey,
with agents reporting a significant drop in
residential market activity in the May 2018
quarterly survey, after the 1st quarter “spike”. In
the survey, we ask respondents to provide a
rating of market activity in their areas, a
subjective rating on a scale of 1 to 10. The 1st
quarter 2018 FNB Activity Rating jumped
noticeably from 5.29 in the previous quarter to
6.18. Even on a seasonally adjusted basis, the
jump was the most noticeable in over 3 years,
from 5.4 in the prior quarter to 5.79. But this was
quickly reversed in the 2nd quarter, the Activity
Rating falling back sharply to 5.28 (5.37 on a
seasonally adjusted basis)
Further support for the perception of a
weakened Housing Market in the 2nd quarter of
2018 was provided by a renewed lengthening in
the estimated average time of homes on the
market prior to sale, from 14 weeks and 1 day in
the prior quarter to 16 weeks and 4 days in the
2nd quarter, according to the Estate Agent
Survey.
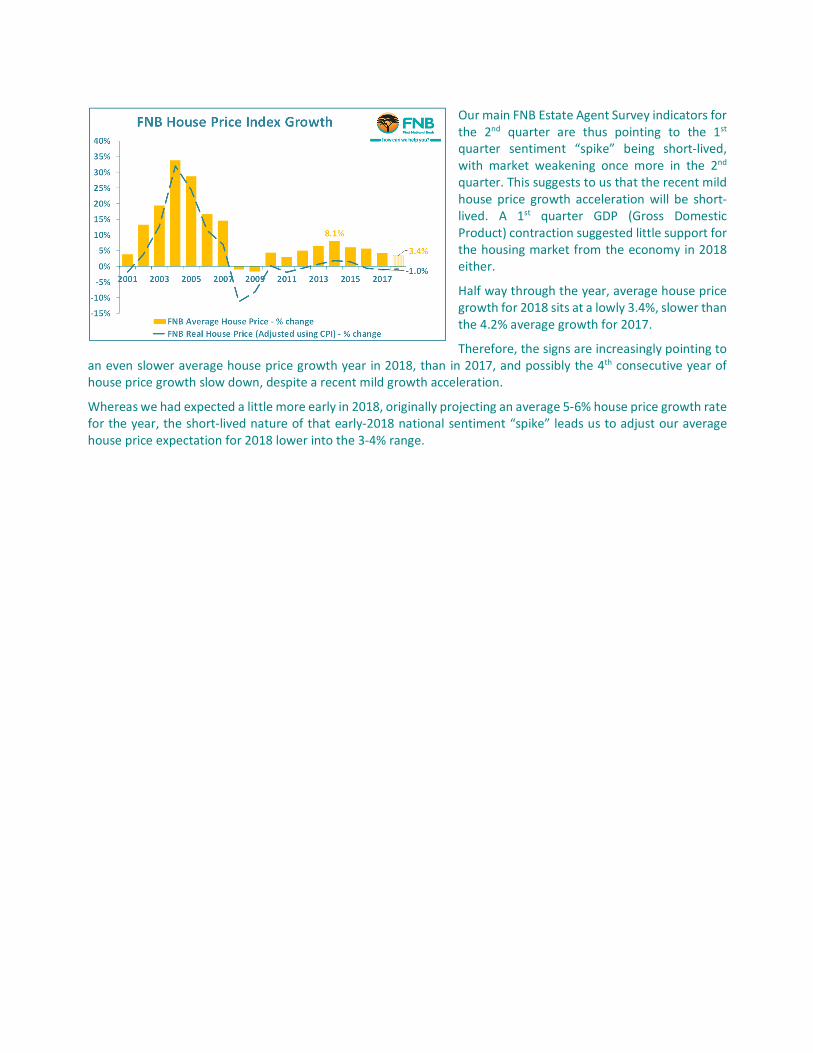
Our main FNB Estate Agent Survey indicators for
the 2nd quarter are thus pointing to the 1st
quarter sentiment “spike” being short-lived,
with market weakening once more in the 2nd
quarter. This suggests to us that the recent mild
house price growth acceleration will be short-
lived. A 1st quarter GDP (Gross Domestic
Product) contraction suggested little support for
the housing market from the economy in 2018
either.
Half way through the year, average house price
growth for 2018 sits at a lowly 3.4%, slower than
the 4.2% average growth for 2017.
Therefore, the signs are increasingly pointing to
an even slower average house price growth year in 2018, than in 2017, and possibly the 4th consecutive year of
house price growth slow down, despite a recent mild growth acceleration.
Whereas we had expected a little more early in 2018, originally projecting an average 5-6% house price growth rate
for the year, the short-lived nature of that early-2018 national sentiment “spike” leads us to adjust our average
house price expectation for 2018 lower into the 3-4% range.
ADDENDUM - NOTES:
Note on The FNB House Price Index:
The FNB Repeat Sales House Price Index has been one of our repertoire of national house price indices for
some years, and is based on the well-known Case-Shiller methodology which is used to compile the Standard
& Poor’s Case-Shiller Home Price Indices in the United States.
This “repeat sales approach” is based on measuring the rate of change in the prices of individual houses
between 2 points in time, based on when the individual homes are transacted. This means that each house
price in any month’s sample is compared with its own previous transaction value. The various price inflation
rates of individual homes are then utilized to compile the average price inflation rate of the index over time.
The index is compiled from FNB’s own valuations database, thus based on the residential properties financed
by FNB over the past 18 years.
We apply certain “filters” and cut-offs to eliminate “outliers” in the data. They main ones are as follows:
• The maximum price cut-off is R15m, and the lower price cut-off is R20,000.
• The top 5% of repeat sales price growth rates, and the bottom 5% of growth rates are excluded from
the data set.
• Repeat transactions that took place longer than 10 years after the previous transaction on the same
home are excluded, as are repeat transactions that took place less than 6 months after the previous
transaction on the same home.
• The index is very lightly smoothed using a Hodrick-Prescott smoothing function with a Lambda of 5.