FLOW VISUALIZATION OF COg-FOAMAT RESERVOIR...
126
FLOW VISUALIZATION OF COg-FOAM AT RESERVOIR CONDITIONS Tom Cochrane Submitted in Partial Fulfillment of the Requirements for the Degree of Master of Science in Petroleum Engineering New Mexico Institute of Mining and Technology Socorro, New Mexico V October, 1989
Transcript of FLOW VISUALIZATION OF COg-FOAMAT RESERVOIR...

FLOW VISUALIZATION OF COg-FOAM AT RESERVOIR CONDITIONS
Tom Cochrane
Submitted in Partial Fulfillment of
the Requirements for the Degree of
Master of Science in Petroleum Engineering
New Mexico Institute of Mining and Technology
Socorro, New MexicoV
October, 1989

ABSTRACT
COj-foam is one solution to problems associated with COg flooding. Typically, COj
floods experience early breakthrough times and less than desirable sweep efficiencies. Foam
can be used to seal high-permeability streaks, layers, or preferential flow channels, forcing
the following COj into unswept matrix.
Mechanisms associated with foam fluid diversion of CO2 were investigated, along
with their corresponding implications on oil recovery and pressure gradient. The effects
of pore structure, surfactant concentration, flow rate, injection type, fluid saturations, oil
and surfactant system, and wettability were investigated.
A flow visualization apparatus was used to identify the mechanisms. It consists of
etched glass pore structures of varying heterogeneity and aspect ratio. These pore structures
are surrounded by an apparatus that allows displacements to be done at high pressure and
temperature. This apparatus permits the filming of displacement processes for their
extensive review. A series of 34 displacements were performed in four micromodels.
The results show that pore structure determines foam generation and fluid diversion
behavior. For instance, downstream snap-off was more prevalent in heterogeneous pore
structure with high aspect ratio, and upstream snap-off more prevalent in homogeneous
pore structures with low aspect ratio. Fluid diversion was by high-permeability channel
blocking in heterogeneous media. Fluid diversion in homogeneous media (low aspect ratio)
was characterized by the displacement of oil in inter-connected ganglia followed by the
blockage of the swept zone by foam.
Higher surfactant concentrations, simultaneous injection, non-spreading oils, water
wettability, and lower oil saturations produced better foaming.

In general, foam fluid diversion produced high sweep efficiencies by the
mechanisms described in this thesis. The manner in which these mechanisms are shown to
be affected by parameters such as pore structure are also described.
11

TABLE OF CONTENTS
ABSTRACT i
TABLE OF CONTENTS iii
LIST OF FIGURES v
LIST OF TABLES vHi
ACKNOWLEDGEMENT ix
NOMENCLATURE xi
Chapter 1. Introduction 1
Chapter 2. Literature Review 32.1 Foam Generation Mechanisms 3
2.1.1 Snap-Off 32.1.2 Bubble Division 52.1.3 Leave-Behind 52.1.4 Foam and Lamellae 6
2.2 Foam Propagation 62.3 Foam Blockage 72.4 Foam Stability and Coalescence 9
2.4.1 Surface Viscosity 92.4.2 Interfacial Tension 102.4.3 Surfactant Concentration 102.4.4 Dissolved Solids or Salt Concentration 112.4.5 Absolute Permeability 112.4.6 Wettability 122.4.7 Oil Phase 122.4.8 Surfactant Solution Saturation 132.4.9 Injection Type or Sequence 142.4.10 Foam Quality 152.4.11 Velocity or Pressure Gradient 162.4.12 Pressure and Temperature 17
2.5 Flow Visualization 172.6 Effect of Heterogeneity 192.7 Foam Field Tests 202.8 Foam Simulation 22
Chapter 3. Experimental Apparatus and Procedure 243.1 Glass Micromodel Preparation 243.2 Characteristics of Micromodels 253.3 High Pressure Cell 303.4 Flow System and Apparatus 33
3.4.1 Tubing 333.4.2 Pumps 333.4.3 Back-pressure 373.4.4 Videotape System 373.4.5 Pressure Monitors 373.4.6 Temperature Control 38
3.5 Procedure for Displacements 38
111
Chapter 4. Experimental Conditions and Data 404.1 Displacements Performed 404.2 Permeabilities of Micromodels 434.3 Pressure Drop Data 44
Chapter 5. Mechanisms of Foam Flow in Porous Media 465.1 Foam Generation Mechanisms 46
5.1.1 Snap-off 465.1.1a Downstream Snap-Off 475.1.1b Upstream Snap-Off 525.1.2 Bubble Division 585.1.2a Downstream Bubble Division 585.1.2b Upstream Bubble Division 615.1.3 Lamella Leave-Behind 615.1.4 Chain-Reaction Mechanism 63
5.2 Foam Collapse Mechanisms 655.2.1 Destabilization by Oil 655.2.2 Lamella Thinning and Rupture 67
5.3 Foam Propagation Mechanisms 685.3.1 The Effect of Foam Stability Propagation Mechanism 685.3.2 Single Bubble Flow Paths 69
5.4 Foam Fluid Diversion Mechanisms 715.4.1 Fluid Diversion in Heterogeneous Micromodels;
Foam Blockage 715.4.2 Fluid Diversion in Homogeneous Micromodels; Continuous
Phase Displacement 735.5 Some Parameters Affecting Foam Behavior 75
5.5.1 The Effect of Oil Type on Foam Behavior 765.5.2 The Effect of Surfactant Concentration on Foam Behavior ... 765.5.3 The Effect of Flow Rate on Foam Behavior 795.5.4 The Effect of Microscopic Heterogeneity on Foam Behavior . . 795.5.4.1 Pure CO2 Injection Experiments 795.5.4.2 Simultaneous Injection Experiments 82
Chapter 6. Summary and Recommendations 93
REFERENCES 97
Appendix. Pressure Drop Data 104A.l Results of Pressure Drop Recording 104A.2 Pressure Drop - Foam Behavior Correlation 104A.3 Capillary Pressure Considerations 105
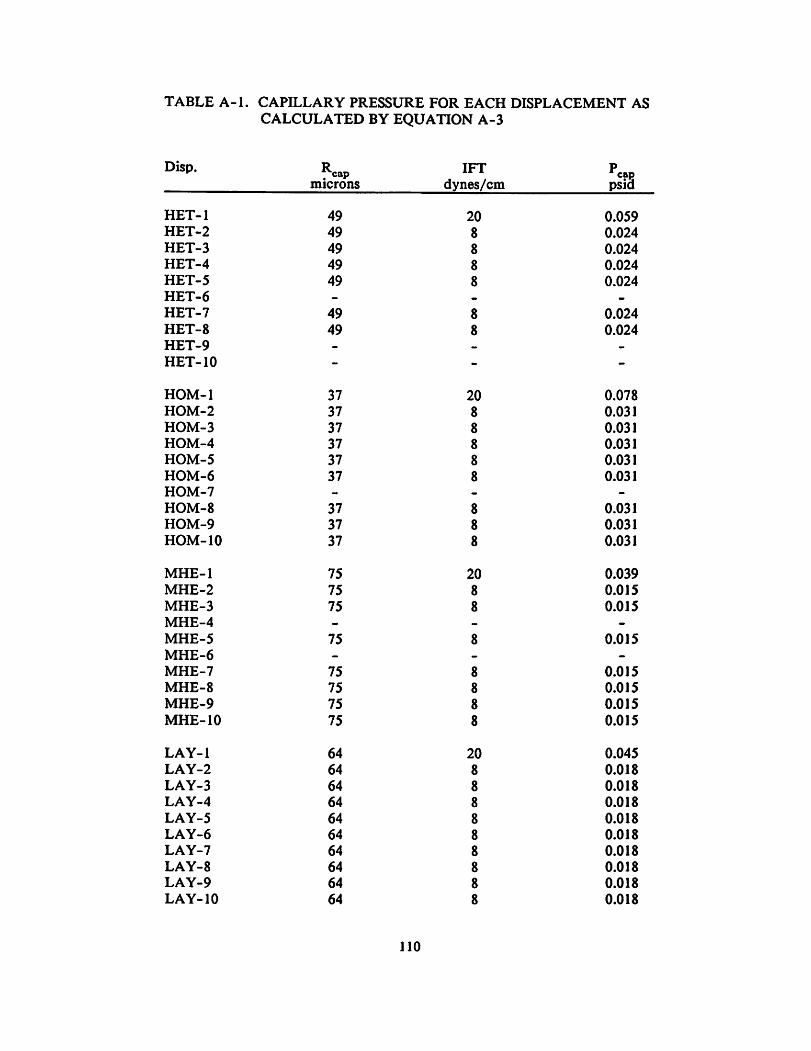
A.3.1 Capillary Pressure Calculations 106A.3.2 Results of Capillary Pressure Calculations 107
A.4 Relative Mobility Calculation 108
IV

LIST OF FIGURES
Figure 3-1 Above is the pore structure for HOM micromodel. Below is HOM's poresize distribution. Typical of homogeneous pore structures, it has a narrowdistribution. (After Bahralolom, 1985) 26
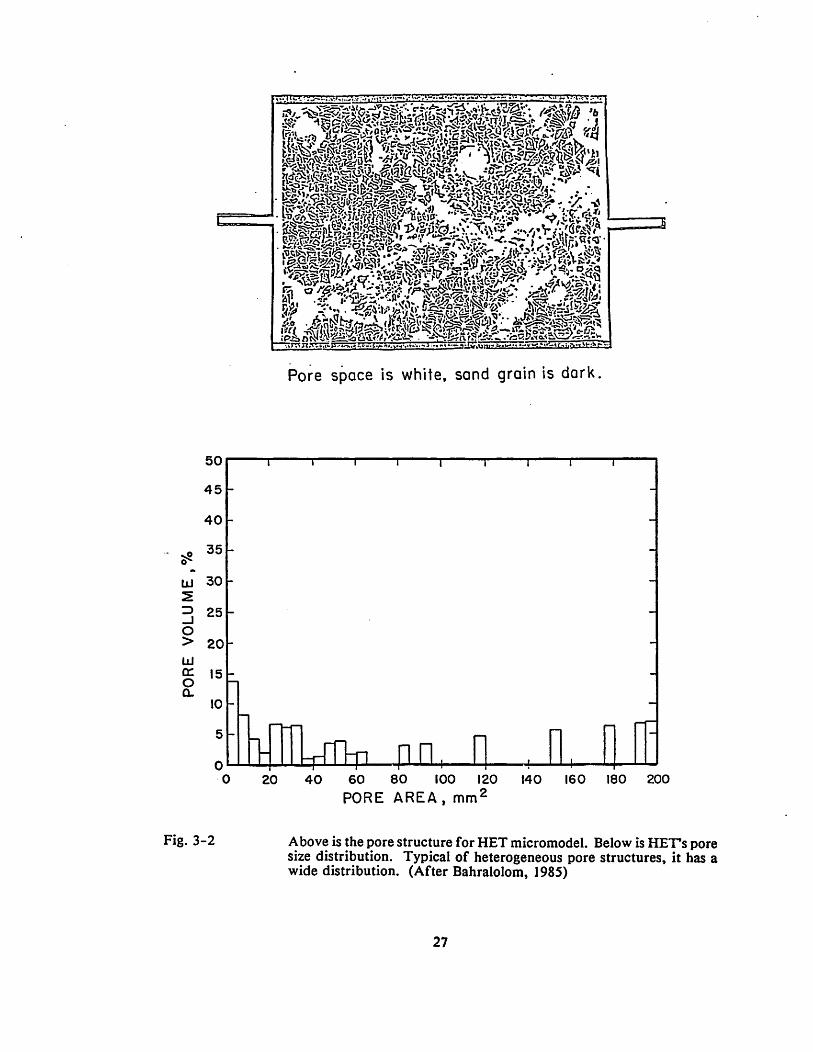
Figure 3-2 Above is the pore structure for HET micromodel. Below is HETs poresize distribution. Typical of heterogeneous pore structure, it has a widedistribution. (After Bahralolom, 1985) 27
Figure 3-3 Above is the pore structure for MHE micromodel. Below is MHE's poresize distribution. Typical of heterogeneous pore structures, it has narrowdistribution. Notice the wide entry channels on the left side have beenblocked off. (After Bahralolom, 1985) 28
Figure 3-4 Above is the pore structure for LAY micromodel. Below is LAY*s poresize distribution. A layered pore structure, it has well-defined pore sizedistribution with varying aspect radio. (After Huh et. al, 1988) ... 29
Figure 3-5 Top figure is overhead view of high-pressure cell. The bottom figure isa cross-section of the cell. The white portion in the center is the glycerinechamber 32
Figure 3-6 High-pressure clamp. This is the clamp used to attach the flowlines to themicromodels. (After Campbell, 1983) 34
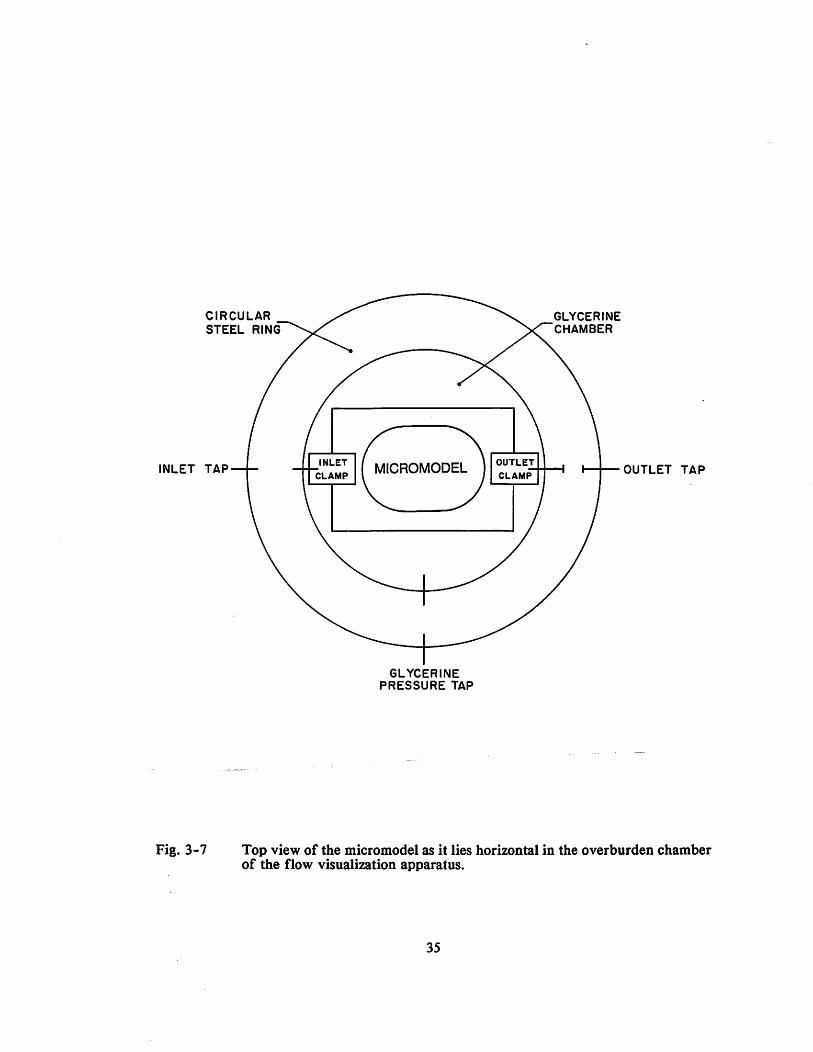
Figure 3-7 Top view of the micromodel as it lies horizontal in the overburdenchamber of the flow visualization apparatus 35
Figure 3-8 Flow visualization apparatus. (Huh, et al., 1988) 36
Figure 5-1 Downstream snap-off mechanism 48
Figure 5-2 Inlet structure of HET. Note wide entry channel 49
Figure 5-3 Inlet pore structure of MHE. Note wide entry channel is blocked5 . 50
Figure 5-4 Pore structure of HET indicating location of pore constrictions inpreferential flow channel. These pore constrictions are required for thedownstream snap-off mechanism 51
Figure 5-5 Sweep efficiencies for COg displacing 5% AlipalCD-128 in the four porestructures 53
Figure 5-6 Sweep efficiencies for COg and surfactant solution displacing crude oil atconnate water 54
Figure 5-7 Upstream snap-off mechanism 55
Figure 5-8 21 upstream snap-off sites in displacement HET-8. It can be seen thatsignificant foam can be generated by this mechanism 57
Figure 5-9 Bubble division mechanism. Liquid flows to separate a larger bubble intotwo smaller bubbles 59

Figure 5-10 Downstream bubble division 60
Figure 5-11 Upstream bubble division 60
Figure 5-12 Leave-behind mechanism of foam generation; lamellae between pore grainsa, b, and c are formed as two COg paths advance in adjacent paths. 62
Figure 5-13 The chain-reaction mechanism of foam generation 64
Figure 5-14 Single bubble flow paths. When foam flowed, it tended to flow as onebubble in a cross section perpendicular to the flow direction 70
Figure 5-15 Foam is introduced into a heterogeneous pore structure with the purposeof blocking a preferential flow path 72
Figure 5-16 The principal larger flow paths of HET (and MHE) in which COj wouldtend to flow as a continuous phase 74
Figure 5-17 Pressure drop across the micromodel as a function of oil/water system forDisplacements MHE-8, -9 and -10. The water-wet system (Soltrol orrefined oil system) produced higher pressure drops 77
Figure 5-18 Pressure drop across the micromodel as a function of PVI C(^ andsurfactant concentration. This data was taken for displacements LAY-1, -2, -3, and -4. Pressure drop appears to increase with surfactantconcentration 78
Figure 5-19 Sweep efficiency as a function of flow rate and PVI CO^, fromDisplacements LAY-2, -5 and -6. Sweep efficiency appears to increasewith flow rate varying (in our system) from 10 to 120 ft/day 80
Figure 5-20a Shaded areas of the pore structure of HOM indicate unswept surfactantsolution saturations at 0.84 PVI for Displacement HOM-3 81
Figure 5-20b Shaded areas of the pore structure of HOM indicate unswept surfactantsolution saturations at 6.0 PVI for Displacement HOM-3 81
Figure 5-2la Shaded areas of the pore structure of HET indicate unswept surfactantsolution saturations at 1.0 PVI for Displacement HET-3 83
Figure 5-2lb Shaded areas of the pore structure of HET indicate unswept surfactantsolution saturations at 6.0 PVI for Displacement HET-3 83
Figure 5-22a Shaded areas of the pore structure of MHE indicate unswept surfactantsolution saturations at 1.0 PVI for Displacement MHE-3 84
Figure 5-22b Shaded areas of the pore structure of MHE indicate unswept surfactantsolution saturations at 6.0 PVI for Displacement MHE-3 84
Figure 5-23a Darkened layers of the pore structure LAY indicate swept surfactantsolution saturations at 1.0 PVI for Displacement LAY-3 85
Figure 5-23b Darkened layers of the pore structure LAY indicate swept surfactantsolution saturations at 6.0 PVI for Displacement LAY-3 85
VI

Figure 5-24
Figure 5-25
Figure 5-26
Figure 5-27
Figure 5-28
Figure 5-29
Sweep efficiency as a function of micromodel heterogeneity and porevolumes of COj injected (single phase COj injected into a surfactantsolution saturated micromodel, Displacements (model) -3) 86
Sweep efficiency for Displacement HOM-8 (simultaneous injection ofsurfactant solutio and COj into crude oil connate water). The shaded areasindicate unswept oil saturations at; a) 0.86 PVI, b) 1.84 PVI, c) 3.86 PVI,and d) 6.0 PVI COj 88
Sweep efficiency for Displacement HET-8 (simultaneous injection ofsurfactant solution and COj into crude oil connate water). The shadedareas indicate unswept oil saturations at; a) 0.0 PVI, b) 1.26 PVI, c) 1.82PVI. and d) 6.0 PVI CO2 89
Sweep efficiency for Displacement MHE-8 (simultaneous injection ofsurfactant solution and COj into crude oil connate water). The shadedareas indicate unswept oil saturations at; a) 0.0 PVI, b) 1.2 PVI, c) 2.0 PVI,and d) 6.0 PVI CO2 90
Sweep efficiency for Displacement LAY-8 (simultaneous injection ofsurfactant solution and COj into crude oil connate water). The shadedlayers indicate unswept oil saturations at; a) 1.04 PVI, b) 2.0 PVI, c) 60 PVICO, 91
Sweep efficiency as a function of micromodel heterogeneity and porevolumes of CO2 injected (simultaneous injection of COj and surfactantsolution into crude oil at connate water.Displacements (model) -8) 92
Vll

LIST OF TABLES
Table 3-1 Characteristics of micromodels 31
Table 4-1 Summary of flow visualization experiments 41
Table 4-2 Properties of the fluids 42
Table 4-3 Micromodel permeability calculations 45
Vlll

ACKNOWLEDGEMENT
I would like to thank Dr. Frank Kovarik for his support, guidance, and advice in
my endeavors.
There is not a single member of the PRRC staff, led by F. D. Martin, Director (and
Dr. J. J. Taber, Director Emeritus) who did not help this work towards its completion.
Special efforts by Dr. Dae G. Huh, Ibrahim Bahralolom, and Mary Graham were
instrumental.
I am indebted to Dr. F. M. Orr, Jr., Bruce Campbell, and Ibrahim Bahralolom for
developing the flow visualization apparatus to the point where it could be adapted for this
study.
I would like to thank F. D. Martin, Dr. Norman Morrow, Dr. John Heller, and Dr.
Randy Seright for providing support through their advice, and that of their respective
group members. I received true cooperation from all groups.
1 thank Carol Dotson for the typing, Kevin Clower and Jessica McKinnis for the
drafting. I am grateful and indebted to K. Allbritton for typing and coordinating the
completion of this thesis.
This work is a part of that from a research group supported by the following:
Abu Dhabi Reservoir Research Foundation
Amoco Production Company
ARCO Oil and Gas Company
Chevron Oil Field Research Company
Conoco, Incorporated
IX
Exxon Production Research Company
Japan National Oil Corporation
Marathon Oil Company
Mobil Research and Development Corporation
New Mexico Research and Development Institute
Occidental Oil and Gas Company
Petro-Canada Resources
Shell Development Company
Societe Nationale Elf Aquitaine (Production)
Sohio Petroleum Company
Sun Exploration and Production Company
Tenneco Oil Company
Texaco, Incorporated
United States Department of Energy
Special gratitude is due to my family and friends who make my life a better life,
and especially Lisa, for being patient and supportive.

NOMENCLATURE
Nca capillary number
CMC critical micelle concentration
d flow channel diameter
k permeability
kr relative permeability
Lb average bubble length
Lp distance of penetration, similar to Xb
Lr distance over which capillary pressure is in effect
Nb number of bubbles
N,c Reynolds number
P pressure
PV pore volume
PVI pore volumes injected
Q flow rate, volume/time
R radius
Rb average bubble radius
Rc radius of curvature
Rch Flow channel radius
Rg radius of grains, or beads
Ri smaller principal radius of interface curvature
R2 larger principal radius of interface curvature
S spreading coefficient
(SS) surfactant solution
t time
u flow velocity, interstitial
V fluid velocity
V' foam foam volume
XI

X distance along a given path
Xb length of bubble penetration
/i viscosity
non-wetting phase viscosity
IT 3.14
a interfacial tension
p fluid density
<i> porosity
ANbf destruction rate of bubbles at point of furthest bubble penetration; thebubble front
APc capillary pressure
Xll

Chapter 1. Introduction
Carbon dioxide flow through preferential flow channels in porous media can be
reduced or eliminated with the use of foam. The oil recovery mechanisms characteristic of
carbon dioxide are enhanced by the contacting of higher oil saturations. The bottom line
is lower carbon dioxide recycling costs, and improved oil recovery.
A comprehensive study of foam mechanisms and their implications for oil recovery
has been made. Care was taken to gather data at realistic oil field conditions.
The mixing of carbon dioxide and surfactant solution in porous media will, under the
right conditions, generate a very viscous foam (emulsion). There are three basic
mechanisms for foam generation; snap-off, leave-behind and bubble division. Parameters
such as pore structure, injection sequence, quantity and quality of the fluids present (liquid
saturations and types), surfactant concentration, wettability, and flow rate are shown to
affect foam behavior. These factors determine foam characteristics. These characteristics,
in turn, determine the mechanisms of fluid diversion and oil recovery.
High aspect ratio, periodic surfactant solution injection, high surfactant solution
saturations, higher surfactant concentrations, water wettability, and a range of flow rates
are shown to improve foaming. The complexity of the influence of these factors on foam
as a fluid diversion agent is the most significant point of this analysis.
These same parameters also affect the stability of the foam generated. In general, a
factor that improves foaming also improves foam stability. An exception is that a low
aspect ratio pore structure can be less tortuous on generated foam, and therefore support
its stability.

Foam propagates by the break and reform process, or by translation. Foam (or
bubbles) is generated at the outlet of small constrictions in the break and reform process.
Bubbles tend to collapse before entering another constriction. If existing conditions support
foam stability, the mechanism of foam propagation is more by translation. In translation,
no foam is destroyed as it passes through one constriction after another.
The basic mechanism of foam as a fluid diversion agent is consistent. First, foam is
generated in a region previously swept by carbon dioxide. Flow in this region is then
reduced, or eliminated altogether. The pressure drop across this region allows carbon
dioxide to flow into previously unswept regions, and displace more oil. In heterogeneous
pore structures, foam blockspreferential flow channels and allowsCO2 to flow into unswept
areas. In homogeneous pore structures, foam is generated in swept zones (regardless of the
zones permeability), again allowing COj to enter the unswept zones.
In the research, as many parameters as possible were kept true to real oil field
conditions. Reservoir temperature and pressure are similar to those found in West
Texas/Southeast New Mexico COj floods. Crude oil from Southeast New Mexico is used.
Pore structures studied include those developed from a San Andres carbonate rock sample.
The surfactant has been used for fluid diversion in field applications already. Flow rates
of 10 ft/day can be found near the wellbore in a COj flood.
These conditions, and the range of parameters studied make this a comprehensive
study of the mechanisms determining how foam improves sweep efficiency. The logical
extension of this work will be a means of predicting the results of a foam treatment.

Chapter 2. Literature Review
Previous researchers have investigated foams as fluid diversion or mobility control
agents in oil recovery. This chapter discusses the effects of various parameters on foam
flow behavior. The use of foam to improve sweep efficiency was discussed early by Fried
(1971). Fried reported on a broad range of characteristics of foam flow and oil recovery.
The large volume of research that has followed has refined foam technology considerably.
2.1 Foam Generation Mechanisms
Foam generation at the pore level is characterized by a surfactant carrying aqueous
phase enveloping a gas phase that measures on the order of a pore diameter. The
mechanisms by which foam bubbles or lamellae are generated have been described as
snap-off, bubble-division, and leave behind.
2.1.1 Snap-Off
Snap-off is the term used to describe bubble formation where the wetting phase flows
into a pore constriction, isolating the non-wetting phase in an adjacent pore body. The
non-wetting phase thus becomes discontinuous. This phenomena is not specific to foams,
and has been seen in waterfloods of oil in a water-wet porous media. Here the oil phase
snaps-off in pore bodies when water flows into neighboring pore constrictions.
Roof (1970) described the situation where oil flowed through a water-wet pore
constriction into a larger adjacent pore body. His model was based on a toric pore throat
(a tore is similar in shape to an o-ring seal, the hole of which represented the pore
constriction. With no physical obstruction downstream of the pore constriction, the oil
expands at the pore outlet. His analysis was based on the capillary pressures involved, and

neglected viscous components (assumed a static condition). He deduced that the oil front
must expand to at least 7.07 pore radii from the pore constriction for the wetting phase to
flow back into the pore constriction, and snap-off to occur. This corresponds to an aspect
ratio (pore body to constriction diameter ratio) of 3.54. He also deduced that pore
irregularity (non-circular pore constrictions) would enhance snap-off by providing channels
for the wetting phase to flow more easily into a pore constriction.
The high aspect ratio condition for snap-off is supported by a wealth of research. It
is supported by Mast (1972) in etched glass micromodels, and by Owete and Brigham (1987)
in etched silicon micromodels. Mast (1972) also noted that snap-off also occurred near the
production port of his micromodel, where pore constrictions are adjacent to a larger
diameter flow channel. Holm (1968) observed that snap-off occurred at the exit of pore
constrictions in a sandpacked capillary tube.
Radke and Ransohoff (1986) observed the snap-off mechanism in mono-disperse glass
bead packs. They concluded that the importance of snap-off depended on the number of
foam generation sites. They further qualified the conditions needed for gas to snap-off in
a water wet pore. Three criteria for snap-off are needed. The first is that gas must flow
from a pore constriction into an adequate (large enough aspect ratio) pore body. Second,
there must be adequate time for liquid to flow back into the pore constriction. Finally,
liquid must be available to flow into the pore constriction. They also observed snap-off
when gas flows from a higher to a lower permeability zone.
Falls et al. (1986) concluded that when gas flows across a boundary from a lower to
higher permeability zone, liquid tends to accumulate, and snap-off occurs. This agrees with
Mast (1972), and Radke and Ransohoff (1986).

These previous researchers have described snap-off when a non-wetting phase invades
a wetting phase saturated pore body. Mahers and Dawe (1986) described the snap-off of
oil in pore bodies when water invades the pore structure. Here the wetting phase is imbibed
into the pore constrictions surrounding an oil phase, and oil is snapped-off. Mahers and
Dawe termed this manifestation of snap-off 'forward snap-ofr. They also stated that pore
geometry influences capillary pressure (and hence snap-off), and that there is an aspect
ratio below which no oil can be trapped.
2.1.2 Bubble Division
Bubble division is the foam generation mechanism by which a larger bubble is
fractioned into smaller bubbles. Radke and Ransohoff (1986) termed this *lamella division*.
They described a case where a single bubble is split at a point where one flow path branches
into two. The bubble flows into both channels, and the following surfactant solution divides
the original bubble across the branch point.
2.1.3 Leave-Behind
Mast (1972) observed that when gas flowed in separate but adjacent channels, thin
films were left behind in the pore constrictions that separated the channels. Mast stated that
since few films were formed this way, this mechanism has little effect on the flow process.
Radke and Ransohoff (1986) also observed this phenomena, stating that this mechanism was
not responsible for the generation of separate foam bubbles. Considering this and that these
bubbles were not seen to flow, they concluded that these lamella did little to increase
resistance to gas flow.

. 5•::• 'V?-liy'-/-;; ;rv-_S.- ••
": :l ;,
•••;v v:-,.
•T;
3:,..
. •.» -.; ^.
•*;. . . •:
' ' • •
• - :ir^\ :•
> -•• • . -'• '00 "V-: ! •
1 • .•
'•'a;-;.'
•;
r ^ - VVJ./.
.d-: ;•;;•••'
: • . X??-•'"% : "'>i' •• ''"
ri-.V' -' l^l ;:- • " .'i

2.1.4 Foam and Lamellae
Hirasaki and Lawson (1985) considered that bubbles tend to form to the spherical
shape that minimizes surface area for a any given finite volume. When a bubble has a
volume that allows a spherical diameter less than the pore width, this bubble is a foam
bubble.
When a bubble has a volume that will not allow a spherical shape within the pore, the
bubble becomes elongated. The liquid films that separate these elongated bubbles are called
lamellae.
These are the mechanisms by which previous researchers believe foam is generated
in porous media. Once foam is generated, it must be understood how foam propagates, and
can improve sweep efficiency and oil recovery.
2.2 Foam Propagation
Once a foam or lamellae are generated, we must look at the processes associated with
the propagation of the gas and liquid comprising the foam.
There are presently two mechanisms of foam propagation suggested by researchers.
The break-and-reform process, and the translation process. The first proposes foam
bubbles or lamellae that consistently break and are reformed; the other that films and
bubbles are stable as they propagate.
Holm (1968) proposed the 'break and re-form* process for foam propagation. This
proposal was based on observations of foam flow in a sandpacked capillary tube. He
observed that bubbles were generated at the outlet of a pore constriction. These bubbles

coalesced near the entry to the next pore constrictions. He concluded that liquid flowed
through the network of films surrounding gas bubbles. Also, the flow rates of gas and
liquid are affected by the number and strength of the films separating the bubbles. This
process governing foam flow was confirmed by the observations of Mast (1972), and Owete
and Brigham (1987) in heterogeneous micromodels.
Lescure and Claridge (1986) concluded that water does not flow through COj flow
paths after a foam has passed, instead it flows in independent paths. This conclusion was
based on observations of simulated COj/foam system in a beadpack. This observation
complements that of Holm (1968) in determining that liquid flows through the network of
films separating the bubbles.
Falls et al. (1986) determined that foam flowed by the break-and-reform process
when lamellae are unstable, and by translation when they are stable. The factors that
determine film stability (such as surfactant concentration and wettability), determine the
propagation mechanism. They also developed a foam simulator described later in this
chapter.
2.3 Foam Blockage
The advantage of foam in porous media is that it can selectively block preferential
flow channels. These channels can be the result of viscous fingering, reservoir
heterogeneity, or gravity override. The presence of a low-mobility foam can either reduce
or eliminate flow through zones or channels previously swept by COj.
Bernard and Holm (1968) proposed foam as a selective blocking agent. In sandpacks
and cores, they found that gas mobility reduction increased with permeability. Since gas

flow is reduced to a greater degree in a more permeable zone, more gas will enter the less
permeable zone.
To complement the findings of Bernard and Holm, Raza (1969) found that oil
suppressed foamability. This indicates that when injected fluids enter a lower permeability
zone, oil destabilizes the foam, and the zone will conduct more fluids. Target zones will be
displaced, and not blocked.
Casteel and Djabbarah (1986) used foam successfully to divert COg from a 154 md
core into a 24 md core. The cores in this experiment could be considered to represent two
non-communicating layers in a reservoir. First, CO2 was injected into two parallel cores
saturated with oil at connate water. Next, a small pore volume of surfactant solution was
injected. This wasfollowedwith moreCOj injection. This foam injected displacementwas
compared to a pure CO2 displacement at the same conditions. In the pure CO2
displacement, all of the oil from the more permeable core, and none from the less permeable
core was recovered. In contrast, with the foam treatment, recovery in the less permeable
core ranged from 86.3 to 91.1 percent.
Wang (1984) concluded that improved oil recovery during foam flooding was the
result of foam blockage in preferential flow channels. Foam retarded CO2 gravity override
in a horizontal beadpack. Sweep efficiency and breakthrough PVI were improved.
Based on the successes of some of these laboratory studies, foam has been applied to
oil recovery in field projects. These projects are described in Section 2.7.

2.4 Foam Stability and Coalescence
As foam propagates through a porous media, interactions take place between the pore
structure and the other liquid saturations. We must consider what factors favor foam
stability, and which favor coalescence. The following factors are generally agreed to favor
foam stability:
higher surface viscosity
lower surface tension
higher surfactant concentration
higher dissolved solid concentrations
higher absolute permeability (favors mobility
reduction, but not foam stability)
aqueous phase wettability
lower oil saturations
simultaneous or alternating injection of CO2 and
surfactant solution
foam quality around 80%
a range of flow velocities
higher pressures and lower temperatures
The research supporting these conclusions is described in the following sections.
2.4.1 Surface Viscosity
Kanda and Schecter (1976) found that when foam bubbles exhibited higher surface
viscosity, they were less likely to rupture when disturbed. Sharma et al. (1986) reported that
higher surface viscosity reduces the rate of film thinning. We can deduce that higher
surface viscosity favors foam stability.

2.4.2 Interfacial Tension
Raza (1969) stated that lower interfacial tension between an oil and the aqueous phase
can cause more emulsification and less foaming. Some surfactant molecules are used to
stabilize the oil/water interface, and are not available to stabilize foam bubbles. We can
deduce that lower oil/water interfacial tension inhibits foam stability.
2.4.3 Surfactant Concentration
Mast (1972) saw that in a heterogeneous micromodel, foams were more stable when
surfactant concentrations were higher. Owete and Brigham (1987) observed that smaller
bubbles were generated at higher surfactant concentrations. Combining this information
yields the conclusion that smaller bubbles are more stable.
Marsden and Khan (1965) found that increasing surfactant concentration increased
the apparent viscosity of a foam produced from a core. Holm (1968) showed that
permeability reduction increased with surfactant concentration in sandpacks. Bernard et
al. (1965) showed that trapped gas saturation increases, and the relative permeability to
water decreases as surfactant concentration increases in sandpacks. They also showed these
effects approached some asymptotic limit. Owete and Brigham (1987) also saw that
effective air mobility is lower with higher surfactant concentration in both heterogeneous
and homogeneous micromodels.
Albrecht and Marsden (1968) saw that increased surfactant concentration increases
the pressure drop across consolidated or unconsolidated sands at which gas flow stoppage
(foam blockage) can occur.
10

Huh (1986) determined that although a higher surfactant concentration increases
liquid recovery at breakthrough, final liquid recovery was not affected in corefloods. He
also determined that the optimum concentration of surfactant was above the critical micelle
concentration.
Lee and Heller (1988) measured mobilities of pre-generated foams injected through
cores of differing permeability. They concluded that invariably, CO2 mobility decreases
with surfactant concentration. This effect reaches some asymptotic limit above the critical
micelle concentration (CMC).
2.4.4 Dissolved Solids or Salt Concentration
Dissolved salts or solids have the effect of reducing the surfactant concentration in
the body of liquid films separating gas bubbles forcing surfactant molecules to the interface.
This reduces the number of surfactant molecules needed to saturate the fluid interface, and
effectively reduces the CMC. This is beneficial in that in the presence of a salt, less
surfactant is needed to produce the same interfacial tension.
Data from GAF corporation shows that there is a range of salt concentrations that
improve foam stability for Alipal CD-128.
2.4.5 Absolute Permeability
Bernard and Holm (1968) found that foam reduced the permeability of a loose sand
to a greater degree that a tight sand. They also found that foam stability decreased with
absolute permeability, and a lower pressure drop was required to break down a foam in a
more permeable porous media (but these pressure drops probably cannot be found in real
reservoirs).
11

Albrecht and Marsden (1968) found that better foam blockage was obtained with
unconsolidated sand. Lee and Heller (1988) also found that greater mobility reduction was
found in more permeable porous media.
2.4.6 Wettability
Mast (1972) observed that wettability was important to the foam blockage mechanism.
Radke and Ransohoff (1986), and Roof (1970) used analyses that assumed water wettability
for foam generation by the snap-off mechanism. Lescure and Claridge (1986) studied
water-wet, oil-wet, and intermediate wet systems and concluded that foam reduces gas
mobility in the water- and intermediate- wet systems.
2.4.7 Oil Phase
Wang (1984) determined that foam coalesced upon contact with crude oil. Bernard
et al. (1965) found that the presence of oil reduced a foams ability to reduce water relative
permeability. This was the direct result of a lower trapped gas saturation. Friedman and
Jensen (1986) stated that oil was detrimental to foam generation and propagation.
Lau and O'Brien (1986) determined that an oil that spreads on foam films will cause
the films to rupture. A spreading coefficient that is a function of fluid interfacial tensions
can help determine the spreading nature of a given oil.
Jensen and Friedman (1987) found that whether or not the oil phase affects foam
behavior is surfactant specific. Lau and 0*Brian (1986) found an oil dependence. If an oil
tends to spread on a liquid surface, it will destabilize foam. Non-spreading oils do not have
this effect. They also found that if oil contains polar components, these are attracted to the
12

oil/water interface, and may inhibit foaming. Nikolov et al. (1986) studied the mechanisms
by which oil destabilizes foam.
Kuhlman(1988) investigated the effects of COj-Oil displacement phase behavioron
emulsion and foam stability. This study determined that light hydrocarbons stripped from
a crude oil into the COj phase are detrimental to film stability. These lighter hydrocarbons
are detrimental to foam stability because they tend to spread on the foam films.
2.4.8 Surfactant Solution Saturation
Bernard and Holm (1968) found that a foam bank will break down if surfactant
solution is not added to the porous media periodically. Albrecht and Marsden (1968) found
that foam can block gas flow in porous media under higher pressure drops at higher
surfactant solution saturations. This is because a foam is a thermodynamically unstable
structure, and tends to coalesce due to film drainage. Therefore surfactant solution must
be added periodically to maintain foam blockage.
Persoff et al. (1989) conducted studies where surfactant solution and gas were injected
simultaneously into Berea cores. Their results show that liquid saturation remains constant
at around 0.30 to 0.35 regardless of steady foam flow rate. Also, liquid flows in accordance
to Darcy*s law; (i.e., a given liquid saturation has the same relative permeability regardless
of whether foam is present or not).
Manlowe and Radke (1988) determined that psuedo-emulsion film (the surfactant
solution on the foam-oil interface) stability was critical to foam stability. They found no
correlation with spreading coefficient as discussed by Lau and 0*Brien (1986).
13

2.4.9 Injection Type or Sequence
In addition to Bernard and Holm*s conclusion that surfactant solution must
periodically be added to the porous media to maintain a foam, Raza (1969) concluded that
foam behavior depended on the fluids initially in the porous media. Whether surfactant
solution is injected as a single slug, multiple slugs, or continuously affects what the initial
saturation of the porous media is before a given cycle of foaming agent injection.
Wang (1984) used a 32 darcy beadpack to compare the performance of pregenerated
to in-situ generated foam. In experiments in the absence of an oil phase, the pregenerated
foam exhibited gravity override; the in-situ generated foam displaced in an even front in
a piston-like fashion. Breakthroughof COj with the in-situ generated foam coincided with
the arrival of the foam at the producer. Also, the trend of his results indicate that
alternating COj and surfactant injection favor oil recovery more than a one-slug injection
method.
Casteel and Djabbarah (1986) found that foam behavior is affected by the order of
injection of foaming agents. They also found better foam performance when surfactant
solution was injected after some CO2 injection (as opposed to simply pre-flushing an oil
saturation with surfactant solution and following with CO2). Lescure and Claridge (1986)
obtained similar results, finding that a more uniform displacement front developed in a
beadpack when surfactant solution was injected after COj. Shirley (1988) concluded that
injection method (alternating vs. simultaneous injection) and rock heterogeneity are the
most important factors in determining foam generation mechanism(s).
14

2.4.10 Foam Quality
Foam quality is the ratio of gas volume to total foaming agent (surfactant solution and
gas) volume. Foam quality has been seen to affect foam behavior. Friedmann and Jensen
(1986) determined that a minimum foam quality of 50% was needed for a stable foam.
If we assume that the degree of foam stability is reflected in reduced gas mobility,
more information is available to review the question of the foam quality affects foam
stability. Marsden and Khan (1965) found that the apparent viscosity of foams increased
with foam quality in short sandpacks. Friedmann and Jensen (1986) found that high quality
foams resisted flow more that low quality foams. Patton et al. (1983) found similar results
in a capillary tube.
Wang (1984) determined that increasing the ratio of surfactant solution to CO2
increased the foam quantity, but decreased foam quality generated in the apparatus used.
His work indicated that a quality of 75 to 85 percent would be best, with some adjustments
made for higher temperature.
Keuhne et al. (1988) determined that a 60% foam quality reduced foam mobility more
than an 80% foam with laboratory tests. However, after evaluating a field foam test they
suggested an 80% quality would have been more operationally functional. Lee and Heller
(1988) also found that a 60% quality foam achieved a maximum mobility reduction. Persoff
et al. (1989) concluded that foam texture is the most important factor determining foam
reduction of gas relative permeability, based on steady foam flow in Berea cores.
15

2.4.11 Velocity or Pressure Gradient
Many researchers have studied the effect of velocity on foam behavior. Different
porous media and ranges of flow rates have been studied. In addition to studying changes
in gas mobility with velocity, Radke and Ransohoff (1986) determined a minimum gas
velocity for foam generation in a given porous media. This criteria is manifested in a
dimensionless capillary number
<W
Their analysis and results show that a minimum of around 8 is needed for foam
generation by snap-off. For a given porous media, and fluid saturations, this corresponds
to a minimum velocity. Based on visual observations of different foam generation
mechanisms and their contributions, they determined that snap-off is the most important
mechanism, and the onset of snap-off the onset of significant foam generation. Note,
however, that the system they used had no initial gas saturation. Friedmann and Jensen
(1986) also found that no foam was generated at low flow rates.
Holm (1968) found that foam can break down at higher pressure gradients. Albrecht
and Marsden (1968) found that foam blocking can be overcome at a pressure above that at
which foam blockage occurred.
Lee and Heller (1988) found that when surfactant concentrations are relatively low,
foam does exhibit some shear-thinning behavior. This conclusion could not be extended
to systems of higher surfactant concentration. The range of flow rates studied was relatively
small, 1 to 15 ft/day.
16

Rossen (1988) determined that the pressure gradients required to mobilize a stable
foam are found only in regions near a wellbore. A foam designed to propagate through a
reservoir must be generated near the wellbore, and gradually coalesce as it travels through
the reservoir. Persoff et al. (1989) determined that increasing gas velocity reduces steady
flow resistance in Berea cores.
2.4.12 Pressure and Temperature
Bernard et al. (1980) found that a surfactant may break down at higher temperatures.
Specifically, Alipal CD-128 hydrolyzed at temperatures in the 150®F range, at low pH.
Wang (1984) used a foam generation apparatus to determine foamability as a function
of pressure and temperature. As temperature increased, higher pressures were required to
generate substantial foam.
Friedmann and Jensen (1986) found that low pressures were detrimental to foam
stability. Wang (1984) concluded that higher pressures favored foam stability.
Rossen (1988) determined that the pressure gradient at which a given textured foam
is mobilized is a function of the discontinuous phase compressibility. The compressibility
of COg decreases with increasing pressure. We can deduce that higher pressures enhance
the blocking potential of a COj/foam.
2.5 Flow Visualization
Many researchers have used flow visualization to sort out the complex pore-level
behavior of foam. Holm used a sandpacked capillary to observe that foam propagates by
the break-and-reform mechanism. Mast (1972) used heterogeneous micromodels to observe
17

foam blockage, and evaluate the effects of some parameters on foam flow. Owete and
Brigham (1987) used micromodels to find that foam behavior, and gas mobility reduction
is a function of pore structure, and surfactant concentration. Radke and Ransohoff (1986)
used a uniform beadpack to identify different foam generation mechanisms and correlate
them with their importance to gas mobility reduction. All of these previous studies involved
low pressure gas and surfactant solution. Despite the simplicity of the fluids and saturations
used in these experiments, valuable information was derived from each study.
It is of interest to use a flow visualization apparatus capable of high-pressures and
temperature. Campbell and Orr (1983) used such a system to observe C02-Crude Oil
displacements. Bahralolom et al. (1985) used the same apparatus to study the phase behavior
effects on COj-crude oil system. They used the flow visualization apparatus to compare the
importance of solubility and extraction in the same COj-crude oil system. These
displacements were done at pressures up to 1200 psia and 75°F. The pore structures
developed by these researchers were both heterogeneous (derived from actual thin sections)
and homogeneous.
Martin and Kovarik (1987) reported flow visualization experiments at 1500 psia, and
105'F. These authors looked for pore-level interactions of Water-Alternating-Gas (WAG)
injection following a polymer gel treatment. This work was extended by Martin et al.
(1988). The heterogeneous pore structures used are an excellent tool for evaluating the pore
level performance of fluid diversion agents such as polymer gels, and CO^/foams.
Shirley (1988) used a high pressure and temperature flow visualization apparatus
(similar to the one used in this study) to study foam. Many of his results correspond well
to those in this study. Important results of his study are discussed in Section 2.6.
18

2.6 Effect of Heterogeneity
At the pore level, different porous media display different pore size distributions and
geometries. The uniqueness of a porous media is macroscopically reflected in the absolute
permeability, porosity, and flowing fraction.
A microscopically homogeneous porous media has a very narrow pore size
distribution. In contrast, heterogeneous porous media are characterized by wider pore size
distributions.
Flow visualization studies have given some insight into the pore level mechanisms
associated with foam blockage. Mast (1972) observed that foam flow paths continually
changed in a heterogeneous micromodel. Flow in some portions of the model were
temporarily blocked by foam. Mast concluded that this blockage was the result of the
saturation distribution, wettability, and the influence of flow rate on surface tension. On
the pore level, he analyzed the capillary effects involved in the trapping of a non-wetting
phase bubble in a funnel shape constriction (similar to the Jamin effect). He also predicted
that less blockage would occur when the change in diameter of a flow path with distance
along the flow path is small. Owete and Brigham (1987) also found that blocking was a
function of pore geometry.
Owete and Brigham (1987) showed that bubbles could not be formed in a
homogeneous micromodel when a gas displaced surfactant solution. They observed only
films formed by the leave-behind mechanism. It is important to note that while porous
media such as beadpacks, sandpacks, and cores may be considered macroscopically
homogeneous, they may also display pore level heterogeneities. The random packing these
porous media can exhibit results in a wider variety of pore constriction and body sizes, and
pore-level heterogeneity.
19

Lescure and Claridge (1986) simulated reservoir foaming conditions with different
fluids at atmospheric pressure in a uniform beadpack. They found that no foam was
generated when COj is injected into surfactant solution. Instead, the COj overrides the
other saturations in the beadpack. In contrast, foam wasgenerated when CO^ was injected
first, followed by surfactant solution, and then COj again.
Wang (1984)deduced from his studies of COj/foam displacements in beadpacks that
this process would be more effective in heterogeneous porous media. The application being
the plugging of preferential flow channels near the COj injector wellbore.
Shirley (1988) determined that foams generated in homogeneous pore structures have
a different morphology than those generated in heterogeneous pore structures. Snap-off is
given as dominant mechanism of foam generation in heterogeneous porous media. He
concludes that heterogeneity and injection method ( alternating vs. simultaneous injection
of gas and surfactant solution) "intimately" determine foam generation mechanism.
2.7 Foam Field Tests
Holm (1970) described a foam injection test. An air foam was introduced into an
injection well to study the effects of foam on air and water channelling. The test was run
on a single producing horizon exhibiting channelling at various depths.
The results showed that a 0.06 PV slug of 1.0% surfactant solution was successful in
reducing gas and water channelling from the injector to a nearby producing well. Despite
reduced fluid production over the life of the test (but not below expected production
decline) the producing water/oil ratio was reduced.
20

Holm (1970) in tests previous to the one above, showed that both a 0.02 PV slug
(followed by air) and pregenerated foam were unsuccessful in reducing air channelling,
although the water injection profiles at the sandface were improved.
Holm and Garrison (1986) described a successful field application of foam to divert
CO2 from a layer of higher permeability and low oil saturation to a layer of lower
permeability and high oil saturation. Immiscible CO2 delivery into a less permeable layer
was increased by about thirty-fold, while injection into the swept layer was reduced by
forty percent.
Keuhne et al. (1988) attempted to use foam to reduce nitrogen channelling in a
reservoir. A pregenerated foam was injected into a high brine saturation. Oil was
recovered during foam injection, but subsequent nitrogen injection still exhibited
channeling, and oil recovery fell off. Injection profiles at the sandface were altered,
although unfavorably. The primary reason given for nitrogen channelling after the foam
treatment was an over-pressuring of the formation, and flow rates that were too high.
Keuhne et al. did, however, succeed in using a foam simulator adapted from that of
Chase and Todd (1984) to model the performance of the field foam test. The simulator
analyses determined that foam effects were limited to the wellbore region. More
information on the simulator used is given in the next section.
Foam has also been used to control channelling in steamfloods. Yannimaras and
Kobbe (1988) described two field projects where foaming agents were used to try to reduce
flow through existing channels. One was profitable, the other did not perform as well.
Possible reasons for the difference were given.
21

One possible reason given was a longer shut-in time for the poor performer. This
may have allowed hot water too saturate the channels. When surfactant solution was finally
injected, it may have been diluted to the point of inefficacy. There was also some
information indicating channelling may have been more severe in the poor performer.
Patzek and Koinis (1988) described two projects where a steam-foam was injected to
improve sweep efficiency in a steam flood. Incremental recoveries of 8.5 and 14.0% OOIP
were obtained with the foams. More oil was recovered from the bottom portions of the
reservoirs. Incremental responses were felt around 2 years after the initiation of the foam
treatment.
In order to predict the efficacy of potential field foam treatments, much effort has
been made in developing a foam flow simulator. This has proved to be a difficult
undertaking due to the complexity of the foam process.
2.8 Foam Simulation
Sanchez et al. (1986) used capillarity criterion to model foam flow in a capillary tube.
The analysis was developed for steady-state foam flow. The simulator is capable of
matching qualitatively the behavior of foam.
Falls et al. (1986) used a population balance method to track the flow of foam bubbles
in porous media. The bubble density was determined to be the controlling factor in gas
mobility. They used the rheology developed by Hirasaki and Lawson (1985) to determine
gas mobility. A statistical approach was taken to quantify foam generation, propagation,
trapping, and coalescence. These factors were incorporated into flow equations using
Darcy*s Law to determine a given fluid*s response to a potential gradient. This simulator
22

was used to qualitatively match foam behavior in beadpacks having sections of different
permeability.
Marfoe et al. (1987) adapted a black-oil simulator to quantify foam behavior in porous
media. This method changes gas viscosity in the presence of foam as a function of
surfactant concentration, saturation, and gas flowing fraction. Modifications were made to
track surfactant concentrations to allow this method. This simulator was used to predict
foam behavior in linear cores.
Keuhne et al. (1988) adapted a simulator developed by Chase and Todd (1984) to foam
flow. The Chase and Toddsimulator was designed for predicting CO2 flood performance.
Keuhne et al. stated that the change in gas mobility in the presence of foam can be
accounted for by either increasing gas viscosity, or decreasing gas relative permeability.
They chose to adapt the latter. Relative permeability to gas in the absence of foam was
reduced by an exponential function to either a set fraction of the regular relative
permeability, or the absolute permeability.
Persoff et al. (1989) have isolated a single parameter that is a function of a porous
media and surfactant that may determine flow resistance of a given system. Their
correlations could be coupled with other parameters determining flow resistance as a
function of foam quality and total foam velocity.
23

Chapter 3. Experimental Apparatus and Procedure
The experimental apparatus has been used extensively in this study by the New
Mexico Petroleum Recovery Research Center to identify the pore level mechanisms
associated with oil recovery (Campbell and Orr (1983), Bahralolom et al. (1985), Bahralolom
and Orr (1986), Martin and Kovarik (1987), Martin et al. (1988), Huh et al. (1988)).
The advantage of this apparatus is that it allows the visualization of these processes
at reservoir conditions. Presently the apparatus is capable of 105**F and 2000 psia. A simple
adaptation will allow temperatures of up to 150**F.
Outlined in this section are the procedure for making glass micromodels, the design
of the high pressure apparatus, and the conditions of the experiments done to determine
foam flow mechanisms and behavior.
3.1 Glass Micromodel Preparation
This section describes the process by which an etched glass pore structure or
micromodel is made. The entire process is complicated, and takes about a week to complete.
The process requires several chemicals, an oven, a darkroom, mirrors, a hot plate, and
patience.
The first step in making micromodels is to obtain two mirrors that are a little larger
than the pore structure to be etched. This mirror should be glass with a layer of silver, then
copper, then paint, on one side. First, the paint is stripped off in a hot caustic solution.
This should expose a copper surface.
24

Next, the copper surface is coated with a photo-sensitive resist, which is allowed to
dry in a dark place. The desired pore structure is laid over the resist coated surface, and
exposed to ultra-violet light. The UV light hardens the resist that is not shaded by the
pore structure pattern.
The resist not hardened by the UV light is rinsed away with Xylene to expose the
copper surface. The mirror is then dipped in nitric acid to remove the copper and silver
in the shape of the pore structure. The rest of the mirror (except the pore structure) is then
coated with resist that is hardened by exposure to room light.
The mirror, with all surfaces except the pore structure coated by resist, is then dipped
in hydrofluoric acid. This etches the pore structure in the glass. Varying time of exposure
to the acid will vary the depth of etch. The hardened resist is next scraped away from the
glass. The glass is dipped again in nitric acid to remove the rest of the silver and copper,
leaving only an etched piece of glass.
This process is repeated for both mirror images of a given pore structure, resulting in two
etched pieces of glass. On of these is drilled with injection and production ports. The two
halves are then fused in a high-temperature oven. The result is an etched-glass pore
structure or micromodel.
3.2 Characteristics of Micromodels
The four pore structures and their corresponding pore size distributions are given in
Figures 3-1 through 3-4. These correspond to HOM, HET, MH£, and LAY as they are
referred to in this text.
25

UJ 20
Fig. 3-1
IsPore space is dark
4 6 8 10 12 14 16 18 20
PORE AREA, mm^
Above is the pore structure for HOM micromodel. Below is HOM'spore size distribution. Typical of homogeneous pore structures, it hasa narrow distribution. (After Bahralolom, 1985)
26
LU 30
Fig. 3-2
.-Js
Pore space is white, sand grain is dari<.
40 60 80 100 120
PORE AREA, mm^200
Above is the pore structure for HET micromodel. Below is HETs poresize distribution. Typical of heterogeneous pore structures, it has awide distribution. (After Bahralolom, 1985)
27

o
Lj 30
Fig. 3-3
Pore space is white, sand grain is dark
60 80 100 120
PORE AREA, mm^140 160 180 200
Above is the pore structure for MHE micromodel. Below is MHE'spore size distribution. Typical of heterogeneous pore structures, it hasa narrow distribution. Notice the wide entry channels on the left sidehave been blocked off. (After Bahralolom, 1985)
28

6^
iij
Sz>-jo>
UJ
cr
oQ.
Fig. 3-4
Pore space is dark
50
45
40
35
30
25
20
15
10
5
0
6 8 iO 12 14
PORE AREA , mm^16 18 20
Above is the pore structure for LAY micromodel. Below is LAY'S pore sizedistribution. A layered pore structure, it has a well-defined pore sizedistribution with varying aspect ratio. (After Huh et al. 1988)
29

The homogeneous pore structure HOM has a narrow pore size distribution. The flow
paths are very uniform in nature, and display a low aspect ratio. The heterogeneous pore
structures HET and MHE have nearly the same wide pore size distributions. The difference
between these is that MHE is a modified version of HET where the inlets to one major and
one minor flow paths have been sealed to force injected fluid through tighter pores. The
layered model LAY consists of three layers of differing aspect ratio. Its pore size
distribution is wide, but more uniformly distributed.
Table 3-1 is a table describing the properties of micromodels HOM, HET, MHE, and
LAY. The first column identifies the pore structure. The second and third column identify
the length and width of the pore structure.
The fourth column is the pore volume. This is determined by first weighing the pore
structure dry. Next, the micromodel is completely saturated with water and weighed again.
The volume is calculated from the density of the water.
The fifth column is the approximate cross-sectional area available to flow. This is
determined simply by dividing the pore volume by the length of the pore structure. This
number is used to calculate flow velocities and permeabilities.
3.3 High Pressure Cell
Pressures up to 2000 psia inside the micromodel are facilitated by maintaining the
pressure outside at pressures above those found inside. The high-pressure cell used was
detailed by Campbell (1983).
The cell design is shown in Figure 3-5. The cell consists of glycerine chamber in a
steel ring. Above and below the steel ring are transparent polycarbonate disks. These disks
30

TABLE 3-1. CHARACTERISTICS OF MICROMODELS
ModelLengthcm
Widthcm
PoreVolume
cc
Cross-SectionalArea (CXS)sq cm
MHE 6.8 5.0 0.23 0.0338
HOM 5.7 4.3 0.12 0.0211
HET 6.8 5.0 0.15 0.0221
LAY 6.4 4.1 0.12 0.0188
31

TOP VIEW
'|6 THREAOEO
SIDE VIEW
Fig. 3-5 Top figure is overhead view of high-pressure cell. The bottom figure is across-section of the cell. The white portion in the center is the glycerinechamber.

are held in place by two larger steel plates and twelve U inch bolts. Gaskets seal the
polycarbonate disks to the steel ring. Pressure is delivered to the cell with a manual pump.
There are three flow line taps through the steel ring; two are for injection and production
lines, and the third is for delivering pressure to the glycerine.
Figure 3-6 details the high pressure clamps used to attach flow lines to the pore
structure. These are essentially C clamps with tubing through the top clamp. Figure 3-7
shows how the micromodels and flow system sit in the glycerine chamber (top view). The
size of the pore structure is limited by the size of the chamber.
3.4 Flow System and Apparatus
The major changes in the system from that used by Bahralolom (1985) are primarily
in temperature control, and imposition of overburden pressure. Notable changes to the
arrangement of flow lines have also been made for the system studied here.
3.4.1 Tubing
Figure 3-8 is a diagram of the flow system used for these experiments. Tubing used
for most of this system is 1/16" OD 0.030" ID, 316 stainless steel. The exception is the line
from the glycerine pump to the high pressure cell which is the same composition but 1/8"
OD. Valves used are composed of 316 stainless with Teflon O-rings.
3.4.2 Pumps
The water (surfactant solution) and CO2 pumps are Instrument Specialties Company
(ISCO) 318 constant flow rate pumps. These pumps were tested to be better than 6.0%
33

0.75"
Fig. 3-6
fV
1.0"-
0.8"
0.5'
1/16" TUBING-7
CDlDTT
0. 875"
0.375"
0. 875* IMICROMODEL^ .1- Tl- I
High-pressure clamp. This is the clamp used to attach the flowlinesto the micromodels. (After Campbell, 1983).
34
CIRCULAR
STEEL RING
INLET TAPJNLETCLAMP
MICROMODEL
GLYCERINEPRESSURE TAP
OUTLET
CLAMP
GLYCERINECHAMBER
OUTLET TAP
Fig. 3-7 Top view of the micromodel as it lies horizontal in the overburden chamberof the flow visualization apparatus.
35

u>
ON
H^O
PU
MP
CO2
PU
MP
FO
AM
GE
NE
RA
TO
R
GL
YC
ER
INE
MA
NU
AL
PU
MP
CA
PIL
LA
RY
SIG
HT
GL
AS
S
MIC
RO
MO
DE
L
HIG
H
PR
ES
SU
RE
/
FR
AM
E
AIR
BA
TH
CH
AR
T
RE
CO
RD
ER
nI
joooo
ooj
1TI
MER
BY
PA
SS
LO
OP
!
CA
ME
RA
LIG
HT
SO
UR
CE
ao
D
oo
o
-IM
ON
ITO
RI I I I
VID
EO
1R
ECO
RD
ER
Io
ooo
CAM
ERA
AD
AP
TO
R
VE
NT
Fig.
3-8
Flow
visu
aliza
tion
appa
ratu
s(H
uhet
al.19
88)

accurate at the flow rates used in this experiment. The glycerine pump is a manual
piston-driven pump. A syringe pump was used for saturating the micromodel with oil, and
sometimes for waterflooding.
3.4.3 Back-pressure
Back-pressure is maintained with a 3 liter cylinder filled with N2. Over the life of
an experiment, a maximum of 1.0cc of fluid would be displaced into the Nj cylinder. This
is a 0.03% (1/3000) change in volume. The effect of this change in volume on
back-pressure is negligible.
3.4.4 Videotape System
The light source is a fluorescent lamp, with a 2-tissue paper filter used to diffuse the
light to a more even distribution. The video system and monitor are all Sony products, and
the recording system Betamax. This system provides a clear picture even at stop-frame or
slow-motion playback, which is necessary for identifying pore-level processes.
3.4.5 Pressure Monitors
Pressure drop across the porous media is monitored with a Honeywell STD 120
pressure transducer. This transducer is accurate to within 0.01% of any full scale from 5
to 100 psid, or 0.005 psid. Pressure drop was recorded as a function of time on a Houston
Instruments chart record. Validyne transducers monitor the water, CO2, and Ng pressures.
A Marsh analog pressure gauge is used to monitor glycerine cell pressure.
37

3.4.6 Temperature Control
An airbath maintained the apparatus temperature at 90® +/- O.rF with an Omega
RTD temperature controller. Circulation was maintained with a 1/10 HP Dayton blower,
and heat was supplied by light bulbs, and a blow-dryer heating element. Presently the
airbath is capable of 150®F, and adaptable to higher temperatures.
This section has described the apparatus used. The next section describes the general
procedure for a displacement experiment at high pressure.
3.5 Procedure for Displacements
This section details the procedure for a high-pressure flow visualization experiment.
This procedure has been simplified from that of previous experiments due to the realization
that the glass pore structure and micromodel clamps can support any pressure above that
inside the micromodel (and less than 2000 psia).
Before cleaning and displacement processes are begun, an overburden pressure of 100
to 150psia above the displacement pressureshould be established. The N2 cylinder should
be pressured up to the displacement pressure; the COj to 20 to 30 psia above the Nj
pressure.
The flow system is cleaned with water, tetrahydrofuran, acetone, and finally COj.
When the displacement involves oil, first brine is displaced at high flow rates into the
micromodel flow line. Brine is followed by only oil for secondary recovery displacement,
and oil then brine again for tertiary recovery.
38
For pure COj displacementsof brine or surfactant solution, the micromodel is initially
saturated with the aqueous phase only.
After the initial saturations have been established, the micromodel is shut in and the
bypass is opened. The bypass line is opened, and the fluids to be injected are introduced
to the flow system. Following a period of flow stabilization, the injected fluids are routed
through the porous media.
The displacement is filmed with the video system. This allows extensive analysis of
a given displacement without repeating the displacement itself. The conditions for
displacements in this study, characteristics of the micromodels, and pressure drop and
mobility data are presented in Chapter 4.
39

Chapter 4. Experimental Conditions and Data
Table 4~1 is a list of the 34 displacements done. In addition to the 34 films
corresponding to the visual observations, pressure drop data was taken with a chart record.
This data, along with other data concerning characteristics of the porous media and fluids
involved in the study are included in this chapter.
4.1 Displacements Performed
Table 4-1 is a comprehensive table describing each displacement. This table is
referred to often in the text. Parameters varied in this study are pore structure, injection
type, flow rate, surfactant concentrations, and initial saturations.
Flow rate was varied from 10 ft/day, to 120 ft/day. Injection type was either pure
CO2 into surfactant solution, or simultaneous injection of a 4/1 volumetric ratio of
C02/surfactant solution. The surfactant used was Alipal CD>128.
Surfactant concentration was varied from 0.0 to 5.0%. The initial saturations were
either brine, surfactant solution, oil at connate water, or oil at waterflood residual
saturation. The oil used was either a crude (Maljamar Separator oil) or refined (Soltrol R)
oil. The properties of the fluids used are indicated on Table 4-2.
Varying these parameters allows the analysis of each of their effects on the foam flow
process. The results are analyzed in Chapters 5 and 6.
40

TABLE 4-1. SUMMARY OF FLOW VISUALIZATIONEXPERIMENTS
Run #
(model-)Injection
mode
Surf.Cone.(wt%)
QC02(ft/D)
InitialSaturation
HOM-1 P 0.0 10 BrineHOM-2 P 0.1 10 SSHOM-3 P 1.0 10 SSHOM-4 P 5.0 10 SSHOM-5 P 1.0 60 SSHOM-6 P 1.0 120 SSHOM-8 S 1.0 10 M(S)SwcHOM-9 S 1.0 10 M@SorHOM-10 s 1.0 10 R@Swc
HET-1 p 0.0 10 BrineHET-2 p 0.1 10 SSHET-3 p 1.0 10 SSHET-4 p 5.0 10 SSHET-5 p 1.0 50 SSHET-7 s 1.0 10 SSHET-8 s 1.0 10 R@Swc
MHE-1 p 0.0 10 BrineMHE-2 p 1.0 10 SSMHE-3 p 5.0 10 SSMHE-5 p 1.0 60 SSMHE-7 s 1.0 10 SSMHE-8 s 1.0 10 M@SwcMHE-9 s 1.0 10 M(S)SorMHE-10 s 1.0 10 R(a>Swc
LAY-1 p 0.0 10 BrineLAY-2 p 1.0 10 SSLAY-3 p 5.0 10 SSLAY-4 p 0.1 10 SSLAY-5 p 1.0 60 SSLAY-6 p 1.0 120 SSLAY-7 s 1.0 10 SSLAY-8 s 1.0 10 M(S)SweLAY-9 s 1.0 10 M@SorLAY-10 s 1.0 10 R@Swc
P = Single phase pure COg injectionS = Simultaneous injection of
CO2 and surfactant solutionSS = Surfactant solutionM = Maljamar crude oilR = Refined oil (Soltrol)
41
P = 1320 psiaT = 90'FSurfactant: Alipal-CD128

TABLE 4-2. PROPERTIES OF THE FLUIDS
Fluid Density (gm/cc) ViscosityCO2 (1320 psia, 90^) 0.743 0.064
Maljamar crude oil 0.813 3.3
Soltrol® + red dye 0.748 1.45
Alipal CD-128 (1.0%) «1.0 «1.0
42

4.2 Permeabilities of Micromodels
In order to substantiate the applicability of Darcy's Law, a Reynold's number criteria
must be met (Fancher et al. (1933)). Reynolds number is given by the equation:
NRe= ^ (4a)
where is the Reynolds number, d is a representative diameter of the porous media,
density is the density of the fluid in question, and n is the viscosity of the fluid.
A value of for water in these displacements at 120 ft/day, a 0.1 cm diameter
flow path is 0.4233. The upper limit of Re for Darcy's Law in porous media is around 5.0
(after Fancher et al. (1933)).
Because the micromodel is essentially two-dimensional, the macroscopic
cross-sectional area is an ambiguous term. It is possible to calculate a micromodel
permeability by approximating cross-sectional area by taking the pore volume divided by
length.
Permeability k for each micromodel is given by this derivation of Darcy's Law:
k . 4.»2 t
Where k is permeability in darcies, Q is flow rate in cc*s/hr, /i is viscosity in cp, AL
is the length of the porous media incentimeters, <f> is porosity, Vp is the pore volume, and
AP is the pressure drop across the micromodel in psi.
43

To determine this measure of permeability, water was displaced through each model
at constant flow rates. Pressure drops across each micromodel were determined and
recorded. The permeabilities and the data used to obtain them are given in Table 4-3.
4.3 Pressure Drop Data
For each of the displacements done, a pressure drop record was kept (pressure drop
as a function of time). Some examples of this data are referred to in the Appendix.
44

TA
BL
E4
-3.
MIC
RO
MO
DE
LP
ER
ME
AB
IUT
YC
AL
CU
LA
HO
NS
Flo
wR
ate
dP
K
K
tak
en
PV
Len
gth
Vis
MM
cc/h
rps
idD
arc
ies
tob
ecc
cm
cp
HO
M0
.26
40
.20
01
09
.41
12
.00
0.1
25
.77
5.0
1.5
84
1.1
50
11
4.2
0.1
25
.77
5.0
3.1
68
2.3
40
11
2.2
0.1
25
.77
5.0
2.4
0.0
24
11
0.5
0.1
25
.71
.0
MH
E0
.43
20
.61
04
3.6
43
.00
0.2
36
.87
5.0
0.6
48
0.9
20
43
.40
.23
6.8
75
.0
2.5
92
3.6
00
44
.30
.23
6.8
75
.0
5.1
84
7.7
00
41
.40
.23
6.8
75
.0
HE
T0
.24
0.2
30
98
.59
0.0
00
.15
6.8
75
.0
1.4
41
.60
08
4.9
0.1
56
.87
5.0
2.8
83
.16
08
6.0
0.1
56
.87
5.0
LA
Y0
.24
0.2
00
12
5.4
12
1.0
00
.12
6.4
75
.0
1.4
41
.25
01
20
.40
.12
6.4
75
.0
2.8
82
.60
01
15
.80
.12
6.4
75
.0

Chapter 5. Mechanisms of Foam Flow in Porous Media
This chapter describes the foam generation, destruction, propagation, and fluid
diversion mechanisms (in that order) associated with flow in porous media. Heterogeneity,
oil type, surfactant concentration, oil type, initial oil saturation are all seen to have some
effect on foam flow in porous media.
5.1 Foam Generation Mechanisms
There are three basic mechanisms by which foam is generated in porous media.
These are snap-off, bubble division, and leave-behind. The relative importance of each of
these mechanisms is affected by the heterogeneity of the pore structure. These mechanisms
have been discussed previously by Roof (1970), Holm (1968), Mast (1972), Radke and
Ransohoff (1986), and Falls et al. (1986).
In the absence of surfactant, gas and liquid tend to flow in continuous channels.
When a surfactant is present, the non-wetting phase tends to become disconnected as
bubbles separate from the gas stream, and foam is generated. The last part of Section 5.1
details a chain-reaction mechanism where the generation of one lamella causes more
lamellae to be formed downstream of the first.
5.1.1 Snap-off
Snap-off takes place when the wetting phase separates the non-wetting phase in a
porous media, usually at a pore constriction. There are two manifestations of this
mechanism; upstream, and downstream snap-off.
46

5.1.1a Downstream Snap-Off
Most previous considerations of snap-off concern the invasion of the non-wetting
phase into a wetting phase saturated pore. In this thesis, this mechanism for snap-off will
be referred to as downstream snap-off. This is because the bubble is formed downstream
of a pore constriction. This mechanism has been studied previously by Roof (1970), and
Radke and Ransohoff (1986).
Consider Figure 5-1: In Figure a, CO2 flows through surfactant solution up to a
pore constriction. Figure b shows the COj flowing through the pore constriction. Figure
c showssurfactant solution flowing into the constrictions the CO2 recently penetrated, and
bubbles being formed by snap-off. Figure d shows four bubbles having resulted from this
mechanism.
This mechanism was observed primarily in heterogeneous models. The larger pore
size distribution enhances the probability that gas (non-wetting phase) will pass through a
pore constriction into a larger pore body. Roof (1970) calculated for an ideal case a pore
to pore constriction diameter ratio of 3.54/1 for downstream snap-off. This is the pore
structure criteria for static downstream snap-off.
The importance of this mechanism is demonstrated by the addition of such a pore
generation site to the entry of the preferential flow path of HET (Figure 5-2), making the
pore structure of MH£ (Figure 5-3). When experiments in these models are compared and
all other parameters kept the same, notably larger quantities of foam were generated in the
preferential flow path.
In HET, this mechanism is less important, as the CO2 could flow through the
preferential flow path to nearly the center of the model (see Figure 5-4) without passing
47

'4Mf^ ' >
1 ^ \ '
'^•j - •*
Sand grain O Surfactant solution
Fig. 5-1. Downstream snap-off mechanism.

OPEN
ENTRY
CHANNEL
iwf f s
Fig. 5-2 Inlet structure of HET. Note wide entry channel.
49

m
Fig. 5-3 Inlet pore structure of MHE. Note wide entry channel is blocked.

mm
m
mi
m
«*^«c£^V<
DOWNSTREAM SNAP-OFF
FOAM GENERATION SITES
Fig. 5-4 Pore structure of HEX indicating location of pore constrictions inpreferential flow channel. Xhese pore constrictions are required for thedownstream snap-off mechanism.
51

through a pore constriction. The result is less foam generation by the downstream snap-off
mechanism. Comparing recovery curves (Figure 5-5 and 5-6) we see that sweep efficiency
is improved with the better foaming in MHE.
In all micromodels, bubbles were generated by this mechanism near the production
end of the model, as seen by Mast (1972). At the production end of the model, the larger
flow paths dictate a sharp reduction in the capillary pressure. This lower capillary pressure
favors a higher wetting phase (surfactant solution) saturation. The surfactant solution tends
to saturate pore constrictions towards the production end of the porous media. When COj
then flows through the pore constriction, a bubble is formed. The bubble snaps-off when
surfactant again flows into the pore constriction.
Reduction in capillary pressure also occurs when gas (non-wetting phase) flows from
a lower to higher permeability zone. The accumulation of surfactant solution at this
boundary causes downstream snap-off, as seen by Mast (1972), Falls et al. (1986), and
Radke and Ransohoff (1986).
Comparison of foaming in HET and MHE graphically demonstrated the importance
of the downstream snap-off foam generation mechanism as shown in Figures 5-5 and 5-
6. Another manifestation of the snap-off mechanism is upstream snap-off, discussed in the
next section.
5.1.1b Upstream Snap-Off
The upstream snap-off mechanism takes place when the wetting phase is mobile,
and the local surfactant solution saturation is increasing. Consider Figure 5-7. Surfactant
solution imbibes along larger pore body walls or crossflows into the COj stream from
adjacent pores, by-passing COj in these pores in Figure a. Surfactant solution collects at
52

>-o
2UJ
o
u.u.
LlI
Q.UJId
CO
SWEEP EFFICIENCY FOR PURECO2 DISPLACING 5% SURFACTANT
SOLUTION
HOM
2.0
PVI CO23.0
Fig. 5-5 Sweep efficiences for COg displacing 5% Alipal CD-128 in the four porestructures.
53
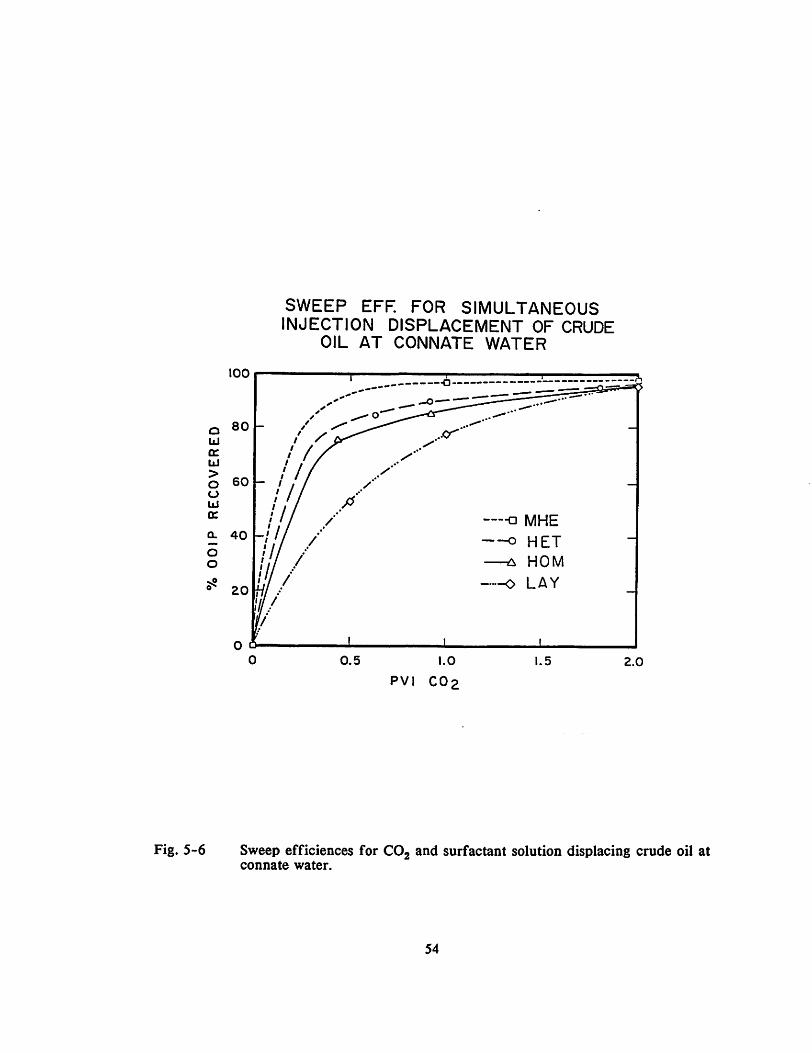
100
SWEEP EPF. POR SIMULTANEOUSINJECTION DISPLACEMENT OP CRUDE
OIL AT CONNATE WATER
-•a MHE
~o hET
^ HOM
^ LAY
Fig. 5-6 Sweep efficiences for CO2 and surfactant solution displacing crude oil atconnate water.
54

WP'
15® i»^iSand grain CZ] Surfactant Solution
Fig. 5-7 Upstream snap-off mechanism.

points beyond the bypassed CO2, and snaps-off COj bubbles, as seen in Figures b, c, and
d.
The upstream snap-off mechanism is important because based on experiments in
these pore structures, it does not depend as much on pore structure. It was seen to take
place in unconstricted channels. Apparently a high aspect ratio is not needed for this
mechanism. A similar mechanism is responsible for the trapping of gas and reduced
injectivity during WAG floods.
The importance of the upstream snap-off mechanism is demonstrated by observing
displacements where the high aspect ratio needed for the downstream snap-off mechanism
cannot be found in large numbers (i.e., more homogeneous pore size distributions).
In HET, a pore constriction suitable for downstream snap-off cannot be found in
the preferential flow path until near the middle of the micromodel. The primary
mechanism for foam generation in the first half of this model is the downstream snap-off
mechanism. Figure 5-8 shows how this mechanism takes place more than twenty times in
this portion of the model when the surfactant solution saturation increases. Bubbles in this
quantity can contribute significantly to the total pressure drop, and fluid diversion.
The virtual absence of high aspect ratio sites for downstream snap-off in the
homogeneous model HOM dictates that any bubbles generated in this pore structure must
come from other mechanisms. Upstream snap-off was seen to generate foam in HOM when
surfactant solution invades what was a continuous COj flow path.
After the COg has becomedisconnected by upstream snap-off, smaller bubbles can
be generated from these by another mechanism called bubble division.
56

O SNAP-OFF TAKING PLACE WHEN ASURFACTANT SOLUTION SLUG ENTERS
AT 0.85 CO2 PVI (UPSTREAM SNAP-OFF)
® 1:08:33
1: 10: 33
HET-8 1:08:40 (1-12) 0.85 PVI
Prlmw
Fig. 5-8 21 upstream snap-off sites in displacement HET-8. It can be seen thatsignificant foam can be generated by this mechanism.
57

5.1.2 Bubble Division
Bubble division was labelled by Radke and Ransohoff, 1986, and is simply the
splitting of a given bubble into two bubbles. It occurs when a bubble flows up to a barrier,
flattens in a direction perpendicular to flow, and is separated by the fluids that follow in
the flow path (see Figure 5-9). The flow direction the two resulting bubbles take
determines the sub-classification of this mechanism.
Bubbles undergoing division were seen to be initially elongated. This mechanism
was seen in HOM, as flowing bubbles in this pore structure tended to be more elongated
between surfactant solution lamellae.
5.1.2a Etownstream Bubble Division
Bubble (or lamella) division was described by Radke and Ransohoff, 1986. Consider
Figure 5-10. In part a, COj in one path flows toward a stagnant COj path. In part b, the
flowing path separates the stagnant path, forming a bubble. In part c, the flowing and
stagnant paths change roles and another bubble is formed. This process continues, and more
bubbles are formed in part d.
This mechanism is named so because it takes place downstream of two flowing paths.
Some downstream bubble division was seen to take place in all micromodels. It was
especially pronounced near the outlet of the pore structures, where multiple flow paths have
to converge on the production port.
58

FLOW
BUBBLE
DIVISION
BUBBL
BUBBLE
SAND:^^GRAIN
SAND^'GRAIN
Fig. 5-8 Bubble division mechanism. Liquid flows to separate a larger bubble intotwo smaller bubbles.
59

H cog
H Sand groin• Surfactant solution
Fig. 5-10 Downstream bubble division.
C
mm.
lliC02
H Sand grainI I Surfactant solution
Fig. 5-11 Upstream bubble division.
60

5.1.2b Upstream Bubble Division
Upstream bubble division takes place where a single path of bubbles divides into
two or more paths. Since this takes place upstream of the multiple paths, it is called
upstream bubble division.
Consider Figure 5-11. In part a, an elongatedCO2 bubble flows partially into each
of two flow paths. In part b, the film following this bubble separates the bubble into two
smaller bubbles. This process is repeated in parts c and d, as more smaller bubbles are
formed.
Bubbles division is responsible for the generation of smaller bubbles that can take
part in flow and blockage. Another mechanism, leave-behind, does not take part in flow,
but can influence blockage and fluid diversion.
5.1.3 Lamella Leave-Behind
A manifestation of the lamella-division described by Radke and Ransohoff, 1986,
this mechanism was seen to take place in all micromodels. Consider Figure 5-12. In Figure
5-12a, CO2 has swept a path belowpore grains a, b, and c. In Figure 5-12b, CO2 has swept
out another path above pore grains a, b, and c. Lamellae have been left behind across these
pore grains. This is how the leave-behind mechanism gets its name.
This mechanism was also seen by Owete and Brigham (1987). These authors
concluded that since these lamella did not take part in the flow process, they do not
contribute significantly to the total pressure drop.
61

Pore Grains
co.^0
C02 Flow
Surfactant Solution
Pore Grains.
C02 Flow
C02 Row
Surfactant Solution i
Fig. 5-12 Leave-behind mechanism of foam generation; lamellae between pore grainsa, b, and c are formed as two COj paths advance in adjacent paths.
62

5.1.4 Chain-Reaction Mechanism
It was seen in the micromodels that after CO2 has established a continuous phase
path, lamella are occasionally seen to form and be displaced through this path. Surfactant
solution enters a pore constriction along the path, and a film is formed and displaced.
Consider Figure 5-13. Surfactant solution flows into a continuous CO2 flow path
in part a. Part b shows a lamella snapping-off into the COj flow path, and the subsequent
flow of surfactant solution in towards the flow path downstream. Part c shows the resulting
lamella formation downstream of the first lamella. The generation of many lamella due to
the formation of one lamella is the chain-reaction mechanism of foam generation.
The formation of the first lamella increases the local pressure drop. The local
surfactant solution saturation responds to the higher pressure gradient. This causes the local
surfactant solution to flow. Surfactant solution flows into the CO2 flow path, downstream
of the first snap-off point, where it bridges at some points across the CO2 flow path. These
"bridges" become lamella as the COj flows.
This mechanism is primarily responsible for the changes in pressure drop and flow
paths during the pure CO2 displacements after breakthrough. This is because mixing
between the surfactant solution and COj can only occur upon some disturbance of the
system. In this case the disturbance is due to the formation of a single lamella.
This completes the description of the mechanisms governing foam generation in
porous media. It is of use to next describe the phenomena associated with the destruction
of these bubbles.
63

On
4^
SU
RF
AC
TA
NO
L
VjS
NA
P-O
FFOC
CURS
DO
WN
ST
RE
AM
SN
AP
-OF
FS
UR
FA
CT
AN
TS
OL
UT
ION
FLO
WS
INTO
CO
2PA
TH
SU
RF
AC
TA
NT
SO
LU
TIO
N
FIR
STSN
AP-
OFF
OC
CU
RS
UPS
TREA
M
Fig.
5-13
The
chai
n-re
actio
nm
echa
nism
offo
amge
nera
tion.

5.2 Foam Collapse Mechanisms
In section 5.1 we discussed how foam bubbles and the films that separate them are
generated. These films can become unstable and rupture. The number of flowing films in
a porous media help to determine the pressure drop across it. It would therefore be useful
to identify the mechanisms that can destroy films. Two major mechanisms were seen to
destroy films in these experiments. The most important is that oil destabilizes the films.
The second is that when films exit a pore throat into a pore constriction, they can become
too thin and rupture.
One factor film stability in any porous media is surfactant concentration. A film
of a given thickness was seen to be more stable when the aqueous phase has a higher
surfactant concentration. A film is less likely to coalesce due to the following mechanisms
at higher surfactant concentrations.
5.2.1 Destabilization by Oil
When bubbles flow into an oil phase, they can rupture. When a thin film enters an
oil saturation, the oil spreads on the film. The surfactants in the film partition into the oil
phase, and the film ruptures. There appear to be four conditions that contribute to lamella
destabilization by oil:
1. The local oil phase is substantial
2. The film is relatively thin (measurment of
film thickness not available)
3. The oil spreads on the surfactant solution film
65

4. The surfactant partitions into the oil phase
(this reduces the surfactant concentration in
surfactant solution, which has been shown to
reduce foam stability (Mast, 1972))
The crude oil destabilized bubbles to a greater degree than the refined oil. This
may be due to a wettability difference between the two systems. It may also be due to a
higher spreading or partitioning coefficient of the crude oil system. However, spreading
coefficient could not be obtained to any reasonable degree of accuracy.
The crude oil system was partially oil wet, whereas the refined oil system was
strongly water wet. Partial oil wettability means that oil tends to collect at pore
constrictions and along pore walls. It is logical that as more oil coats the pore walls, more
films will be ruptured. In addition, no foam was seen to be generated at sites having
significant oil saturation.
Pore structure indirectly affected the way oil destabilized bubbles. Films in HOM
were generally thicker than in the heterogeneous models because they were generated
primarily by the upstream snap-off mechanism due to HOM*s low aspect ratio. Since the
films separating the bubbles in the homogeneous model HOM were thicker, few of these
were ruptured by the oil phase.
Oil destabilization was therefore more important in the heterogeneous models. The
films in the heterogeneous models are thinner and more susceptible to rupture upon contact
with the oil phase. It was observed that whenever thin-filmed foam flowed into a
substantial crude oil phase, foam coalesced.
66

Another factor in film rupture and foam coalescence is lamella thinning and
rupture. This effect is also pore-structure dependent.
5.2.2 Lamella Thinning and Rupture
When a film exited a pore constriction into a wider pore throat, it would stretch
thin and sometimes rupture. In order for this to take place the film must be relatively thin
to begin with, and pass into a pore body sufficiently wide enough.
This mechanism was also affected by heterogeneity. The films separating bubbles
in HOM were thick due to the nature of their formation, as there are also no wide pores in
HOM for these films to pass into. Consequently, this coalescence mechanism had little to
do with foam flow in homogeneous media.
A heterogeneous pore structure produces many more thin films flowing into larger
pore bodies. This results in more rupture films in the heterogeneous pore structures.
In conclusion, films were more likely to coalesce in the heterogeneous models. Film
thickness is an important factor in both the oil destabilization and film thinning and
rupture mechanisms. Consequently, the thick films in the homogeneous pore network were
much less susceptible to coalescence. The thinner films seen in the heterogeneous models,
coupled with flow from pore constrictions into larger pore bodies made films more likely
to coalesce in the heterogeneous pore structures.
67

5.3 Foam Propagation Mechanisms
Sections 5.1 and 5.2 discussed the pore level processes by which bubbles are formed
and destroyed. This section covers the processes by which bubbles flow in porous media,
and how these processes are affected by pore structure, and surfactant concentration.
5.3.1 The Effect of Foam Stability on Propagation Mechanism
An early observation of foam flow in porous media by Holm (1968). Films were
seen to form at the exit outlet of a constriction, and coalesce at the entry to a pore
constriction. Later, Falls et al. (1986) saw that bubbles flowed by translation. Their study
determined that the break-and-reform process was secondary to bubbles deforming to
whatever shape necessary to flow through the porous media with few films bursting
(propagation by translation).
Consider one of the Falls et al. criterion for liquid flow into a pore constriction.
A new lamella or film cannot be formed if an already formed film enters the pore
constriction. If no films are broken, a steady stream of films into and out of a pore
constriction precludes further foam generation. This means that above some number of
stable lamella in a flow path, no more lamella can be formed.
When foam is generated but the films are not stable, foam propagates by the
break-and reform process. When foam is generated and films do not tend to coalesce, foam
propagates more by translation. (As foam is thermodynamically unstable, it will tend to
collapse at some rate; no film is completely stable).
Any factor improving foam stability (i.e., highest surfactant concentration, lower
oil saturation) made the propagation mechanism tend toward translation and away from the
68

break-and-reform process. Heterogeneous pore structures (where lamellae stretch and thin
to bridge wide pores) were also detrimental to film stability.
5.3.2 Single Bubble Flow Paths
It was seen in all pore structures that in a given pore cross-section, a single bubble
would flow at a given instant (at lower flow rates). These low flow rates (10 ft/day) are
the most representative of near wellbore reservoir conditions.
In the heterogeneous pore structure, the wider pores could be seen to have many
bubbles across a given flow path cross-section. At a given instant usually all but one
bubble are stationary (as seen in Figure 5-14). A path of bubbles one bubble wide and
many bubbles long would be the only bubbles flowing. (This could be important to
modelling foam flow in a channel in that the effective diameter of the channel would be
equal to the average flowing bubble diameter in that channel).
In the homogeneous model, most bubbles were elongated in the direction of flow.
Here it was impossible for more than one bubble to flow in a given cross-section. The
condition where a single bubble flows in a given cross-section (at low flow rates) is
therefore not pore structure dependent.
A final consideration for foam flow is the blockage and fluid diversion that take
place when foam has been introduce to the porous media. This is considered in the next
chapter.
69

FLOWING
BUBBLES
£2o
%
%
SINGLE BUBBLE • FLOW PATH
FLOWINGFOAM
Fig. 5-14 Single bubble flow paths. When foam flowed, it tended to flow as onebubble in a cross section perpendicular to the flow direction.
70