
FleetMgtSystem.pdf
86
Automatic Fleet Management System A Thesis submitted in partial fulfillment of the requirements for the degree of Master of Engineering in Software Engineering, by Sanat Ghoshal Examination Roll: M4SWE10-21 Class Roll: 000811002025 of 2008-09 University Registration No. 104340 of 2008-09 Department of Information Technology Jadavpur University Under the supervision of Prof. (Dr.) Samiran Chattopadhyay Department of Information Technology Jadavpur University,Kolkata
-
Upload
masinde-andrew -
Category
Documents
-
view
213 -
download
0
Transcript of FleetMgtSystem.pdf

8/9/2019 FleetMgtSystem.pdf
http://slidepdf.com/reader/full/fleetmgtsystempdf 1/86
Automatic Fleet Management System
A Thesis submitted in partial fulfillment of the requirements for the degreeof
Master of Engineering in Software Engineering,by
Sanat GhoshalExamination Roll: M4SWE10-21
Class Roll: 000811002025 of 2008-09University Registration No. 104340 of 2008-09
Department of Information Technology
Jadavpur University
Under the supervision of
Prof. (Dr.) Samiran ChattopadhyayDepartment of Information Technology
Jadavpur University,Kolkata
8/9/2019 FleetMgtSystem.pdf
http://slidepdf.com/reader/full/fleetmgtsystempdf 2/86
II

8/9/2019 FleetMgtSystem.pdf
http://slidepdf.com/reader/full/fleetmgtsystempdf 3/86
III
JADAVPUR UNIVERSITYFACULTY OF ENGINEERING AND TECHNOLOGY
CERTIFICATE OF APPROVAL(Only in case the thesis is approved)
The thesis at instance is hereby approved as a creditable study of anEngineering subject carried out and presented in a manner satisfactory towarrant its acceptance as a prerequisite to the degree for which it has beensubmitted. It is understood that by this approval the undersigned do notnecessarily endorse approve any statement made, opinion expressed orconclusion drawn therein, but approve this thesis for the purpose for which itis submitted.
Examiners:
(Signature of the examiner) ( Signature of the supervisor )

8/9/2019 FleetMgtSystem.pdf
http://slidepdf.com/reader/full/fleetmgtsystempdf 4/86
IV
Acknowledgements
The writing of this thesis as well as the related work has been a long journeywith input from many individuals, right from the first day till the finishing of thethesis. With my most sincere respect and gratitude, I would like to thank Prof.Samiran Chattopadhyay, my supervisor, for his constant support throughoutthe duration of this project. His motivation always gave me the required inputsand momentum to continue with my work, without which the project workwould not have taken its current shape. His valuable suggestions andnumerous discussions have always inspired new ways of thinking and givingme a new dimension. As a person too, I will never forget his immense supportin times of my personal crisis, without which I would most definitely havefailed to complete this thesis. I feel deeply honoured that I got this opportunityto work with him.I am grateful to Prof. Sandip Das, Indian Statistical Institute, Kolkata for hisoverwhelming encouragement and support. I would also like to thank allfaculties and departmental members and my batch-mates of InformationTechnology department and who helped me directly or indirectly in thismilestone achievement.Last, but not the least, I would like to thank my mother, wife, daughter andbrothers, for their unconditional love, encouragement and patience that keepme motivated and helped to succeed.
Sanat GhoshalExamination Roll: M4SWE10-21
Class Roll: 000811002025 of 2008-09University Registration No. 104340 of 2008-09
Department of Information Technology

8/9/2019 FleetMgtSystem.pdf
http://slidepdf.com/reader/full/fleetmgtsystempdf 5/86
V
Abstract
This thesis work is mainly concerned with the Automatic Fleet ManagementSystem. Rapid development of modern vehicle systems brings tremendouschallenges to the intelligent fleet management system. Automatic Fleetmanagement System (AFMS) is such an intelligent model that manages acompany's vehicle fleet mainly concern with the vehicles telematic services.Telematic services are related to the functionality of vehicles internalelectronics, wireless communications, and information technologies. Trackingand monitoring the entire fleet‘s movements is controlled by the GPS system. GPS is a satellite-based navigation system that works by receiving raw datafrom satellites and then calculating physical locations of the vehicles. It is the
most effective solution in terms of cost and real time basis data collection forAFMS. This system allows viewing the present and the past positionsrecorded for a vehicle or a group of vehicles on Goggle Map or by other mapproviders through the internet. Some live tracking systems that are availablenowadays used SMS for their communications to the server which turned outto be expensive as SMS are used for communication to devices only. AFMSmodel has been used the Global System for Mobile Communications (GSM),General Packet Radio Service (GPRS) for mobile communication whichmade the system a low cost tracking solution for locating an object’s positionand status. This system is very much useful for controlling fleets security
(alarm alert, engine starting, localizing), reckless driving, rescue operationand optimize the use of fleets with related resources. So AFMS is anintegrating system which glues different technologies: GPS used for locatingthe physical position, speed and status of the vehicles, GSM/GPRS mobilecommunication used for tracking the vehicles and to send SMS, Applicationserver receives the data sent by the GSM/GPRS system and store it to thedatabase system and the web based user interface (with Internet with GoggleMap) used to watch and control the overall system. I have designed,developed, and tested a rudimentary AFMS system and the details areincluded in this thesis.
Key Terms: GPS, GPRS, GSM, NMEA, IMEI, Goggle Map, Application server,Database server, VTU, Latitude, Longitude, Reverse Geocode

8/9/2019 FleetMgtSystem.pdf
http://slidepdf.com/reader/full/fleetmgtsystempdf 6/86
VI
Table of Contents
Acknowledgements IV
Abstract V
Table of contents VIList of figures VIII
List of tables IX
Chapter 1 Introduction 2
1.1 Background 2
1.2 Thesis Objective 3
1.3 Overall functional activities of this system 4
1.4 Thesis contribution 6
1.5 Thesis Structure 6Chapter 2 Literature Survey 7
2.1 Introduction 7
2.2 Survey of Research work in this field 7
2.2.1 Traffic surveillance technologies 7
2.2.2 Road Transportation Management usingGIS - vehicle routing and tracking 7
2.2.3 Designing Automated Vehicle LocationSystems for Archived Data Analysis 7
2.2.4 Cost Effective GPS-GPRS Based ObjectTracking System 8
2.2.5 Enhanced Mobile Asset Tracking withTelemetry Function 8
2.3 Case study 8
2.3.1 Delhi Transport Corporation (DTC) 8
2.3.2 Cost Effective GPS-GPRS Based Object Tracking System 9
2.4 Summary of Literature survey 10
Chapter 3 Systems Model and Technology3.1 Overview 11
3.2 Communication System 12
3.3 Fleet Management Systems 12
3.4 Technology Overview 13
Chapter 4 System Design, Architecture
4.1 User Interface 15
4.1.1 N-tier Architecture 15
4.1.2 MVC Architecture 15
4.2 Activity Diagram 164.3 E-R Diagram of the system 28
4.4 Database Schema 29

8/9/2019 FleetMgtSystem.pdf
http://slidepdf.com/reader/full/fleetmgtsystempdf 7/86
VII
4.5 Use Case Diagram of the system 39
4.6 Algorithm embedded in this model 43
Chapter 5 Implementation Details
5.1 Introduction 46
5.2 Software Components 475..3 Hardware components 48
5.4 Protocol used for communication 48
5.4.1 GPS Protocol 48
5.4.2 HTTP Protocol 48
5.5 Detail description of the Implementation 48
5.6 Evaluating the performance benefits of the Automatic FleetManagement System 53
Chapter 6 System Simulation
6.1 Overview 56
6.2 Flow Diagram 57
6.3 Some execution snapshots of this system 58
Chapter 7
Conclusions 67
APPENDIX A 68
APPENDIX B 71
APPENDIX C 73
REFERNCES 78

8/9/2019 FleetMgtSystem.pdf
http://slidepdf.com/reader/full/fleetmgtsystempdf 8/86
VIII
List of Figures
Figure contents Page #
MVC Architecture 16
Activity diagram shows how to interpret GPS received data (Fig-07) 17
Activity diagrams show how to create and view device groups(Fig-08) 18
Activity diagram for mapping real time and historical device(s) (Fig-09) 19 Activity diagrams show about the login and logout from the AFMSsystem(Fig-10) 20
Activity diagrams show how to create and view an administratoraccount in the AFMS system(Fig-11) 21
Activity diagrams show how to modify and deactivate an account(Fig-12) 22
Activity diagrams show how to create and view a device by anadministrator (Fig-13) 23
Activity diagrams show how to create and view Geofences (Fig-14) 24
Activity diagrams show how an administrator can edit and deleteGeofences (Fig-15) 25
Activity diagram shows how to create a way point(Fig-16) 26
Activity diagram shows how to generate reports by a user(Fig-17) 27
ER diagram of the AFMS system (Fig-18) 28Use case diagram users access control logic (Fig-19) 40
Use case diagram administrator’s behavior (Fig-20) 41
Use case diagram communication server (Fig-21) 42
Route layout graph (Fig-21(a)) 43
Implementation diagram of AFMS (Fig-22) 46
Flow diagram of the overall system (Fig-23) 49
Application server functional flow diagram (Fig-24) 50
Movement of a vehicle with different seed (Fig-25) 52
Performance graph of vehicles (Fig-26) 53System simulation overview (Fig-27) 56
Simulation flow diagram (Fig-28) 57
Login screen of the system Fig-29 59
Main menu screen (Fig-30) 60
Vehicle Map screen (Fig-31) 61
Group Vehicle Map screen (Fig-32) 62
Summary report screen (Fig-33) 63
Account Admin screen (Fig-34) 64
View/Edit User Information screen (Fig-35) 65Geozone area on map (Fig-36) 66
GPS satellite (picture collected fromhttp://www.ehow.com/facts_5005974_what-waypoint-gps.html ) Fig-37 69

8/9/2019 FleetMgtSystem.pdf
http://slidepdf.com/reader/full/fleetmgtsystempdf 9/86
IX
List of Tables
Table contents Page #
Geocode Table 51
Comparative study between GPRS Based System and SMS Based System 71
8/9/2019 FleetMgtSystem.pdf
http://slidepdf.com/reader/full/fleetmgtsystempdf 10/86
2
Chapter 1
Introduction
1.1 Background
The increased availability of data on fleet makes the management organization asignificant pressure mainly on the fleet managers and stuff to maintain and produce awide array of management information for employees, fleet users, finance and auditdepartments, management decision makers and general public that leads to growtelematic service oriented fleet management system. The security and optimize use ofthe vehicles is a major challenge for fleet managers and these requirements are to besufficiently informed in a timely manner. So the management and administrator foradministration activities of almost every fleet operation have felt the impact oftechnology. Some of the best fleet managers in the industry have addressed thisrequirement by implementing software solution that pushes information tostakeholders on a regular schedule. “Push” technology is a set of technologies usedto send information to a client without the client requesting it. With the advent of
Automatic Fleet Management System, vehicle owners get better opportunities tocontrol over the vehicles deployment and usage. A great amount of accountability isintroduced here. Such a system that can track the whereabouts of the vehicles andkeep their traveling history would provide the fleet owners an efficient and convenientsystem and can make good coordination with their staffs. So better productivity fromboth fleet owners and staffs can be expected here. This system also helps thetransporters and traders to make their payment on consignment of their goodsbecause the system can provide real time status after each interval. Actually, this is aweb-based system that allows clients to track the progress of their consignment intransit. So such a reliable, real-time, automated system can make improvement onthe relationship of the fleet owners with their customers and this would meanopportunities for the business to grow. Therefore, it the most convenient and efficientplatform to provide services to the customers and to control over fleet owners.
Automatic Vehicle Location systems have been used by bus transit agencies in the UnitedStates since 1969. Now it is an emerging technology and has been used in many countrieslike U.K , Australia, Saudi Arabia, Japan, German, Russia, France and many othercountries.
In India Fleet Management System has also been used in different regions and as aready reference a list is given below:
Delhi Transport Corporation, Delhi Northern Coalfields Ltd Andhra Pradesh Road Transport Corporation, AP Accord Software & Systems Private Limited, Bangalore, India
The state-of-art of this technology is nested within the broader field of Intelligent
Transportation Systems (ITS) and nowadays although developed in some areas it can beclassified as ‘emerging technology’. Various technologies have been applied over the

8/9/2019 FleetMgtSystem.pdf
http://slidepdf.com/reader/full/fleetmgtsystempdf 11/86
3
years however the reducing costs and increased precision afforded by GPS receivers now
make this technology a better choice. AFMS is achieved by integrating a GPS receiverwith the onboard radio unit. The AFMS can be configured to report vehicle location(latitude and longitude) at pre-determined intervals (e.g., 5 min), when a voice or adata message is sent from the vehicle. The vehicle location data are sent wirelesslyover the radio network and can be overlaid on a GIS map on the dispatcher'scomputer. The AFMS information also provides operation supervisors a tool to
monitor on-time performance, which is randomly conducted by a supervisor waiting ata scheduled stop. The AFMS, with recorded pick-up and drop-off times, providescomplete records for assessing on-time performance.
1.2 Thesis Objective
The Objective of Automatic Fleet Management System is to reduce risk, improvesafety and security, and optimize fleet operations with real-time basis. The aim ofAutomatic Fleet Management system is to automate the planning and usage of thefleet in the most efficient way to allow the optimum usage of the vehicles in order toprovide even better service to people and guide alternative possible ways to reach adestination.The advantage of GPS is that it is free to use as stated in the Presidential DecisionDocument (29 March 1996) and by Congress in the 1998 Public Law (105-85). Bothstate that U.S. will continue to provide the GPS Standard Positioning Service forpeaceful civil, commercial and scientific use on a continuous, worldwide basis, free ofcost direct user fees. Another advantage of GPS system is that the smallportable GPS receivers have become very affordable and can be fitted on to mobileassets easily and Lower costs have led to use of GPS in a wide variety of applications.Most of the software components used in this system are free (free source code) touse. So the objective is my thesis is to take the advantages of GPS with GPRS/GSMtechnology to find the location of a fleet and to provide a new dimension for the webbased applications with low cost opportunity that can process it and make it to anactionable form.
The objectives of the Automatic Fleet Management System are as follows:
• Integration of GPS with GIS map of a particular region for tracking of vehicleson a real time basis with two way messaging including distress messaging
between the vehicle and the control station• To monitor whether the buses are adhering to its scheduled route and timetable through out the route and identify if there are any deviations.
• To monitor whether the buses are giving halt at all without the scheduled busstops, this is resulting in loss of revenue.
• Automatic generation, collection, storage and retrieval and analysis of data &information helps to eliminate the human related errors involved in collecting ofsuch data.
• Development of custom on-line queries• Integration with the database pertaining to employees, buses, bus stages, fare
stages, depots, school bus routes etc.

8/9/2019 FleetMgtSystem.pdf
http://slidepdf.com/reader/full/fleetmgtsystempdf 12/86
4
• It can be used as a decision support system for implementation of thisTransportation Model
• Generation of exception reports like deviation from schedule route, timing,Missing Bus stops, Punctuality factor etc. based on captured vehicle data.
1.3 Overall functional activities of this system
AFMS is an online fleet managementsystem which provides a robust vehicleinterface that connects directly to thevehicle electronics, enabling it to accessonline a wide range of vehicle operatingdata such as odometer readings, fuel levels,
oil pressure, airbag deployment, diagnostictrouble codes, and vehicle operationdevices like specialized equipment
Vehicle Tracking Unit(VTU) on each vehicle Fig-01
Switches along with the vehicle location. The vehicle's data is then sent wirelesslyusing mobile communication through the SIM of the Vehicle Tracking Unit (VTU) tothe client's server which is an application server (actually a communication server).The function of the communication server is to receive the data generated as anevent object after each interval and send it to the database server where the data isstored and used to provide critical information including: time and attendance reportsfor drivers , mileage reports, real-time vehicle location, crash notification, remotediagnostics and warnings for abnormal vehicle conditions. The following benefits canbe provided by this AFMS model:
• Increased overall dispatching and operating efficiency• More reliable service, promoting increased riders desire• Quicker response to service disruptions• Inputs to passenger information systems• Increased driver and passenger safety and security• Quicker notice of mechanical problems with the vehicles, reducing maintenance
costs• Efficient, optimized, flexible, and user-preferred route structures• Dispatching of emergency vehicles to Breakdown vehicles or vehicles in
distress, whenever it is sought• To provide better path to reach the destination when a vehicle is in problem
with minimum hop

8/9/2019 FleetMgtSystem.pdf
http://slidepdf.com/reader/full/fleetmgtsystempdf 13/86
5
A simple flow diagram how AFMS works
GPS
MicrowaveSignal
In-Vehicle Equipment
In-vehicle equipment
Box diagram representation of the system (fig-02)
GPS Satellites emit microwave signals which enable GPS receivers to calculateposition ( Latitude / Longitude position) , time, direction, Speed and Status ( Stop /Running / Toeing position ) of the vehicles from their VTU ( Vehicle Tracking Unit )and sends it to the Communication Server through GSM / GPRS technology . Insidethe VTU there is a SIM which helps to communicate with the Application Server whichin turn sends the information to the Database Server. User Application Program it is aweb based application program through which user can interface with the Database
server using Internet are used for controlling and taking decision of the vehicles .
GSMModem
Database
ServerUser
Interface
Application
Server
GPS GSM
GPS GSM
Satellite
Internet
8/9/2019 FleetMgtSystem.pdf
http://slidepdf.com/reader/full/fleetmgtsystempdf 14/86
6
1.4 Thesis Contribution
In this dissertation following things have been put together
a) Reviewed different technologies and model and the practical constraints
b) Rescue passengers from a vehicle to reach the destination with minimum cost :
Main concern of this thesis work is to rescue passengers from a vehicle to reachtheir destination with minimum cost. When a vehicle is not functioning i.e. out ofservice due to any reason, Automatic Fleet Management System can provide aconvenient way to guide the passengers to reach their proper destination. AsAFMS can track all the vehicles movement and their routes so it can providealternative vehicle routes through this point with minimum hop that is to reach thedestination with minimum vehicle changes. To provide this facility an algorithm has
been developed and defined in the design part of this thesis.
1.5 Thesis Structure
Chapter 1 states thesis background, objectives, overall functional activities, andcontribution in thesis.
Chapter 2 mentioned the relevant literature that have been followed for problem ofinterest and help to find out solution to the problem
Chapter 3 focuses on the Models and Technologies used in Automatic Fleetmanagement System. That is, why this model and technology is better to use withrespect to reliability, efficiency and reduce cost effectively.
The main concern of Chapter 4 is the System Design and Implementation. Explain indetail different architectural design concepts used in this system and the algorithmdeveloped as a thesis work in this system.
Chapter 5 mentioned the detail Implementation steps. This chapter specifies the mainhardware and software requirement details.
Chapter 6 focuses on the system simulation related to the thesis work. This chapterdepicts step-by-step expiation of the execution of this system.
Conclusion of this thesis work is defined in Chapter 7
Three appendixes and reference of URLs included in this paper for relatedinformation of this thesis work.

8/9/2019 FleetMgtSystem.pdf
http://slidepdf.com/reader/full/fleetmgtsystempdf 15/86
7
Chapter 2
Literature Survey
2.1 Introduction
A review of existing literature was performed to support the study undertaken in thisthesis. A general survey was first made stating from the past research efforts indeveloping traffic surveillance technologies used for vehicle tracking systems totelematic function based automatic object tracking system.
2.2 Survey of Research Work in this field
Researchers have tested a wide array of technologies in an attempt to find improvedmethods of monitoring and controlling vehicles fleet. A brief survey of technologiesexplored during the past decade mention below.
2.2.1 Traffic surveillance technologies.
The amount of attention given to the research field of traffic surveillance report duringthe year of 1967 to 1975 suggests that a surveillance system which can providereliable and accurate travel time 10 data would have great potential. The researchcommunity’s interest in developing reliable and accurate surveillance systems is aprimary motivation for the evaluation of any system.
2.2.2 Road Transportation Management using GIS - vehiclerouting and tracking
A geographic information system (GIS) integrates hardware, software, and data forcapturing, managing, analyzing, and displaying GUI based all forms of geographicallyreferenced information. Using GIS in the field of transportation opens up a new widerange of possible applications, as diverse as the field of transportation itself. Whetherthese are cars and trucks along a road, trains along a track, ships across the sea or
airplanes in the sky, all applications have one thing in common: These are objectsthat move along a path in space. A GIS can provide valuable tools for managingthese objects in a spatially referenced context, viewing the paths as a transportationnetwork. This system attempts to render the extent of existing GIS applications withinroad transportation, and critically assess their appropriateness and potential.
2.2.3 DESIGNING AUTOMATED VEHICLE LOCATION SYSTEMSFOR ARCHIVED DATA ANALYSIS
Automatic vehicle location (AVL) and other automated data collection systemstogether can provide a rich and extensive database that can be analyzed to improvetransit management and performance. In the past, many such systems have failed to

8/9/2019 FleetMgtSystem.pdf
http://slidepdf.com/reader/full/fleetmgtsystempdf 16/86
8
provide a good data archive, while others have had success. Through the use of anextensive survey and in-depth case studies of nine transit agencies, the key factor insystem design that help to determine whether a data collection system will provide theuseful data archive that many agencies desire are examined. In issues related todesign of the data collection system itself, the focus is on five different levels of spatialdetail. Again the issues related to database design are organizational issues.
2.2.4 Cost Effective GPS-GPRS Based Object Tracking System
The main concern of this system implementation is low cost object tracking systemusing GPS and GPRS. The system allows a user to view the present and the pastpositions recorded of a target object on Goggle Map through the internet. The systemreads the current position of the object using GPS, the data is sent via GPRS servicefrom the GSM network towards a web server using HTTP protocol. The object’sposition data is then stored in the database for live and past tracking. A webapplication is developed along with a database server and Goggle Map is embeddedwith it.
2.2.5 Enhanced Mobile Asset Tracking with Telematic Function
Enhanced Mobile Asset Tracking with telematic function is the newest and one of themost advanced systems in Asset Tracking Technology. It uses the GPS systemtogether with the GSM (GPRS/ICS - Internet Communications Services) infrastructureto bring back information to central control. It is an efficient and reliable system andcan be thought of as an emerging technology for real time tracking system.
2.3 Case Study
2.3.1 Case Study: Delhi Transport Corporation (DTC)
As a case study in India, Delhi Transport Corporation is the one of the largest City RoadTransport system. DTC has a fleet of around 15,000 vehicles on 800 routes from 33 depotsall over the state of Delhi. CMC has Designed, Developed and Implemented the AutomaticFleet Management System that include many features like Vehicle Tracking System,Application software for billing, Operational Transportation Model for scheduling of buses andintegration of Smart Card Reader with the Vehicle Tracking System, provision for Real Time
Passenger Information System to Delhi Transport Corporation. The AFMS system in Delhi iscurrently operational from two depots for 200 buses since last two years.
Objectives
The objectives of the Automatic Fleet Management System as provided by DTC are asfollows:
• Integration of GPS with GIS map of Delhi for tracking of vehicles on a real timebasis with both messaging including distress messaging between the vehicle
and the control station• To monitor whether the buses are running according to its scheduled route.

8/9/2019 FleetMgtSystem.pdf
http://slidepdf.com/reader/full/fleetmgtsystempdf 17/86
9
• To monitor whether the buses are giving halt at all the scheduled bus stops thatis resulting in loss of revenue.
• Automatic generation, collection, storage and retrieval and analysis of datathat eliminate the human related errors involved in collecting of such data.
• Development of on-line queries for DTC related to GIS• Integration with the database of DTC pertaining to employees, buses, bus
stages, fare stages, depots, school bus routes & stages• Used as a decision support system for implementation of Transport Model by
DTC• Generation of exception reports like deviation from schedule route, timing,
Missing Bus stops, Punctuality factor etc. based on captured vehicle data.• Provide billing facility to generate automatically billing details for the buses.• Dispatching of emergency vehicles to Breakdown vehicles or vehicles in
distress, whenever it is sought.• Provision of Smart Card Readers being supplied by Delhi Metro Rail
Corporation.•
Help in working out realistic schedules according to traffic conditions based onspeed of bus during different time of the day and at different routes• Provision to provide Real Time Passenger Information System – both within the
bus as well at major Terminuses.
2.3.2 Case Study: Cost Effective GPS-GPRS Based Object TrackingSystem
This paper proposes and implements a low cost object tracking system using GPS
and GPRS. The system allows users to view the present and the past positionsrecorded of a target object on Goggle Map through the internet. The system reads thecurrent physical position of the object using GPS, the data is sent via GPRS servicefrom the GSM network towards a web server using the POST method of the HTTPprotocol. The object’s position data is then stored in the database for live and pasttracking. A web application is developed using PHP, JavaScript, Ajax and MySQLwith the Goggle Map as a map provider. The existing live tracking systems that areavailable now a days use SMS for the communication to the server which turned outto be expensive. (SMS are used for communication to device). We have used theGPRS service which made our system a low cost tracking solution for localizing an
object position and status. This system is very useful for car theft situations (alarmalert, engine starting, localizing), for adolescent drivers being watched and monitoredby parents (speed limit exceeding, leaving a specific area), as well as this can beused for human and pet tracking.
Objectives
Objective of this paper is to present a low cost tracking system using GPS and GPRSof GSM network, suitable for wide range of applications all over the world. Thecombination of the GPS and GPRS provides continuous and real time tracking. Thecost is much lower compared to SMS based tracking systems. Free Google map andthe use of HTTP protocol as data sending method reduces the monthly bundle cost

8/9/2019 FleetMgtSystem.pdf
http://slidepdf.com/reader/full/fleetmgtsystempdf 18/86
10
for the individual user, group users, and also for the small business owners. It isexpected that the full implementation of the proposed system would ultimatelysubstitute the traditional and costly SMS based tracking systems.
2.4 Summary of Literature survey
Enhanced Mobile Asset Tracking with Telemetry Function is the best solution what I
find so far from the literature survey. Accordingly I adopt such a robust system in mythesis work with the associated technologies and giving a proper shape to provideextra feature as defined in the chapter 6 algorithm parts.
In this thesis work I seek to address the following issues
• Dispatching of emergency vehicles to Breakdown vehicles or vehicles indistress, whenever it is sought. So a rescue van/vehicle is sent that is in theshortest distance from the vehicle which is in distress. But only the parametershortest distance is not enough to solve the problem because of the following
reasons :a) Deployment of rescue vehicles solely is more cost effectiveb) The rescue vehicle may reach in late because of network traffic
• So dispatching a nearest vehicle of the route to Breakdown vehicles is the bestchoice. Although it is a good solution but it may have the following problems:
a) The nearest vehicle may not reach to the desired destination as thepassengers of this vehicle may go to another destination. So the
distressed passengers have to search for another vehicle after travelinga particular distanceb) The nearest vehicle may not have the capacity to accommodate the
distressed passengers
• As AFMS is a decision support system and decision has to be taken dependingon some factors :
a) Road mapsb) Traffic congestionc) Number of vehicles etc.
So its application may vary in different regions and with different requirements.A list of urls is given in the reference as literary survey to prepare this thesis work.

8/9/2019 FleetMgtSystem.pdf
http://slidepdf.com/reader/full/fleetmgtsystempdf 19/86
11
Chapter 3
Systems Model and Technology
3.1 overview
AFMS is a Decision Support System. It glues different technologies likeGSM/GPRS based mobile communication, client-server web based n-tierarchitecture with GPS based satellite communication to provide a reliable, secure,more cost effective, real time basis platform. So the overall system model standson Mobile Communication with Object Oriented Technology.
Overall functionality of the Automatic Fleet Management System (Fig-03)
Communicationserver
DatabaseServer
ApplicationsRunning for User
Interface
Vehicle
Internet
GPRS/GSM
GPS
Mobile Tower

8/9/2019 FleetMgtSystem.pdf
http://slidepdf.com/reader/full/fleetmgtsystempdf 20/86
12
The system uses the GPS system together with the GSM (GPRS/ICS - InternetCommunications Services) infrastructure to bring back information to central controlRoom.
3.2 Communication System
In any vehicle tracking system, the communications infrastructure is the mainconcern this is because it is this that brings information back to central controlstation. This model uses the GSM infrastructure and in particular the GPRS/ICS(Generalized Packet Radio Service / Internet Communications Services) functionof GSM. This function allows mobile phone users to send Multimedia Messages(MMS) and to surf the Internet. Google map is used for mapping the location.Vehicle Tracking Unit (VTU) is used for providing addition information to the
application server which in turn store in the database server for taking necessarycontrol of the vehicle in future.
Fig-04
3.3 Fleet Management Systems
Fleet Management Systems is responsible for bringing back data from the vehicle tocentral control station. The standard information that it sends would be LocationInformation about the vehicle (Longitude/Latitude), Altitude, Speed and Distancetraveled between two reported points. This information is derived purely from the GPSsystem and no connection to the vehicle is required apart from the power supply.
To bring back other information, for example, temperature and tire pressure, vehiclerunning status etc. additional equipment is required and it is the VTU (VehicleTracking Unit) in which such vehicle’s electrical systems are embedded.
Vehicle Tracking
This SIM isoften calledVTSIM ( vehicletracking SIM ) itis configured bythe SMS Server
SIM
8/9/2019 FleetMgtSystem.pdf
http://slidepdf.com/reader/full/fleetmgtsystempdf 21/86
13
3.4 Technology
A brief overview of different technologies used in the system is given below:
GPS Technology: Global Positioning System (GPS) technology is a Global Navigation Satellite Systemdeveloped by the US Depart of Defense .System is formed from a constellation of 24Satellites that orbit the Earth at an altitude of 20,000 Km every 12 Hours .Satellitesemits microwave signals which enable GPS receivers to calculate position, time,speed and direction. Small Portable GPS Receivers have become very affordable andcan be fitted on to mobile assets .Lower costs have led to use of GPS in a widevariety of applications .
The GPS receiver captures position data from the satellites, computes the position ofthe vehicle and sends this information to a central base station, using SMS. Thisinformation is collected by the built-in web-server at the base station. Then locationdata can be stored to a database server and if the vehicle is out of range of thecellular operator it can be retrieved later. The Telematic Function means that it canbring back information of any measurable quantity from the vehicle. Some exampleswould be temperature in a refrigerated container, tire pressure, weight of the cargo itis carrying. Generally, any electronically measurable quantity can be sent back tocentral control station.
GPRS Technology:
General packet radio service (GPRS) is a packet oriented mobile data serviceavailable to users of the 2G cellular communication systems global system for mobilecommunications (GSM), as well as in the 3G systems. In 2G systems, GPRSprovides data rates of 56-114 kbit/s. Charge of GPRS data transfer is typically permegabyte of traffic transferred, while data communication via traditional circuitswitching is billed per minute of connection time, independent of whether the usersare actually using the capacity or keep in an idle state. GPRS is a best-effort packetswitched service, as opposed to circuit switching, where a certain quality of service
(Quos) is guaranteed during the connection for non-mobile users.
2G cellular systems combined with GPRS are often called as 2.5G , that is, atechnology between the second (2G) and third (3G) generations of mobile telephony.It provides moderate speed of data transfer, following unused time division multipleaccess (TDMA) channels in, for example, the GSM system. Originally there was somethought to extend GPRS to cover other standards, but instead those networks arebeing converted to use the GSM standard, so that GSM is the only kind of networkwhere GPRS is in use. GPRS is integrated into GSM Released in 1997 and newerreleased versions. It was originally standardized by European Telecommunications
Standards Institute (ETSI), but now forwarded by the 3rd Generation PartnershipProject (3GPP).

8/9/2019 FleetMgtSystem.pdf
http://slidepdf.com/reader/full/fleetmgtsystempdf 22/86
14
GPRS was developed as a GSM response to the earlier CDPD and i-mode packetswitched cellular technologies.
Services offered
GPRS extends the GSM circuit switched data capabilities and makes the followingservices possible:
• Provides "Always on" internet access• Facilitate Multimedia messaging service (MMS)• Push to talk over cellular (PoC/PTT)• Provides instant messaging• Internet applications for smart devices through wireless application protocol
(WAP)• Point-to-point (P2P) service: inter-networking with the Internet (IP) protocol
If SMS over GPRS is used, an SMS transmission speed of about 30 SMS messages
per minute may be achieved. This is much faster than using the ordinary SMS overGSM, whose SMS transmission speed is about 6 to 10 SMS messages per minute. Acomparative study between GPRS/ICS Based System and SMS Based System ismention in appendix B.
Protocols supported
GPRS supports the following protocols:
• Internet protocol (IP). In practice, mobile built-in browsers use IPv4 since IPv6
is not yet popular and functioning every region.• Point-to-point protocol (PPP). In this mode PPP is often not supported by the
mobile phone operator but if the mobile is used as a modem to the connectedcomputer, PPP can be used to tunnel IP to the phone. This allows an IPaddress to be assigned dynamically to the mobile equipments.
• X.25 connections. This is typically used for applications like wireless basedterminals(workstations), although it has been removed from the standard. X.25still it can be supported over PPP, or even over IP, but doing this requires eithera network based router to perform encapsulation or embedding intelligence tothe end-device/terminal; e.g., user equipment (UE).
When TCP/IP is used, each phone can have one or more IP addresses allocated.GPRS will store and forward the IP packets to the phone during cell handover (whenwe move from one cell to another). TCP handles any packet loss (e.g. due to a radionoise induced pause) resulting in a temporary throttling in transmission speed.
Object Oriented model is used in the software communication part to develop thissystem. So java is the best choice to develop this platform as a language. Here javais considered as a language to develop this system because of its robustness,adoptability features, platform independency, and enterprise web based application
development capabilities. Detail design of this model is defied in the next chapter.

8/9/2019 FleetMgtSystem.pdf
http://slidepdf.com/reader/full/fleetmgtsystempdf 23/86
15
Chapter 4 System Architecture, Design and Implementation
4.1 User Interface
4.1.1 N-tier architecture
Fig-05
In n-tier architecture each tier is related to specific process. User’s HTTP requestsends to Web Server through web browser. Web browser forwards the request to theApplication server to communicate and to execute the Business Logic that have in thesystem. The Application server in turn may require some data from Database serverto fetch and finally the result is send back to the user’s browser as an HTTP response.
4.1.2 MVC Architecture
MVC architecture is the fundamental design for this web based application system.Essentially, MVC breaks GUI components into three elements: Model, View, andController. Each of these elements plays a crucial role in how the components behave.
MODEL : The model encompasses the state data for each components used in the
system. Different types of models exist for different types of components, e.g. a menucomponent may simply contain a list of menu items that a user can select from. Thisinformation remains same no matter how the component is painted on the screen;model data is always independent of component visualization.
VIEW : The view refers to how we see the components on the screen, e.g. how viewscan make difference by looking at an application window on two different GUIplatforms. Because different window frames format exist in different platform.
CONTROLLER : This component is the main concern of the user interface that
dictates how the components interact with events. Events may come from mouseclick, gaining and losing focus, acceptance of GPRS data. So controller dictates howeach component reacts to the generated events. For example, after login to this
Web Server( ApacheTom Cat )
ApplicationServer( Sun oneApplicationServer /NetBeans )
DatabaseServer(MySql )
User
Interface
( Web
Browser )

8/9/2019 FleetMgtSystem.pdf
http://slidepdf.com/reader/full/fleetmgtsystempdf 24/86
16
system when we select vehicle map submenu from the list of menu bar and set thedate a map will be displayed on the screen. Here the controller part is: (1) select thesubmenu and (2) set date and the view part is the map displayed on the screen.
A brief MVC architecture of this system is given below:
Model View Controller Architecture (MVC) (Fig-06)
4.2 Activity Diagram
An Activity diagram shows the flow from activity to activity within a system. As itis an object oriented, mobile communication system its dynamic views can beshown by some activity diagrams of this system.
Once the device (VTU) is configured properly, it can be installed into the vehicle(power source and other sensors are to be connected properly). Now, the device isready to send event data to the application/communication server through GPRS aftereach interval (as configured). The communication server, on getting the event data,would perform several operations such as - parsing the data packet and extracting
information like latitude, longitude, timestamp, status code, speed etc. Depending onthe latitude/longitude value a reverse geo-coder method is followed to obtain the
(1) POST
Client
Browser
(6) Response
( 2) Dispatcher
(4) FORWARD
View( jsp files)
Controller(AccountLogin.java
) Business
Logic Action
(5) Extract ModelDataSet &Data Tables
(3) Update
LoginSession.jsp

8/9/2019 FleetMgtSystem.pdf
http://slidepdf.com/reader/full/fleetmgtsystempdf 25/86
17
human understandable address format and then inserting the event data into thedatabase. The following activity diagram shows how to interpret GPS received data.
Activity diagram shows how to interpret GPS received data (Fig-07)
When vehicles are moving in different routes, it is tracked by this system due thedevice (VTU) attached with it. So devices can be grouped together to watch and
control easily. Device groups represent a functional grouping of various devices underan account. If no group is defined for the account, the default group is ‘all’ . The two

8/9/2019 FleetMgtSystem.pdf
http://slidepdf.com/reader/full/fleetmgtsystempdf 26/86
18
following diagrams show how to create a device group and how we can view thegroups of devices.
Activity diagrams show how to create and view device groups(Fig-08)

8/9/2019 FleetMgtSystem.pdf
http://slidepdf.com/reader/full/fleetmgtsystempdf 27/86
19
When vehicles are tracked and displayed their location on the map, the current realdata along with the historical positional data is required. The two following diagramsshow how to track the devices (vehicles) using map for real time and historicaldevice(s) data.
Activity diagram for mapping real time and historical device(s) (Fig-09)

8/9/2019 FleetMgtSystem.pdf
http://slidepdf.com/reader/full/fleetmgtsystempdf 28/86
20
Authorized users can only login to the system and can explore all functional activitiesof this system. The following two activity diagrams show how to login and logout fromthe system..
Activity diagrams show about the login and logout from the AFMSsystem(Fig-10)

8/9/2019 FleetMgtSystem.pdf
http://slidepdf.com/reader/full/fleetmgtsystempdf 29/86
21
When a user login to the system, he/she can create another account. Accounts are oftwo types (1) Administrator account and (2) User account. An Administrator accounthas all privileges to access and control all the system resources. An Administrator cancreate another user but a normal user can’t do it. The following two activity diagramsshow how to create and view administrative account.
Activity diagrams show how to create and view an administrator accountin the AFMS system(Fig-11)
8/9/2019 FleetMgtSystem.pdf
http://slidepdf.com/reader/full/fleetmgtsystempdf 30/86
22
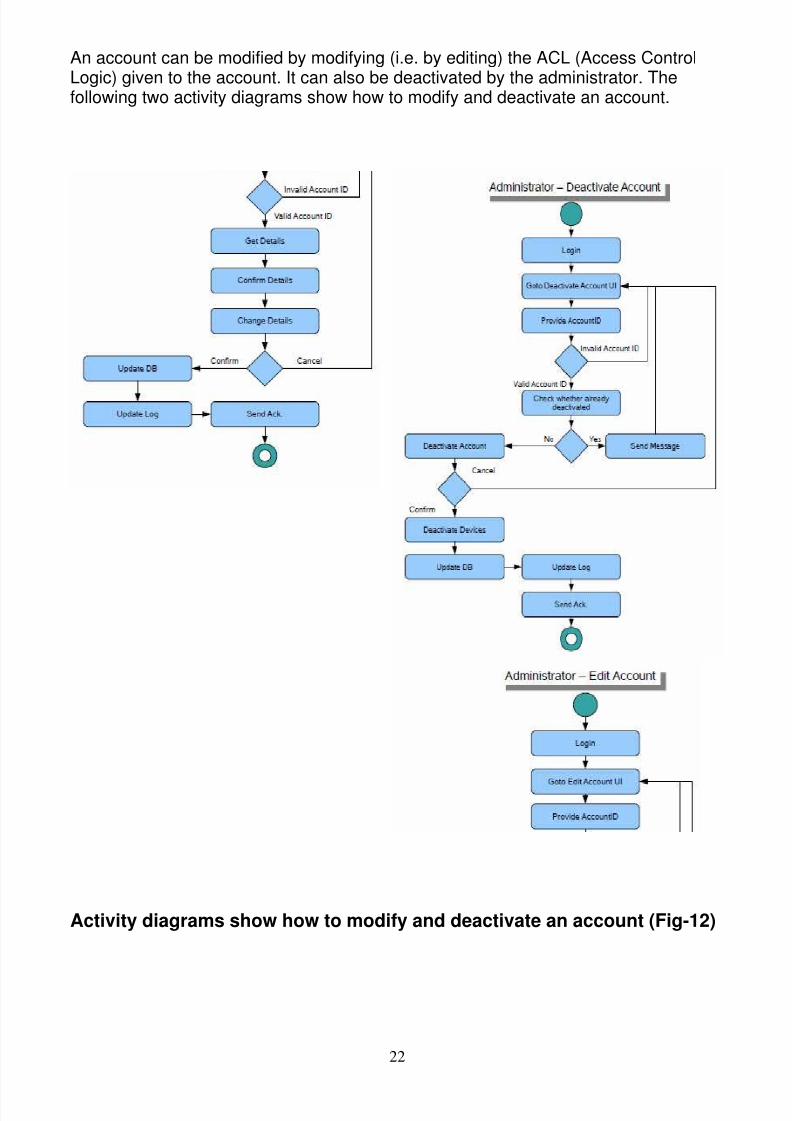
An account can be modified by modifying (i.e. by editing) the ACL (Access ControlLogic) given to the account. It can also be deactivated by the administrator. Thefollowing two activity diagrams show how to modify and deactivate an account.
Activity diagrams show how to modify and deactivate an account (Fig-12)
8/9/2019 FleetMgtSystem.pdf
http://slidepdf.com/reader/full/fleetmgtsystempdf 31/86
23
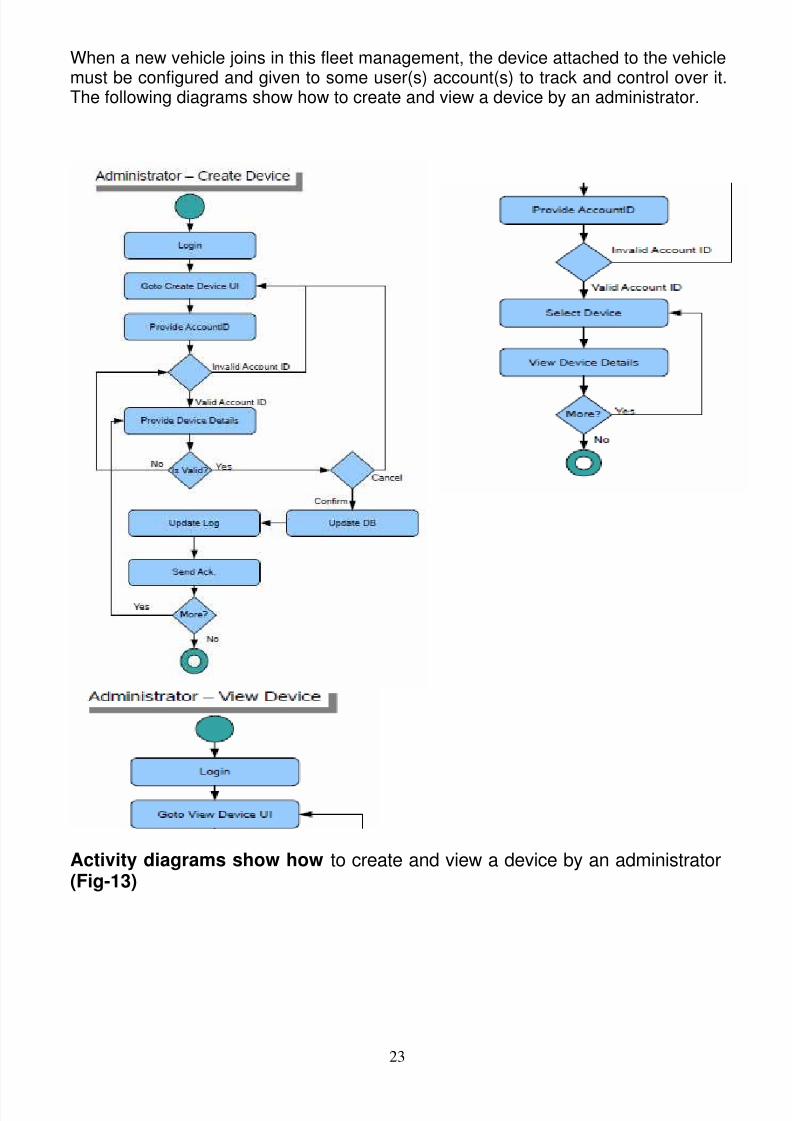
When a new vehicle joins in this fleet management, the device attached to the vehiclemust be configured and given to some user(s) account(s) to track and control over it.The following diagrams show how to create and view a device by an administrator.
Activity diagrams show how to create and view a device by an administrator (Fig-13)

8/9/2019 FleetMgtSystem.pdf
http://slidepdf.com/reader/full/fleetmgtsystempdf 32/86
24
Geo-fence is a rectangle, defined by the 2 vertices of its south-west to north-east(SW-NE) diagonal. Each account can have several geo-fences defined for it but eachdevice can have only one geo-fence assigned to it (a hardware feature). A User cancreate a geo-fence, which can then be uploaded remotely to the hardware. This(hardware) feature will generate alerts whenever the vehicle enters or leaves thedesignated geographical area (as defined by the user). The following diagrams showhow to create and view Geofences by a user.
Activity diagrams show how to create and view Geofences (Fig-14)

8/9/2019 FleetMgtSystem.pdf
http://slidepdf.com/reader/full/fleetmgtsystempdf 33/86
25
After creation of Geofences an administrator can edit i.e. modify it and delete it. TheFollowing activity diagrams show how to edit and delete Geofences by anAdministrator.
Activity diagrams show how an administrator can edit and delete Geofences(Fig-15)

8/9/2019 FleetMgtSystem.pdf
http://slidepdf.com/reader/full/fleetmgtsystempdf 34/86
26
Way-Point is a circular area and a user can define these circular areas (point + radius)on map. This feature would allow the user to configure points along the route that thevehicle must travel to, and receive alerts on arrival and departure from these points.This feature can be used to know what part of the journey and in what time frame hasbeen accomplished by the vehicle or for example to set up arrival notification if thevehicle is x km away from a warehouse etc. The Following activity diagram shows
how to create a way point.
Activity diagram shows how to create a way point(Fig-16)

8/9/2019 FleetMgtSystem.pdf
http://slidepdf.com/reader/full/fleetmgtsystempdf 35/86
27
In the AFMS system database server stores all the records of the fleets for generatingreports. A user can generate reports about a vehicle or a group of vehicles from adate range and displayed in HTML/TEXT format. The following activity diagram showshow to generate reports by a user.
Activity diagram shows how to generate reports by a user(Fig-17)

8/9/2019 FleetMgtSystem.pdf
http://slidepdf.com/reader/full/fleetmgtsystempdf 36/86
28
4.3 E-R Diagram of the system
The structure of database often called database schema is specified in one of manylanguages or notations suitable for expressing designs. After due consideration of thenotation, the design is committed to a structural form in which it can be put into aDBMS, and then the database takes on physical existence. In this system a databaseserver is connected with the application server to store all the events data thatgenerated by the devices of the vehicles.When a user login to the system the user has some privileges to access control overthe system resources and it is defined in the ACL (Access Control Logic). So howentities interact with in the system depend on the permission given to access controlover the entities (or resources). The role, waypoints, devices, geozones and othercomponents as configured in the user account are treated as functional components.These functional components are considered as entities of the system. The maininteracting entities and their relationships are defined in the following ER diagram.
ER diagram of the AFMS system (Fig-18)

8/9/2019 FleetMgtSystem.pdf
http://slidepdf.com/reader/full/fleetmgtsystempdf 37/86
29
4.4 Database Schema
There are 24 tables are used in this system Following are the information of Databaseschema of the tables defined within the AFMS. All the tables are generated byNetbeans 6.5 IDE. Tables’ name attributes, and the main constraints of the tables arelisted below:
1. Account:
This table defines the top level Account specific information. Account table stores allaccounts related information as created by this system.
• accountID (primary key)• accountType• notifyEmail• speedUnits• distanceUnits• volumeUnits• economyUnits• temperatureUnits• privateLabelName• expirationTime• password• contactName• contactPhone• contactEmail• timeZone• passwdQueryTime• lastLoginTime• isActive• displayName• description• notes• lastUpdateTime• creationTime• defaultUser• newUserRoleID• lastUpdateUser• balanceSMS
• balanceLoginPerDayPerUser• balanceUser• maxDevices• address• street
• city• country• pin

8/9/2019 FleetMgtSystem.pdf
http://slidepdf.com/reader/full/fleetmgtsystempdf 38/86
30
2. AccountString:
This table defines Account specific customized String key/values.
• accountID (primary key) (foreign key)• stringID (primary key)• singularTitle• pluralTitle• description• lastUpdateTime• creationTime• lastUpdateUser
3. AlarmCondition:
The administrative user interface (UI) would allow defining the possible alarmconditions in the back end.
• alarmConditionID (primary key) (system generated numeric ID)• inputType (possible values: digital, analog, waypoint)• input (e.g. door, window (digital), temperature (analog), null (in the case of
waypoints) etc.)• alarmCondition (e.g. ON, OFF, TOGGLE (digital), <,=,> etc (analog), Entering,
Not Entering, Leaving, Not Leaving (waypoints) etc) - The operator will bapplied right of the analog value.
• description• creationTime
4. AlarmRules:
This table stores alarm settings set against a device under a rule of an account. Thisgets updated only when a new alarm is set against a rule.
• accountID (primary key) (foreign key)• alarmID (primary key)• ruleID (primary key) (foreign key)• alarmConditionID (foreign key)•
isMonSelected• isTueSelected• isWedSelected• isThuSelected• isFriSelected• isSatSelected• isSunSelected• startTime• endTime• isActive•
description• lastUpdateTime• creationTime

8/9/2019 FleetMgtSystem.pdf
http://slidepdf.com/reader/full/fleetmgtsystempdf 39/86
31
• lastUpdateUser
5. Device:
This table defines Device/Vehicle specific information for an Account. A 'Device'record typically represents something that is being 'tracked', such as a Vehicle.
• accountID (primary key) (foreign key)• deviceID (primary key)• groupID• equipmentType• apnUserID
• uniqueID• simPhoneNumber• imeiNumber• isActive• displayName• description• lastUpdateTime• creationTime• lastUpdateUser• gpsNotVisibleCounter-> rename to gpsUnavailableDuration• gpsNotVisibleTimeStamp ->rename to gpsUnavailableTimestamp• devicePlanID• balanceHistory-> rename to 'history' -> this would contain how many days of
historical data that would be stored for the device• balanceWayPoint -> not required• balanceAlarmRules -> not required (instead add the following two fields):• balanceReport -> contains the number of reports that can be generated for the
device• geocoderMode -> this field is updated with the value of geocoderMode under
deviceTariffPlan• geofenceID• isGeofenceEntering• contact1• contact2• simServiceProvider• apnPassword• devPassword
(Whenever a gps not visible packet is received, it will check the time stamp of the lasteventData entry and compare it with the time stamp of the last GPSNotVisible entry. Ifthe former is greater, counter is reset else incremented.)

8/9/2019 FleetMgtSystem.pdf
http://slidepdf.com/reader/full/fleetmgtsystempdf 40/86
32
6. DeviceGroup:
This table defines Account specific Device Groups.
• accountID (primary key) (foreign key)• groupID (primary key)• displayName• description• notes• lastUpdateTime• creationTime• lastUpdateUser
7. DeviceList:
This table defines the membership of a given Device within a DeviceGroup. A Device
may bedefined in more than one DeviceGroup.
• accountID (primary key) (foreign key)• groupID (primary key) (foreign key)• deviceID (primary key) (foreign key)• lastUpdateTime• creationTime• description• lastUpdateUser
8. DeviceRuleMap:
This table defines Device specific Rules.
• accountID (primary key) (foreign key) • deviceID (primary key) (foreign key) • ruleID (primary key) (foreign key) • creationTime• lastUpdateUser
9. EventData:
This table contains events which have been generated by all client devices.
• accountID (primary key)• deviceID (primary key)• timestamp (primary key)• statusCode (primary key)• eventSequence• motionStatus =>values as defined in the status code logic. No further logic
needs to be implemented to identify start etc.• isIgnitionOn

8/9/2019 FleetMgtSystem.pdf
http://slidepdf.com/reader/full/fleetmgtsystempdf 41/86
33
• latitude• longitude• speedKPH• heading• altitude• address• remoteAddress• rawData• distanceKM• odometerKM• creationTime• duration => the differential increment in time from the previous record for a
particular device (timestamp:duration = odometer:distance)
10. GeneratedAlarm:
• eventSequence (foreign key references EventData table)
• alarmString • ruleID (foreign key)• alarmID (foreign key)• isActive (a notification which has been checked by the user would not be
displayed)• creationTime
The rule engine will go through the status code sent by the device and it will store arecord in this table if the status meets a system generated alarm (e.g. SOS) or if anyof the alarm conditionsfrom a defined ruleID/AlarmID is met.
11. Geofence:
This table defines Account specific geofences.
• accountID (primary key) (foreign key)• geofenceID (primary key)• latitudeNE• longitudeNE• latitudeSW• longitudeSW• displayName• description• lastUpdateTime• creationTime• lastUpdateUser
8/9/2019 FleetMgtSystem.pdf
http://slidepdf.com/reader/full/fleetmgtsystempdf 42/86
34
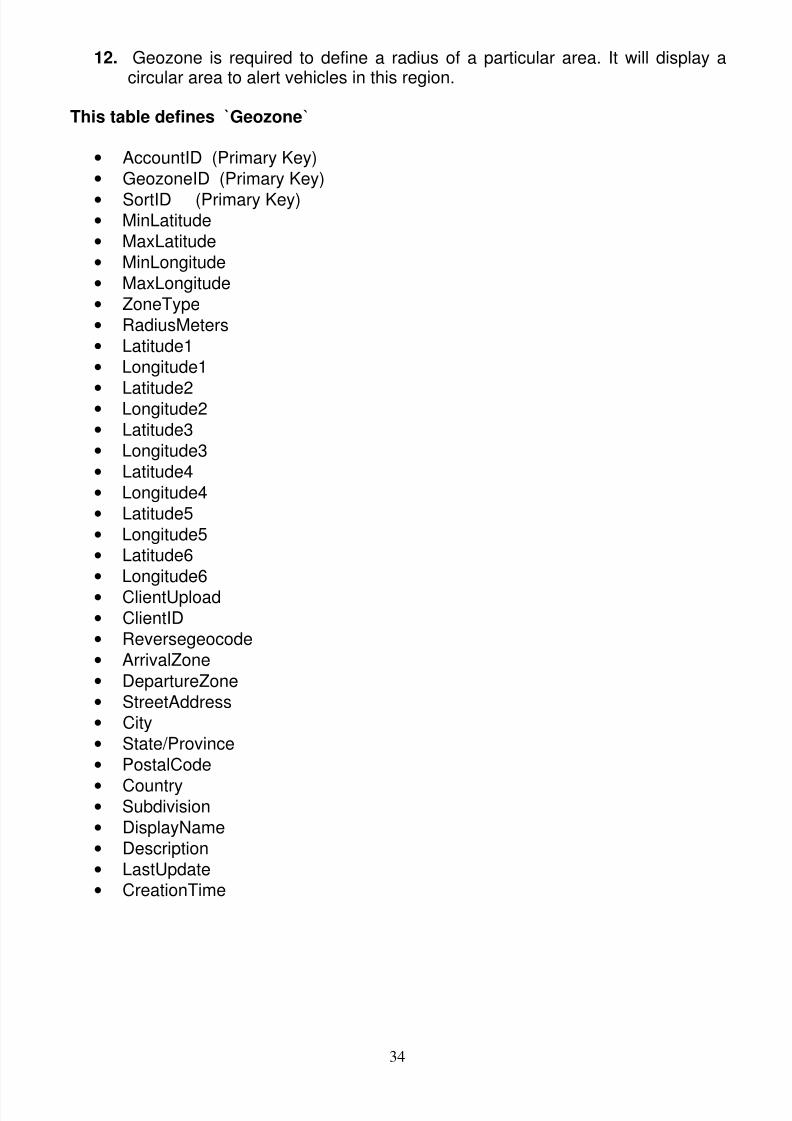
12. Geozone is required to define a radius of a particular area. It will display acircular area to alert vehicles in this region.
This table defines `Geozone`
• AccountID (Primary Key)• GeozoneID (Primary Key)• SortID (Primary Key)• MinLatitude• MaxLatitude• MinLongitude• MaxLongitude• ZoneType• RadiusMeters• Latitude1• Longitude1•
Latitude2• Longitude2• Latitude3• Longitude3• Latitude4• Longitude4• Latitude5• Longitude5• Latitude6• Longitude6• ClientUpload• ClientID• Reversegeocode• ArrivalZone• DepartureZone• StreetAddress• City• State/Province• PostalCode
• Country• Subdivision• DisplayName• Description• LastUpdate• CreationTime

8/9/2019 FleetMgtSystem.pdf
http://slidepdf.com/reader/full/fleetmgtsystempdf 43/86
35
13. GroupList:
This table defines the membership of a given User within a DeviceGroup. A Device
may be defined in more than one DeviceGroup.• accountID (primary key) (foreign key)• userID (primary key) (foreign key)• groupID (primary key) (foreign key)• creationTime• description• lastUpdateTime• lastUpdateUser
14. Notification:
This table defines notification options set against each user.
• accountID (primary key) (foreign key)• deviceID (primary key) (foreign key)• userID (primary key) (foreign key)• ruleID (primary key) (foreign key)• isSMSNotification• isEmailNotification• lastUpdateTime
15. PendingPacket:
This table contains configuration packets which are to be sent to the client device thenext time it 'checks-in' with the server.
• packetSequenceNo (primary key)• accountID
• deviceID• sendTime (the time stamp when command is entered into the outgoing
command queue)• packetData -> (the actual command being sent to the device)• isSentPacket• packetCode (possible values: set geofence, unlock door, lock door, engine
immobilize, engine release, etc - a list needs to be created for all possiblevalues)
• senderID (possible values: UserID, effiKC)
Note: For generating outgoing command report, the report engine would fetch the
deviceID, senderID, sendTime and packetCode for displaying in the report undertransmit mode= GPRS

8/9/2019 FleetMgtSystem.pdf
http://slidepdf.com/reader/full/fleetmgtsystempdf 44/86
36
16. Resource:
This table defines Account specific text resources.
• accountID (primary key) (foreign key)• resourceID (primary key)• title• type• properties• value• displayName• description• lastUpdateTime• creationTime
• lastUpdateUser
17. Role:
This table defines Account specific Roles.
• accountID (primary key) (foreign key)• roleID (primary key)• displayName• description•
notes• lastUpdateTime• creationTime• lastUpdateUser
18. RoleAcl:
This table defines Role specific Access Control permissions.
• accountID (primary key) (foreign key)•
roleID (primary key) (foreign key)• aclID (primary key)• accessLevel• description• lastUpdateTime• creationTime• lastUpdateUser
8/9/2019 FleetMgtSystem.pdf
http://slidepdf.com/reader/full/fleetmgtsystempdf 45/86
37
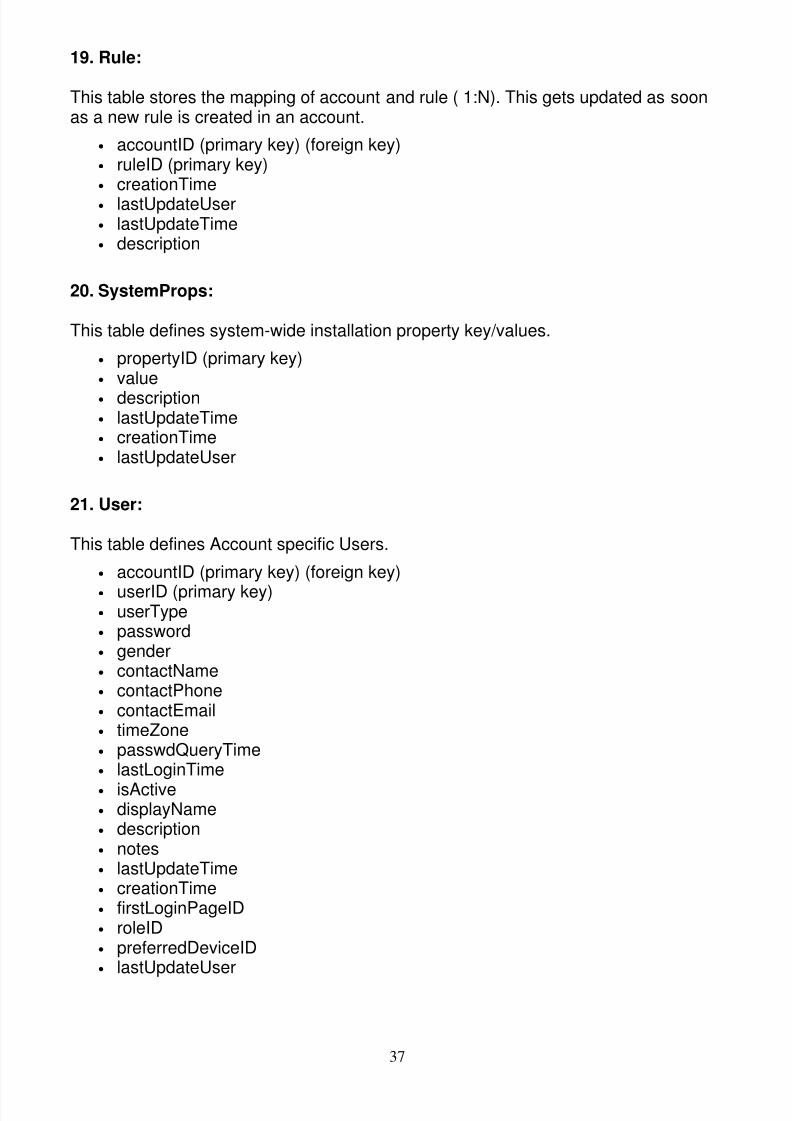
19. Rule:
This table stores the mapping of account and rule ( 1:N). This gets updated as soonas a new rule is created in an account.
• accountID (primary key) (foreign key)• ruleID (primary key)• creationTime• lastUpdateUser• lastUpdateTime• description
20. SystemProps:
This table defines system-wide installation property key/values.
• propertyID (primary key)• value• description• lastUpdateTime• creationTime• lastUpdateUser
21. User:
This table defines Account specific Users.
• accountID (primary key) (foreign key)• userID (primary key)• userType• password• gender• contactName• contactPhone• contactEmail• timeZone• passwdQueryTime• lastLoginTime• isActive• displayName• description• notes• lastUpdateTime• creationTime• firstLoginPageID• roleID• preferredDeviceID• lastUpdateUser

8/9/2019 FleetMgtSystem.pdf
http://slidepdf.com/reader/full/fleetmgtsystempdf 46/86
38
22. UserAcl:
This table defines User specific Access Control permissions.
• accountID (primary key) (foreign key)• userID (primary key) (foreign key)• aclID (primary key)• accessLevel• description• lastUpdateTime• creationTime• lastUpdateUser
23. WayPoint:
This table defines Account specific waypoints.
• waypointNumericID (primary key) (system generated unique ID per account)• accountID (foreign key)• waypointID (foreign key)• centerLatitude• centerLongitude• description• lastUpdateTime• creationTime• lastUpdateUser
24. OutgoingSMS
• smsSequenceNo (primary key)• accountID• receiverType (possible values: device, user)• recipientID (possible values: deviceID, userID)• receiverNumber (mobile number of the receiver)• sendTime (time stamp when message is entered into the outgoing SMS queue)• senderID (possible values: userID, sanat)• packetCode (text:possible values: set geofence, unlock door, lock door, engine
immobilize, engine release, etc -check packet code list)• packetData (text: the actual text message to be sent -> updated by
OutgoingMessageMonitor engine)

8/9/2019 FleetMgtSystem.pdf
http://slidepdf.com/reader/full/fleetmgtsystempdf 47/86
39
4.5 Use Case Diagram of the system
Use case diagram of UML used for modeling the dynamic aspects of the system. Usecase diagrams are used for visualizing, documenting, and specifying mainly thebehavior of the components interacting in the system. It is also important for testingexecutable systems through forward engineering and to understand the executable
systems through reverse engineering. In this system, the behavior of differentinteracting components is expressed in the following use case diagrams.
The below use case diagram (Fig-19) shows interaction of the users access controllogic or account owners with the system.

8/9/2019 FleetMgtSystem.pdf
http://slidepdf.com/reader/full/fleetmgtsystempdf 48/86
40

8/9/2019 FleetMgtSystem.pdf
http://slidepdf.com/reader/full/fleetmgtsystempdf 49/86
41
Fig-20
The above use case diagram shows administrator’s behavior with the system. That ishow an administrator can create an account, giving privileges to the account holder,permission password change, manage waypoint etc.
8/9/2019 FleetMgtSystem.pdf
http://slidepdf.com/reader/full/fleetmgtsystempdf 50/86
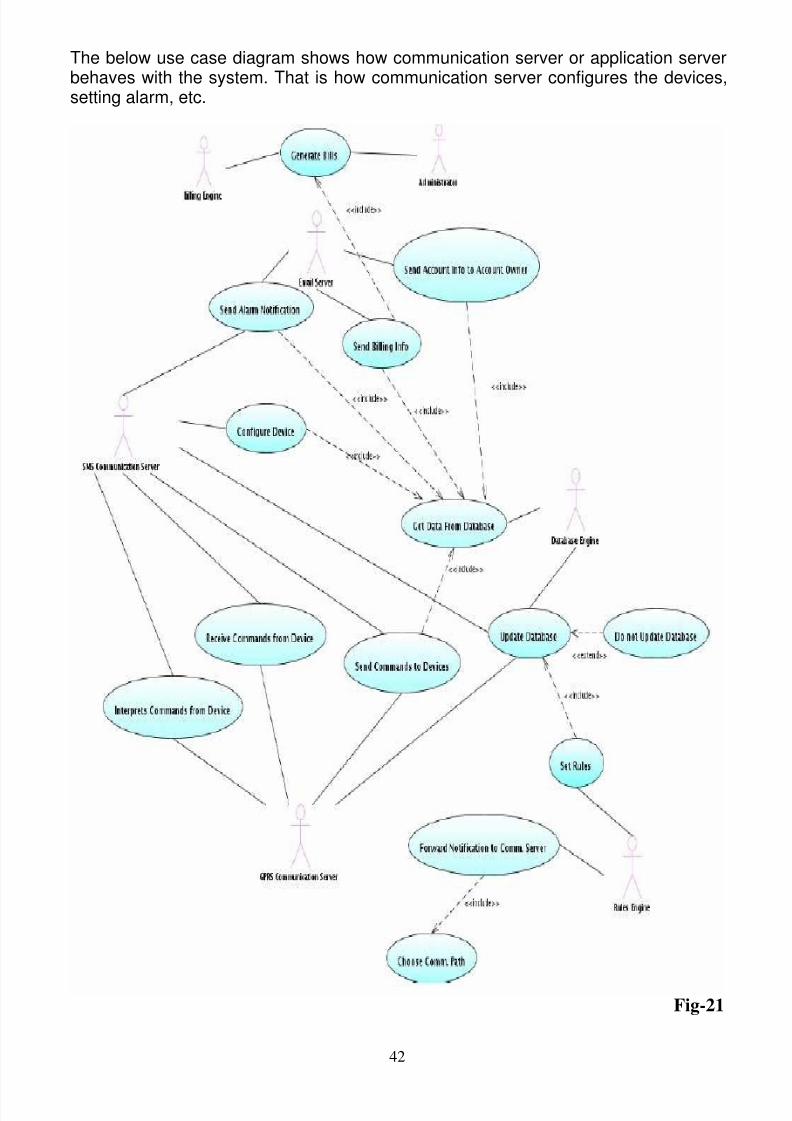
42
The below use case diagram shows how communication server or application serverbehaves with the system. That is how communication server configures the devices,setting alarm, etc.
Fig-21
8/9/2019 FleetMgtSystem.pdf
http://slidepdf.com/reader/full/fleetmgtsystempdf 51/86
43
4.6 Algorithm embedded in this model
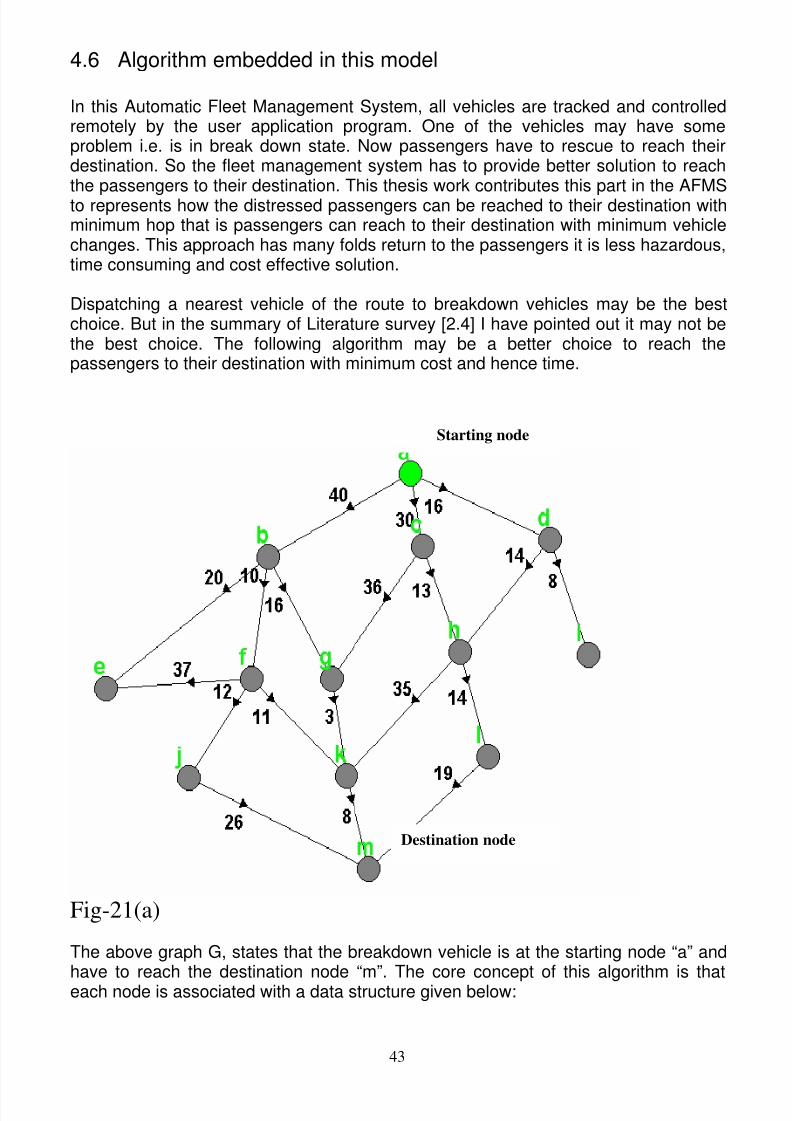
In this Automatic Fleet Management System, all vehicles are tracked and controlledremotely by the user application program. One of the vehicles may have someproblem i.e. is in break down state. Now passengers have to rescue to reach theirdestination. So the fleet management system has to provide better solution to reachthe passengers to their destination. This thesis work contributes this part in the AFMSto represents how the distressed passengers can be reached to their destination withminimum hop that is passengers can reach to their destination with minimum vehiclechanges. This approach has many folds return to the passengers it is less hazardous,time consuming and cost effective solution.
Dispatching a nearest vehicle of the route to breakdown vehicles may be the bestchoice. But in the summary of Literature survey [2.4] I have pointed out it may not bethe best choice. The following algorithm may be a better choice to reach thepassengers to their destination with minimum cost and hence time.
Fig-21(a)
The above graph G, states that the breakdown vehicle is at the starting node “a” andhave to reach the destination node “m”. The core concept of this algorithm is thateach node is associated with a data structure given below:
Starting node
Destination node

8/9/2019 FleetMgtSystem.pdf
http://slidepdf.com/reader/full/fleetmgtsystempdf 52/86
44
Structure node :
Status : Boolean // either visited or notBuslist : List // List of buses in the routeWeight : integer // length of the route between nodessp : stack // for push pop operationq : queue // to enqueue elements of the graph
Hopcount: integer // to count the number of hops
1. Initially make the source code permanent and make it as a current workingnode. All other nodes marked as temporary.
2. Examine all the temporary adjacent nodes of the current working node andafter checking the condition minimum hop distance, relabeled the requirednodes.
3. From all temporary nodes, find the node which has minimum hop distance. Ifmore than one node have same hop number then check their minimumdistance and mark this node permanent and this is the current working node.
4. Repeat step 2 and 3 until destination node is made permanent.
Pseudo code of this algorithm is as follows:
The graph G = ( V,E ) has all nonnegative nodes and each node is associated withthe above mentioned data structure. For simplicity this graph can be thought of asa directed graph i.e. vehicles are routed in a particular direction. All notations usedin this algorithm are as a general convention of data structure.
MinHopAlgo (G, W, BL, s)
/* G is the graph i.e. is road layout, W is the weight or length of the path, BL is thebus list of the routes, and s is the starting node */
1. Initialize-Graph-Source( G, s)2. S←03. Q←V[G]4. while Q != null5. do u←Find-MinHop(Q)6. S←S U { u }7. for each vertex v € Adj[u]8. do Relax(u,v,bl,w)
8/9/2019 FleetMgtSystem.pdf
http://slidepdf.com/reader/full/fleetmgtsystempdf 53/86
45
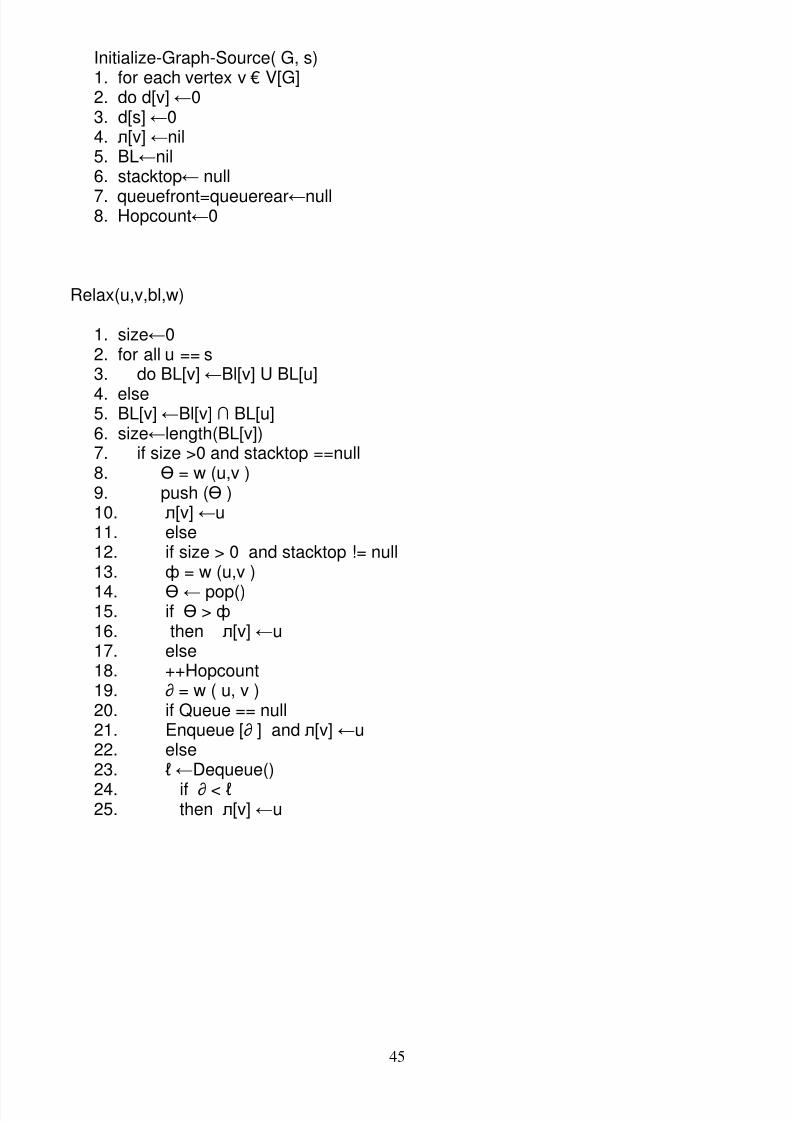
Initialize-Graph-Source( G, s)1. for each vertex v € V[G]2. do d[v] ←03. d[s] ←04. л[v] ←nil5. BL←nil6. stacktop← null
7. queuefront=queuerear←null8. Hopcount←0
Relax(u,v,bl,w)
1. size←02. for all u == s3. do BL[v] ←Bl[v] U BL[u]
4. else5. BL[v] ←Bl[v] ∩ BL[u]6. size←length(BL[v])7. if size >0 and stacktop ==null8. Ө = w (u,v )9. push (Ө )10. л[v] ←u11. else12. if size > 0 and stacktop != null13. ф = w (u,v )
14. Ө ← pop()15. if Ө > ф 16. then л[v] ←u17. else18. ++Hopcount19. ∂ = w ( u, v )20. if Queue == null21. Enqueue [∂ ] and л[v] ←u22. else23. ℓ ←Dequeue()
24. if ∂ < ℓ 25. then л[v] ←u
8/9/2019 FleetMgtSystem.pdf
http://slidepdf.com/reader/full/fleetmgtsystempdf 54/86
46
Chapter 5
Implementation Details
5.1 Introduction
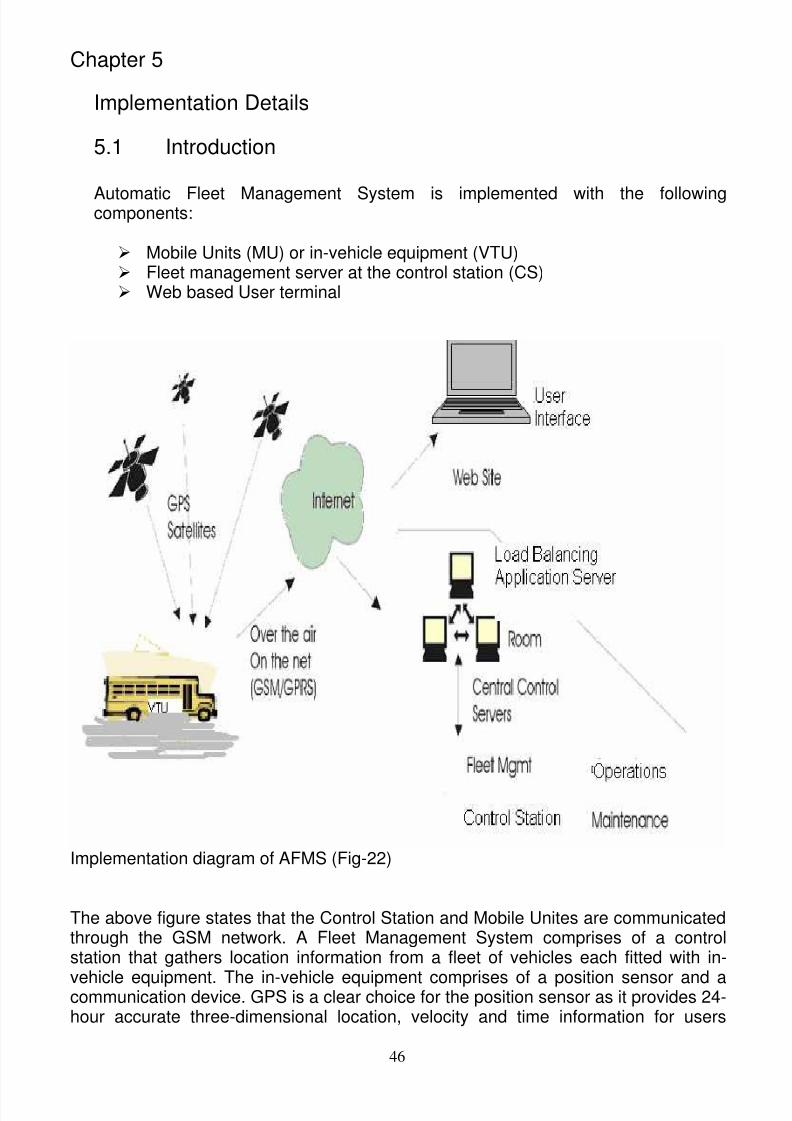
Automatic Fleet Management System is implemented with the followingcomponents:
Mobile Units (MU) or in-vehicle equipment (VTU) Fleet management server at the control station (CS) Web based User terminal
Implementation diagram of AFMS (Fig-22)
The above figure states that the Control Station and Mobile Unites are communicatedthrough the GSM network. A Fleet Management System comprises of a controlstation that gathers location information from a fleet of vehicles each fitted with in-
vehicle equipment. The in-vehicle equipment comprises of a position sensor and acommunication device. GPS is a clear choice for the position sensor as it provides 24-hour accurate three-dimensional location, velocity and time information for users
8/9/2019 FleetMgtSystem.pdf
http://slidepdf.com/reader/full/fleetmgtsystempdf 55/86
47
anywhere on or near the surface of the Earth and is free of service charge. Thelocation information from the vehicle can be relayed back to the control station bymeans of several RF media. GSM is an optimal choice considering flexibility,performance, security and cost. Also GSM is the widely used wireless communicationstandard available in most parts of India. Web based user terminal provides graphicalmap of the route layout with a good communication with the control station.
5.2 Software components
To view the current position of the device a web-based application has beendeveloped. Using this Web application an end user will be able to view the liveposition of the vehicles and also the past position by selecting a specific date andtime interval. To develop this system the following soft wares are used:
Java (JDK1.6 with Net Beans 6.5 version IDE tools ) , JavaScript and Ajax scripting language
MySQL database server with Navicate Lite tools Apache Tomcat 5.5.28 Google Map
JDK1.6 with NetBeans 6.5 version IDE tools are used to built the web applicationfile (track.war file).
MySQL database server is used for storing data because of its high-performancequery engine, tremendously fast data insert capability, and strong support forspecialized web functions like fast full text searches [1]. A case study shows that it
could process an average of 3000 queries per second [2].
Apache Tomcat used as a web server to provide the web application with internet.
Google Map is used as a map provider to the web browser to track the fleet’sphysical location in GUI based platform. To buildup this system there are 26packages are used. Packages are listed below:
org.opengts, org.opengts.db, org.opengts.db.dmtp, org.opengts.db.tables,org.opengts.dbtools ( Contains tools for accessing SQL databases Currently MySQL
and Microsoft SQL Server are supported. ), org.opengts.dbtypes,org.opengts.geocoder, rg.opengts.geocoder.geonames, org.opengts.servers.gtsdmtp,org.opengts.servers.template, org.opengts.tools, org.opengts.util (Contains variouscommon use utilities that make programming a little easier), org.opengts.war.events ,org.opengts.war.gc101, org.opengts.war.gprmc, org.opengts.war.maps, org.opengts.war.maps.jsmap, org.opengts.war.mologogo, org.opengts.war.report,org.opengts.war.report.dmtp,org.opengts.war.report.event,org.opengts.war.report.field,org.opengts.war.tools, org.opengts.war.track, org.opengts.war.track.page, org.opengts.war.track.taglib,
In these 26 packages total number of classes is 321
8/9/2019 FleetMgtSystem.pdf
http://slidepdf.com/reader/full/fleetmgtsystempdf 56/86
48
5.3 Hardware components
• In-Vehicle Equipment (Mobile Unit)
GPS Receiver
GSM modem
The main feature of GPS receiver is its low cost, small form factor, and highersensitivity. These advantages along with its lower power consumption make it idealfor vehicle tracking applications. Both the hardware units are embedded in the VehicleTracking Unit (VTU).
• Application Server with GSM modem• Database Server• Laptop / desktop ( for user interface )
5.4 Protocol used for communication
5.4.1 GPS Protocol
In this system National Marine Electronics Association. (NMEA) 0183, version 2.0protocol is used for GPS connection and in Fig-05 explains how application serveraccepts data using this protocol. NMEA is a standard protocol, used by GPS receiversto transmit data.
5.4.2 HTTP Protocol
HTTP protocol is used for Application server and for user interface in web basedapplications.
5.5 Detail description of the Implementation
The In-vehicle tracking unit VTU consists of a GPS receiver and a SIM. The SIM isattached to VTU to make it enable of working in GSM network around the world.
Before to place it in a vehicle its functional activities should be properly set toinitialize the network system. The VTU accepts GPS satellite raw data and send it tothe application server through GPRS/GSM technology and finally store it in adatabase server in a human readable data format. The following flow diagram showsthe overall system implementation step-by-step:

8/9/2019 FleetMgtSystem.pdf
http://slidepdf.com/reader/full/fleetmgtsystempdf 57/86
49
The below diagram shows the function of Application server. It accepts the rawpositional data which is then converted it to a human readable form using ReverseGeocoding technique. Actually a java file named EventDataProvider.java isresponsible for accepting the raw data which is sent by the GPS modem via GPRSusing POST method of the HTTP protocol, this data consists of IMEI number of thedevice, Latitude, Longitude, Date, Speed and number of satellite. IMEI number isused to authenticate the device. Now this raw data is converted and finally stored intodatabase. The term geocoding generally refers to translating a human-readable
NO
Yes
YesNo
Yes
After VTU is switched ON
Retry toconnect
Wait
Get GPS data
Connection to Appl server
Get IMEI number
Network is
Initialized ?
Connect toGPRS ?
Connect to Applserver?
Disconnect from Server
Wait
StoreData inDatabaseServer
Fig-23

8/9/2019 FleetMgtSystem.pdf
http://slidepdf.com/reader/full/fleetmgtsystempdf 58/86
50
address into a point on the map. The process of doing the converse, translating apoint into a human-readable address, is known as reverse geocoding. TheGClientGeocoder.getLocations() method supports both standard and reversegeocoding. If we pass this method a GLatLng object instead of a String address, thegeocoder will perform a reverse lookup and return a structured JSON object of theclosest addressable location. Actually the closest addressable location may be somedistance from the original latitude and longitude values of the query, if the supplied
GLatLng is not an exact match for any addressable locations.
Application server functional flow diagram (Fig-24)
Listen to Accept newPosition
Is it a validIMEI NO.?
Convert NMEA Rawdata to Decimal Format
Find the nearestLocation using Reverse
Geocode
Save data to DatabaseServer
New Position
Position with Name

8/9/2019 FleetMgtSystem.pdf
http://slidepdf.com/reader/full/fleetmgtsystempdf 59/86
51
Now the question is how to find the Nearest Location?
The Spherical law of cosines is used to find out the name of the vehicle’s location.This formula is used generally for computing great-circle distances between two pairsof coordinates on a sphere. Spherical law of cosines [3]:
d=R*acos(cos(lat1).cos(lat2).cos(lng2−lng1)+sin(lat1).sin(lat2))
Here, d is the distance between two coordinates (lat1,lng2) and and (lat2, lng2).
Below is a geocode table and is implemented which has four attributes as given inTable 1.
Table 1 Geocode Table
ID Name of the Place Latitude Longitude1 AQ Block, Bidhannagar, Kolkata,
West Bengal, India
22.5777233333333 88.4395816666667
2 ED Block, Bidhannagar, Kolkata,West Bengal, India
22.5825366666667 88.4239583333333
3 Bidhannagar, Kolkata, West Bengal,India
22.5816516666667 88.429505
4 Maniktala Main Rd, Kankurgachi,Kolkata, West Bengal, India
22.583765 88.3789983333333
5 Acharya Prafulla Chandra Rd,Kolkata, West Bengal, India
22.5833383333333 88.3746916666667
After receiving a new position, the nearest location name of the newly receivedposition is found. This is done by running the Spherical law of cosines in the followingsql query:
"SELECT name, ( 3959 * acos( cos( radians('lat1) ) * cos(radians( lat2 ) ) * cos( radians( lng2 )– radians('lng1') ) + sin(radians('lat1') ) * sin( radians( lat2 ) ) ) ) AS distanceFROM geocodeHAVING distance < 5ORDER BY distance LIMIT 0 , 1"
This query returns the name of the location which has the shortest distance with thenew position.
How Live Tracking is being done?
Live tracking is the major part of this web application. This enables a user to view thelive position of the vehicle(s) on the map. Google Map Satellite version as defined inthe private.xml is used to locate the position. After Logging in, a user willautomatically be redirected to live_track.war file.

8/9/2019 FleetMgtSystem.pdf
http://slidepdf.com/reader/full/fleetmgtsystempdf 60/86
52
Live tracking as a sample of vehicle Red i-10 movements with different seed anddirection has been shown near Bidhannagar, as land mark.
Movement of a vehicle with different seed (Fig-25)

8/9/2019 FleetMgtSystem.pdf
http://slidepdf.com/reader/full/fleetmgtsystempdf 61/86
53
5.6 Evaluating the Performance Benefits of the Automatic Fleet ManagementSystem
There was little a evidence from the survey results that many or any AVL systems hadbeen the subject of rigorous (i.e. quantified) evaluation. So the primary motivation forthis technology is to provide reliable, real time on-line functionality. Practically shown
that if the number of vehicles increases the AFMS system can provide better servicesand hence the performance graph also elevated and the below figure shows thisreport.
0 1 4 6 8 10 12 14 16 18 20
hours
Normal fleet system
AFMS
P/H means passengers/hour
Performance graph of vehicles (Fig-26)

8/9/2019 FleetMgtSystem.pdf
http://slidepdf.com/reader/full/fleetmgtsystempdf 62/86
54
User Interface - main menu performance improvement
It is Suggested that put the time stamp and motion status in Device table. (so that forfetching last time stamp and motion status we don't have to scan EventData table as
well as device table)
PERFORMANCE CHECKING:-
checking with 300 clients:-
start time(mili sec):1242991465303end time:(mili sec) 1242991468352
{while fetching data from EventData data table. }total time difference:(mili sec) 3049
start time(mili sec):124299161374end time:(mili sec)124299164007
{while fetching data from Device table.}total time difference:(mili sec) 2633
(performance inprovement around 15.7%)
checking with 500 clients:-
start time(mili sec):1243056149896end time:(mili sec)1243056153905
{time taken to load the page with data and showing them in the UI by fetching datafrom EventData table}
total time difference:(mili sec) 4009
start time(mili sec):1243055931066end time:(mili sec)1243055934489
{time taken to load the page with data and showing them in the UI by fetching datafrom Device table}
total time difference:(mili sec) 3423
(performance inprovement around 17%)

8/9/2019 FleetMgtSystem.pdf
http://slidepdf.com/reader/full/fleetmgtsystempdf 63/86
55
PERFORMANCE CHECKING :
with 300 client:start time(mili sec):1244545031646end time:(mili sec)1244545032797
{fetching data directly from the Device table}total time difference:(mili sec) 1151
start time(mili sec):1244545219558end time:(mili sec)1244545220790
{fetching data directly from the EventData table having 1250 rows}total time difference:(mili sec) 1232
(performance inprovement around 7.1 %)
with 500 client:start time(mili sec):1244540508029end time:(mili sec)1244540510046
{fetching data directly from the Device table}total time difference:(mili sec) 2017
start time(mili sec):1244541629501end time:(mili sec)1244541631680
{fetching data directly from the EventData table having 1250 rows}total time difference:(mili sec) 2179
(performance inprovement around 8%)

8/9/2019 FleetMgtSystem.pdf
http://slidepdf.com/reader/full/fleetmgtsystempdf 64/86

8/9/2019 FleetMgtSystem.pdf
http://slidepdf.com/reader/full/fleetmgtsystempdf 65/86
57
6.2 Flow Diagram
This simulation diagram depicts the main activities of this thesis work.
Fig-28
Application / Communication server receivesthe raw data: GPRS format data
Then Communication server confirm thecorrectness of received data by checksummethod
Communication server then parse the data
Extract the different segments of thedata/String
Then send to the EventData mainly to thedatabase server
Now authorized users can connect to theWeb/Application server to use the AFMSs stem

8/9/2019 FleetMgtSystem.pdf
http://slidepdf.com/reader/full/fleetmgtsystempdf 66/86
58
6.3 Some execution snapshots of this system
Now the following diagrams show when a user explores the differentfunctionalities of this AFMS system
Contents of the simulation:
1) Introduction2) Login3) Main Menu4) Mapping4.1) Vehicle Map4.2) Group Map5) Summary Reports Last Known Location Summary6.1) Account Admin6.2) User Admin
6.3) Vehicle Admin6.4) Group Admin6.5) Geozone Admin6.6) Change Password
1) Introduction
This simulation chapter shows each step of thesis works stating from the initial loginto the various capabilities of the AFMS system. It includes Mapping, Reporting andAdministrative capabilities of this system. The intention of this simulation part is tofollow a step-by-step understanding of the core concept of this thesis by providingsome visual outputs. After installing and configuring all components of this system thefollowing steps will occur :
2) Login
The AFMS login window allows to login as a user or as an administrator. When loginas a normal user input data to the three text fields account, user name and password.
Here the user is under an administrator account so he/she has to mention the accountstring of the administrator. But to enter as an administrator input only the account andpassword filed of the administrator. The below fig-27 shows this activity.

8/9/2019 FleetMgtSystem.pdf
http://slidepdf.com/reader/full/fleetmgtsystempdf 67/86
59
Login screen of the system Fig-29
3) Main Menu
After login to the system user can access the main navigation menu, shown on the nextpage (Fig-28). The functions of the system are broken down into 3 main categories:Mapping, Reports and Administration. Each of the tabs corresponds to the appropriatelynamed category of functions. Navigation may be done in one of two ways:
Either from the Main tab, select Main Menu and the screen displayed above will be
presented. From there, we can select whichever section of the application is of our interest.
Or , we can use the individual tabs (Mapping, Reports, Administration) to selectfunctions within those specific categories. For instance, from the Reports tab, we may selectVehicle Detail Reports , Vehicle Summary Reports , or Driver Performance Reports .

8/9/2019 FleetMgtSystem.pdf
http://slidepdf.com/reader/full/fleetmgtsystempdf 68/86
60
Main menu screen (Fig-30)
4) Mapping
4.1) Vehicle Map
Now we get to start with the Mapping functionality. Now after clicking on the link TrackVehicle Locations on a Map as highlighted above.The following screen will be displayed afterselecting the appropriate vehicle (here Redi-10 is selected as a vehicle) and date range.Vehicles are moving in different speed and accordingly it is coloured.

8/9/2019 FleetMgtSystem.pdf
http://slidepdf.com/reader/full/fleetmgtsystempdf 69/86
61
Vehicle Map screen (Fig-31)
4.2) Vehicle Group Map
In the previous map control has been on the individual vehicle mapping. Let’s look at whatcan be done in terms of mapping group devices. From the Mapping tab, select Vehicle Group
Map to display all the vehicles in a given group or the entire fleet. Depending on the mannerin which vehicles are grouped within the fleet system, it is possible to look at either anindividual group of vehicles or the entire fleet on the map. In this system the Vehicle Group

8/9/2019 FleetMgtSystem.pdf
http://slidepdf.com/reader/full/fleetmgtsystempdf 70/86
62
Map will display the entire fleet of vehicles. This is equivalent to a Vehicle Group which is thesame as the entire fleet. Vehicles Group map displayed in the below screen.
Group Vehicle Map screen (Fig-32)
5) Summary Reports
Device Detail Reports, Fleet Summary Reports are focused on either a group of vehicles oran entire fleet. These are not relevant to a specific vehicle, as they present such informationthat is only useful when viewed across a group of vehicles or assets. The GPS TrackingReports – Fleet Summary Reports Screen can be accessed from the Reports tab andappears as shown below. The summary report can display in HTML format or in text format.

8/9/2019 FleetMgtSystem.pdf
http://slidepdf.com/reader/full/fleetmgtsystempdf 71/86
63
Summary report screen (Fig-33)
6) Administration
6.1) Account Admin
By selecting Account Admin from the Administration tab, the Edit Account Informationscreen will be displayed, as shown below. After making any changes in this screen, itis important to press the Change button at the bottom of the screen to save thoseedits (a message should then be displayed at the bottom of the frame to confirm thatthe information was saved). To cancel changes, press the Cancel link.

8/9/2019 FleetMgtSystem.pdf
http://slidepdf.com/reader/full/fleetmgtsystempdf 72/86
64
Account Admin screen (Fig-34)
6.2) User Admin
By selecting User Admin from the Administration tab, the View/Edit User Informationscreen will be displayed, as shown in Fig-29below. On this screen, we can watch allof the defined users in the system. There are a number of fields that are available inthis summary view -- User ID , User Name , Contact Name , Contact Email , Time Zoneand whether the user is Active (i.e. allowed to log-in). As we can see from the listbelow, it isn't necessary to populate all of these fields when setting up new users tothe system.
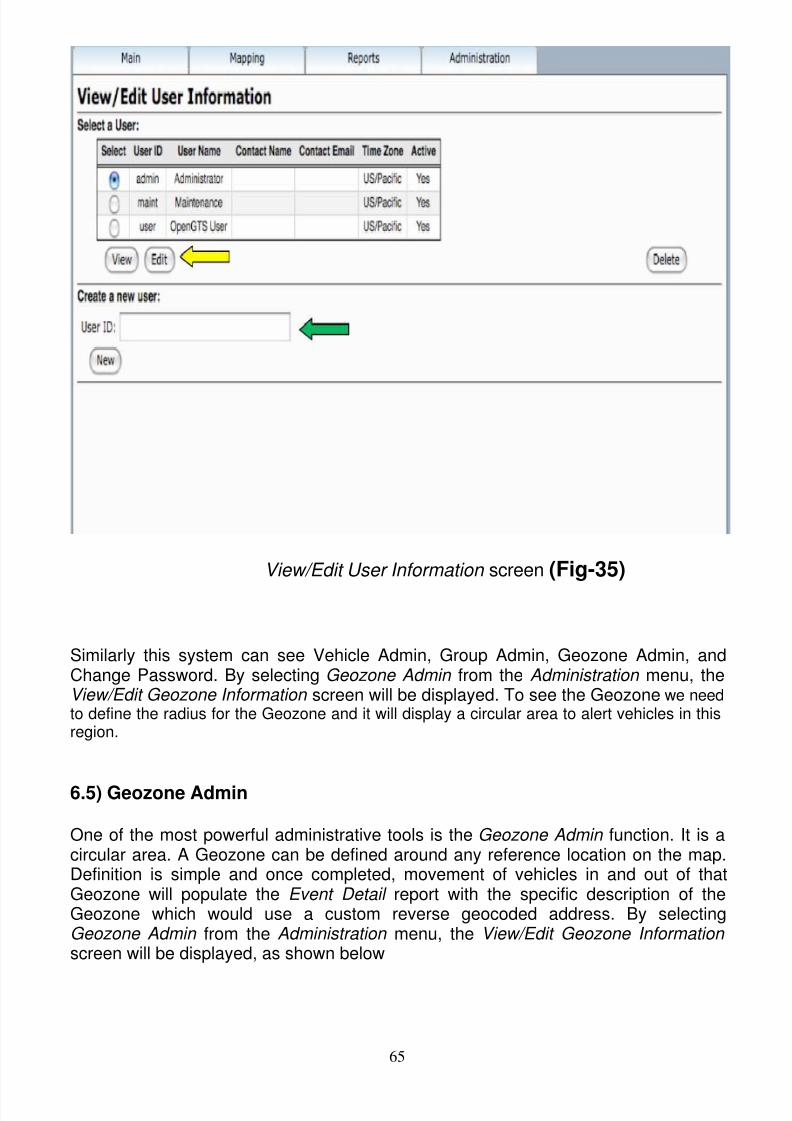
8/9/2019 FleetMgtSystem.pdf
http://slidepdf.com/reader/full/fleetmgtsystempdf 73/86
65
View/Edit User Information screen (Fig-35)
Similarly this system can see Vehicle Admin, Group Admin, Geozone Admin, andChange Password. By selecting Geozone Admin from the Administration menu, theView/Edit Geozone Information screen will be displayed. To see the Geozone we needto define the radius for the Geozone and it will display a circular area to alert vehicles in thisregion.
6.5) Geozone Admin
One of the most powerful administrative tools is the Geozone Admin function. It is acircular area. A Geozone can be defined around any reference location on the map.Definition is simple and once completed, movement of vehicles in and out of thatGeozone will populate the Event Detail report with the specific description of theGeozone which would use a custom reverse geocoded address. By selectingGeozone Admin from the Administration menu, the View/Edit Geozone Informationscreen will be displayed, as shown below

8/9/2019 FleetMgtSystem.pdf
http://slidepdf.com/reader/full/fleetmgtsystempdf 74/86
8/9/2019 FleetMgtSystem.pdf
http://slidepdf.com/reader/full/fleetmgtsystempdf 75/86
67
Conclusion
This thesis has presented a survey of automatic vehicle tracking along with itssecurity, reliability, low cost technology usage. As an emerging field of technology,automatic vehicle tracking has many unresolved issues associated with it besides itspotential. This thesis has tried to discuss both the potential aspects and concernsregarding automatic vehicle tracking side by side. Thus, this thesis provides theopportunity to have in depth knowledge of different aspects of automatic vehicletracking system. Vehicle tracking system has made such a model that manages acompany's vehicle fleet mainly concern with the vehicle telemetric.Tracking andmonitoring the entire fleet‘s movements is controlled by the GPS system. GPS is asatellite-based navigation system that works by receiving positional data from
satellites and calculating locations. It is the most effective solution in terms of cost andreal time basis data collection. This thesis has discussed different types oftechnologies its challenges and performance overheads. Besides this, some casestudies are also given which have provided the implementation details of virtualizationby different vendors. These case studies also describe how different vendors haveaddressed the challenges regarding the virtualization through their specificimplementations. There are certain security concerns, which open new challenges forthe user as well as service provider and which do not exist in the case of traditionalcommunication system, have been discussed in this thesis. This thesis has discussedthe role of trust, privacy and security in the healthy development of vehicle tracking paradigm.
This thesis has tried to encompass most of the reliability issues regarding tracking of thefleets, their challenges and some case studies which have effectively tried to address thosechallenges. This thesis has discussed the pros and cons of tools and techniques of satelliteand mobile communication with n-tier web based system presently available to address thevehicle tracking system.

8/9/2019 FleetMgtSystem.pdf
http://slidepdf.com/reader/full/fleetmgtsystempdf 76/86

8/9/2019 FleetMgtSystem.pdf
http://slidepdf.com/reader/full/fleetmgtsystempdf 77/86
69
GPS satellite (picture collected from http://www.ehow.com/facts_5005974_what-waypoint-gps.html ) Fig-37
GPS needs a clear line of sight to the sky to calculate waypoints correctly. You canenter and display waypoints as a latitude and longitude (i.e. 40°44 ′ 25″N 74°00 ′ 25″W)or more usefully as an address (335 Melody Lane, New York, New York). On a GPS,a waypoint is typically identified and indexed with a familiar name such as "Mom'sHouse" or "Demand Studios." o make them easier to understand, waypoints are oftendisplayed as points on a map. This is especially helpful when visualizing a route ortrying to find the closest destination to your current location. Though a GPS can storewaypoints simply for reference, they are most often used to calculate the shortest orfastest route between a user's current location and his intended destination. TheGoogle Maps site offers way an easy way to create and manage waypoints throughthe use of a keyboard and mouse. However, its coordinate system needs to beconverted to GPX format, the default for GPS units. Use GMapToGPX to transferfrom Google to GPS, and GPS Visualize to transfer from GPS to Google (seeResources).
When people talk about "a GPS," they usually mean a GPS receiver. The GlobalPositioning System (GPS) is actually a constellation of 27 Earth-orbiting satellites (24 in operation and three extras in case one fails). The U.S. military developed andimplemented this satellite network as a military navigation system, but soon opened itup to everybody else.
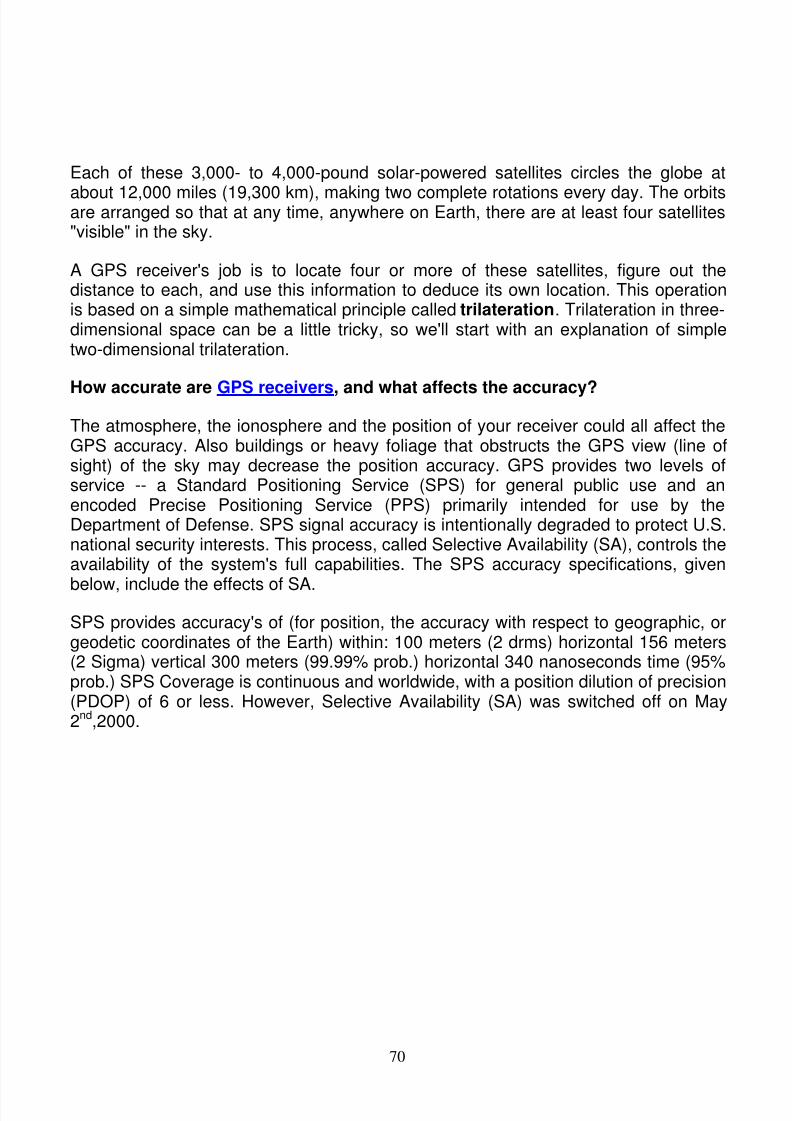
8/9/2019 FleetMgtSystem.pdf
http://slidepdf.com/reader/full/fleetmgtsystempdf 78/86
70
Each of these 3,000- to 4,000-pound solar-powered satellites circles the globe at
about 12,000 miles (19,300 km), making two complete rotations every day. The orbitsare arranged so that at any time, anywhere on Earth, there are at least four satellites"visible" in the sky.
A GPS receiver's job is to locate four or more of these satellites, figure out thedistance to each, and use this information to deduce its own location. This operationis based on a simple mathematical principle called trilateration. Trilateration in three-dimensional space can be a little tricky, so we'll start with an explanation of simpletwo-dimensional trilateration.
How accurate are GPS receivers, and what affects the accuracy?
The atmosphere, the ionosphere and the position of your receiver could all affect theGPS accuracy. Also buildings or heavy foliage that obstructs the GPS view (line ofsight) of the sky may decrease the position accuracy. GPS provides two levels ofservice -- a Standard Positioning Service (SPS) for general public use and anencoded Precise Positioning Service (PPS) primarily intended for use by theDepartment of Defense. SPS signal accuracy is intentionally degraded to protect U.S.national security interests. This process, called Selective Availability (SA), controls theavailability of the system's full capabilities. The SPS accuracy specifications, given
below, include the effects of SA.
SPS provides accuracy's of (for position, the accuracy with respect to geographic, orgeodetic coordinates of the Earth) within: 100 meters (2 drms) horizontal 156 meters(2 Sigma) vertical 300 meters (99.99% prob.) horizontal 340 nanoseconds time (95%prob.) SPS Coverage is continuous and worldwide, with a position dilution of precision(PDOP) of 6 or less. However, Selective Availability (SA) was switched off on May2nd,2000.

8/9/2019 FleetMgtSystem.pdf
http://slidepdf.com/reader/full/fleetmgtsystempdf 79/86
71
Appendix B
Comparative study between GPRS/ICS Based System and SMS Based System
In any vehicle tracking system, the communications infrastructure is crucial. This isbecause it is this that brings information back to central control. The GSMinfrastructure and in particular the GPRS/ICS (Generalized Packet Radio Service /
Internet Communications Services) function of GSM. This function allows mobilephone users to send Multimedia Messages (MMS) and to surf the Internet. This modeof communications because it gives the best priced versus communications speedand availability to the fleet managers.
GPRS/ICS Based System(Starfish)
SMS Based System
1. Streams location data backperiodically and when specialevents occur.
Location data is only sent back ondemand. Special events may triggera SMS message back to central.
2. Approximate cost only Rs.5.0for 10240 characters of data.
Approximate cost 50 Paisa –Rs.2.50 for a packet of 180characters of data.
3. A permanent virtual 48K bitsper second link ensuresimmediate data transfer.
Latency of varying periods for apacket of data to be transmitteddependant on the GSM systemload. Typically 15 seconds.
4. No limit on the amount of data
that can be transferred.
Limited to 180 characters per
packet. Longer data messages mustbe broken into multiple SMSmessages.
5. Data streaming means data isalready available in the controlcenter’s database when it isrequired.
A SMS must be sent to one or allvehicles and their response isrequired before their location isknown.
6. When the vehicle is parked inthe basement of a building andGPS and/or GSM signals are
no longer available, the lastpoint outside the building isavailable because of datastreaming. The system willknow that it is in a particularbuilding.
When the vehicle is parked in thebasement of a building and GPSand/or GSM signals are no longer
available, any SMS sent to requestfor location would get a negativeresponse or no response at all. Thevehicle is effectively “lost”.
Point 6 is a significant reason why SMS based systems are not suitable for FleetManagement, particularly when the fleet is concentrated in major cities where
vehicles are parked mainly in basement car parks.
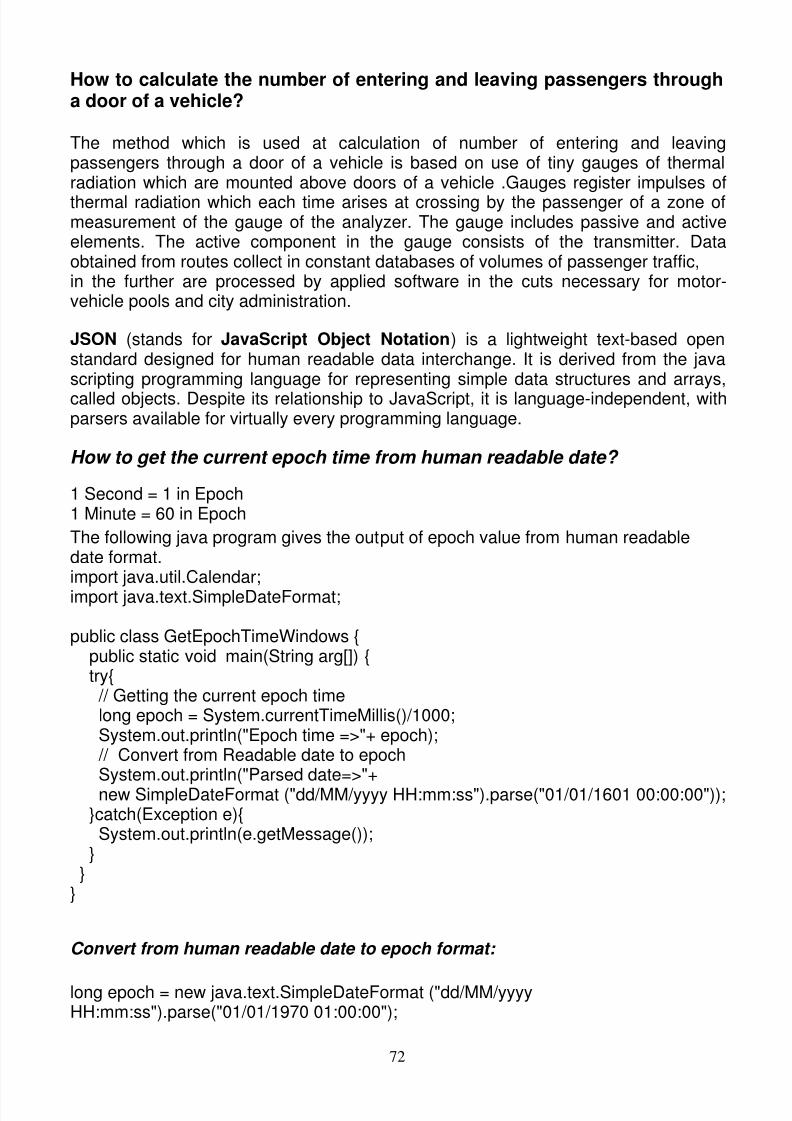
8/9/2019 FleetMgtSystem.pdf
http://slidepdf.com/reader/full/fleetmgtsystempdf 80/86
72
How to calculate the number of entering and leaving passengers througha door of a vehicle?
The method which is used at calculation of number of entering and leavingpassengers through a door of a vehicle is based on use of tiny gauges of thermalradiation which are mounted above doors of a vehicle .Gauges register impulses ofthermal radiation which each time arises at crossing by the passenger of a zone ofmeasurement of the gauge of the analyzer. The gauge includes passive and activeelements. The active component in the gauge consists of the transmitter. Dataobtained from routes collect in constant databases of volumes of passenger traffic,in the further are processed by applied software in the cuts necessary for motor-vehicle pools and city administration.
JSON (stands for JavaScript Object Notation) is a lightweight text-based openstandard designed for human readable data interchange. It is derived from the javascripting programming language for representing simple data structures and arrays,called objects. Despite its relationship to JavaScript, it is language-independent, withparsers available for virtually every programming language.
How to get the current epoch time from human readable date?
1 Second = 1 in Epoch1 Minute = 60 in Epoch
The following java program gives the output of epoch value from human readabledate format.import java.util.Calendar;import java.text.SimpleDateFormat;
public class GetEpochTimeWindows {public static void main(String arg[]) {try{ // Getting the current epoch timelong epoch = System.currentTimeMillis()/1000;System.out.println("Epoch time =>"+ epoch); // Convert from Readable date to epochSystem.out.println("Parsed date=>"+new SimpleDateFormat ("dd/MM/yyyy HH:mm:ss").parse("01/01/1601 00:00:00"));
}catch(Exception e){System.out.println(e.getMessage());
} }
}
Convert from human readable date to epoch format:
long epoch = new java.text.SimpleDateFormat ("dd/MM/yyyyHH:mm:ss").parse("01/01/1970 01:00:00");

8/9/2019 FleetMgtSystem.pdf
http://slidepdf.com/reader/full/fleetmgtsystempdf 81/86
73
Appendix C
Super Admin:
The developer/ owner of the software with all privileges. They can create, delete
accounts with expiration times etc.
Account:
Owner of the account (usually the transport head of an organization).He has overall privileges (ACLs) of administering his account except for changingaccount ID, expiration date, contact info, service agreement and billing information.
User:
An account owner can create several users for the account. The administrativeprivileges (ACLs) for the user are determined by the account owner, either byassigning a role to the user or directly modifying the permissions (ACLs) of the user tovarious functionalities in the application.A user can’t however change his user id and contact information, which can only beset by the account owner.A user id is unique for an account but can be same across different accounts.Among the various permissions given to the user, permissions to view/edit devicesare a critical one. The way a user is given permission to a device is through a device
group. A user can be assigned one and only one device group and he haspermissions (ACL’s) to view or edit all the devices under that device group (?)
Device:
It is the vehicle tracking hardware and is used to represent the car/ vehicle to which itis attached.A new device can be added (mandatory fields- device ID and device unique ID; theunique ID would be created from the IMEI number by prefixing the device type) to theaccount by the owner or a user with suitable privileges (ACL). -> for the time being.
An existing device can be edited but the device ID and unique ID cannot be changedonce it has been created.A device unique ID has to be unique across all devices under all accounts (?). Adevice ID needs to be unique across all devices under the same account

8/9/2019 FleetMgtSystem.pdf
http://slidepdf.com/reader/full/fleetmgtsystempdf 82/86
74
Device Group:
This represents a functional grouping of various devices under an account. If nogroup is defined for the account, the default group is ‘all’.A group can be created by the account owner or a user (based on their ACL’s). GroupID has to be unique for a particular account and cannot be changed once created.Each device is related by a ‘many to many’ relationship to a device group as
determined by the account owner or user with suitable ACL’s i.e. a device group canhave many devices and some of thee devices of one group may also be a part ofother device groups.NOTE: Apart from the defined groups, ‘all’ is also a device group that contains alldevices under that account.
Way Point:
It is also known as a Point of Interest (POI). It is actually a circle defined by its centerand radius.
Several waypoints can be created for an account (by the owner or user with suitableACL’s).The waypoint ids need to be unique for that account (and also unique from thegeofence id defined for that account).Each waypoint is assigned to a vehicle (by a user/ account having write/edit ACL forthat vehicle) by a ‘many to many’ relationship i.e. a way point can be assigned to oneor many devices and more than one such way point can be assigned to the samedevice.Assignment of a waypoint to a device also implicitly includes the rules for which a waypoint violation will be recorded for that device
Geo-fence:
It is a rectangle, defined by the 2 vertices of its SW-NE diagonal.Each account can have several geo-fences defined for it but each device can haveonly one geo-fence assigned to it (a hardware feature)
Alarm Rule:
It would allow the user to create complex rules to generate alarms for various
conditions/values of the inputs (attached to a device)The user would also be able to define the mode of delivery of the alarm (e.g. email,sms, and account notification)Users with proper ACL’s can create, edit or view the rulesUsers can then assign one or more rules in the account to a device/ group (to whichhe has edit ACL’s)The Alarm Rule ID is unique for an account

8/9/2019 FleetMgtSystem.pdf
http://slidepdf.com/reader/full/fleetmgtsystempdf 83/86
75
ACL:
An ACL defines the access level for a particular feature or page.Access levels could be none, read/ view, write/ edit, create/ delete (or all).The ACL for a feature/ page assigned to a user (or account) determines what thatuser (or account) can do with that feature/ page.
Real-time Tracking: Users can watch their vehicles moving in real-time in the onlinemap. The application should dynamically trace out the route being traversed and alsoshow valuable information like distance covered and instantaneous speed. The mapswould be automatically updated every time there is new location information in thedatabase
Geo-Fences: There will be a UI to create a geo-fence, which can then beuploaded remotely to the hardware. This (hardware) feature will generate
alerts whenever the vehicle enters or leaves the designated geographical area(as defined by the user)
Way-Points: A UI to define circular areas (point + radius) on maps would benecessary for this. This feature would allow the user to configure points alongthe route that the vehicle must travel to, and receive alerts on arrival anddeparture from these points. (This feature can be used to know what part ofthe journey and in what time frame has been accomplished by the vehicle orfor example to set up arrival notification if the vehicle is x km away from awarehouse etc.)
Alarm Settings: There will be a UI to define logic to generate alarms whencertain criteria are met (e.g. if doors are opened, temperature reaches a maxvalue, vehicle crosses a state boundary, speed exceeds a certain value etc)
Remote Control: Ability to issue commands to the vehicle from the webinterface (e.g. open/ close doors, shut of engine ignition, turn on blinkers/horns etc)
Geocoding
Geocoding is the process of converting addresses (like "1600 Amphitheatre Parkway,Mountain View, CA") into geographic coordinates (like latitude 37.423021 andlongitude -122.083739), which you can use to place markers or position the map. TheGoogle Maps API includes a Geocoding service that can be accessed directly via anHTTP request or by using a GClientGeocoder object. The Google Maps API providesa client geocoder for geocoding addresses dynamically from user input.
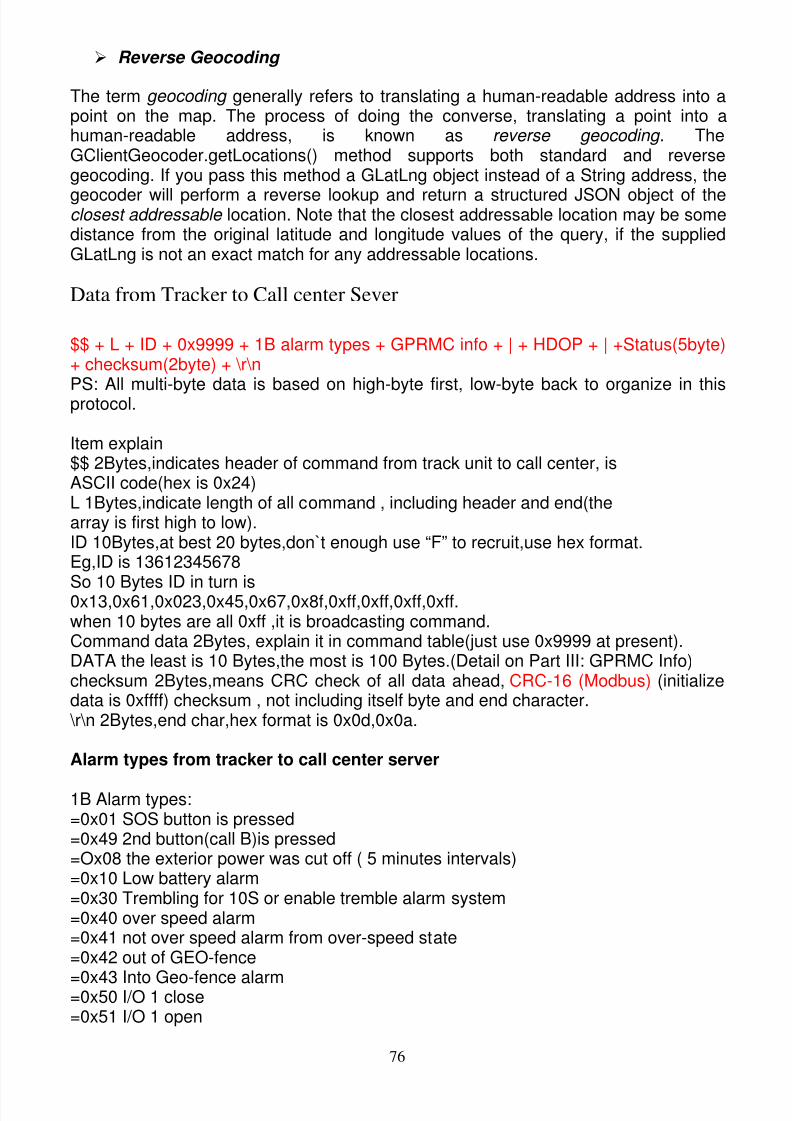
8/9/2019 FleetMgtSystem.pdf
http://slidepdf.com/reader/full/fleetmgtsystempdf 84/86
76
Reverse Geocoding
The term geocoding generally refers to translating a human-readable address into apoint on the map. The process of doing the converse, translating a point into ahuman-readable address, is known as reverse geocoding . TheGClientGeocoder.getLocations() method supports both standard and reversegeocoding. If you pass this method a GLatLng object instead of a String address, the
geocoder will perform a reverse lookup and return a structured JSON object of theclosest addressable location. Note that the closest addressable location may be somedistance from the original latitude and longitude values of the query, if the suppliedGLatLng is not an exact match for any addressable locations.
Data from Tracker to Call center Sever
$$ + L + ID + 0x9999 + 1B alarm types + GPRMC info + | + HDOP + | +Status(5byte)+ checksum(2byte) + \r\n
PS: All multi-byte data is based on high-byte first, low-byte back to organize in thisprotocol.
Item explain$$ 2Bytes,indicates header of command from track unit to call center, isASCII code(hex is 0x24)L 1Bytes,indicate length of all command , including header and end(thearray is first high to low).ID 10Bytes,at best 20 bytes,don`t enough use “F” to recruit,use hex format.Eg,ID is 13612345678
So 10 Bytes ID in turn is0x13,0x61,0x023,0x45,0x67,0x8f,0xff,0xff,0xff,0xff.when 10 bytes are all 0xff ,it is broadcasting command.Command data 2Bytes, explain it in command table(just use 0x9999 at present).DATA the least is 10 Bytes,the most is 100 Bytes.(Detail on Part III: GPRMC Info)checksum 2Bytes,means CRC check of all data ahead, CRC-16 (Modbus) (initializedata is 0xffff) checksum , not including itself byte and end character. \r\n 2Bytes,end char,hex format is 0x0d,0x0a.
Alarm types from tracker to call center server
1B Alarm types:=0x01 SOS button is pressed=0x49 2nd button(call B)is pressed=Ox08 the exterior power was cut off ( 5 minutes intervals)=0x10 Low battery alarm=0x30 Trembling for 10S or enable tremble alarm system=0x40 over speed alarm=0x41 not over speed alarm from over-speed state=0x42 out of GEO-fence
=0x43 Into Geo-fence alarm=0x50 I/O 1 close=0x51 I/O 1 open

8/9/2019 FleetMgtSystem.pdf
http://slidepdf.com/reader/full/fleetmgtsystempdf 85/86

8/9/2019 FleetMgtSystem.pdf
http://slidepdf.com/reader/full/fleetmgtsystempdf 86/86
Reference:
[1] MySQL AB. MySQL Documentation, Available: http://dev.mysql.com/doc/
[2] MySql AB Casestudies. Available: http://www.mysql.com/whymysql/casestudies/mysql_cs_utel_en.pdf
[3] Movable Type Scripts. Calculate distance, bearing and more between twoLatitude/Longitude points, Available:http://www.movable-type.co.uk/ scripts/latlong.html
[4] www.cmcltd.com/case_studies/transportation/GPS_System_Case_Study_DTC.pdf
[5] IEEE Xplore - Vehicle Location and Fleet Management Systems
[6] "How GPS Receivers Work" Global Positioning System - Wikipedia, the free
Encyclopedia
[7] GPS Tracking: Open-Source GPS Tracking System - OpenGTS Google Accounts /mail/?hl=en&shva=1#drafts/128a135f9f439189
[8] Heuristic Algorithms for Siting Alternative-Fuel Stations Using theFlow-Refueling Location Model, European Journal of Operational Research (2009)
[9] Intelligent Vehicle and Transport Systems www.hiltechdevelopments.com
[10] GIS Development. 2004. GPS technology to find place in London buses[Online], Accessed:http://www.gisdevelopment.net/news/viewn.asp?id=GIS:N_vsmkrtbz [2004 August]


