Five Year Trends - Maricopa County, Arizona
56
Prepared by the Maricopa County Department of Public Health Office of Epidemiology July. 2015 Maricopa County Five Year Trends Reference Tables Maricopa County Health Status Report 2009-2013
Transcript of Five Year Trends - Maricopa County, Arizona
Prepared by the Maricopa County Department of Public Health Office of Epidemiology July. 2015
Maricopa County
Five Year Trends Reference Tables
Maricopa County Health Status Report
2009-2013
Acknowledgements
This report was prepared by the Maricopa County Department of Public Health, Disease Control Division, Office of Epidemiology:
Hovi Nguyen, MPH, Epidemiologist Keely Muertos, MPH, Return on Investment Epidemiologist Kyle Gardner, MSPH, CHES, Epidemiologist Lia Koski, MPH, Epidemiologist Jackie Ward, MS, Epidemiology Supervisor Kate Goodin, MPH, Epidemiology and Data Services Program Manager Rebecca Sunenshine, MD, Medical Director & Administrator of Disease Control Division
The authors wish to thank the following individuals and organizations for contributing numeric data, consultation, and other information used in this report. Their assistance is appreciated.
Maricopa County Department of Public Health, Disease Control Division, Office of Epidemiology:
Carrie Walker, MPH Denise Lopez, BS, BA Jigna Narang, MPH Melissa Kretschmer, MPH Ron Klein, RN
Maricopa County Department of Public Health, Division of Clinical Services: Tom Mickey, STD/HIV Program Manager Angelito Bravo, Refugee Program Manager Matthew Parker, Epidemiologist
Arizona Department of Health Services: Julia Skinner, Capacity Building Epidemiologist, Bureau of Epidemiology and
Disease Control Donna Courtney, Program Administrator, Bureau of Public Health Statistics Teresa Jue, Electronic Disease Surveillance Epidemiologist, Bureau of
Epidemiology and Disease Control Jonathan Gonzales, HIV Epidemiologist, Bureau of Epidemiology and Disease
Control Judy Bass, AZ BRFSS Coordinator, Bureau of Public Health Statistics James Blackwell, Public Health Statistics Epidemiologist, Bureau of Public Health
Statistics S. Robert Bailey, Acting Bureau Chief, Bureau of Public Health Statistics
For additional copies of this report, please call the Maricopa County Department of Public Health, Office of Epidemiology at 602.372.2605. This report may also be found at
http://www.maricopa.gov/publichealth/Services/EPI/Reports/ under “Health Status
Reports.”
Permission to quote or reproduce materials from this report is granted when due acknowledgement is made. Suggested citation: Maricopa County Department of Public Health, Office of Epidemiology. Maricopa County Health Status Report 2009-2013, Five Year Trends: Reference Tables. Phoenix (AZ): 2015.

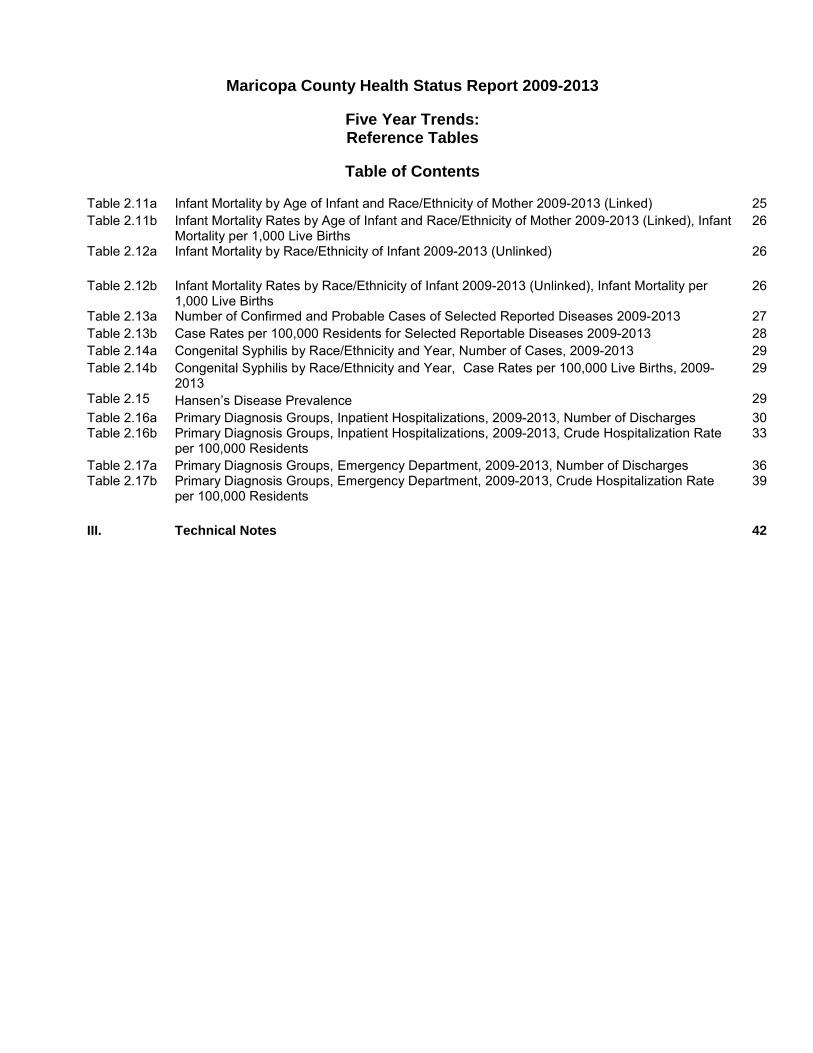
Maricopa County Health Status Report 2009-2013
Five Year Trends: Reference Tables
Table of Contents
Introduction 1
I. Maricopa County Population Statistics – 2009-2013 Tables 2
Table 1.01 Population Estimates – Age by Gender, Race/Ethnicity by Gender, and Age by Race/Ethnicity 2013 3
Table 1.02 Population Estimates by Gender, Age, and Race/Ethnicity, 2013 4 Table 1.03 Population Estimates – Age by Gender, Race/Ethnicity by Gender, and Age by Race/Ethnicity
2012 5
Table 1.04 Population Estimates by Gender, Age, and Race/Ethnicity, 2012 6 Table 1.05 Population Estimates – Age by Gender, Race/Ethnicity by Gender, and Age by Race/Ethnicity
2011 7
Table 1.06 Population Estimates by Gender, Age, and Race/Ethnicity, 2011 8 Table 1.07 Population Estimates - Age by Gender, Race/Ethnicity by Gender, and Age by Race/Ethnicity
2010 9
Table 1.08 Population Estimates by Gender, Age, and Race/Ethnicity, 2010 10 Table 1.09 Population Estimates- Age by Gender, Race/Ethnicity by Gender, and Age by Race/Ethnicity
2009 11
Table 1.10 Population Estimates by Gender, Age, and Race/Ethnicity, 2009 12
Table 1.11 Maricopa County, Phoenix, and Arizona Population 1980-2013 13
II. Maricopa County Five-Year Health Trends 14
Table 2.01a Selected Underlying Causes of Death 2009-2013, Number of Deaths 15
Table 2.01b Selected Underlying Causes of Death 2009-2013, Crude Death Rate per 100,000 Residents 16
Table 2.02a Other Selected Underlying Causes of Death 2009-2013, Number of Deaths 17
Table 2.02b Other Selected Underlying Causes of Death 2009-2013, Crude Death Rate per 100,000 Residents
18
Table 2.03a Firearm, Drug, and Alcohol Induced and Related Deaths 2009-2013, Number of Deaths 19
Table 2.03b Firearm, Drug, and Alcohol Induced and Related Deaths 2009-2013, Crude Death Rate per 100,000 Residents
19
Table 2.04a Selected Maternal & Child Health Indicators, 2009-2013 20
Table 2.04b Selected Maternal & Child Health Indicator Percentages, 2009-2013 21
Table 2.05 Number of Births by Maternal Indicators for Infant Mortality Rate 2009-2013 22
Table 2.06a Infant Mortality by Race/Ethnicity of Mother, 2009-2013 (Linked) 22
Table 2.06b Infant Mortality Rates by Race/Ethnicity of Mother, 2009-2013 (Linked), Infant Mortality per 1,000 Live Births
22
Table 2.07a Infant Mortality by Age of Mother 2009-2013 (Linked) 23
Table 2.07b Infant Mortality Rates by Age of Mother 2009-2013 (Linked), Infant Mortality per 1,000 Live Births
23
Table 2.08a Infant Mortality by Educational Level of Mother 2009-2013 (Linked) 23
Table 2.08b Infant Mortality Rates by Educational Level of Mother 2009-2013 (Linked), Infant Mortality per 1,000 Live Births
23
Table 2.09a Infant Mortality by Birth weight 2009-2013 (Linked) 24
Table 2.09b Infant Mortality Rates by Birth weight 2009-2013 (Linked), Infant Mortality per 1,000 Live Births 24
Table 2.10 Infant Mortality and Rates by Age of Infant 2009-2013 (Linked & Unlinked) 25
Maricopa County Health Status Report 2009-2013
Five Year Trends: Reference Tables
Table of Contents
Table 2.11a Infant Mortality by Age of Infant and Race/Ethnicity of Mother 2009-2013 (Linked) 25
Table 2.11b Infant Mortality Rates by Age of Infant and Race/Ethnicity of Mother 2009-2013 (Linked), Infant Mortality per 1,000 Live Births
26
Table 2.12a Infant Mortality by Race/Ethnicity of Infant 2009-2013 (Unlinked) 26
Table 2.12b Infant Mortality Rates by Race/Ethnicity of Infant 2009-2013 (Unlinked), Infant Mortality per 1,000 Live Births
26
Table 2.13a Number of Confirmed and Probable Cases of Selected Reported Diseases 2009-2013 27
Table 2.13b Case Rates per 100,000 Residents for Selected Reportable Diseases 2009-2013 28
Table 2.14a Congenital Syphilis by Race/Ethnicity and Year, Number of Cases, 2009-2013 29
Table 2.14b Congenital Syphilis by Race/Ethnicity and Year, Case Rates per 100,000 Live Births, 2009-2013
29
Table 2.15 Hansen’s Disease Prevalence 29
Table 2.16a Primary Diagnosis Groups, Inpatient Hospitalizations, 2009-2013, Number of Discharges 30 Table 2.16b Primary Diagnosis Groups, Inpatient Hospitalizations, 2009-2013, Crude Hospitalization Rate
per 100,000 Residents 33
Table 2.17a Primary Diagnosis Groups, Emergency Department, 2009-2013, Number of Discharges 36 Table 2.17b Primary Diagnosis Groups, Emergency Department, 2009-2013, Crude Hospitalization Rate
per 100,000 Residents 39
III. Technical Notes 42
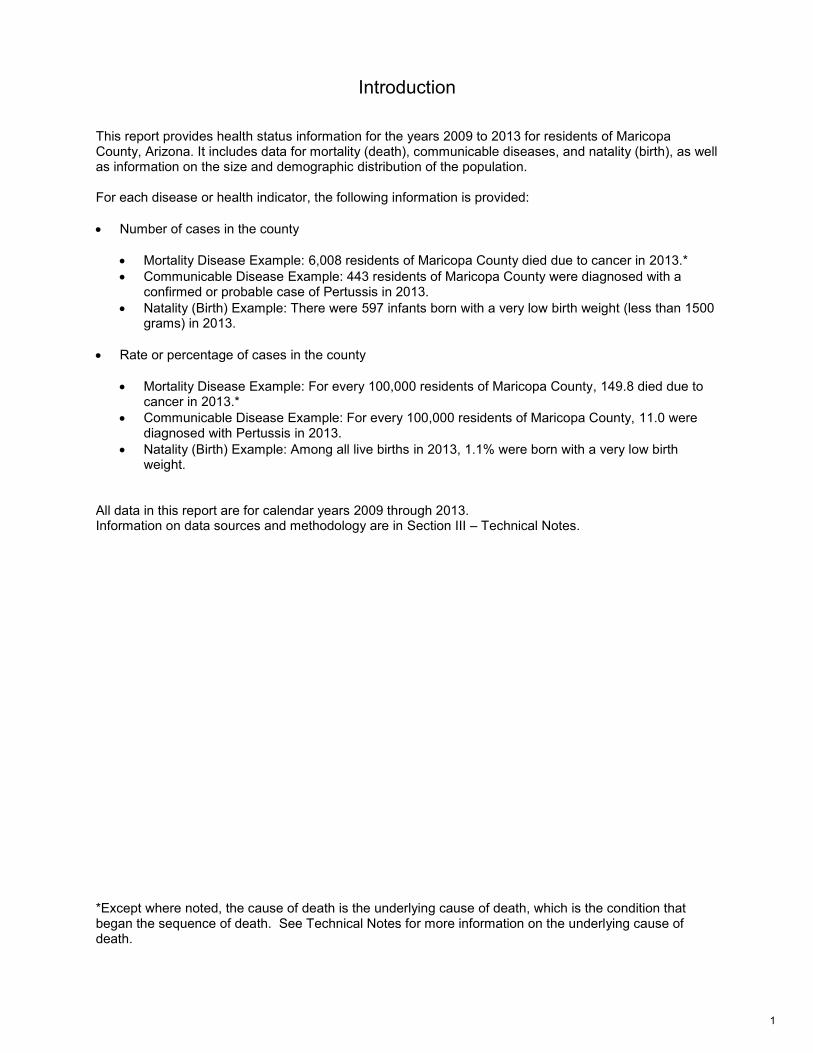
Introduction
This report provides health status information for the years 2009 to 2013 for residents of Maricopa County, Arizona. It includes data for mortality (death), communicable diseases, and natality (birth), as well as information on the size and demographic distribution of the population.
For each disease or health indicator, the following information is provided:
Number of cases in the county
Mortality Disease Example: 6,008 residents of Maricopa County died due to cancer in 2013.*
Communicable Disease Example: 443 residents of Maricopa County were diagnosed with aconfirmed or probable case of Pertussis in 2013.
Natality (Birth) Example: There were 597 infants born with a very low birth weight (less than 1500grams) in 2013.
Rate or percentage of cases in the county
Mortality Disease Example: For every 100,000 residents of Maricopa County, 149.8 died due tocancer in 2013.*
Communicable Disease Example: For every 100,000 residents of Maricopa County, 11.0 werediagnosed with Pertussis in 2013.
Natality (Birth) Example: Among all live births in 2013, 1.1% were born with a very low birthweight.
All data in this report are for calendar years 2009 through 2013. Information on data sources and methodology are in Section III – Technical Notes.
*Except where noted, the cause of death is the underlying cause of death, which is the condition thatbegan the sequence of death. See Technical Notes for more information on the underlying cause of death.
1

I. Maricopa County Population Statistics 2009-2013 Tables
2
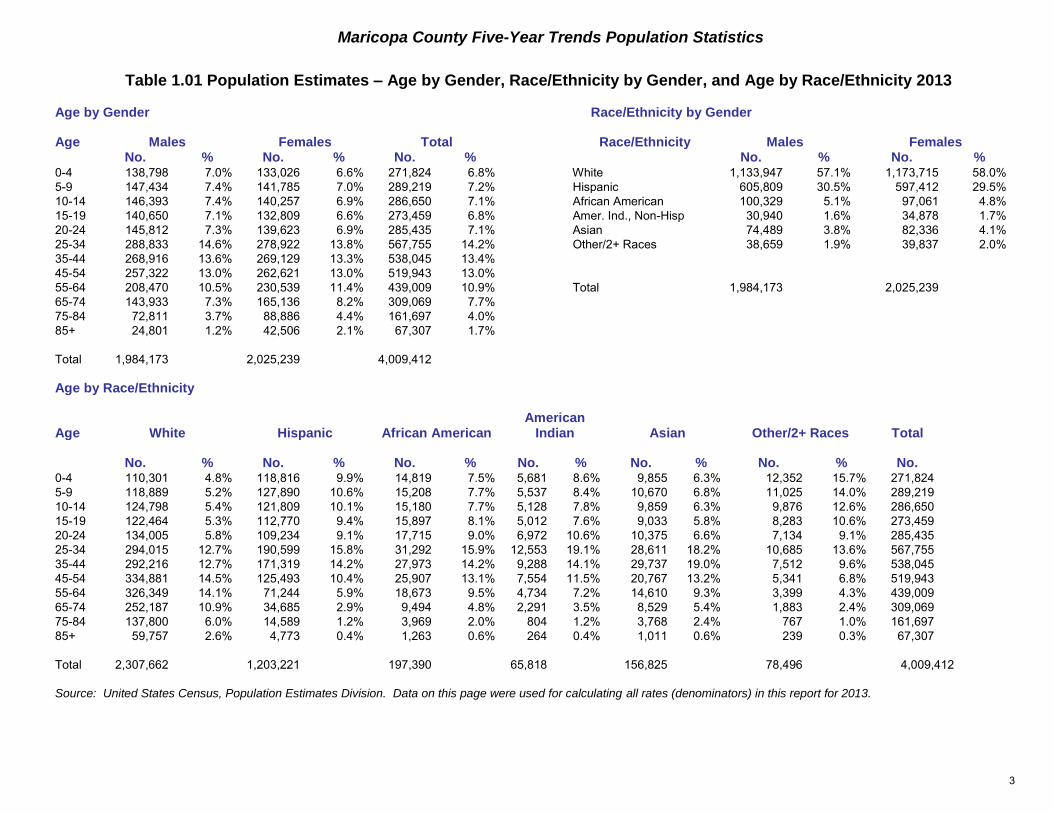
Maricopa County Five-Year Trends Population Statistics
Table 1.01 Population Estimates – Age by Gender, Race/Ethnicity by Gender, and Age by Race/Ethnicity 2013
Age by Gender Race/Ethnicity by Gender
Age Males Females Total Race/Ethnicity Males Females No. % No. % No. % No. % No. %
0-4 138,798 7.0% 133,026 6.6% 271,824 6.8% White 1,133,947 57.1% 1,173,715 58.0%
5-9 147,434 7.4% 141,785 7.0% 289,219 7.2% Hispanic 605,809 30.5% 597,412 29.5%
10-14 146,393 7.4% 140,257 6.9% 286,650 7.1% African American 100,329 5.1% 97,061 4.8%
15-19 140,650 7.1% 132,809 6.6% 273,459 6.8% Amer. Ind., Non-Hisp 30,940 1.6% 34,878 1.7%
20-24 145,812 7.3% 139,623 6.9% 285,435 7.1% Asian 74,489 3.8% 82,336 4.1%
25-34 288,833 14.6% 278,922 13.8% 567,755 14.2% Other/2+ Races 38,659 1.9% 39,837 2.0%
35-44 268,916 13.6% 269,129 13.3% 538,045 13.4%
45-54 257,322 13.0% 262,621 13.0% 519,943 13.0%
55-64 208,470 10.5% 230,539 11.4% 439,009 10.9% Total 1,984,173 2,025,239
65-74 143,933 7.3% 165,136 8.2% 309,069 7.7%
75-84 72,811 3.7% 88,886 4.4% 161,697 4.0%
85+ 24,801 1.2% 42,506 2.1% 67,307 1.7%
Total 1,984,173 2,025,239 4,009,412
Age by Race/Ethnicity
Age White Hispanic African American American
Indian Asian Other/2+ Races Total
No. % No. % No. % No. % No. % No. % No. 0-4 110,301 4.8% 118,816 9.9% 14,819 7.5% 5,681 8.6% 9,855 6.3% 12,352 15.7% 271,824
5-9 118,889 5.2% 127,890 10.6% 15,208 7.7% 5,537 8.4% 10,670 6.8% 11,025 14.0% 289,219
10-14 124,798 5.4% 121,809 10.1% 15,180 7.7% 5,128 7.8% 9,859 6.3% 9,876 12.6% 286,650
15-19 122,464 5.3% 112,770 9.4% 15,897 8.1% 5,012 7.6% 9,033 5.8% 8,283 10.6% 273,459
20-24 134,005 5.8% 109,234 9.1% 17,715 9.0% 6,972 10.6% 10,375 6.6% 7,134 9.1% 285,435
25-34 294,015 12.7% 190,599 15.8% 31,292 15.9% 12,553 19.1% 28,611 18.2% 10,685 13.6% 567,755
35-44 292,216 12.7% 171,319 14.2% 27,973 14.2% 9,288 14.1% 29,737 19.0% 7,512 9.6% 538,045
45-54 334,881 14.5% 125,493 10.4% 25,907 13.1% 7,554 11.5% 20,767 13.2% 5,341 6.8% 519,943
55-64 326,349 14.1% 71,244 5.9% 18,673 9.5% 4,734 7.2% 14,610 9.3% 3,399 4.3% 439,009
65-74 252,187 10.9% 34,685 2.9% 9,494 4.8% 2,291 3.5% 8,529 5.4% 1,883 2.4% 309,069
75-84 137,800 6.0% 14,589 1.2% 3,969 2.0% 804 1.2% 3,768 2.4% 767 1.0% 161,697
85+ 59,757 2.6% 4,773 0.4% 1,263 0.6% 264 0.4% 1,011 0.6% 239 0.3% 67,307
Total 2,307,662 1,203,221 197,390 65,818 156,825 78,496 4,009,412
Source: United States Census, Population Estimates Division. Data on this page were used for calculating all rates (denominators) in this report for 2013.
3
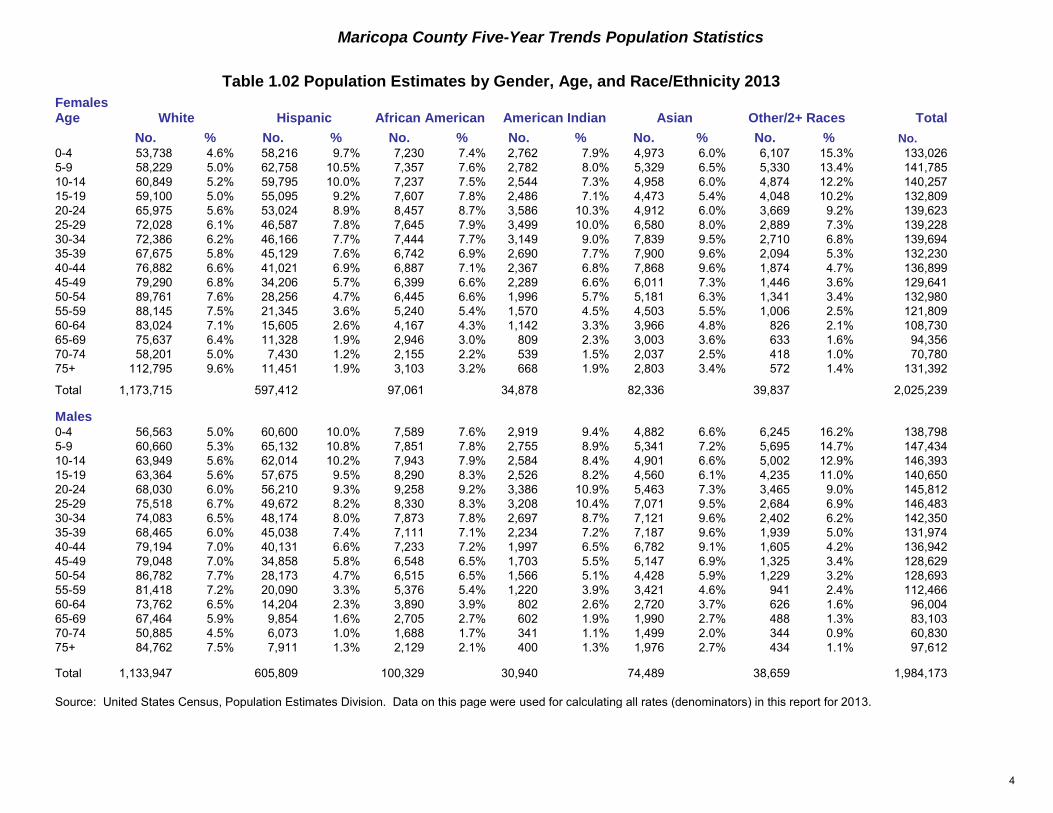
Maricopa County Five-Year Trends Population Statistics
Table 1.02 Population Estimates by Gender, Age, and Race/Ethnicity 2013
Females Age White Hispanic African American American Indian Asian Other/2+ Races Total
No. % No. % No. % No. % No. % No. % No.
0-4 53,738 4.6% 58,216 9.7% 7,230 7.4% 2,762 7.9% 4,973 6.0% 6,107 15.3% 133,026
5-9 58,229 5.0% 62,758 10.5% 7,357 7.6% 2,782 8.0% 5,329 6.5% 5,330 13.4% 141,785
10-14 60,849 5.2% 59,795 10.0% 7,237 7.5% 2,544 7.3% 4,958 6.0% 4,874 12.2% 140,257
15-19 59,100 5.0% 55,095 9.2% 7,607 7.8% 2,486 7.1% 4,473 5.4% 4,048 10.2% 132,809
20-24 65,975 5.6% 53,024 8.9% 8,457 8.7% 3,586 10.3% 4,912 6.0% 3,669 9.2% 139,623
25-29 72,028 6.1% 46,587 7.8% 7,645 7.9% 3,499 10.0% 6,580 8.0% 2,889 7.3% 139,228
30-34 72,386 6.2% 46,166 7.7% 7,444 7.7% 3,149 9.0% 7,839 9.5% 2,710 6.8% 139,694
35-39 67,675 5.8% 45,129 7.6% 6,742 6.9% 2,690 7.7% 7,900 9.6% 2,094 5.3% 132,230
40-44 76,882 6.6% 41,021 6.9% 6,887 7.1% 2,367 6.8% 7,868 9.6% 1,874 4.7% 136,899
45-49 79,290 6.8% 34,206 5.7% 6,399 6.6% 2,289 6.6% 6,011 7.3% 1,446 3.6% 129,641
50-54 89,761 7.6% 28,256 4.7% 6,445 6.6% 1,996 5.7% 5,181 6.3% 1,341 3.4% 132,980
55-59 88,145 7.5% 21,345 3.6% 5,240 5.4% 1,570 4.5% 4,503 5.5% 1,006 2.5% 121,809
60-64 83,024 7.1% 15,605 2.6% 4,167 4.3% 1,142 3.3% 3,966 4.8% 826 2.1% 108,730
65-69 75,637 6.4% 11,328 1.9% 2,946 3.0% 809 2.3% 3,003 3.6% 633 1.6% 94,356
70-74 58,201 5.0% 7,430 1.2% 2,155 2.2% 539 1.5% 2,037 2.5% 418 1.0% 70,780
75+ 112,795 9.6% 11,451 1.9% 3,103 3.2% 668 1.9% 2,803 3.4% 572 1.4% 131,392
Total 1,173,715 597,412 97,061 34,878 82,336 39,837 2,025,239
Males
0-4 56,563 5.0% 60,600 10.0% 7,589 7.6% 2,919 9.4% 4,882 6.6% 6,245 16.2% 138,798
5-9 60,660 5.3% 65,132 10.8% 7,851 7.8% 2,755 8.9% 5,341 7.2% 5,695 14.7% 147,434
10-14 63,949 5.6% 62,014 10.2% 7,943 7.9% 2,584 8.4% 4,901 6.6% 5,002 12.9% 146,393
15-19 63,364 5.6% 57,675 9.5% 8,290 8.3% 2,526 8.2% 4,560 6.1% 4,235 11.0% 140,650
20-24 68,030 6.0% 56,210 9.3% 9,258 9.2% 3,386 10.9% 5,463 7.3% 3,465 9.0% 145,812
25-29 75,518 6.7% 49,672 8.2% 8,330 8.3% 3,208 10.4% 7,071 9.5% 2,684 6.9% 146,483
30-34 74,083 6.5% 48,174 8.0% 7,873 7.8% 2,697 8.7% 7,121 9.6% 2,402 6.2% 142,350
35-39 68,465 6.0% 45,038 7.4% 7,111 7.1% 2,234 7.2% 7,187 9.6% 1,939 5.0% 131,974
40-44 79,194 7.0% 40,131 6.6% 7,233 7.2% 1,997 6.5% 6,782 9.1% 1,605 4.2% 136,942
45-49 79,048 7.0% 34,858 5.8% 6,548 6.5% 1,703 5.5% 5,147 6.9% 1,325 3.4% 128,629
50-54 86,782 7.7% 28,173 4.7% 6,515 6.5% 1,566 5.1% 4,428 5.9% 1,229 3.2% 128,693
55-59 81,418 7.2% 20,090 3.3% 5,376 5.4% 1,220 3.9% 3,421 4.6% 941 2.4% 112,466
60-64 73,762 6.5% 14,204 2.3% 3,890 3.9% 802 2.6% 2,720 3.7% 626 1.6% 96,004
65-69 67,464 5.9% 9,854 1.6% 2,705 2.7% 602 1.9% 1,990 2.7% 488 1.3% 83,103
70-74 50,885 4.5% 6,073 1.0% 1,688 1.7% 341 1.1% 1,499 2.0% 344 0.9% 60,830
75+ 84,762 7.5% 7,911 1.3% 2,129 2.1% 400 1.3% 1,976 2.7% 434 1.1% 97,612
Total 1,133,947 605,809 100,329 30,940 74,489 38,659 1,984,173
Source: United States Census, Population Estimates Division. Data on this page were used for calculating all rates (denominators) in this report for 2013.
4
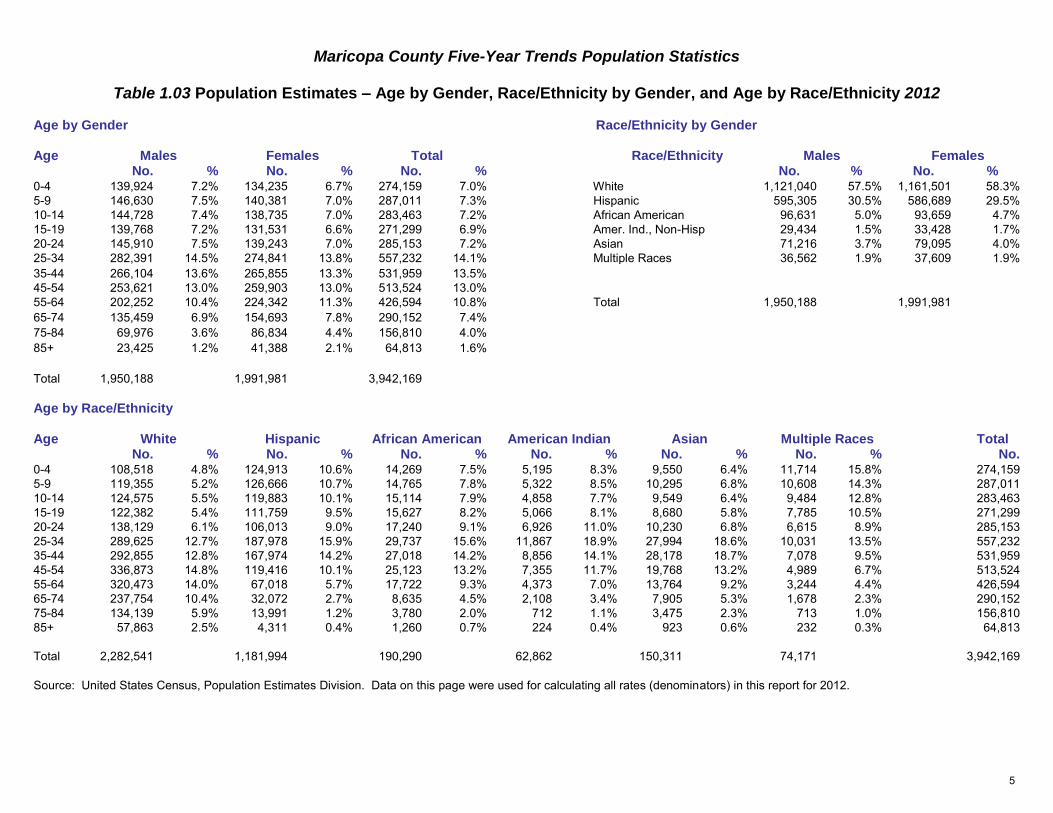
Maricopa County Five-Year Trends Population Statistics
Table 1.03 Population Estimates – Age by Gender, Race/Ethnicity by Gender, and Age by Race/Ethnicity 2012
Age by Gender Race/Ethnicity by Gender
Age Males Females Total Race/Ethnicity Males Females No. % No. % No. % No. % No. %
0-4 139,924 7.2% 134,235 6.7% 274,159 7.0% White 1,121,040 57.5% 1,161,501 58.3%
5-9 146,630 7.5% 140,381 7.0% 287,011 7.3% Hispanic 595,305 30.5% 586,689 29.5%
10-14 144,728 7.4% 138,735 7.0% 283,463 7.2% African American 96,631 5.0% 93,659 4.7%
15-19 139,768 7.2% 131,531 6.6% 271,299 6.9% Amer. Ind., Non-Hisp 29,434 1.5% 33,428 1.7%
20-24 145,910 7.5% 139,243 7.0% 285,153 7.2% Asian 71,216 3.7% 79,095 4.0%
25-34 282,391 14.5% 274,841 13.8% 557,232 14.1% Multiple Races 36,562 1.9% 37,609 1.9%
35-44 266,104 13.6% 265,855 13.3% 531,959 13.5%
45-54 253,621 13.0% 259,903 13.0% 513,524 13.0%
55-64 202,252 10.4% 224,342 11.3% 426,594 10.8% Total 1,950,188 1,991,981
65-74 135,459 6.9% 154,693 7.8% 290,152 7.4%
75-84 69,976 3.6% 86,834 4.4% 156,810 4.0%
85+ 23,425 1.2% 41,388 2.1% 64,813 1.6%
Total 1,950,188 1,991,981 3,942,169
Age by Race/Ethnicity
Age White Hispanic African American American Indian Asian Multiple Races Total No. % No. % No. % No. % No. % No. % No.
0-4 108,518 4.8% 124,913 10.6% 14,269 7.5% 5,195 8.3% 9,550 6.4% 11,714 15.8% 274,159
5-9 119,355 5.2% 126,666 10.7% 14,765 7.8% 5,322 8.5% 10,295 6.8% 10,608 14.3% 287,011
10-14 124,575 5.5% 119,883 10.1% 15,114 7.9% 4,858 7.7% 9,549 6.4% 9,484 12.8% 283,463
15-19 122,382 5.4% 111,759 9.5% 15,627 8.2% 5,066 8.1% 8,680 5.8% 7,785 10.5% 271,299
20-24 138,129 6.1% 106,013 9.0% 17,240 9.1% 6,926 11.0% 10,230 6.8% 6,615 8.9% 285,153
25-34 289,625 12.7% 187,978 15.9% 29,737 15.6% 11,867 18.9% 27,994 18.6% 10,031 13.5% 557,232
35-44 292,855 12.8% 167,974 14.2% 27,018 14.2% 8,856 14.1% 28,178 18.7% 7,078 9.5% 531,959
45-54 336,873 14.8% 119,416 10.1% 25,123 13.2% 7,355 11.7% 19,768 13.2% 4,989 6.7% 513,524
55-64 320,473 14.0% 67,018 5.7% 17,722 9.3% 4,373 7.0% 13,764 9.2% 3,244 4.4% 426,594
65-74 237,754 10.4% 32,072 2.7% 8,635 4.5% 2,108 3.4% 7,905 5.3% 1,678 2.3% 290,152
75-84 134,139 5.9% 13,991 1.2% 3,780 2.0% 712 1.1% 3,475 2.3% 713 1.0% 156,810
85+ 57,863 2.5% 4,311 0.4% 1,260 0.7% 224 0.4% 923 0.6% 232 0.3% 64,813
Total 2,282,541 1,181,994 190,290 62,862 150,311 74,171 3,942,169
Source: United States Census, Population Estimates Division. Data on this page were used for calculating all rates (denominators) in this report for 2012.
5

Maricopa County Five-Year Trends Population Statistics
Table 1.04 Population Estimates by Gender, Age, and Race/Ethnicity, 2012
Females Age White Hispanic African American American Indian Asian Multiple Races Total
Non-Hispanic Hispanic No. % No. % No. % No. % No. % No. % No. % No.
0-4 53,063 4.6% 58,728 10.4% 6,897 7.4% 2,591 7.8% 2,429 11.9% 4,740 6.0% 5,787 15.4% 134,235
5-9 58,142 5.0% 59,834 10.6% 7,161 7.6% 2,679 8.0% 2,324 11.4% 5,116 6.5% 5,125 13.6% 140,381
10-14 60,730 5.2% 56,757 10.0% 7,270 7.8% 2,358 7.1% 2,122 10.4% 4,810 6.1% 4,688 12.5% 138,735
15-19 58,943 5.1% 52,426 9.3% 7,591 8.1% 2,522 7.5% 1,982 9.7% 4,245 5.4% 3,822 10.2% 131,531
20-24 67,942 5.8% 49,294 8.7% 8,117 8.7% 3,572 10.7% 2,133 10.4% 4,816 6.1% 3,369 9.0% 139,243
25-29 71,829 6.2% 44,158 7.8% 7,222 7.7% 3,372 10.1% 1,731 8.5% 6,624 8.4% 2,815 7.5% 137,751
30-34 70,932 6.1% 44,173 7.8% 7,128 7.6% 3,033 9.1% 1,593 7.8% 7,757 9.8% 2,474 6.6% 137,090
35-39 67,208 5.8% 43,210 7.6% 6,552 7.0% 2,537 7.6% 1,376 6.7% 7,682 9.7% 2,005 5.3% 130,570
40-44 77,358 6.7% 38,737 6.8% 6,574 7.0% 2,251 6.7% 1,214 5.9% 7,453 9.4% 1,698 4.5% 135,285
45-49 81,321 7.0% 31,631 5.6% 6,249 6.7% 2,238 6.7% 1,033 5.1% 5,643 7.1% 1,406 3.7% 129,521
50-54 89,221 7.7% 25,851 4.6% 6,289 6.7% 1,940 5.8% 894 4.4% 4,995 6.3% 1,192 3.2% 130,382
55-59 85,782 7.4% 19,522 3.4% 4,899 5.2% 1,431 4.3% 614 3.0% 4,304 5.4% 987 2.6% 117,539
60-64 82,548 7.1% 14,262 2.5% 4,030 4.3% 1,087 3.3% 379 1.9% 3,715 4.7% 782 2.1% 106,803
65-69 72,121 6.2% 10,210 1.8% 2,656 2.8% 751 2.2% 255 1.2% 2,719 3.4% 563 1.5% 89,275
70-74 53,801 4.6% 6,760 1.2% 1,978 2.1% 493 1.5% 156 0.8% 1,870 2.4% 360 1.0% 65,418
75+ 110,560 9.5% 10,686 1.9% 3,046 3.3% 573 1.7% 215 1.1% 2,606 3.3% 536 1.4% 128,222
Total 1,161,501 566,239 93,659 33,428 20,450 79,095 37,609 1,991,981
Males
0-4 55,455 4.9% 61,232 10.7% 7,372 7.6% 2,604 8.8% 2,524 11.7% 4,810 6.8% 5,927 16.2% 139,924
5-9 61,213 5.5% 62,061 10.8% 7,604 7.9% 2,643 9.0% 2,447 11.4% 5,179 7.3% 5,483 15.0% 146,630
10-14 63,845 5.7% 58,901 10.3% 7,844 8.1% 2,500 8.5% 2,103 9.8% 4,739 6.7% 4,796 13.1% 144,728
15-19 63,439 5.7% 55,283 9.6% 8,036 8.3% 2,544 8.6% 2,068 9.6% 4,435 6.2% 3,963 10.8% 139,768
20-24 70,187 6.3% 52,427 9.1% 9,123 9.4% 3,354 11.4% 2,159 10.0% 5,414 7.6% 3,246 8.9% 145,910
25-29 74,263 6.6% 46,661 8.1% 7,877 8.2% 2,919 9.9% 1,917 8.9% 6,751 9.5% 2,543 7.0% 142,931
30-34 72,601 6.5% 45,935 8.0% 7,510 7.8% 2,543 8.6% 1,810 8.4% 6,862 9.6% 2,199 6.0% 139,460
35-39 68,336 6.1% 42,533 7.4% 6,870 7.1% 2,153 7.3% 1,515 7.0% 6,685 9.4% 1,800 4.9% 129,892
40-44 79,953 7.1% 38,101 6.6% 7,022 7.3% 1,915 6.5% 1,288 6.0% 6,358 8.9% 1,575 4.3% 136,212
45-49 80,195 7.2% 32,477 5.7% 6,457 6.7% 1,655 5.6% 1,140 5.3% 4,985 7.0% 1,252 3.4% 128,161
50-54 86,136 7.7% 25,485 4.4% 6,128 6.3% 1,522 5.2% 905 4.2% 4,145 5.8% 1,139 3.1% 125,460
55-59 78,706 7.0% 18,002 3.1% 5,063 5.2% 1,098 3.7% 678 3.2% 3,225 4.5% 884 2.4% 107,656
60-64 73,437 6.6% 13,162 2.3% 3,730 3.9% 757 2.6% 399 1.9% 2,520 3.5% 591 1.6% 94,596
65-69 64,372 5.7% 8,731 1.5% 2,449 2.5% 551 1.9% 254 1.2% 1,888 2.7% 448 1.2% 78,693
70-74 47,460 4.2% 5,565 1.0% 1,552 1.6% 313 1.1% 141 0.7% 1,428 2.0% 307 0.8% 56,766
75+ 81,442 7.3% 7,245 1.3% 1,994 2.1% 363 1.2% 156 0.7% 1,792 2.5% 409 1.1% 93,401
Total 1,121,040 573,801 96,631 29,434 21,504 71,216 36,562 1,950,188
Source: United States Census, Population Estimates Division. Data on this page were used for calculating all rates (denominators) in this report for 2012.
6
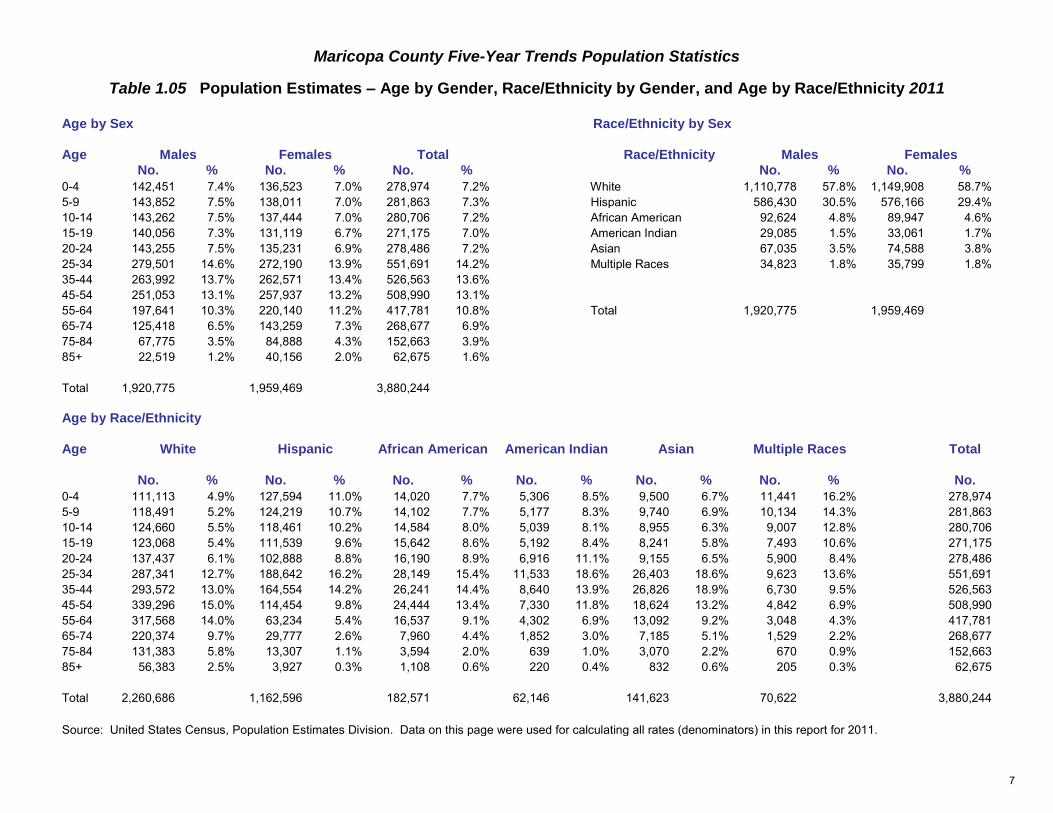
Maricopa County Five-Year Trends Population Statistics
Table 1.05 Population Estimates – Age by Gender, Race/Ethnicity by Gender, and Age by Race/Ethnicity 2011
Age by Sex Race/Ethnicity by Sex
Age Males Females Total Race/Ethnicity Males Females No. % No. % No. % No. % No. %
0-4 142,451 7.4% 136,523 7.0% 278,974 7.2% White 1,110,778 57.8% 1,149,908 58.7%
5-9 143,852 7.5% 138,011 7.0% 281,863 7.3% Hispanic 586,430 30.5% 576,166 29.4%
10-14 143,262 7.5% 137,444 7.0% 280,706 7.2% African American 92,624 4.8% 89,947 4.6%
15-19 140,056 7.3% 131,119 6.7% 271,175 7.0% American Indian 29,085 1.5% 33,061 1.7%
20-24 143,255 7.5% 135,231 6.9% 278,486 7.2% Asian 67,035 3.5% 74,588 3.8%
25-34 279,501 14.6% 272,190 13.9% 551,691 14.2% Multiple Races 34,823 1.8% 35,799 1.8%
35-44 263,992 13.7% 262,571 13.4% 526,563 13.6%
45-54 251,053 13.1% 257,937 13.2% 508,990 13.1%
55-64 197,641 10.3% 220,140 11.2% 417,781 10.8% Total 1,920,775 1,959,469
65-74 125,418 6.5% 143,259 7.3% 268,677 6.9%
75-84 67,775 3.5% 84,888 4.3% 152,663 3.9%
85+ 22,519 1.2% 40,156 2.0% 62,675 1.6%
Total 1,920,775 1,959,469 3,880,244
Age by Race/Ethnicity
Age White Hispanic African American American Indian Asian Multiple Races Total
No. % No. % No. % No. % No. % No. % No.
0-4 111,113 4.9% 127,594 11.0% 14,020 7.7% 5,306 8.5% 9,500 6.7% 11,441 16.2% 278,974
5-9 118,491 5.2% 124,219 10.7% 14,102 7.7% 5,177 8.3% 9,740 6.9% 10,134 14.3% 281,863
10-14 124,660 5.5% 118,461 10.2% 14,584 8.0% 5,039 8.1% 8,955 6.3% 9,007 12.8% 280,706
15-19 123,068 5.4% 111,539 9.6% 15,642 8.6% 5,192 8.4% 8,241 5.8% 7,493 10.6% 271,175
20-24 137,437 6.1% 102,888 8.8% 16,190 8.9% 6,916 11.1% 9,155 6.5% 5,900 8.4% 278,486
25-34 287,341 12.7% 188,642 16.2% 28,149 15.4% 11,533 18.6% 26,403 18.6% 9,623 13.6% 551,691
35-44 293,572 13.0% 164,554 14.2% 26,241 14.4% 8,640 13.9% 26,826 18.9% 6,730 9.5% 526,563
45-54 339,296 15.0% 114,454 9.8% 24,444 13.4% 7,330 11.8% 18,624 13.2% 4,842 6.9% 508,990
55-64 317,568 14.0% 63,234 5.4% 16,537 9.1% 4,302 6.9% 13,092 9.2% 3,048 4.3% 417,781
65-74 220,374 9.7% 29,777 2.6% 7,960 4.4% 1,852 3.0% 7,185 5.1% 1,529 2.2% 268,677
75-84 131,383 5.8% 13,307 1.1% 3,594 2.0% 639 1.0% 3,070 2.2% 670 0.9% 152,663
85+ 56,383 2.5% 3,927 0.3% 1,108 0.6% 220 0.4% 832 0.6% 205 0.3% 62,675
Total 2,260,686 1,162,596 182,571 62,146 141,623 70,622 3,880,244
Source: United States Census, Population Estimates Division. Data on this page were used for calculating all rates (denominators) in this report for 2011.
7
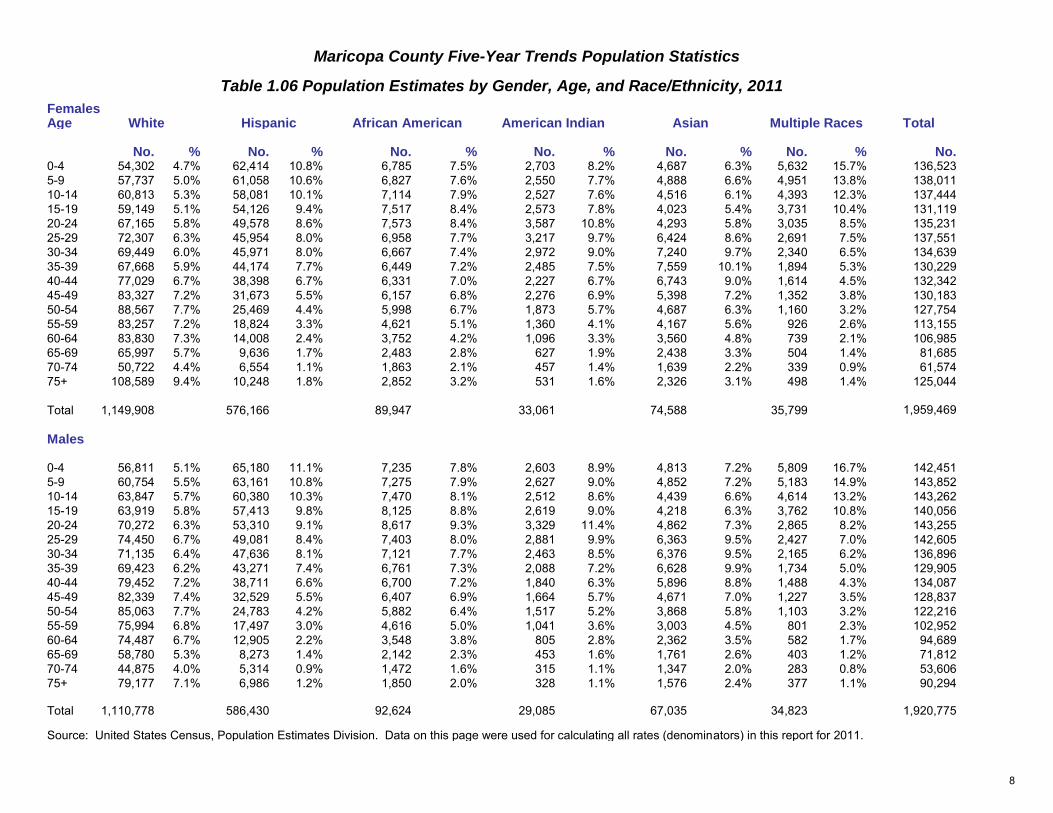
Maricopa County Five-Year Trends Population Statistics
Table 1.06 Population Estimates by Gender, Age, and Race/Ethnicity, 2011
Females Age White Hispanic African American American Indian Asian Multiple Races Total
No. % No. % No. % No. % No. % No. % No. 0-4 54,302 4.7% 62,414 10.8% 6,785 7.5% 2,703 8.2% 4,687 6.3% 5,632 15.7% 136,523
5-9 57,737 5.0% 61,058 10.6% 6,827 7.6% 2,550 7.7% 4,888 6.6% 4,951 13.8% 138,011
10-14 60,813 5.3% 58,081 10.1% 7,114 7.9% 2,527 7.6% 4,516 6.1% 4,393 12.3% 137,444
15-19 59,149 5.1% 54,126 9.4% 7,517 8.4% 2,573 7.8% 4,023 5.4% 3,731 10.4% 131,119
20-24 67,165 5.8% 49,578 8.6% 7,573 8.4% 3,587 10.8% 4,293 5.8% 3,035 8.5% 135,231
25-29 72,307 6.3% 45,954 8.0% 6,958 7.7% 3,217 9.7% 6,424 8.6% 2,691 7.5% 137,551
30-34 69,449 6.0% 45,971 8.0% 6,667 7.4% 2,972 9.0% 7,240 9.7% 2,340 6.5% 134,639
35-39 67,668 5.9% 44,174 7.7% 6,449 7.2% 2,485 7.5% 7,559 10.1% 1,894 5.3% 130,229
40-44 77,029 6.7% 38,398 6.7% 6,331 7.0% 2,227 6.7% 6,743 9.0% 1,614 4.5% 132,342
45-49 83,327 7.2% 31,673 5.5% 6,157 6.8% 2,276 6.9% 5,398 7.2% 1,352 3.8% 130,183
50-54 88,567 7.7% 25,469 4.4% 5,998 6.7% 1,873 5.7% 4,687 6.3% 1,160 3.2% 127,754
55-59 83,257 7.2% 18,824 3.3% 4,621 5.1% 1,360 4.1% 4,167 5.6% 926 2.6% 113,155
60-64 83,830 7.3% 14,008 2.4% 3,752 4.2% 1,096 3.3% 3,560 4.8% 739 2.1% 106,985
65-69 65,997 5.7% 9,636 1.7% 2,483 2.8% 627 1.9% 2,438 3.3% 504 1.4% 81,685
70-74 50,722 4.4% 6,554 1.1% 1,863 2.1% 457 1.4% 1,639 2.2% 339 0.9% 61,574
75+ 108,589 9.4% 10,248 1.8% 2,852 3.2% 531 1.6% 2,326 3.1% 498 1.4% 125,044
Total 1,149,908 576,166 89,947 33,061 74,588 35,799 1,959,469
Males
0-4 56,811 5.1% 65,180 11.1% 7,235 7.8% 2,603 8.9% 4,813 7.2% 5,809 16.7% 142,451
5-9 60,754 5.5% 63,161 10.8% 7,275 7.9% 2,627 9.0% 4,852 7.2% 5,183 14.9% 143,852
10-14 63,847 5.7% 60,380 10.3% 7,470 8.1% 2,512 8.6% 4,439 6.6% 4,614 13.2% 143,262
15-19 63,919 5.8% 57,413 9.8% 8,125 8.8% 2,619 9.0% 4,218 6.3% 3,762 10.8% 140,056
20-24 70,272 6.3% 53,310 9.1% 8,617 9.3% 3,329 11.4% 4,862 7.3% 2,865 8.2% 143,255
25-29 74,450 6.7% 49,081 8.4% 7,403 8.0% 2,881 9.9% 6,363 9.5% 2,427 7.0% 142,605
30-34 71,135 6.4% 47,636 8.1% 7,121 7.7% 2,463 8.5% 6,376 9.5% 2,165 6.2% 136,896
35-39 69,423 6.2% 43,271 7.4% 6,761 7.3% 2,088 7.2% 6,628 9.9% 1,734 5.0% 129,905
40-44 79,452 7.2% 38,711 6.6% 6,700 7.2% 1,840 6.3% 5,896 8.8% 1,488 4.3% 134,087
45-49 82,339 7.4% 32,529 5.5% 6,407 6.9% 1,664 5.7% 4,671 7.0% 1,227 3.5% 128,837
50-54 85,063 7.7% 24,783 4.2% 5,882 6.4% 1,517 5.2% 3,868 5.8% 1,103 3.2% 122,216
55-59 75,994 6.8% 17,497 3.0% 4,616 5.0% 1,041 3.6% 3,003 4.5% 801 2.3% 102,952
60-64 74,487 6.7% 12,905 2.2% 3,548 3.8% 805 2.8% 2,362 3.5% 582 1.7% 94,689
65-69 58,780 5.3% 8,273 1.4% 2,142 2.3% 453 1.6% 1,761 2.6% 403 1.2% 71,812
70-74 44,875 4.0% 5,314 0.9% 1,472 1.6% 315 1.1% 1,347 2.0% 283 0.8% 53,606
75+ 79,177 7.1% 6,986 1.2% 1,850 2.0% 328 1.1% 1,576 2.4% 377 1.1% 90,294
Total 1,110,778 586,430 92,624 29,085 67,035 34,823 1,920,775
Source: United States Census, Population Estimates Division. Data on this page were used for calculating all rates (denominators) in this report for 2011.
8
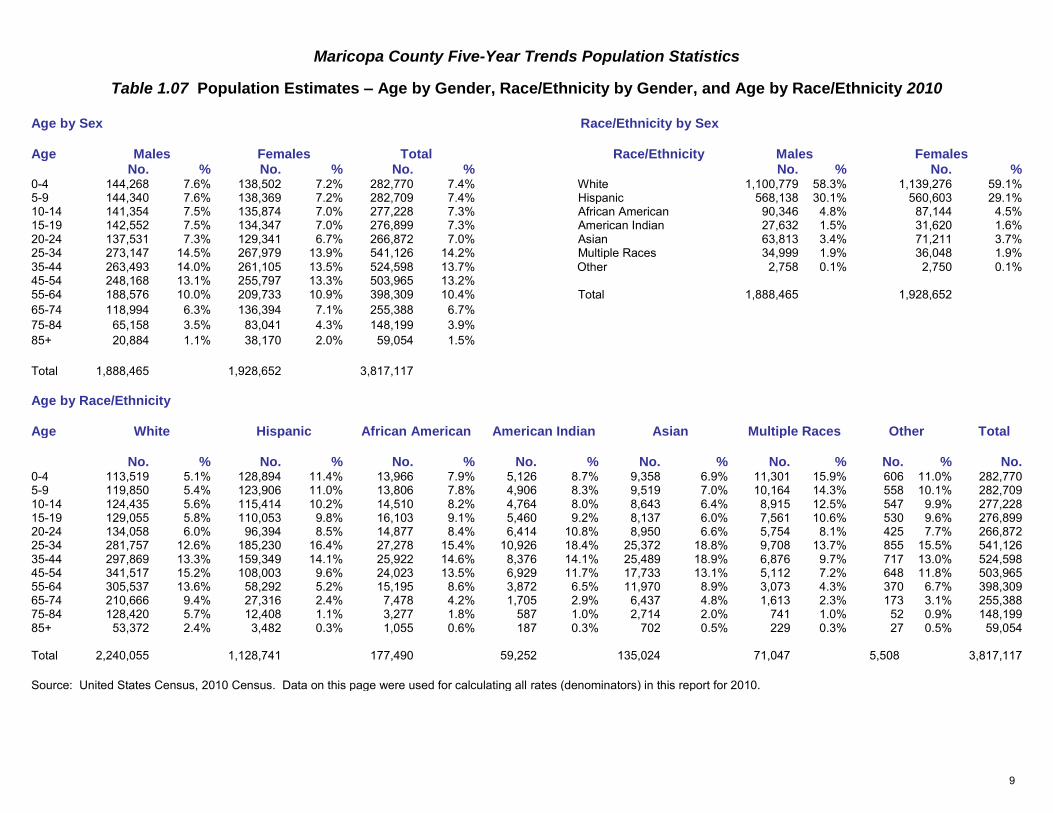
Maricopa County Five-Year Trends Population Statistics
Table 1.07 Population Estimates – Age by Gender, Race/Ethnicity by Gender, and Age by Race/Ethnicity 2010
Age by Sex Race/Ethnicity by Sex
Age Males Females Total Race/Ethnicity Males Females No. % No. % No. % No. % No. %
0-4 144,268 7.6% 138,502 7.2% 282,770 7.4% White 1,100,779 58.3% 1,139,276 59.1% 5-9 144,340 7.6% 138,369 7.2% 282,709 7.4% Hispanic 568,138 30.1% 560,603 29.1% 10-14 141,354 7.5% 135,874 7.0% 277,228 7.3% African American 90,346 4.8% 87,144 4.5% 15-19 142,552 7.5% 134,347 7.0% 276,899 7.3% American Indian 27,632 1.5% 31,620 1.6% 20-24 137,531 7.3% 129,341 6.7% 266,872 7.0% Asian 63,813 3.4% 71,211 3.7% 25-34 273,147 14.5% 267,979 13.9% 541,126 14.2% Multiple Races 34,999 1.9% 36,048 1.9%
35-44 263,493 14.0% 261,105 13.5% 524,598 13.7% Other 2,758 0.1% 2,750 0.1% 45-54 248,168 13.1% 255,797 13.3% 503,965 13.2% 55-64 188,576 10.0% 209,733 10.9% 398,309 10.4% Total 1,888,465 1,928,652
65-74 118,994 6.3% 136,394 7.1% 255,388 6.7%
75-84 65,158 3.5% 83,041 4.3% 148,199 3.9%
85+ 20,884 1.1% 38,170 2.0% 59,054 1.5%
Total 1,888,465 1,928,652 3,817,117
Age by Race/Ethnicity
Age White Hispanic African American American Indian Asian Multiple Races Other Total
No. % No. % No. % No. % No. % No. % No. % No. 0-4 113,519 5.1% 128,894 11.4% 13,966 7.9% 5,126 8.7% 9,358 6.9% 11,301 15.9% 606 11.0% 282,770 5-9 119,850 5.4% 123,906 11.0% 13,806 7.8% 4,906 8.3% 9,519 7.0% 10,164 14.3% 558 10.1% 282,709 10-14 124,435 5.6% 115,414 10.2% 14,510 8.2% 4,764 8.0% 8,643 6.4% 8,915 12.5% 547 9.9% 277,228 15-19 129,055 5.8% 110,053 9.8% 16,103 9.1% 5,460 9.2% 8,137 6.0% 7,561 10.6% 530 9.6% 276,899 20-24 134,058 6.0% 96,394 8.5% 14,877 8.4% 6,414 10.8% 8,950 6.6% 5,754 8.1% 425 7.7% 266,872 25-34 281,757 12.6% 185,230 16.4% 27,278 15.4% 10,926 18.4% 25,372 18.8% 9,708 13.7% 855 15.5% 541,126 35-44 297,869 13.3% 159,349 14.1% 25,922 14.6% 8,376 14.1% 25,489 18.9% 6,876 9.7% 717 13.0% 524,598 45-54 341,517 15.2% 108,003 9.6% 24,023 13.5% 6,929 11.7% 17,733 13.1% 5,112 7.2% 648 11.8% 503,965 55-64 305,537 13.6% 58,292 5.2% 15,195 8.6% 3,872 6.5% 11,970 8.9% 3,073 4.3% 370 6.7% 398,309 65-74 210,666 9.4% 27,316 2.4% 7,478 4.2% 1,705 2.9% 6,437 4.8% 1,613 2.3% 173 3.1% 255,388 75-84 128,420 5.7% 12,408 1.1% 3,277 1.8% 587 1.0% 2,714 2.0% 741 1.0% 52 0.9% 148,199 85+ 53,372 2.4% 3,482 0.3% 1,055 0.6% 187 0.3% 702 0.5% 229 0.3% 27 0.5% 59,054
Total 2,240,055 1,128,741 177,490 59,252 135,024 71,047 5,508 3,817,117
Source: United States Census, 2010 Census. Data on this page were used for calculating all rates (denominators) in this report for 2010.
9
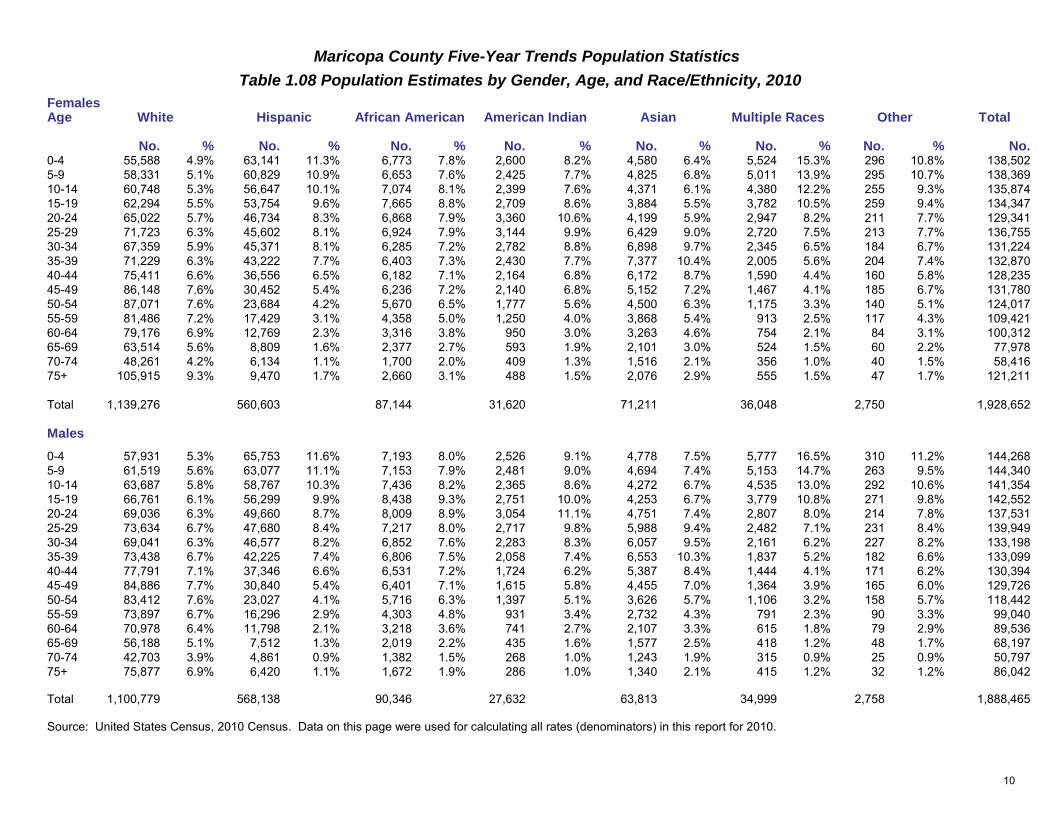
Maricopa County Five-Year Trends Population Statistics
Table 1.08 Population Estimates by Gender, Age, and Race/Ethnicity, 2010
Females Age White Hispanic African American American Indian Asian Multiple Races Other Total
No. % No. % No. % No. % No. % No. % No. % No. 0-4 55,588 4.9% 63,141 11.3% 6,773 7.8% 2,600 8.2% 4,580 6.4% 5,524 15.3% 296 10.8% 138,502
5-9 58,331 5.1% 60,829 10.9% 6,653 7.6% 2,425 7.7% 4,825 6.8% 5,011 13.9% 295 10.7% 138,369
10-14 60,748 5.3% 56,647 10.1% 7,074 8.1% 2,399 7.6% 4,371 6.1% 4,380 12.2% 255 9.3% 135,874
15-19 62,294 5.5% 53,754 9.6% 7,665 8.8% 2,709 8.6% 3,884 5.5% 3,782 10.5% 259 9.4% 134,347
20-24 65,022 5.7% 46,734 8.3% 6,868 7.9% 3,360 10.6% 4,199 5.9% 2,947 8.2% 211 7.7% 129,341
25-29 71,723 6.3% 45,602 8.1% 6,924 7.9% 3,144 9.9% 6,429 9.0% 2,720 7.5% 213 7.7% 136,755
30-34 67,359 5.9% 45,371 8.1% 6,285 7.2% 2,782 8.8% 6,898 9.7% 2,345 6.5% 184 6.7% 131,224
35-39 71,229 6.3% 43,222 7.7% 6,403 7.3% 2,430 7.7% 7,377 10.4% 2,005 5.6% 204 7.4% 132,870
40-44 75,411 6.6% 36,556 6.5% 6,182 7.1% 2,164 6.8% 6,172 8.7% 1,590 4.4% 160 5.8% 128,235
45-49 86,148 7.6% 30,452 5.4% 6,236 7.2% 2,140 6.8% 5,152 7.2% 1,467 4.1% 185 6.7% 131,780
50-54 87,071 7.6% 23,684 4.2% 5,670 6.5% 1,777 5.6% 4,500 6.3% 1,175 3.3% 140 5.1% 124,017
55-59 81,486 7.2% 17,429 3.1% 4,358 5.0% 1,250 4.0% 3,868 5.4% 913 2.5% 117 4.3% 109,421
60-64 79,176 6.9% 12,769 2.3% 3,316 3.8% 950 3.0% 3,263 4.6% 754 2.1% 84 3.1% 100,312
65-69 63,514 5.6% 8,809 1.6% 2,377 2.7% 593 1.9% 2,101 3.0% 524 1.5% 60 2.2% 77,978
70-74 48,261 4.2% 6,134 1.1% 1,700 2.0% 409 1.3% 1,516 2.1% 356 1.0% 40 1.5% 58,416
75+ 105,915 9.3% 9,470 1.7% 2,660 3.1% 488 1.5% 2,076 2.9% 555 1.5% 47 1.7% 121,211
Total 1,139,276 560,603 87,144 31,620 71,211 36,048 2,750 1,928,652
Males
0-4 57,931 5.3% 65,753 11.6% 7,193 8.0% 2,526 9.1% 4,778 7.5% 5,777 16.5% 310 11.2% 144,268
5-9 61,519 5.6% 63,077 11.1% 7,153 7.9% 2,481 9.0% 4,694 7.4% 5,153 14.7% 263 9.5% 144,340
10-14 63,687 5.8% 58,767 10.3% 7,436 8.2% 2,365 8.6% 4,272 6.7% 4,535 13.0% 292 10.6% 141,354
15-19 66,761 6.1% 56,299 9.9% 8,438 9.3% 2,751 10.0% 4,253 6.7% 3,779 10.8% 271 9.8% 142,552
20-24 69,036 6.3% 49,660 8.7% 8,009 8.9% 3,054 11.1% 4,751 7.4% 2,807 8.0% 214 7.8% 137,531
25-29 73,634 6.7% 47,680 8.4% 7,217 8.0% 2,717 9.8% 5,988 9.4% 2,482 7.1% 231 8.4% 139,949
30-34 69,041 6.3% 46,577 8.2% 6,852 7.6% 2,283 8.3% 6,057 9.5% 2,161 6.2% 227 8.2% 133,198
35-39 73,438 6.7% 42,225 7.4% 6,806 7.5% 2,058 7.4% 6,553 10.3% 1,837 5.2% 182 6.6% 133,099
40-44 77,791 7.1% 37,346 6.6% 6,531 7.2% 1,724 6.2% 5,387 8.4% 1,444 4.1% 171 6.2% 130,394
45-49 84,886 7.7% 30,840 5.4% 6,401 7.1% 1,615 5.8% 4,455 7.0% 1,364 3.9% 165 6.0% 129,726
50-54 83,412 7.6% 23,027 4.1% 5,716 6.3% 1,397 5.1% 3,626 5.7% 1,106 3.2% 158 5.7% 118,442
55-59 73,897 6.7% 16,296 2.9% 4,303 4.8% 931 3.4% 2,732 4.3% 791 2.3% 90 3.3% 99,040
60-64 70,978 6.4% 11,798 2.1% 3,218 3.6% 741 2.7% 2,107 3.3% 615 1.8% 79 2.9% 89,536
65-69 56,188 5.1% 7,512 1.3% 2,019 2.2% 435 1.6% 1,577 2.5% 418 1.2% 48 1.7% 68,197
70-74 42,703 3.9% 4,861 0.9% 1,382 1.5% 268 1.0% 1,243 1.9% 315 0.9% 25 0.9% 50,797
75+ 75,877 6.9% 6,420 1.1% 1,672 1.9% 286 1.0% 1,340 2.1% 415 1.2% 32 1.2% 86,042
Total 1,100,779 568,138 90,346 27,632 63,813 34,999 2,758 1,888,465
Source: United States Census, 2010 Census. Data on this page were used for calculating all rates (denominators) in this report for 2010.
10

Maricopa County Five-Year Trends Population Statistics
Table 1.09 Population Estimates – Age by Gender, Race/Ethnicity by Gender, and Age by Race/Ethnicity 2009
Age by Sex Race/Ethnicity by Sex
Age Males Females Total Race/Ethnicity Males Females
No. % No. % No. % No. % No. % 0-4 147,638 7.8% 142,214 7.4% 289,852 7.6% White 1,106,864 58.8% 1,145,362 59.7%
5-9 143,775 7.6% 136,857 7.1% 280,632 7.4% Hispanic 563,807 29.9% 552,811 28.8%
10-14 141,063 7.5% 135,430 7.1% 276,493 7.3% African American 89,612 4.8% 86,280 4.5%
15-19 142,479 7.6% 134,174 7.0% 276,653 7.3% American Indian 28,066 1.5% 31,875 1.7%
20-24 137,456 7.3% 128,862 6.7% 266,318 7.0% Asian 63,305 3.4% 70,351 3.7%
25-34 277,454 14.7% 271,174 14.1% 548,628 14.4% Multiple Races 32,240 1.7% 33,206 1.7%
35-44 265,931 14.1% 262,730 13.7% 528,661 13.9%
45-54 245,842 13.0% 252,996 13.2% 498,838 13.1%
55-64 182,725 9.7% 203,618 10.6% 386,343 10.2% Total 1,883,894 1,919,885
65-74 114,980 6.1% 131,980 6.9% 246,960 6.5%
75-84 64,368 3.4% 82,762 4.3% 147,130 3.9%
85+ 20,183 1.1% 37,088 1.9% 57,271 1.5%
Total 1,883,894 1,919,885 3,803,779
Age by Race/Ethnicity
Age White Hispanic African American American Indian Asian Multiple Races Total
No. % No. % No. % No. % No. % No. % No.
0-4 117,321 5.2% 132,011 11.8% 14,526 8.3% 5,444 9.1% 9,605 7.2% 10,945 16.7% 289,852
5-9 121,174 5.4% 122,184 10.9% 13,545 7.7% 4,978 8.3% 9,299 7.0% 9,452 14.4% 280,632
10-14 126,586 5.6% 113,674 10.2% 14,628 8.3% 4,712 7.9% 8,574 6.4% 8,319 12.7% 276,493
15-19 131,464 5.8% 108,163 9.7% 16,247 9.2% 5,675 9.5% 8,016 6.0% 7,088 10.8% 276,653
20-24 135,807 6.0% 95,332 8.5% 14,623 8.3% 6,568 11.0% 8,827 6.6% 5,161 7.9% 266,318
25-34 287,389 12.8% 188,082 16.8% 27,162 15.4% 11,111 18.5% 25,968 19.4% 8,916 13.6% 548,628
35-44 306,218 13.6% 156,634 14.0% 26,018 14.8% 8,516 14.2% 25,110 18.8% 6,165 9.4% 528,661
45-54 342,673 15.2% 104,083 9.3% 23,349 13.3% 6,815 11.4% 17,306 12.9% 4,612 7.0% 498,838
55-64 298,436 13.3% 55,381 5.0% 14,581 8.3% 3,759 6.3% 11,534 8.6% 2,652 4.1% 386,343
65-74 204,911 9.1% 25,914 2.3% 7,018 4.0% 1,603 2.7% 6,164 4.6% 1,350 2.1% 246,960
75-84 128,335 5.7% 11,840 1.1% 3,187 1.8% 584 1.0% 2,580 1.9% 604 0.9% 147,130
85+ 51,912 2.3% 3,320 0.3% 1,008 0.6% 176 0.3% 673 0.5% 182 0.3% 57,271
Total 2,252,226 1,116,618 175,892 59,941 133,656 65,446 3,803,779
Source: United States Census, Population Estimates Division. Data on this page were used for calculating all rates (denominators) in this report for 2009.
11
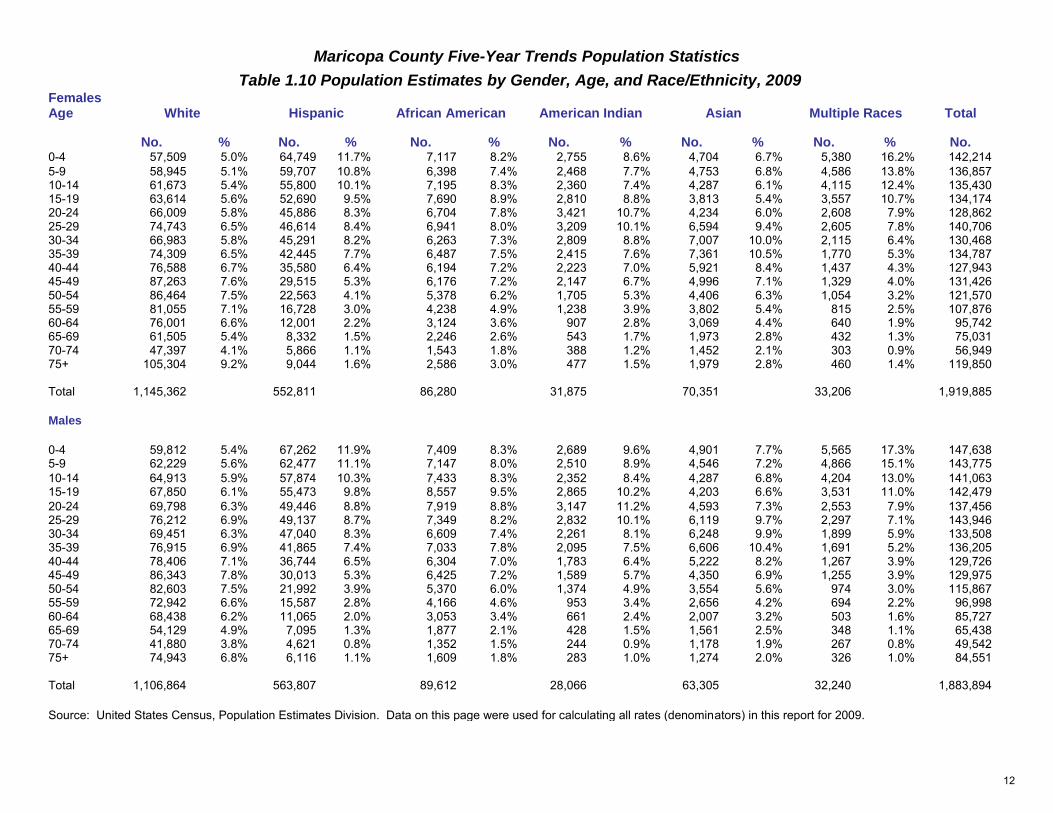
Maricopa County Five-Year Trends Population Statistics
Table 1.10 Population Estimates by Gender, Age, and Race/Ethnicity, 2009 Females Age White Hispanic African American American Indian Asian Multiple Races Total
No. % No. % No. % No. % No. % No. % No. 0-4 57,509 5.0% 64,749 11.7% 7,117 8.2% 2,755 8.6% 4,704 6.7% 5,380 16.2% 142,214
5-9 58,945 5.1% 59,707 10.8% 6,398 7.4% 2,468 7.7% 4,753 6.8% 4,586 13.8% 136,857 10-14 61,673 5.4% 55,800 10.1% 7,195 8.3% 2,360 7.4% 4,287 6.1% 4,115 12.4% 135,430 15-19 63,614 5.6% 52,690 9.5% 7,690 8.9% 2,810 8.8% 3,813 5.4% 3,557 10.7% 134,174 20-24 66,009 5.8% 45,886 8.3% 6,704 7.8% 3,421 10.7% 4,234 6.0% 2,608 7.9% 128,862 25-29 74,743 6.5% 46,614 8.4% 6,941 8.0% 3,209 10.1% 6,594 9.4% 2,605 7.8% 140,706 30-34 66,983 5.8% 45,291 8.2% 6,263 7.3% 2,809 8.8% 7,007 10.0% 2,115 6.4% 130,468 35-39 74,309 6.5% 42,445 7.7% 6,487 7.5% 2,415 7.6% 7,361 10.5% 1,770 5.3% 134,787 40-44 76,588 6.7% 35,580 6.4% 6,194 7.2% 2,223 7.0% 5,921 8.4% 1,437 4.3% 127,943 45-49 87,263 7.6% 29,515 5.3% 6,176 7.2% 2,147 6.7% 4,996 7.1% 1,329 4.0% 131,426 50-54 86,464 7.5% 22,563 4.1% 5,378 6.2% 1,705 5.3% 4,406 6.3% 1,054 3.2% 121,570 55-59 81,055 7.1% 16,728 3.0% 4,238 4.9% 1,238 3.9% 3,802 5.4% 815 2.5% 107,876 60-64 76,001 6.6% 12,001 2.2% 3,124 3.6% 907 2.8% 3,069 4.4% 640 1.9% 95,742 65-69 61,505 5.4% 8,332 1.5% 2,246 2.6% 543 1.7% 1,973 2.8% 432 1.3% 75,031 70-74 47,397 4.1% 5,866 1.1% 1,543 1.8% 388 1.2% 1,452 2.1% 303 0.9% 56,949 75+ 105,304 9.2% 9,044 1.6% 2,586 3.0% 477 1.5% 1,979 2.8% 460 1.4% 119,850
Total 1,145,362 552,811 86,280 31,875 70,351 33,206 1,919,885
Males
0-4 59,812 5.4% 67,262 11.9% 7,409 8.3% 2,689 9.6% 4,901 7.7% 5,565 17.3% 147,638 5-9 62,229 5.6% 62,477 11.1% 7,147 8.0% 2,510 8.9% 4,546 7.2% 4,866 15.1% 143,775
10-14 64,913 5.9% 57,874 10.3% 7,433 8.3% 2,352 8.4% 4,287 6.8% 4,204 13.0% 141,063 15-19 67,850 6.1% 55,473 9.8% 8,557 9.5% 2,865 10.2% 4,203 6.6% 3,531 11.0% 142,479
20-24 69,798 6.3% 49,446 8.8% 7,919 8.8% 3,147 11.2% 4,593 7.3% 2,553 7.9% 137,456 25-29 76,212 6.9% 49,137 8.7% 7,349 8.2% 2,832 10.1% 6,119 9.7% 2,297 7.1% 143,946 30-34 69,451 6.3% 47,040 8.3% 6,609 7.4% 2,261 8.1% 6,248 9.9% 1,899 5.9% 133,508 35-39 76,915 6.9% 41,865 7.4% 7,033 7.8% 2,095 7.5% 6,606 10.4% 1,691 5.2% 136,205 40-44 78,406 7.1% 36,744 6.5% 6,304 7.0% 1,783 6.4% 5,222 8.2% 1,267 3.9% 129,726 45-49 86,343 7.8% 30,013 5.3% 6,425 7.2% 1,589 5.7% 4,350 6.9% 1,255 3.9% 129,975 50-54 82,603 7.5% 21,992 3.9% 5,370 6.0% 1,374 4.9% 3,554 5.6% 974 3.0% 115,867 55-59 72,942 6.6% 15,587 2.8% 4,166 4.6% 953 3.4% 2,656 4.2% 694 2.2% 96,998 60-64 68,438 6.2% 11,065 2.0% 3,053 3.4% 661 2.4% 2,007 3.2% 503 1.6% 85,727 65-69 54,129 4.9% 7,095 1.3% 1,877 2.1% 428 1.5% 1,561 2.5% 348 1.1% 65,438 70-74 41,880 3.8% 4,621 0.8% 1,352 1.5% 244 0.9% 1,178 1.9% 267 0.8% 49,542 75+ 74,943 6.8% 6,116 1.1% 1,609 1.8% 283 1.0% 1,274 2.0% 326 1.0% 84,551
Total 1,106,864 563,807 89,612 28,066 63,305 32,240 1,883,894
Source: United States Census, Population Estimates Division. Data on this page were used for calculating all rates (denominators) in this report for 2009.
12
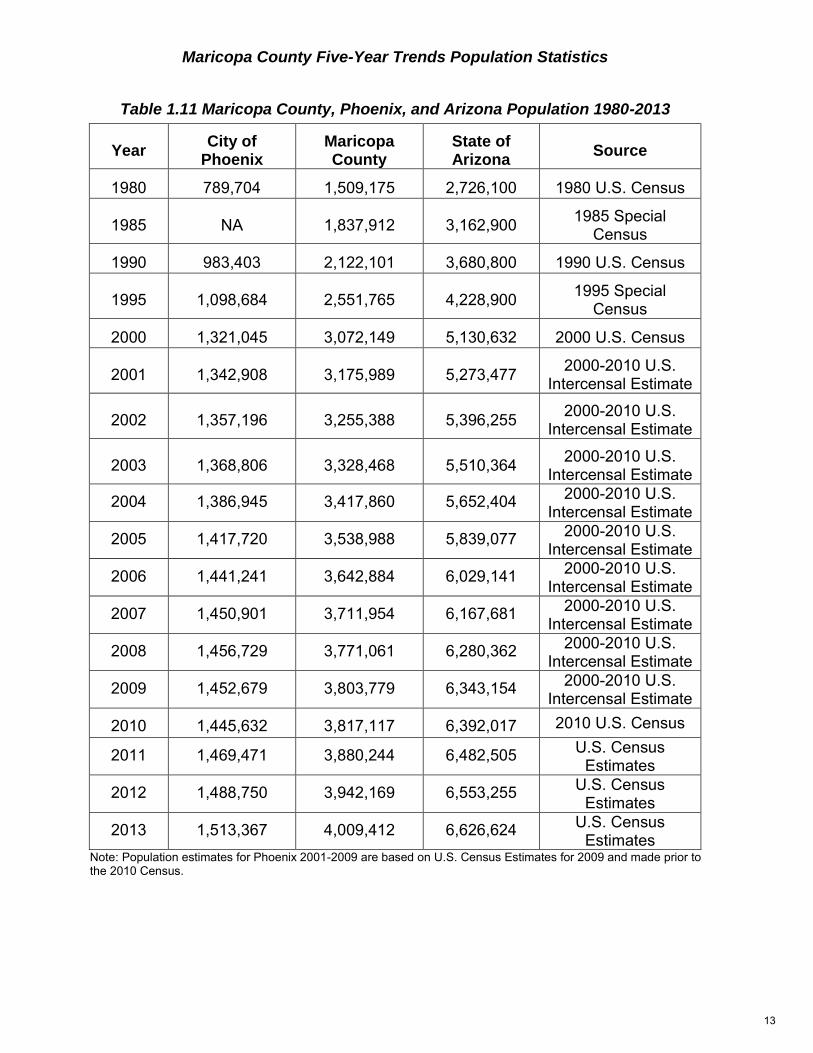
Maricopa County Five-Year Trends Population Statistics
Table 1.11 Maricopa County, Phoenix, and Arizona Population 1980-2013
Year City of
Phoenix Maricopa County
State of Arizona
Source
1980 789,704 1,509,175 2,726,100 1980 U.S. Census
1985 NA 1,837,912 3,162,900 1985 Special
Census
1990 983,403 2,122,101 3,680,800 1990 U.S. Census
1995 1,098,684 2,551,765 4,228,900 1995 Special
Census
2000 1,321,045 3,072,149 5,130,632 2000 U.S. Census
2001 1,342,908 3,175,989 5,273,477 2000-2010 U.S.
Intercensal Estimate
2002 1,357,196 3,255,388 5,396,255 2000-2010 U.S.
Intercensal Estimate
2003 1,368,806 3,328,468 5,510,364 2000-2010 U.S.
Intercensal Estimate
2004 1,386,945 3,417,860 5,652,404 2000-2010 U.S.
Intercensal Estimate
2005 1,417,720 3,538,988 5,839,077 2000-2010 U.S.
Intercensal Estimate
2006 1,441,241 3,642,884 6,029,141 2000-2010 U.S.
Intercensal Estimate
2007 1,450,901 3,711,954 6,167,681 2000-2010 U.S.
Intercensal Estimate
2008 1,456,729 3,771,061 6,280,362 2000-2010 U.S.
Intercensal Estimate
2009 1,452,679 3,803,779 6,343,154 2000-2010 U.S.
Intercensal Estimate
2010 1,445,632 3,817,117 6,392,017 2010 U.S. Census
2011 1,469,471 3,880,244 6,482,505 U.S. Census
Estimates
2012 1,488,750 3,942,169 6,553,255 U.S. Census
Estimates
2013 1,513,367 4,009,412 6,626,624 U.S. Census
Estimates Note: Population estimates for Phoenix 2001-2009 are based on U.S. Census Estimates for 2009 and made prior to the 2010 Census.
13
II. Maricopa County Five-Year Health Trends
14
Maricopa County Five-Year Trends Vital Statistics
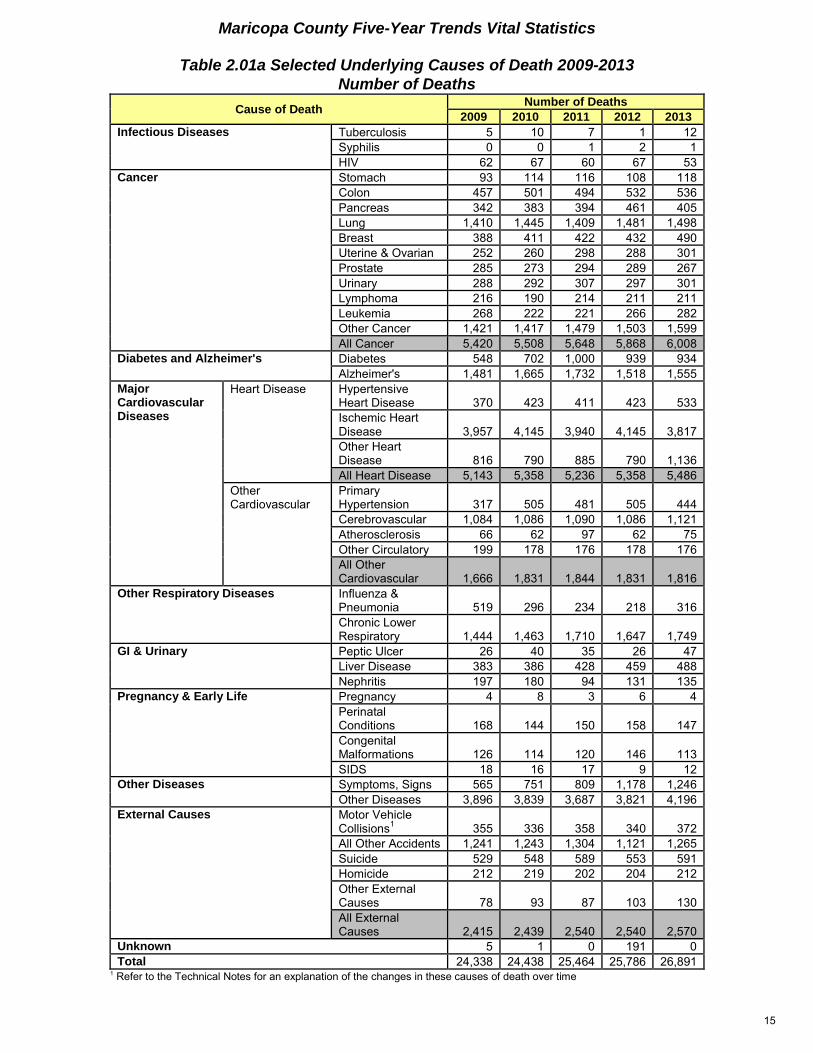
Table 2.01a Selected Underlying Causes of Death 2009-2013
Number of Deaths
Cause of Death Number of Deaths
2009 2010 2011 2012 2013
Infectious Diseases Tuberculosis 5 10 7 1 12
Syphilis 0 0 1 2 1
HIV 62 67 60 67 53
Cancer Stomach 93 114 116 108 118
Colon 457 501 494 532 536
Pancreas 342 383 394 461 405
Lung 1,410 1,445 1,409 1,481 1,498
Breast 388 411 422 432 490
Uterine & Ovarian 252 260 298 288 301
Prostate 285 273 294 289 267
Urinary 288 292 307 297 301
Lymphoma 216 190 214 211 211
Leukemia 268 222 221 266 282
Other Cancer 1,421 1,417 1,479 1,503 1,599
All Cancer 5,420 5,508 5,648 5,868 6,008
Diabetes and Alzheimer's Diabetes 548 702 1,000 939 934
Alzheimer's 1,481 1,665 1,732 1,518 1,555
Major Cardiovascular Diseases
Heart Disease Hypertensive Heart Disease 370 423 411 423 533
Ischemic Heart Disease 3,957 4,145 3,940 4,145 3,817
Other Heart Disease 816 790 885 790 1,136
All Heart Disease 5,143 5,358 5,236 5,358 5,486
Other Cardiovascular
Primary Hypertension 317 505 481 505 444
Cerebrovascular 1,084 1,086 1,090 1,086 1,121
Atherosclerosis 66 62 97 62 75
Other Circulatory 199 178 176 178 176
All Other Cardiovascular 1,666 1,831 1,844 1,831 1,816
Other Respiratory Diseases Influenza & Pneumonia 519 296 234 218 316
Chronic Lower Respiratory 1,444 1,463 1,710 1,647 1,749
GI & Urinary Peptic Ulcer 26 40 35 26 47
Liver Disease 383 386 428 459 488
Nephritis 197 180 94 131 135
Pregnancy & Early Life Pregnancy 4 8 3 6 4
Perinatal Conditions 168 144 150 158 147
Congenital Malformations 126 114 120 146 113
SIDS 18 16 17 9 12
Other Diseases Symptoms, Signs 565 751 809 1,178 1,246
Other Diseases 3,896 3,839 3,687 3,821 4,196
External Causes Motor Vehicle Collisions
1 355 336 358 340 372
All Other Accidents 1,241 1,243 1,304 1,121 1,265
Suicide 529 548 589 553 591
Homicide 212 219 202 204 212
Other External Causes 78 93 87 103 130
All External Causes 2,415 2,439 2,540 2,540 2,570
Unknown 5 1 0 191 0
Total 24,338 24,438 25,464 25,786 26,891 1 Refer to the Technical Notes for an explanation of the changes in these causes of death over time
15
Maricopa County Five-Year Trends Vital Statistics
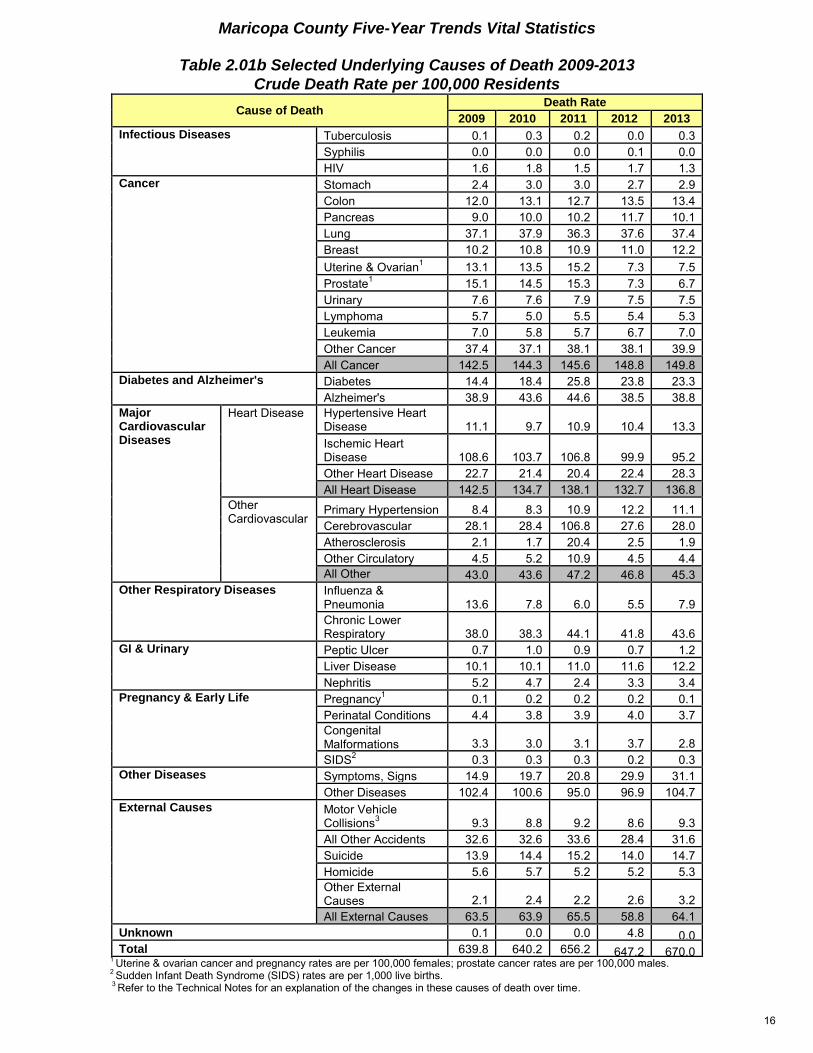
Table 2.01b Selected Underlying Causes of Death 2009-2013
Crude Death Rate per 100,000 Residents
Cause of Death Death Rate
2009 2010 2011 2012 2013
Infectious Diseases Tuberculosis 0.1 0.3 0.2 0.0 0.3
Syphilis 0.0 0.0 0.0 0.1 0.0
HIV 1.6 1.8 1.5 1.7 1.3
Cancer Stomach 2.4 3.0 3.0 2.7 2.9
Colon 12.0 13.1 12.7 13.5 13.4
Pancreas 9.0 10.0 10.2 11.7 10.1
Lung 37.1 37.9 36.3 37.6 37.4
Breast 10.2 10.8 10.9 11.0 12.2
Uterine & Ovarian1
13.1 13.5 15.2 7.3 7.5
Prostate1
15.1 14.5 15.3 7.3 6.7
Urinary 7.6 7.6 7.9 7.5 7.5
Lymphoma 5.7 5.0 5.5 5.4 5.3
Leukemia 7.0 5.8 5.7 6.7 7.0
Other Cancer 37.4 37.1 38.1 38.1 39.9
All Cancer 142.5 144.3 145.6 148.8 149.8
Diabetes and Alzheimer's Diabetes 14.4 18.4 25.8 23.8 23.3
Alzheimer's 38.9 43.6 44.6 38.5 38.8
Major Cardiovascular Diseases
Heart Disease Hypertensive Heart Disease 11.1 9.7 10.9 10.4 13.3
Ischemic Heart Disease 108.6 103.7 106.8 99.9 95.2
Other Heart Disease 22.7 21.4 20.4 22.4 28.3
All Heart Disease 142.5 134.7 138.1 132.7 136.8
Other Cardiovascular
Primary Hypertension 8.4 8.3 10.9 12.2 11.1
Cerebrovascular 28.1 28.4 106.8 27.6 28.0
Atherosclerosis 2.1 1.7 20.4 2.5 1.9
Other Circulatory 4.5 5.2 10.9 4.5 4.4
All Other Cardiovascular
43.0 43.6 47.2 46.8 45.3
Other Respiratory Diseases Influenza & Pneumonia 13.6 7.8 6.0 5.5 7.9
Chronic Lower Respiratory 38.0 38.3 44.1 41.8 43.6
GI & Urinary Peptic Ulcer 0.7 1.0 0.9 0.7 1.2
Liver Disease 10.1 10.1 11.0 11.6 12.2
Nephritis 5.2 4.7 2.4 3.3 3.4
Pregnancy & Early Life Pregnancy1
0.1 0.2 0.2 0.2 0.1
Perinatal Conditions 4.4 3.8 3.9 4.0 3.7
Congenital Malformations 3.3 3.0 3.1 3.7 2.8
SIDS2
0.3 0.3 0.3 0.2 0.3
Other Diseases Symptoms, Signs 14.9 19.7 20.8 29.9 31.1
Other Diseases 102.4 100.6 95.0 96.9 104.7
External Causes Motor Vehicle Collisions
3 9.3 8.8 9.2 8.6 9.3
All Other Accidents 32.6 32.6 33.6 28.4 31.6
Suicide 13.9 14.4 15.2 14.0 14.7
Homicide 5.6 5.7 5.2 5.2 5.3
Other External Causes 2.1 2.4 2.2 2.6 3.2
All External Causes 63.5 63.9 65.5 58.8 64.1
Unknown 0.1 0.0 0.0 4.8 0.0Total 639.8 640.2 656.2 647.2 670.0
1 Uterine & ovarian cancer and pregnancy rates are per 100,000 females; prostate cancer rates are per 100,000 males.
2 Sudden Infant Death Syndrome (SIDS) rates are per 1,000 live births.
3 Refer to the Technical Notes for an explanation of the changes in these causes of death over time.
16
Maricopa County Five-Year Trends Vital Statistics
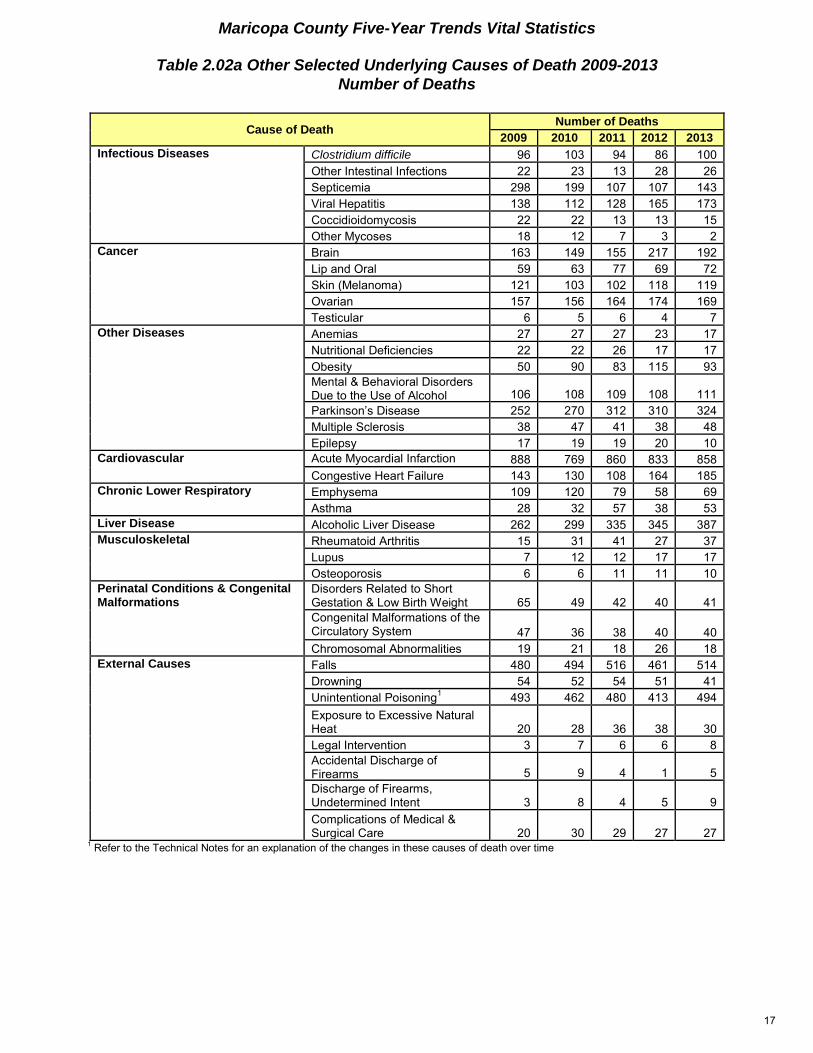
Table 2.02a Other Selected Underlying Causes of Death 2009-2013
Number of Deaths
Cause of Death Number of Deaths
2009 2010 2011 2012 2013
Infectious Diseases Clostridium difficile 96 103 94 86 100
Other Intestinal Infections 22 23 13 28 26
Septicemia 298 199 107 107 143
Viral Hepatitis 138 112 128 165 173
Coccidioidomycosis 22 22 13 13 15
Other Mycoses 18 12 7 3 2
Cancer Brain 163 149 155 217 192
Lip and Oral 59 63 77 69 72
Skin (Melanoma) 121 103 102 118 119
Ovarian 157 156 164 174 169
Testicular 6 5 6 4 7
Other Diseases Anemias 27 27 27 23 17
Nutritional Deficiencies 22 22 26 17 17
Obesity 50 90 83 115 93
Mental & Behavioral Disorders Due to the Use of Alcohol 106 108 109 108 111
Parkinson’s Disease 252 270 312 310 324
Multiple Sclerosis 38 47 41 38 48
Epilepsy 17 19 19 20 10
Cardiovascular Acute Myocardial Infarction (Heart Attack)
888 769 860 833 858
Congestive Heart Failure 143 130 108 164 185
Chronic Lower Respiratory Emphysema 109 120 79 58 69
Asthma 28 32 57 38 53
Liver Disease Alcoholic Liver Disease 262 299 335 345 387
Musculoskeletal Rheumatoid Arthritis 15 31 41 27 37
Lupus 7 12 12 17 17
Osteoporosis 6 6 11 11 10
Perinatal Conditions & Congenital Malformations
Disorders Related to Short Gestation & Low Birth Weight 65 49 42 40 41
Congenital Malformations of the Circulatory System 47 36 38 40 40
Chromosomal Abnormalities 19 21 18 26 18
External Causes Falls 480 494 516 461 514
Drowning 54 52 54 51 41
Unintentional Poisoning1
493 462 480 413 494
Exposure to Excessive Natural Heat 20 28 36 38 30
Legal Intervention 3 7 6 6 8
Accidental Discharge of Firearms 5 9 4 1 5
Discharge of Firearms, Undetermined Intent 3 8 4 5 9
Complications of Medical & Surgical Care 20 30 29 27 27
1 Refer to the Technical Notes for an explanation of the changes in these causes of death over time
17
Maricopa County Five-Year Trends Vital Statistics
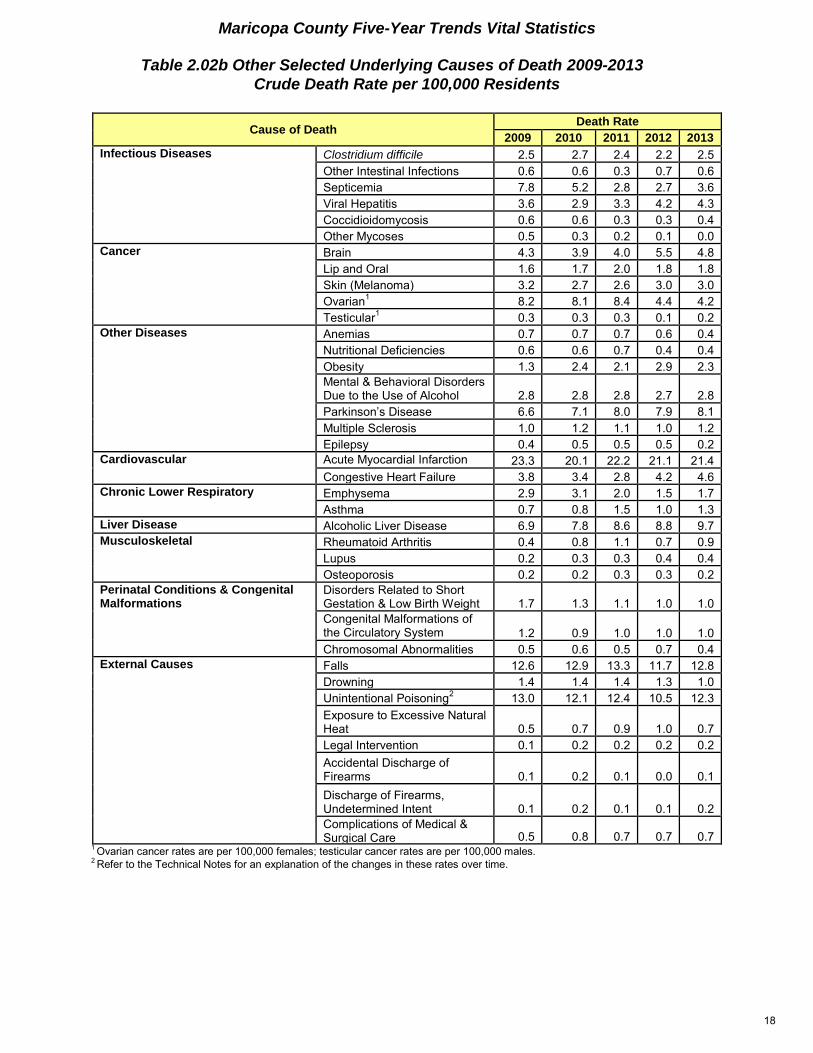
Table 2.02b Other Selected Underlying Causes of Death 2009-2013
Crude Death Rate per 100,000 Residents
Cause of Death Death Rate
2009 2010 2011 2012 2013
Infectious Diseases Clostridium difficile 2.5 2.7 2.4 2.2 2.5
Other Intestinal Infections 0.6 0.6 0.3 0.7 0.6
Septicemia 7.8 5.2 2.8 2.7 3.6
Viral Hepatitis 3.6 2.9 3.3 4.2 4.3
Coccidioidomycosis 0.6 0.6 0.3 0.3 0.4
Other Mycoses 0.5 0.3 0.2 0.1 0.0
Cancer Brain 4.3 3.9 4.0 5.5 4.8
Lip and Oral 1.6 1.7 2.0 1.8 1.8
Skin (Melanoma) 3.2 2.7 2.6 3.0 3.0
Ovarian1
8.2 8.1 8.4 4.4 4.2
Testicular1
0.3 0.3 0.3 0.1 0.2
Other Diseases Anemias 0.7 0.7 0.7 0.6 0.4
Nutritional Deficiencies 0.6 0.6 0.7 0.4 0.4
Obesity 1.3 2.4 2.1 2.9 2.3
Mental & Behavioral Disorders Due to the Use of Alcohol 2.8 2.8 2.8 2.7 2.8
Parkinson’s Disease 6.6 7.1 8.0 7.9 8.1
Multiple Sclerosis 1.0 1.2 1.1 1.0 1.2
Epilepsy 0.4 0.5 0.5 0.5 0.2
Cardiovascular Acute Myocardial Infarction (Heart Attack)
23.3 20.1 22.2 21.1 21.4
Congestive Heart Failure 3.8 3.4 2.8 4.2 4.6
Chronic Lower Respiratory Emphysema 2.9 3.1 2.0 1.5 1.7
Asthma 0.7 0.8 1.5 1.0 1.3
Liver Disease Alcoholic Liver Disease 6.9 7.8 8.6 8.8 9.7
Musculoskeletal Rheumatoid Arthritis 0.4 0.8 1.1 0.7 0.9
Lupus 0.2 0.3 0.3 0.4 0.4
Osteoporosis 0.2 0.2 0.3 0.3 0.2
Perinatal Conditions & Congenital Malformations
Disorders Related to Short Gestation & Low Birth Weight 1.7 1.3 1.1 1.0 1.0
Congenital Malformations of the Circulatory System 1.2 0.9 1.0 1.0 1.0
Chromosomal Abnormalities 0.5 0.6 0.5 0.7 0.4
External Causes Falls 12.6 12.9 13.3 11.7 12.8
Drowning 1.4 1.4 1.4 1.3 1.0
Unintentional Poisoning2
13.0 12.1 12.4 10.5 12.3
Exposure to Excessive Natural Heat 0.5 0.7 0.9 1.0 0.7
Legal Intervention 0.1 0.2 0.2 0.2 0.2
Accidental Discharge of Firearms 0.1 0.2 0.1 0.0 0.1
Discharge of Firearms, Undetermined Intent 0.1 0.2 0.1 0.1 0.2
Complications of Medical & Surgical Care 0.5 0.8 0.7 0.7 0.7
1 Ovarian cancer rates are per 100,000 females; testicular cancer rates are per 100,000 males.
2 Refer to the Technical Notes for an explanation of the changes in these rates over time.
18
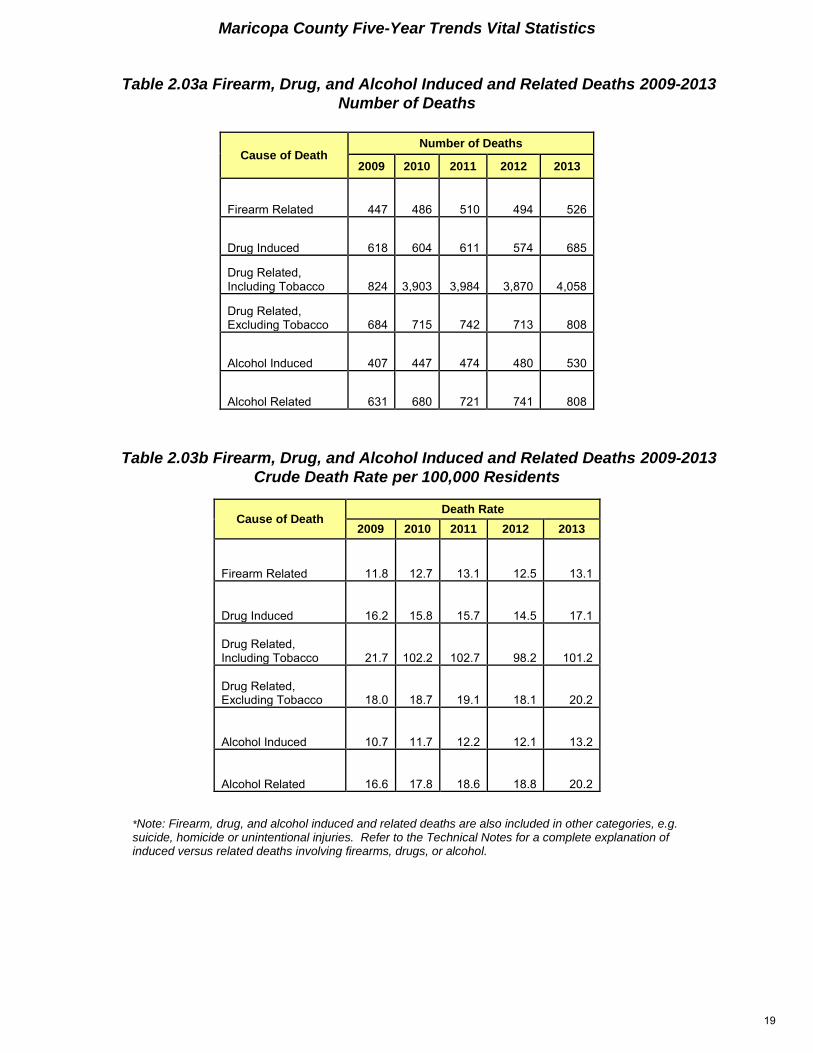
Maricopa County Five-Year Trends Vital Statistics
Table 2.03a Firearm, Drug, and Alcohol Induced and Related Deaths 2009-2013
Number of Deaths
Cause of Death Number of Deaths
2009 2010 2011 2012 2013
Firearm Related 447 486 510 494 526
Drug Induced 618 604 611 574 685
Drug Related, Including Tobacco 824 3,903 3,984 3,870 4,058
Drug Related, Excluding Tobacco 684 715 742 713 808
Alcohol Induced 407 447 474 480 530
Alcohol Related 631 680 721 741 808
Table 2.03b Firearm, Drug, and Alcohol Induced and Related Deaths 2009-2013
Crude Death Rate per 100,000 Residents
Cause of Death Death Rate
2009 2010 2011 2012 2013
Firearm Related 11.8 12.7 13.1 12.5 13.1
Drug Induced 16.2 15.8 15.7 14.5 17.1
Drug Related, Including Tobacco 21.7 102.2 102.7 98.2 101.2
Drug Related, Excluding Tobacco 18.0 18.7 19.1 18.1 20.2
Alcohol Induced 10.7 11.7 12.2 12.1 13.2
Alcohol Related 16.6 17.8 18.6 18.8 20.2
*Note: Firearm, drug, and alcohol induced and related deaths are also included in other categories, e.g.suicide, homicide or unintentional injuries. Refer to the Technical Notes for a complete explanation of induced versus related deaths involving firearms, drugs, or alcohol.
19
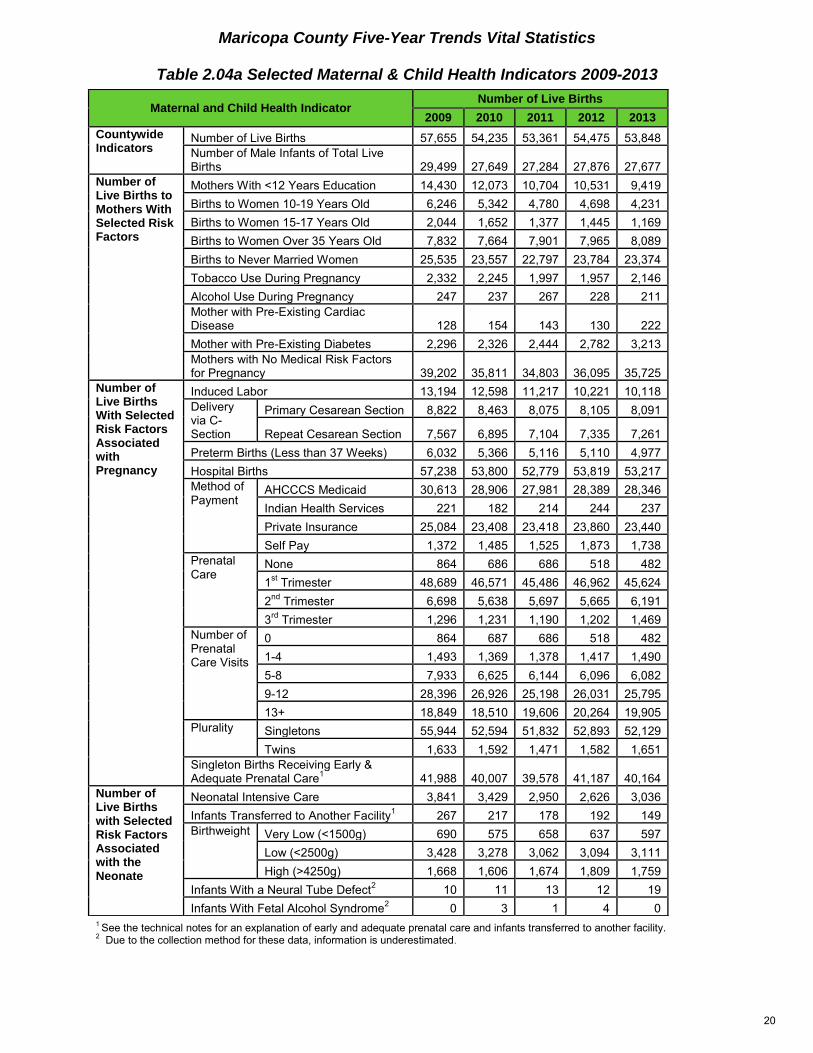
Maricopa County Five-Year Trends Vital Statistics
Table 2.04a Selected Maternal & Child Health Indicators 2009-2013
1 See the technical notes for an explanation of early and adequate prenatal care and infants transferred to another facility.
2 Due to the collection method for these data, information is underestimated.
Maternal and Child Health Indicator Number of Live Births
2009 2010 2011 2012 2013
Countywide Indicators
Number of Live Births 57,655 54,235 53,361 54,475 53,848
Number of Male Infants of Total Live Births 29,499 27,649 27,284 27,876 27,677
Number of Live Births to Mothers With Selected Risk Factors
Mothers With <12 Years Education 14,430 12,073 10,704 10,531 9,419
Births to Women 10-19 Years Old 6,246 5,342 4,780 4,698 4,231
Births to Women 15-17 Years Old 2,044 1,652 1,377 1,445 1,169
Births to Women Over 35 Years Old 7,832 7,664 7,901 7,965 8,089
Births to Never Married Women 25,535 23,557 22,797 23,784 23,374
Tobacco Use During Pregnancy 2,332 2,245 1,997 1,957 2,146
Alcohol Use During Pregnancy 247 237 267 228 211
Mother with Pre-Existing Cardiac Disease 128 154 143 130 222
Mother with Pre-Existing Diabetes 2,296 2,326 2,444 2,782 3,213
Mothers with No Medical Risk Factors for Pregnancy 39,202 35,811 34,803 36,095 35,725
Number of Live Births With Selected Risk Factors Associated with Pregnancy
Induced Labor 13,194 12,598 11,217 10,221 10,118
Delivery via C-Section
Primary Cesarean Section 8,822 8,463 8,075 8,105 8,091
Repeat Cesarean Section 7,567 6,895 7,104 7,335 7,261
Preterm Births (Less than 37 Weeks) 6,032 5,366 5,116 5,110 4,977
Hospital Births 57,238 53,800 52,779 53,819 53,217
Method of Payment
AHCCCS Medicaid 30,613 28,906 27,981 28,389 28,346
Indian Health Services 221 182 214 244 237
Private Insurance 25,084 23,408 23,418 23,860 23,440
Self Pay 1,372 1,485 1,525 1,873 1,738
Prenatal Care
None 864 686 686 518 482
1st Trimester 48,689 46,571 45,486 46,962 45,624
2nd
Trimester 6,698 5,638 5,697 5,665 6,191
3rd
Trimester 1,296 1,231 1,190 1,202 1,469
Number of Prenatal Care Visits
0 864 687 686 518 482
1-4 1,493 1,369 1,378 1,417 1,490
5-8 7,933 6,625 6,144 6,096 6,082
9-12 28,396 26,926 25,198 26,031 25,795
13+ 18,849 18,510 19,606 20,264 19,905
Plurality Singletons 55,944 52,594 51,832 52,893 52,129
Twins 1,633 1,592 1,471 1,582 1,651
Singleton Births Receiving Early & Adequate Prenatal Care
141,988 40,007 39,578 41,187 40,164
Number of Live Births with Selected Risk Factors Associated with the Neonate
Neonatal Intensive Care 3,841 3,429 2,950 2,626 3,036
Infants Transferred to Another Facility1
267 217 178 192 149
Birthweight Very Low (<1500g) 690 575 658 637 597
Low (<2500g) 3,428 3,278 3,062 3,094 3,111
High (>4250g) 1,668 1,606 1,674 1,809 1,759
Infants With a Neural Tube Defect2
10 11 13 12 19
Infants With Fetal Alcohol Syndrome2
0 3 1 4 0
20
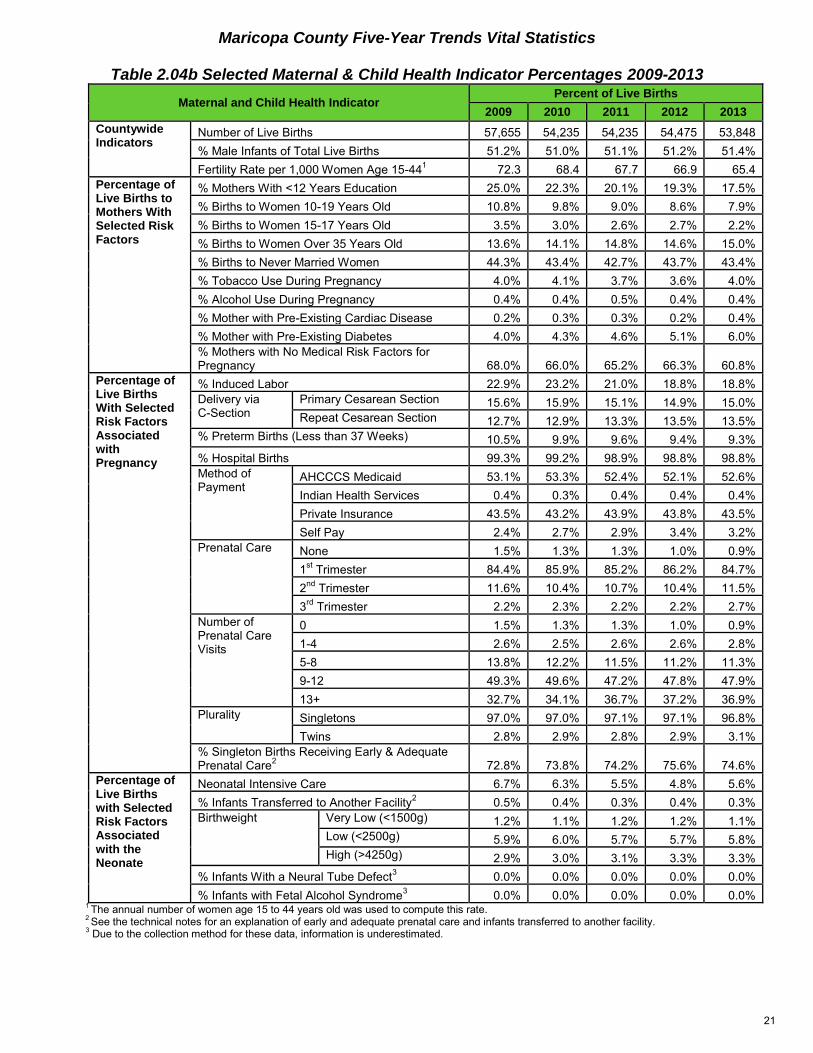
Maricopa County Five-Year Trends Vital Statistics
Table 2.04b Selected Maternal & Child Health Indicator Percentages 2009-2013
Maternal and Child Health Indicator Percent of Live Births
2009 2010 2011 2012 2013
Countywide Indicators
Number of Live Births 57,655 54,235 54,235 54,475 53,848
% Male Infants of Total Live Births 51.2% 51.0% 51.1% 51.2% 51.4%
Fertility Rate per 1,000 Women Age 15-441
72.3 68.4 67.7 66.9 65.4
Percentage of Live Births to Mothers With Selected Risk Factors
% Mothers With <12 Years Education 25.0% 22.3% 20.1% 19.3% 17.5%
% Births to Women 10-19 Years Old 10.8% 9.8% 9.0% 8.6% 7.9%
% Births to Women 15-17 Years Old 3.5% 3.0% 2.6% 2.7% 2.2%
% Births to Women Over 35 Years Old 13.6% 14.1% 14.8% 14.6% 15.0%
% Births to Never Married Women 44.3% 43.4% 42.7% 43.7% 43.4%
% Tobacco Use During Pregnancy 4.0% 4.1% 3.7% 3.6% 4.0%
% Alcohol Use During Pregnancy 0.4% 0.4% 0.5% 0.4% 0.4%
% Mother with Pre-Existing Cardiac Disease 0.2% 0.3% 0.3% 0.2% 0.4%
% Mother with Pre-Existing Diabetes 4.0% 4.3% 4.6% 5.1% 6.0%
% Mothers with No Medical Risk Factors for Pregnancy 68.0% 66.0% 65.2% 66.3% 60.8%
Percentage of Live Births With Selected Risk Factors Associated with Pregnancy
% Induced Labor 22.9% 23.2% 21.0% 18.8% 18.8%
Delivery via C-Section
Primary Cesarean Section 15.6% 15.9% 15.1% 14.9% 15.0%
Repeat Cesarean Section 12.7% 12.9% 13.3% 13.5% 13.5%
% Preterm Births (Less than 37 Weeks) 10.5% 9.9% 9.6% 9.4% 9.3%
% Hospital Births 99.3% 99.2% 98.9% 98.8% 98.8%
Method of Payment
AHCCCS Medicaid 53.1% 53.3% 52.4% 52.1% 52.6%
Indian Health Services 0.4% 0.3% 0.4% 0.4% 0.4%
Private Insurance 43.5% 43.2% 43.9% 43.8% 43.5%
Self Pay 2.4% 2.7% 2.9% 3.4% 3.2%
Prenatal Care None 1.5% 1.3% 1.3% 1.0% 0.9%
1st Trimester 84.4% 85.9% 85.2% 86.2% 84.7%
2nd
Trimester 11.6% 10.4% 10.7% 10.4% 11.5%
3rd
Trimester 2.2% 2.3% 2.2% 2.2% 2.7%
Number of Prenatal Care Visits
0 1.5% 1.3% 1.3% 1.0% 0.9%
1-4 2.6% 2.5% 2.6% 2.6% 2.8%
5-8 13.8% 12.2% 11.5% 11.2% 11.3%
9-12 49.3% 49.6% 47.2% 47.8% 47.9%
13+ 32.7% 34.1% 36.7% 37.2% 36.9%
Plurality Singletons 97.0% 97.0% 97.1% 97.1% 96.8%
Twins 2.8% 2.9% 2.8% 2.9% 3.1%
% Singleton Births Receiving Early & Adequate Prenatal Care
272.8% 73.8% 74.2% 75.6% 74.6%
Percentage of Live Births with Selected Risk Factors Associated with the Neonate
Neonatal Intensive Care 6.7% 6.3% 5.5% 4.8% 5.6%
% Infants Transferred to Another Facility2
0.5% 0.4% 0.3% 0.4% 0.3%
Birthweight Very Low (<1500g) 1.2% 1.1% 1.2% 1.2% 1.1%
Low (<2500g) 5.9% 6.0% 5.7% 5.7% 5.8%
High (>4250g) 2.9% 3.0% 3.1% 3.3% 3.3%
% Infants With a Neural Tube Defect3
0.0% 0.0% 0.0% 0.0% 0.0%
% Infants with Fetal Alcohol Syndrome3
0.0% 0.0% 0.0% 0.0% 0.0% 1
The annual number of women age 15 to 44 years old was used to compute this rate. 2
See the technical notes for an explanation of early and adequate prenatal care and infants transferred to another facility. 3
Due to the collection method for these data, information is underestimated.
21
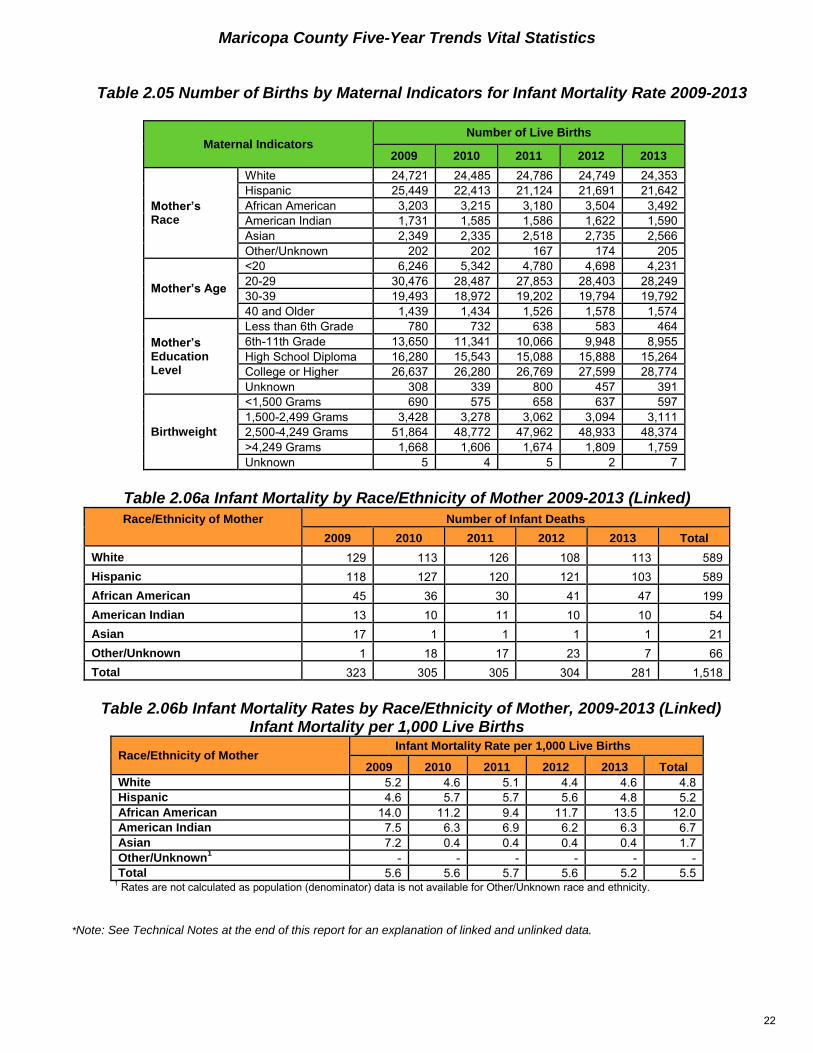
Maricopa County Five-Year Trends Vital Statistics
Table 2.05 Number of Births by Maternal Indicators for Infant Mortality Rate 2009-2013
Maternal Indicators Number of Live Births
2009 2010 2011 2012 2013
Mother’s Race
White 24,721 24,485 24,786 24,749 24,353
Hispanic 25,449 22,413 21,124 21,691 21,642
African American 3,203 3,215 3,180 3,504 3,492
American Indian 1,731 1,585 1,586 1,622 1,590
Asian 2,349 2,335 2,518 2,735 2,566
Other/Unknown 202 202 167 174 205
Mother’s Age
<20 6,246 5,342 4,780 4,698 4,231
20-29 30,476 28,487 27,853 28,403 28,249
30-39 19,493 18,972 19,202 19,794 19,792
40 and Older 1,439 1,434 1,526 1,578 1,574
Mother’s Education Level
Less than 6th Grade 780 732 638 583 464
6th-11th Grade 13,650 11,341 10,066 9,948 8,955
High School Diploma 16,280 15,543 15,088 15,888 15,264
College or Higher 26,637 26,280 26,769 27,599 28,774
Unknown 308 339 800 457 391
Birthweight
<1,500 Grams 690 575 658 637 597
1,500-2,499 Grams 3,428 3,278 3,062 3,094 3,111
2,500-4,249 Grams 51,864 48,772 47,962 48,933 48,374
>4,249 Grams 1,668 1,606 1,674 1,809 1,759
Unknown 5 4 5 2 7
Table 2.06a Infant Mortality by Race/Ethnicity of Mother 2009-2013 (Linked)
Race/Ethnicity of Mother Number of Infant Deaths
2009 2010 2011 2012 2013 Total
White 129 113 126 108 113 589
Hispanic 118 127 120 121 103 589
African American 45 36 30 41 47 199
American Indian 13 10 11 10 10 54
Asian 17 1 1 1 1 21
Other/Unknown 1 18 17 23 7 66
Total 323 305 305 304 281 1,518
Table 2.06b Infant Mortality Rates by Race/Ethnicity of Mother, 2009-2013 (Linked) Infant Mortality per 1,000 Live Births
Race/Ethnicity of Mother Infant Mortality Rate per 1,000 Live Births
2009 2010 2011 2012 2013 Total
White 5.2 4.6 5.1 4.4 4.6 4.8
Hispanic 4.6 5.7 5.7 5.6 4.8 5.2
African American 14.0 11.2 9.4 11.7 13.5 12.0
American Indian 7.5 6.3 6.9 6.2 6.3 6.7
Asian 7.2 0.4 0.4 0.4 0.4 1.7
Other/Unknown1
- - - - - -
Total 5.6 5.6 5.7 5.6 5.2 5.5 1
Rates are not calculated as population (denominator) data is not available for Other/Unknown race and ethnicity.
*Note: See Technical Notes at the end of this report for an explanation of linked and unlinked data.
22
Maricopa County Five-Year Trends Vital Statistics
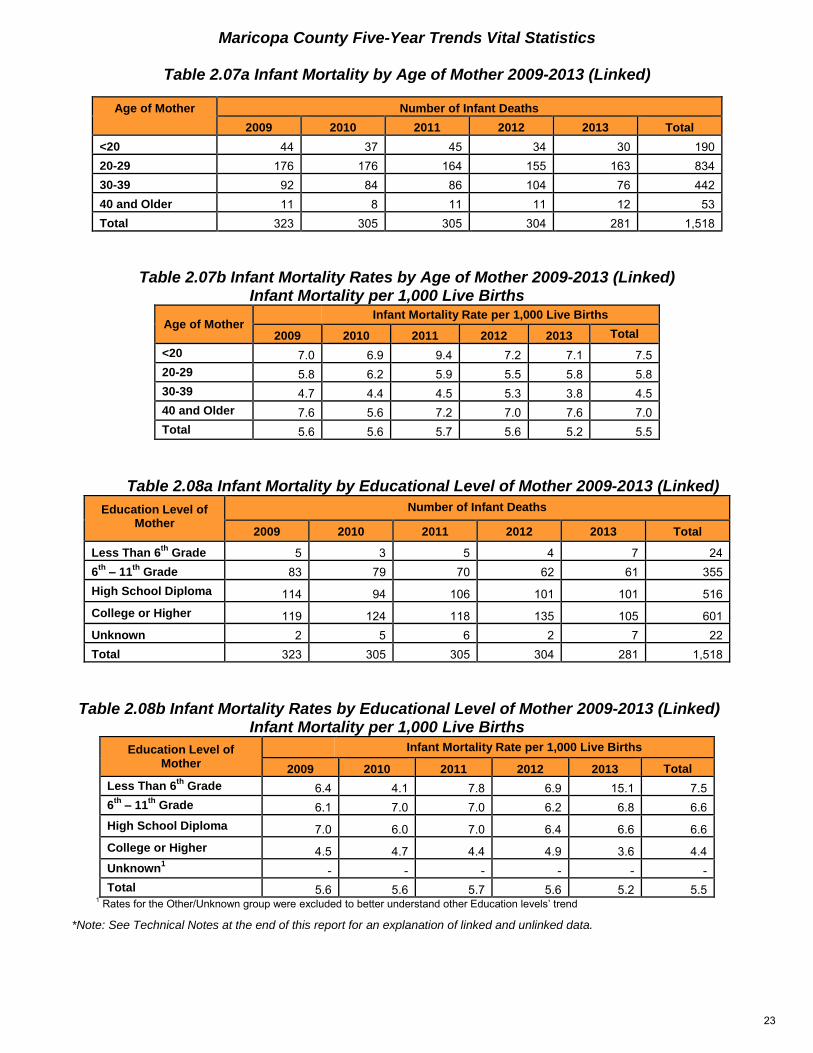
Table 2.07a Infant Mortality by Age of Mother 2009-2013 (Linked)
Table 2.07b Infant Mortality Rates by Age of Mother 2009-2013 (Linked) Infant Mortality per 1,000 Live Births
Age of Mother Infant Mortality Rate per 1,000 Live Births
2009 2010 2011 2012 2013 Total
<20 7.0 6.9 9.4 7.2 7.1 7.5
20-29 5.8 6.2 5.9 5.5 5.8 5.8
30-39 4.7 4.4 4.5 5.3 3.8 4.5
40 and Older 7.6 5.6 7.2 7.0 7.6 7.0
Total 5.6 5.6 5.7 5.6 5.2 5.5
Table 2.08a Infant Mortality by Educational Level of Mother 2009-2013 (Linked)
Education Level of Mother
Number of Infant Deaths
2009 2010 2011 2012 2013 Total
Less Than 6th
Grade 5 3 5 4 7 24
6th
– 11th
Grade 83 79 70 62 61 355
High School Diploma 114 94 106 101 101 516
College or Higher 119 124 118 135 105 601
Unknown 2 5 6 2 7 22
Total 323 305 305 304 281 1,518
Table 2.08b Infant Mortality Rates by Educational Level of Mother 2009-2013 (Linked) Infant Mortality per 1,000 Live Births
Education Level of Mother
Infant Mortality Rate per 1,000 Live Births
2009 2010 2011 2012 2013 Total
Less Than 6th
Grade 6.4 4.1 7.8 6.9 15.1 7.5
6th
– 11th
Grade 6.1 7.0 7.0 6.2 6.8 6.6
High School Diploma 7.0 6.0 7.0 6.4 6.6 6.6
College or Higher 4.5 4.7 4.4 4.9 3.6 4.4
Unknown1
- - - - - -
Total 5.6 5.6 5.7 5.6 5.2 5.5 1 Rates for the Other/Unknown group were excluded to better understand other Education levels’ trend
*Note: See Technical Notes at the end of this report for an explanation of linked and unlinked data.
Age of Mother Number of Infant Deaths
2009 2010 2011 2012 2013 Total
<20 44 37 45 34 30 190
20-29 176 176 164 155 163 834
30-39 92 84 86 104 76 442
40 and Older 11 8 11 11 12 53
Total 323 305 305 304 281 1,518
23

Maricopa County Five-Year Trends Vital Statistics
Table 2.09a Infant Mortality by Birthweight 2009-2013 (Linked)
Birthweight Number of Infant Deaths
2009 2010 2011 2012 2013 Total
<1500 Grams 174 152 162 152 145 785
1500-2499 Grams 44 40 50 56 37 227
2500-4249 Grams 100 109 86 94 95 484
>4249 Grams 4 3 6 2 2 17
Unknown 1 1 1 0 2 5
Total 323 305 305 304 281 1,518
Table 2.09b Infant Mortality Rates by Birthweight 2009-2013 (Linked) Infant Mortality per 1,000 Live Births
Birthweight Infant Mortality Rate per 1,000 Live Births
2009 2010 2011 2012 2013 Total
<1500 Grams 252.2 264.3 246.2 238.6 242.9 248.7
1500-2499 Grams 12.8 12.2 16.3 18.1 11.9 14.2
2500-4249 Grams 1.9 2.2 1.8 1.9 2.0 2.0
>4249 Grams 2.4 1.9 3.6 1.1 1.1 2.0
Unknown1
- - - - - -
Total 5.6 5.6 5.7 5.6 5.2 5.5 1
Rates are not calculated for Other/Unknown race and ethnicity due to unreliable/unstable counts.
*Note: See Technical Notes at the end of this report for an explanation of linked and unlinked data.
24
Maricopa County Five-Year Trends Vital Statistics
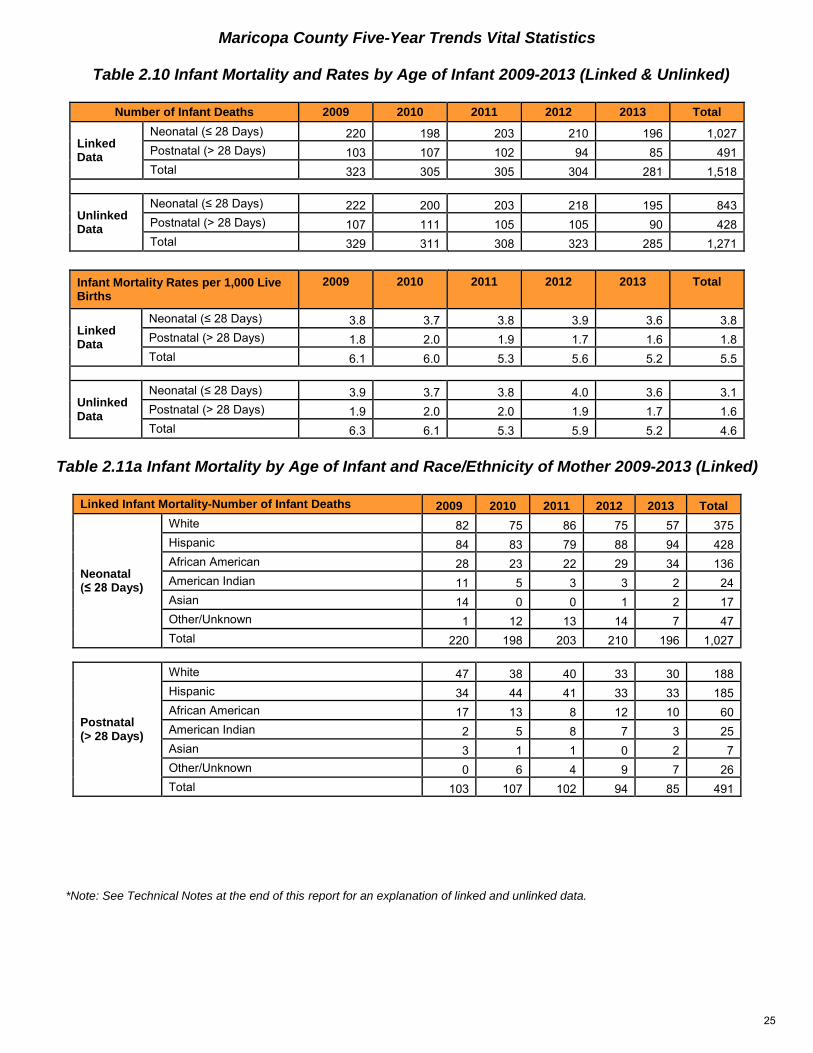
Table 2.10 Infant Mortality and Rates by Age of Infant 2009-2013 (Linked & Unlinked)
Number of Infant Deaths 2009 2010 2011 2012 2013 Total
Linked Data
Neonatal (≤ 28 Days) 220 198 203 210 196 1,027
Postnatal (> 28 Days) 103 107 102 94 85 491
Total 323 305 305 304 281 1,518
Unlinked Data
Neonatal (≤ 28 Days) 222 200 203 218 195 843
Postnatal (> 28 Days) 107 111 105 105 90 428
Total 329 311 308 323 285 1,271
Infant Mortality Rates per 1,000 Live Births
2009 2010 2011 2012 2013 Total
Linked Data
Neonatal (≤ 28 Days) 3.8 3.7 3.8 3.9 3.6 3.8
Postnatal (> 28 Days) 1.8 2.0 1.9 1.7 1.6 1.8
Total 6.1 6.0 5.3 5.6 5.2 5.5
Unlinked Data
Neonatal (≤ 28 Days) 3.9 3.7 3.8 4.0 3.6 3.1
Postnatal (> 28 Days) 1.9 2.0 2.0 1.9 1.7 1.6
Total 6.3 6.1 5.3 5.9 5.2 4.6
Table 2.11a Infant Mortality by Age of Infant and Race/Ethnicity of Mother 2009-2013 (Linked)
Linked Infant Mortality-Number of Infant Deaths 2009 2010 2011 2012 2013 Total
Neonatal (≤ 28 Days)
White 82 75 86 75 57 375
Hispanic 84 83 79 88 94 428
African American 28 23 22 29 34 136
American Indian 11 5 3 3 2 24
Asian 14 0 0 1 2 17
Other/Unknown 1 12 13 14 7 47
Total 220 198 203 210 196 1,027
Postnatal (> 28 Days)
White 47 38 40 33 30 188
Hispanic 34 44 41 33 33 185
African American 17 13 8 12 10 60
American Indian 2 5 8 7 3 25
Asian 3 1 1 0 2 7
Other/Unknown 0 6 4 9 7 26
Total 103 107 102 94 85 491
*Note: See Technical Notes at the end of this report for an explanation of linked and unlinked data.
25
Maricopa County Five-Year Trends Vital Statistics
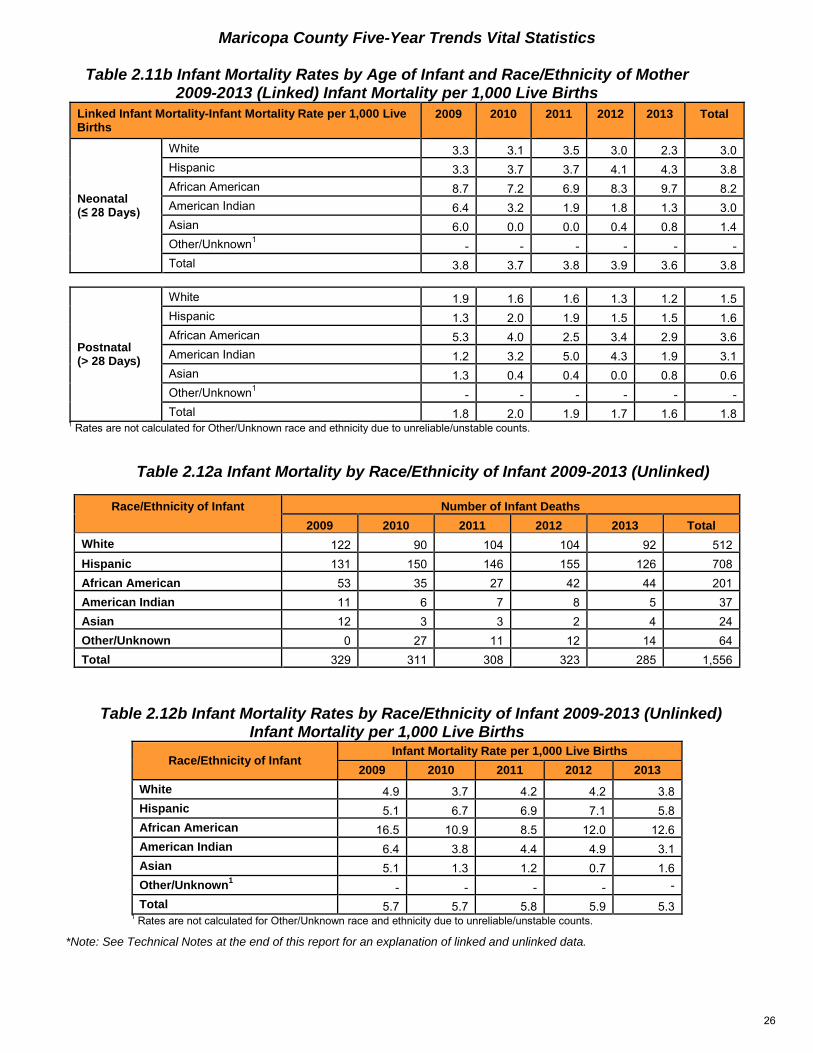
Table 2.11b Infant Mortality Rates by Age of Infant and Race/Ethnicity of Mother 2009-2013 (Linked) Infant Mortality per 1,000 Live Births
Linked Infant Mortality-Infant Mortality Rate per 1,000 Live Births
2009 2010 2011 2012 2013 Total
Neonatal (≤ 28 Days)
White 3.3 3.1 3.5 3.0 2.3 3.0
Hispanic 3.3 3.7 3.7 4.1 4.3 3.8
African American 8.7 7.2 6.9 8.3 9.7 8.2
American Indian 6.4 3.2 1.9 1.8 1.3 3.0
Asian 6.0 0.0 0.0 0.4 0.8 1.4
Other/Unknown1
- - - - - -
Total 3.8 3.7 3.8 3.9 3.6 3.8
Postnatal (> 28 Days)
White 1.9 1.6 1.6 1.3 1.2 1.5
Hispanic 1.3 2.0 1.9 1.5 1.5 1.6
African American 5.3 4.0 2.5 3.4 2.9 3.6
American Indian 1.2 3.2 5.0 4.3 1.9 3.1
Asian 1.3 0.4 0.4 0.0 0.8 0.6
Other/Unknown1
- - - - - -
Total 1.8 2.0 1.9 1.7 1.6 1.8 1
Rates are not calculated for Other/Unknown race and ethnicity due to unreliable/unstable counts.
Table 2.12a Infant Mortality by Race/Ethnicity of Infant 2009-2013 (Unlinked)
Table 2.12b Infant Mortality Rates by Race/Ethnicity of Infant 2009-2013 (Unlinked) Infant Mortality per 1,000 Live Births
Race/Ethnicity of Infant Infant Mortality Rate per 1,000 Live Births
2009 2010 2011 2012 2013
White 4.9 3.7 4.2 4.2 3.8
Hispanic 5.1 6.7 6.9 7.1 5.8
African American 16.5 10.9 8.5 12.0 12.6
American Indian 6.4 3.8 4.4 4.9 3.1
Asian 5.1 1.3 1.2 0.7 1.6
Other/Unknown1
- - - - -
Total 5.7 5.7 5.8 5.9 5.3 1
Rates are not calculated for Other/Unknown race and ethnicity due to unreliable/unstable counts.
*Note: See Technical Notes at the end of this report for an explanation of linked and unlinked data.
Race/Ethnicity of Infant Number of Infant Deaths
2009 2010 2011 2012 2013 Total
White 122 90 104 104 92 512
Hispanic 131 150 146 155 126 708
African American 53 35 27 42 44 201
American Indian 11 6 7 8 5 37
Asian 12 3 3 2 4 24
Other/Unknown 0 27 11 12 14 64
Total 329 311 308 323 285 1,556
26
Maricopa County Five-Year Trends Communicable Disease Statistics
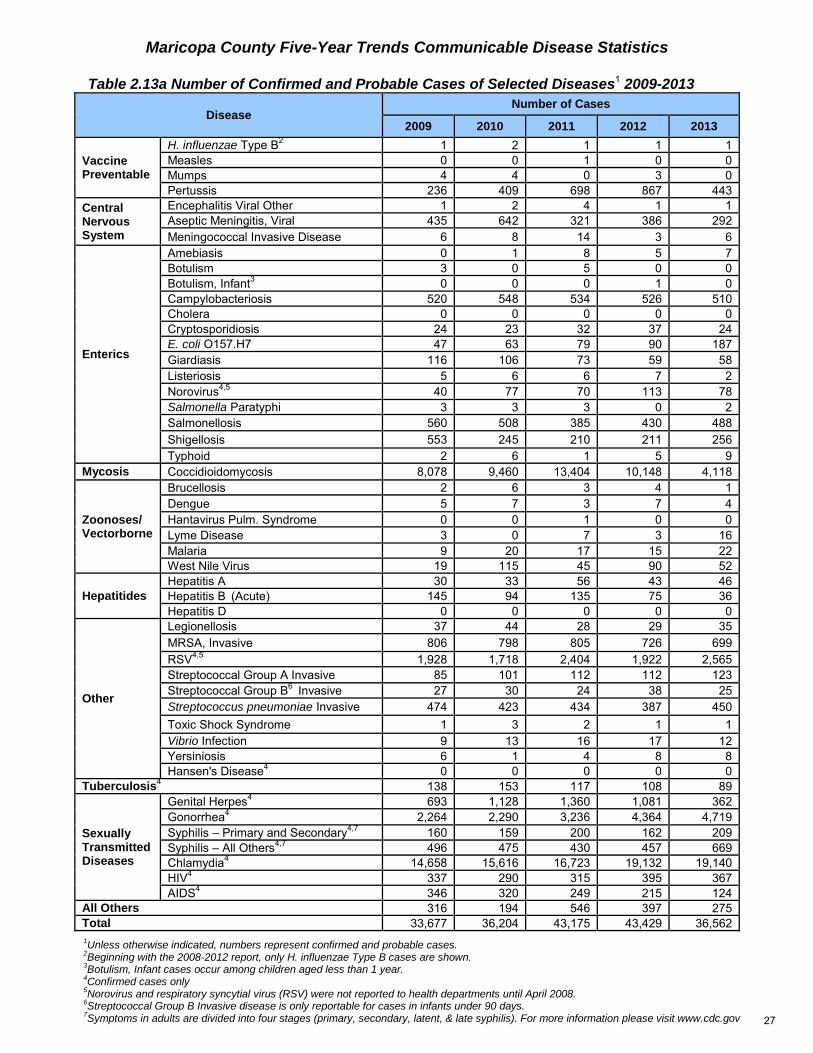
Table 2.13a Number of Confirmed and Probable Cases of Selected Diseases1 2009-2013
Disease Number of Cases
2009 2010 2011 2012 2013
Vaccine Preventable
H. influenzae Type B2
1 2 1 1 1
Measles 0 0 1 0 0
Mumps 4 4 0 3 0
Pertussis 236 409 698 867 443
Central Nervous System
Encephalitis Viral Other 1 2 4 1 1
Aseptic Meningitis, Viral 435 642 321 386 292
Meningococcal Invasive Disease 6 8 14 3 6
Enterics
Amebiasis 0 1 8 5 7
Botulism 3 0 5 0 0
Botulism, Infant3
0 0 0 1 0
Campylobacteriosis 520 548 534 526 510
Cholera 0 0 0 0 0
Cryptosporidiosis 24 23 32 37 24
E. coli O157.H7 47 63 79 90 187
Giardiasis 116 106 73 59 58
Listeriosis 5 6 6 7 2
Norovirus4,5
40 77 70 113 78
Salmonella Paratyphi 3 3 3 0 2
Salmonellosis 560 508 385 430 488
Shigellosis 553 245 210 211 256
Typhoid 2 6 1 5 9
Mycosis Coccidioidomycosis 8,078 9,460 13,404 10,148 4,118
Zoonoses/ Vectorborne
Brucellosis 2 6 3 4 1
Dengue 5 7 3 7 4
Hantavirus Pulm. Syndrome 0 0 1 0 0
Lyme Disease 3 0 7 3 16
Malaria 9 20 17 15 22
West Nile Virus 19 115 45 90 52
Hepatitides
Hepatitis A 30 33 56 43 46
Hepatitis B (Acute) 145 94 135 75 36
Hepatitis D 0 0 0 0 0
Other
Legionellosis 37 44 28 29 35
MRSA, Invasive 806 798 805 726 699
RSV4,5
1,928 1,718 2,404 1,922 2,565
Streptococcal Group A Invasive 85 101 112 112 123
Streptococcal Group B6
Invasive 27 30 24 38 25
Streptococcus pneumoniae Invasive 474 423 434 387 450
Toxic Shock Syndrome 1 3 2 1 1
Vibrio Infection 9 13 16 17 12
Yersiniosis 6 1 4 8 8
Hansen's Disease4
0 0 0 0 0
Tuberculosis4
138 153 117 108 89
Sexually Transmitted Diseases
Genital Herpes4
693 1,128 1,360 1,081 362
Gonorrhea4
2,264 2,290 3,236 4,364 4,719
Syphilis – Primary and Secondary4,7
160 159 200 162 209
Syphilis – All Others4,7
496 475 430 457 669
Chlamydia4
14,658 15,616 16,723 19,132 19,140
HIV4
337 290 315 395 367
AIDS4
346 320 249 215 124
All Others 316 194 546 397 275
Total 33,677 36,204 43,175 43,429 36,562
1Unless otherwise indicated, numbers represent confirmed and probable cases.
2Beginning with the 2008-2012 report, only H. influenzae Type B cases are shown.
3Botulism, Infant cases occur among children aged less than 1 year.
4Confirmed cases only
5Norovirus and respiratory syncytial virus (RSV) were not reported to health departments until April 2008.
6Streptococcal Group B Invasive disease is only reportable for cases in infants under 90 days.
7Symptoms in adults are divided into four stages (primary, secondary, latent, & late syphilis). For more information please visit www.cdc.gov 27
Maricopa County Five-Year Trends Communicable Disease Statistics
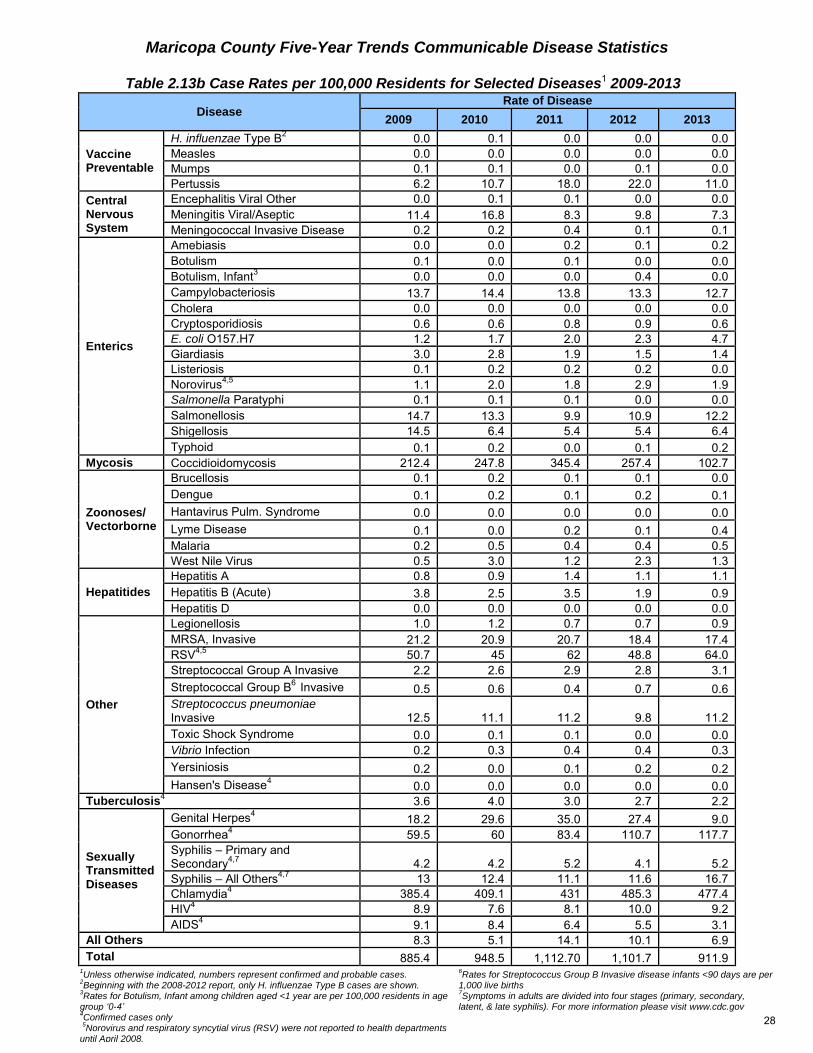
Table 2.13b Case Rates per 100,000 Residents for Selected Diseases1 2009-2013
Disease Rate of Disease
2009 2010 2011 2012 2013
Vaccine Preventable
H. influenzae Type B2
0.0 0.1 0.0 0.0 0.0
Measles 0.0 0.0 0.0 0.0 0.0
Mumps 0.1 0.1 0.0 0.1 0.0
Pertussis 6.2 10.7 18.0 22.0 11.0
Central Nervous System
Encephalitis Viral Other 0.0 0.1 0.1 0.0 0.0
Meningitis Viral/Aseptic 11.4 16.8 8.3 9.8 7.3
Meningococcal Invasive Disease 0.2 0.2 0.4 0.1 0.1
Enterics
Amebiasis 0.0 0.0 0.2 0.1 0.2
Botulism 0.1 0.0 0.1 0.0 0.0
Botulism, Infant3
0.0 0.0 0.0 0.4 0.0
Campylobacteriosis 13.7 14.4 13.8 13.3 12.7
Cholera 0.0 0.0 0.0 0.0 0.0
Cryptosporidiosis 0.6 0.6 0.8 0.9 0.6
E. coli O157.H7 1.2 1.7 2.0 2.3 4.7
Giardiasis 3.0 2.8 1.9 1.5 1.4
Listeriosis 0.1 0.2 0.2 0.2 0.0
Norovirus4,5
1.1 2.0 1.8 2.9 1.9
Salmonella Paratyphi 0.1 0.1 0.1 0.0 0.0
Salmonellosis 14.7 13.3 9.9 10.9 12.2
Shigellosis 14.5 6.4 5.4 5.4 6.4
Typhoid 0.1 0.2 0.0 0.1 0.2
Mycosis Coccidioidomycosis 212.4 247.8 345.4 257.4 102.7
Zoonoses/ Vectorborne
Brucellosis 0.1 0.2 0.1 0.1 0.0
Dengue 0.1 0.2 0.1 0.2 0.1
Hantavirus Pulm. Syndrome 0.0 0.0 0.0 0.0 0.0
Lyme Disease 0.1 0.0 0.2 0.1 0.4
Malaria 0.2 0.5 0.4 0.4 0.5
West Nile Virus 0.5 3.0 1.2 2.3 1.3
Hepatitides
Hepatitis A 0.8 0.9 1.4 1.1 1.1
Hepatitis B (Acute) 3.8 2.5 3.5 1.9 0.9
Hepatitis D 0.0 0.0 0.0 0.0 0.0
Other
Legionellosis 1.0 1.2 0.7 0.7 0.9
MRSA, Invasive 21.2 20.9 20.7 18.4 17.4
RSV4,5
50.7 45 62 48.8 64.0
Streptococcal Group A Invasive 2.2 2.6 2.9 2.8 3.1
Streptococcal Group B6
Invasive 0.5 0.6 0.4 0.7 0.6
Streptococcus pneumoniae Invasive 12.5 11.1 11.2 9.8 11.2
Toxic Shock Syndrome 0.0 0.1 0.1 0.0 0.0
Vibrio Infection 0.2 0.3 0.4 0.4 0.3
Yersiniosis 0.2 0.0 0.1 0.2 0.2
Hansen's Disease4
0.0 0.0 0.0 0.0 0.0
Tuberculosis4
3.6 4.0 3.0 2.7 2.2
Sexually Transmitted Diseases
Genital Herpes4
18.2 29.6 35.0 27.4 9.0
Gonorrhea4
59.5 60 83.4 110.7 117.7
Syphilis – Primary and Secondary
4,74.2 4.2 5.2 4.1 5.2
Syphilis – All Others4,7
13 12.4 11.1 11.6 16.7
Chlamydia4
385.4 409.1 431 485.3 477.4
HIV4
8.9 7.6 8.1 10.0 9.2
AIDS4
9.1 8.4 6.4 5.5 3.1
All Others 8.3 5.1 14.1 10.1 6.9
Total 885.4 948.5 1,112.70 1,101.7 911.9
6Rates for Streptococcus Group B Invasive disease infants <90 days are per
1,000 live births 7Symptoms in adults are divided into four stages (primary, secondary,
latent, & late syphilis). For more information please visit www.cdc.gov
1Unless otherwise indicated, numbers represent confirmed and probable cases.
2Beginning with the 2008-2012 report, only H. influenzae Type B cases are shown.
3Rates for Botulism, Infant among children aged <1 year are per 100,000 residents in age
group ‘0-4’ 4Confirmed cases only 5Norovirus and respiratory syncytial virus (RSV) were not reported to health departments
until April 2008.
28
Maricopa County Five-Year Trends Communicable Disease Statistics
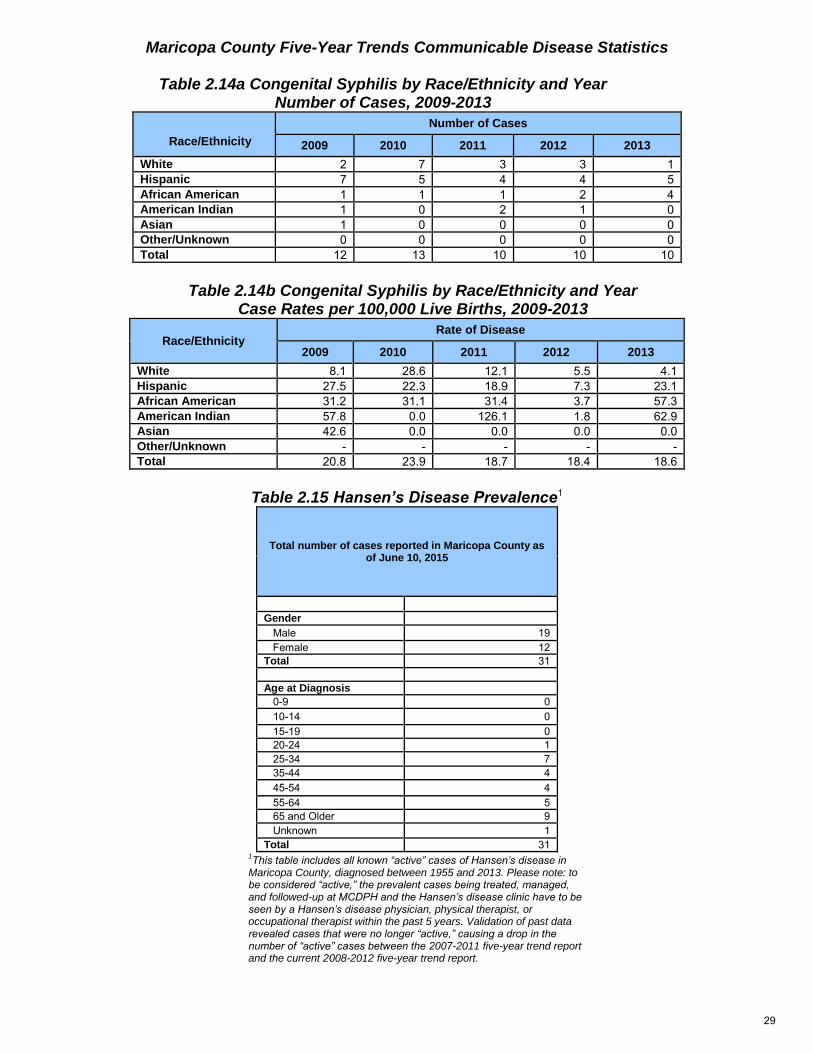
Table 2.14a Congenital Syphilis by Race/Ethnicity and Year Number of Cases, 2009-2013
Race/Ethnicity
Number of Cases
2009 2010 2011 2012 2013
White 2 7 3 3 1
Hispanic 7 5 4 4 5
African American 1 1 1 2 4
American Indian 1 0 2 1 0
Asian 1 0 0 0 0
Other/Unknown 0 0 0 0 0
Total 12 13 10 10 10
Table 2.14b Congenital Syphilis by Race/Ethnicity and Year Case Rates per 100,000 Live Births, 2009-2013
Race/Ethnicity Rate of Disease
2009 2010 2011 2012 2013
White 8.1 28.6 12.1 5.5 4.1
Hispanic 27.5 22.3 18.9 7.3 23.1
African American 31.2 31.1 31.4 3.7 57.3
American Indian 57.8 0.0 126.1 1.8 62.9
Asian 42.6 0.0 0.0 0.0 0.0
Other/Unknown - - - - -
Total 20.8 23.9 18.7 18.4 18.6
Table 2.15 Hansen’s Disease Prevalence1
Total number of cases reported in Maricopa County as of June 10, 2015
Gender
Male 19
Female 12
Total 31
Age at Diagnosis
0-9 0
10-14 0
15-19 0
20-24 1
25-34 7
35-44 4
45-54 4
55-64 5
65 and Older 9
Unknown 1
Total 31 1This table includes all known “active” cases of Hansen’s disease in
Maricopa County, diagnosed between 1955 and 2013. Please note: to be considered “active,” the prevalent cases being treated, managed, and followed-up at MCDPH and the Hansen’s disease clinic have to be seen by a Hansen’s disease physician, physical therapist, or occupational therapist within the past 5 years. Validation of past data revealed cases that were no longer “active,” causing a drop in the number of “active” cases between the 2007-2011 five-year trend report and the current 2008-2012 five-year trend report.
29
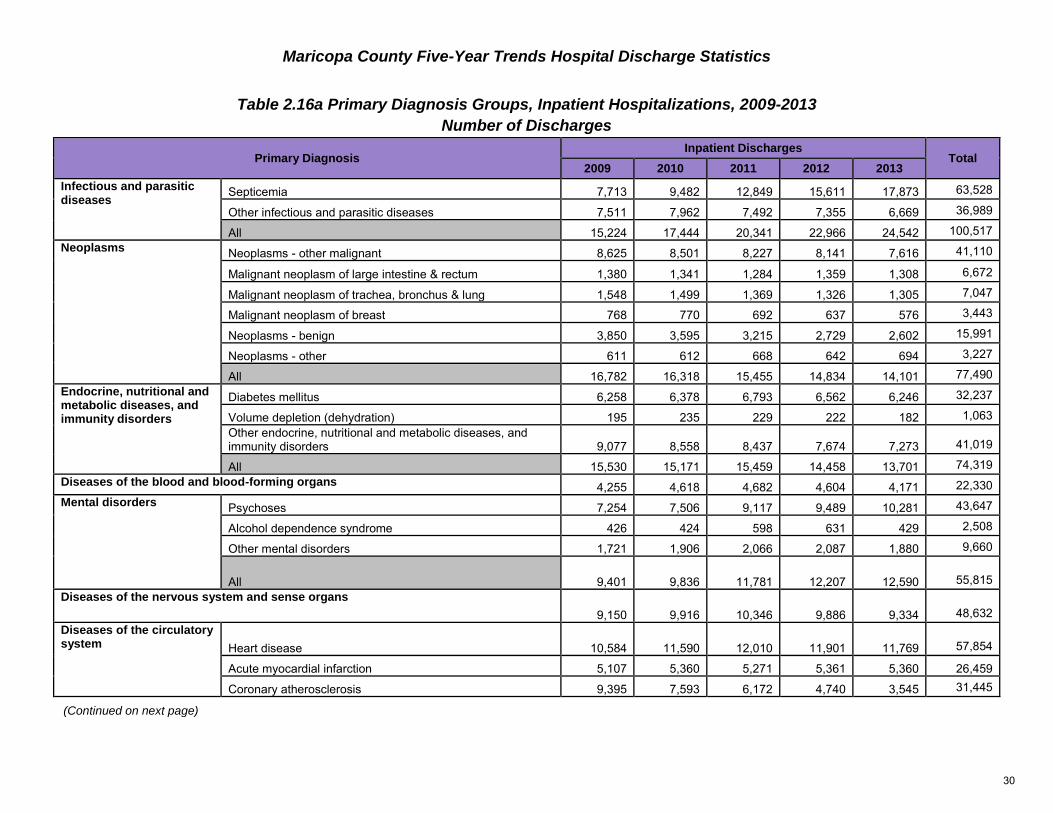
Maricopa County Five-Year Trends Hospital Discharge Statistics
Table 2.16a Primary Diagnosis Groups, Inpatient Hospitalizations, 2009-2013
Number of Discharges
Primary Diagnosis Inpatient Discharges
Total 2009 2010 2011 2012 2013
Infectious and parasitic diseases
Septicemia 7,713 9,482 12,849 15,611 17,873 63,528
Other infectious and parasitic diseases 7,511 7,962 7,492 7,355 6,669 36,989
All 15,224 17,444 20,341 22,966 24,542 100,517
Neoplasms Neoplasms - other malignant 8,625 8,501 8,227 8,141 7,616 41,110
Malignant neoplasm of large intestine & rectum 1,380 1,341 1,284 1,359 1,308 6,672
Malignant neoplasm of trachea, bronchus & lung 1,548 1,499 1,369 1,326 1,305 7,047
Malignant neoplasm of breast 768 770 692 637 576 3,443
Neoplasms - benign 3,850 3,595 3,215 2,729 2,602 15,991
Neoplasms - other 611 612 668 642 694 3,227
All 16,782 16,318 15,455 14,834 14,101 77,490
Endocrine, nutritional and metabolic diseases, and immunity disorders
Diabetes mellitus 6,258 6,378 6,793 6,562 6,246 32,237
Volume depletion (dehydration) 195 235 229 222 182 1,063
Other endocrine, nutritional and metabolic diseases, and immunity disorders 9,077 8,558 8,437 7,674 7,273 41,019
All 15,530 15,171 15,459 14,458 13,701 74,319
Diseases of the blood and blood-forming organs 4,255 4,618 4,682 4,604 4,171 22,330
Mental disorders Psychoses 7,254 7,506 9,117 9,489 10,281 43,647
Alcohol dependence syndrome 426 424 598 631 429 2,508
Other mental disorders 1,721 1,906 2,066 2,087 1,880 9,660
All 9,401 9,836 11,781 12,207 12,590 55,815
Diseases of the nervous system and sense organs
9,150 9,916 10,346 9,886 9,334 48,632
Diseases of the circulatory system Heart disease 10,584 11,590 12,010 11,901 11,769 57,854
Acute myocardial infarction 5,107 5,360 5,271 5,361 5,360 26,459
Coronary atherosclerosis 9,395 7,593 6,172 4,740 3,545 31,445
(Continued on next page)
30
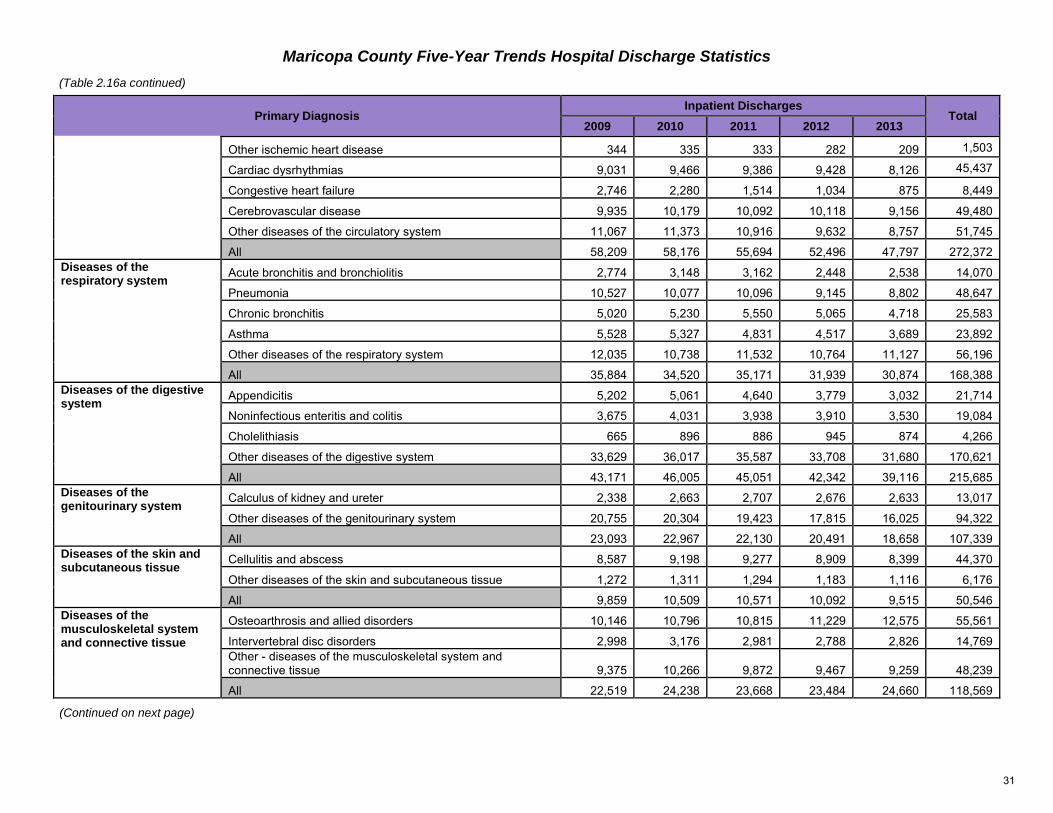
Maricopa County Five-Year Trends Hospital Discharge Statistics
Primary Diagnosis Inpatient Discharges
Total 2009 2010 2011 2012 2013
Other ischemic heart disease 344 335 333 282 209 1,503
Cardiac dysrhythmias 9,031 9,466 9,386 9,428 8,126 45,437
Congestive heart failure 2,746 2,280 1,514 1,034 875 8,449
Cerebrovascular disease 9,935 10,179 10,092 10,118 9,156 49,480
Other diseases of the circulatory system 11,067 11,373 10,916 9,632 8,757 51,745
All 58,209 58,176 55,694 52,496 47,797 272,372
Diseases of the respiratory system
Acute bronchitis and bronchiolitis 2,774 3,148 3,162 2,448 2,538 14,070
Pneumonia 10,527 10,077 10,096 9,145 8,802 48,647
Chronic bronchitis 5,020 5,230 5,550 5,065 4,718 25,583
Asthma 5,528 5,327 4,831 4,517 3,689 23,892
Other diseases of the respiratory system 12,035 10,738 11,532 10,764 11,127 56,196
All 35,884 34,520 35,171 31,939 30,874 168,388
Diseases of the digestive system
Appendicitis 5,202 5,061 4,640 3,779 3,032 21,714
Noninfectious enteritis and colitis 3,675 4,031 3,938 3,910 3,530 19,084
Cholelithiasis 665 896 886 945 874 4,266
Other diseases of the digestive system 33,629 36,017 35,587 33,708 31,680 170,621
All 43,171 46,005 45,051 42,342 39,116 215,685
Diseases of the genitourinary system
Calculus of kidney and ureter 2,338 2,663 2,707 2,676 2,633 13,017
Other diseases of the genitourinary system 20,755 20,304 19,423 17,815 16,025 94,322
All 23,093 22,967 22,130 20,491 18,658 107,339
Diseases of the skin and subcutaneous tissue
Cellulitis and abscess 8,587 9,198 9,277 8,909 8,399 44,370
Other diseases of the skin and subcutaneous tissue 1,272 1,311 1,294 1,183 1,116 6,176
All 9,859 10,509 10,571 10,092 9,515 50,546
Diseases of the musculoskeletal system and connective tissue
Osteoarthrosis and allied disorders 10,146 10,796 10,815 11,229 12,575 55,561
Intervertebral disc disorders 2,998 3,176 2,981 2,788 2,826 14,769
Other - diseases of the musculoskeletal system and connective tissue 9,375 10,266 9,872 9,467 9,259 48,239
All 22,519 24,238 23,668 23,484 24,660 118,569
(Table 2.16a continued)
(Continued on next page)
31
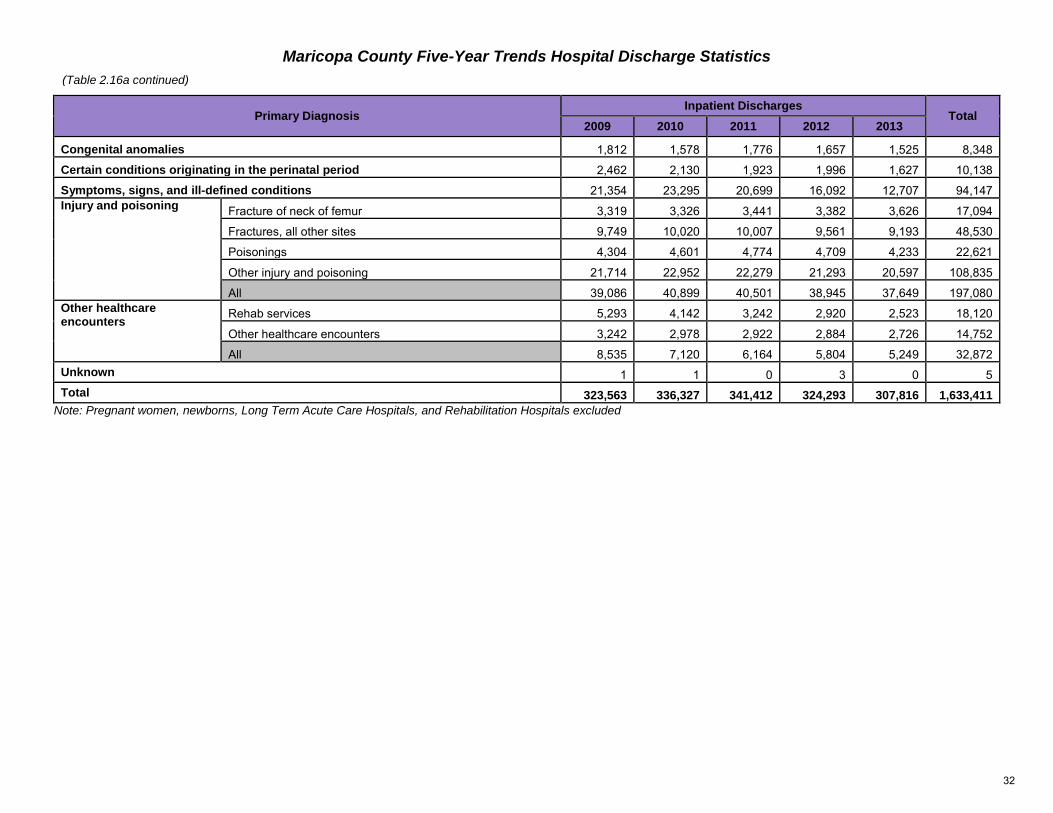
Maricopa County Five-Year Trends Hospital Discharge Statistics
Primary Diagnosis Inpatient Discharges
Total 2009 2010 2011 2012 2013
Congenital anomalies 1,812 1,578 1,776 1,657 1,525 8,348
Certain conditions originating in the perinatal period 2,462 2,130 1,923 1,996 1,627 10,138
Symptoms, signs, and ill-defined conditions 21,354 23,295 20,699 16,092 12,707 94,147
Injury and poisoning Fracture of neck of femur 3,319 3,326 3,441 3,382 3,626 17,094
Fractures, all other sites 9,749 10,020 10,007 9,561 9,193 48,530
Poisonings 4,304 4,601 4,774 4,709 4,233 22,621
Other injury and poisoning 21,714 22,952 22,279 21,293 20,597 108,835
All 39,086 40,899 40,501 38,945 37,649 197,080
Other healthcare encounters
Rehab services 5,293 4,142 3,242 2,920 2,523 18,120
Other healthcare encounters 3,242 2,978 2,922 2,884 2,726 14,752
All 8,535 7,120 6,164 5,804 5,249 32,872
Unknown 1 1 0 3 0 5
Total 323,563 336,327 341,412 324,293 307,816 1,633,411
Note: Pregnant women, newborns, Long Term Acute Care Hospitals, and Rehabilitation Hospitals excluded
(Table 2.16a continued)
32
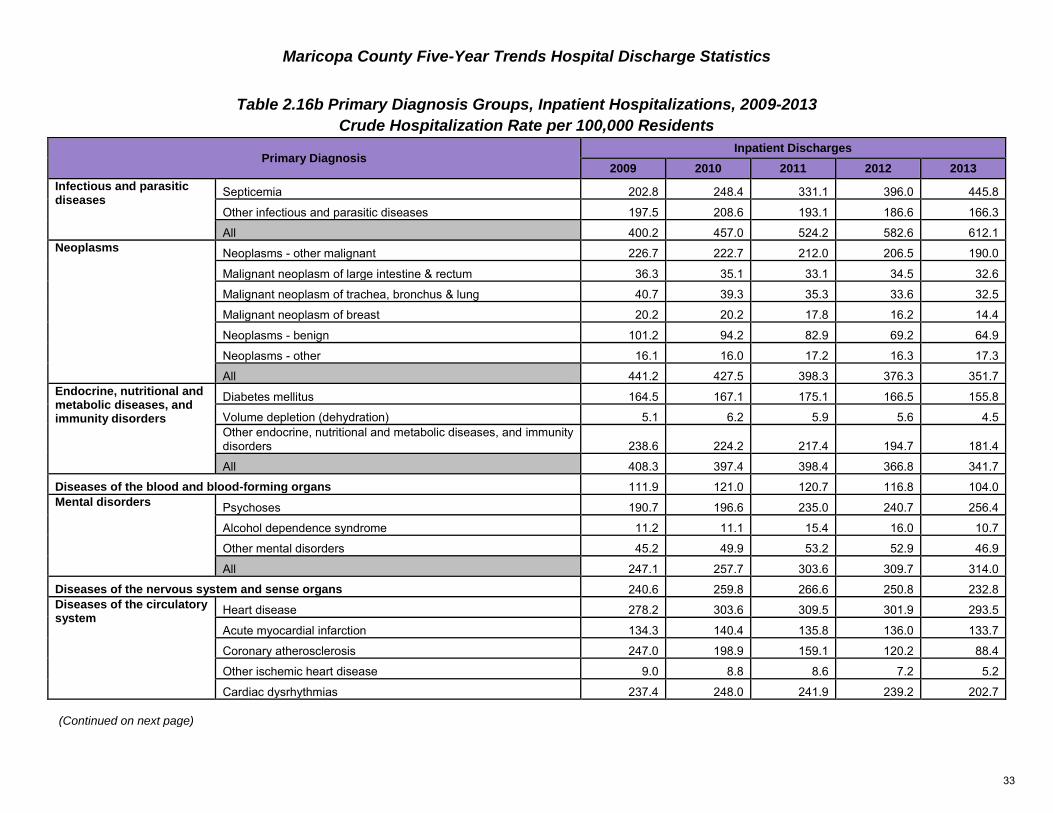
Maricopa County Five-Year Trends Hospital Discharge Statistics
Table 2.16b Primary Diagnosis Groups, Inpatient Hospitalizations, 2009-2013
Crude Hospitalization Rate per 100,000 Residents
Primary Diagnosis Inpatient Discharges
2009 2010 2011 2012 2013
Infectious and parasitic diseases
Septicemia 202.8 248.4 331.1 396.0 445.8
Other infectious and parasitic diseases 197.5 208.6 193.1 186.6 166.3
All 400.2 457.0 524.2 582.6 612.1
Neoplasms Neoplasms - other malignant 226.7 222.7 212.0 206.5 190.0
Malignant neoplasm of large intestine & rectum 36.3 35.1 33.1 34.5 32.6
Malignant neoplasm of trachea, bronchus & lung 40.7 39.3 35.3 33.6 32.5
Malignant neoplasm of breast 20.2 20.2 17.8 16.2 14.4
Neoplasms - benign 101.2 94.2 82.9 69.2 64.9
Neoplasms - other 16.1 16.0 17.2 16.3 17.3
All 441.2 427.5 398.3 376.3 351.7
Endocrine, nutritional and metabolic diseases, and immunity disorders
Diabetes mellitus 164.5 167.1 175.1 166.5 155.8
Volume depletion (dehydration) 5.1 6.2 5.9 5.6 4.5
Other endocrine, nutritional and metabolic diseases, and immunity disorders 238.6 224.2 217.4 194.7 181.4
All 408.3 397.4 398.4 366.8 341.7
Diseases of the blood and blood-forming organs 111.9 121.0 120.7 116.8 104.0
Mental disorders Psychoses 190.7 196.6 235.0 240.7 256.4
Alcohol dependence syndrome 11.2 11.1 15.4 16.0 10.7
Other mental disorders 45.2 49.9 53.2 52.9 46.9
All 247.1 257.7 303.6 309.7 314.0
Diseases of the nervous system and sense organs 240.6 259.8 266.6 250.8 232.8
Diseases of the circulatory system
Heart disease 278.2 303.6 309.5 301.9 293.5
Acute myocardial infarction 134.3 140.4 135.8 136.0 133.7
Coronary atherosclerosis 247.0 198.9 159.1 120.2 88.4
Other ischemic heart disease 9.0 8.8 8.6 7.2 5.2
Cardiac dysrhythmias 237.4 248.0 241.9 239.2 202.7
(Continued on next page)
33
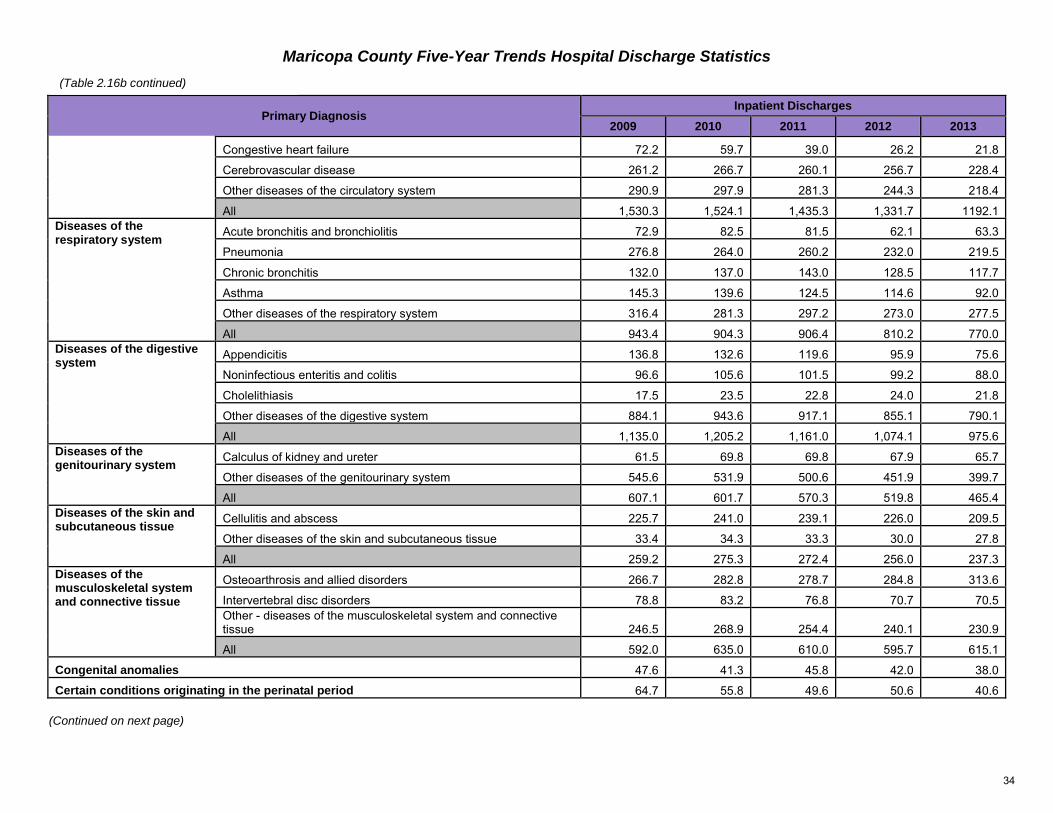
Maricopa County Five-Year Trends Hospital Discharge Statistics
Primary Diagnosis Inpatient Discharges
2009 2010 2011 2012 2013
Congestive heart failure 72.2 59.7 39.0 26.2 21.8
Cerebrovascular disease 261.2 266.7 260.1 256.7 228.4
Other diseases of the circulatory system 290.9 297.9 281.3 244.3 218.4
All 1,530.3 1,524.1 1,435.3 1,331.7 1192.1
Diseases of the respiratory system
Acute bronchitis and bronchiolitis 72.9 82.5 81.5 62.1 63.3
Pneumonia 276.8 264.0 260.2 232.0 219.5
Chronic bronchitis 132.0 137.0 143.0 128.5 117.7
Asthma 145.3 139.6 124.5 114.6 92.0
Other diseases of the respiratory system 316.4 281.3 297.2 273.0 277.5
All 943.4 904.3 906.4 810.2 770.0
Diseases of the digestive system
Appendicitis 136.8 132.6 119.6 95.9 75.6
Noninfectious enteritis and colitis 96.6 105.6 101.5 99.2 88.0
Cholelithiasis 17.5 23.5 22.8 24.0 21.8
Other diseases of the digestive system 884.1 943.6 917.1 855.1 790.1
All 1,135.0 1,205.2 1,161.0 1,074.1 975.6
Diseases of the genitourinary system
Calculus of kidney and ureter 61.5 69.8 69.8 67.9 65.7
Other diseases of the genitourinary system 545.6 531.9 500.6 451.9 399.7
All 607.1 601.7 570.3 519.8 465.4
Diseases of the skin and subcutaneous tissue
Cellulitis and abscess 225.7 241.0 239.1 226.0 209.5
Other diseases of the skin and subcutaneous tissue 33.4 34.3 33.3 30.0 27.8
All 259.2 275.3 272.4 256.0 237.3
Diseases of the musculoskeletal system and connective tissue
Osteoarthrosis and allied disorders 266.7 282.8 278.7 284.8 313.6
Intervertebral disc disorders 78.8 83.2 76.8 70.7 70.5
Other - diseases of the musculoskeletal system and connective tissue 246.5 268.9 254.4 240.1 230.9
All 592.0 635.0 610.0 595.7 615.1
Congenital anomalies 47.6 41.3 45.8 42.0 38.0
Certain conditions originating in the perinatal period 64.7 55.8 49.6 50.6 40.6
(Table 2.16b continued)
(Continued on next page)
34
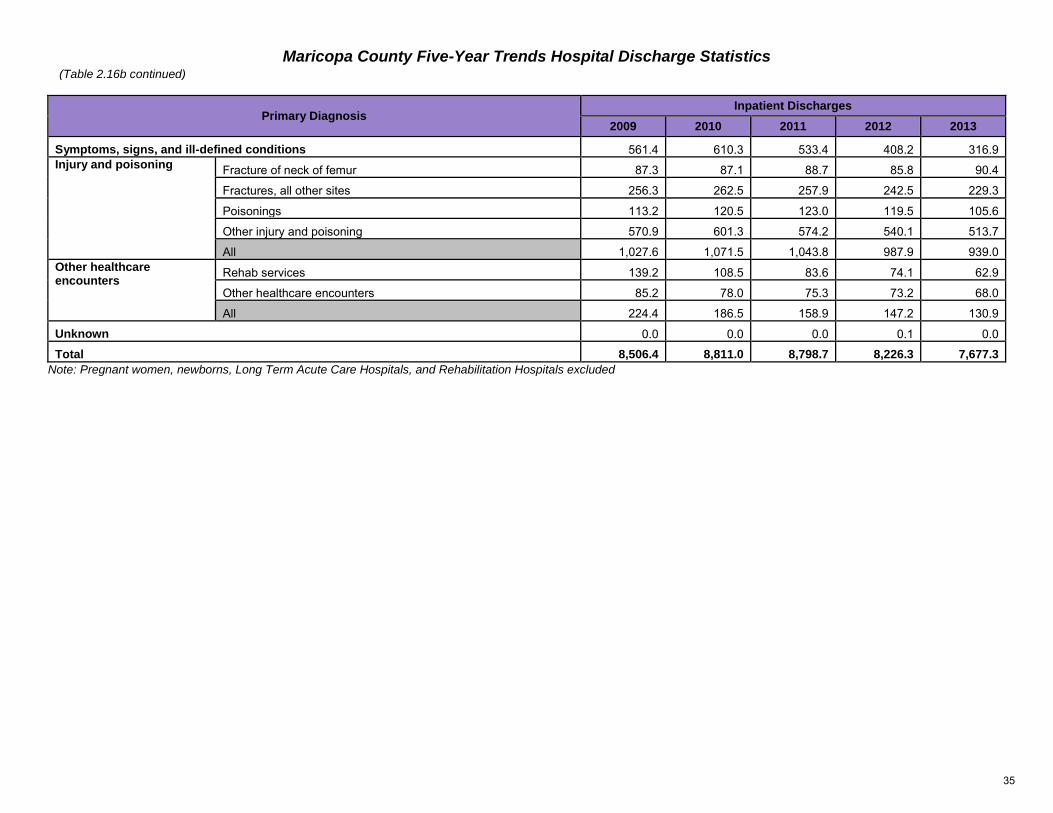
Maricopa County Five-Year Trends Hospital Discharge Statistics
Primary Diagnosis Inpatient Discharges
2009 2010 2011 2012 2013
Symptoms, signs, and ill-defined conditions 561.4 610.3 533.4 408.2 316.9
Injury and poisoning Fracture of neck of femur 87.3 87.1 88.7 85.8 90.4
Fractures, all other sites 256.3 262.5 257.9 242.5 229.3
Poisonings 113.2 120.5 123.0 119.5 105.6
Other injury and poisoning 570.9 601.3 574.2 540.1 513.7
All 1,027.6 1,071.5 1,043.8 987.9 939.0
Other healthcare encounters
Rehab services 139.2 108.5 83.6 74.1 62.9
Other healthcare encounters 85.2 78.0 75.3 73.2 68.0
All 224.4 186.5 158.9 147.2 130.9
Unknown 0.0 0.0 0.0 0.1 0.0
Total 8,506.4 8,811.0 8,798.7 8,226.3 7,677.3
Note: Pregnant women, newborns, Long Term Acute Care Hospitals, and Rehabilitation Hospitals excluded
(Table 2.16b continued)
35
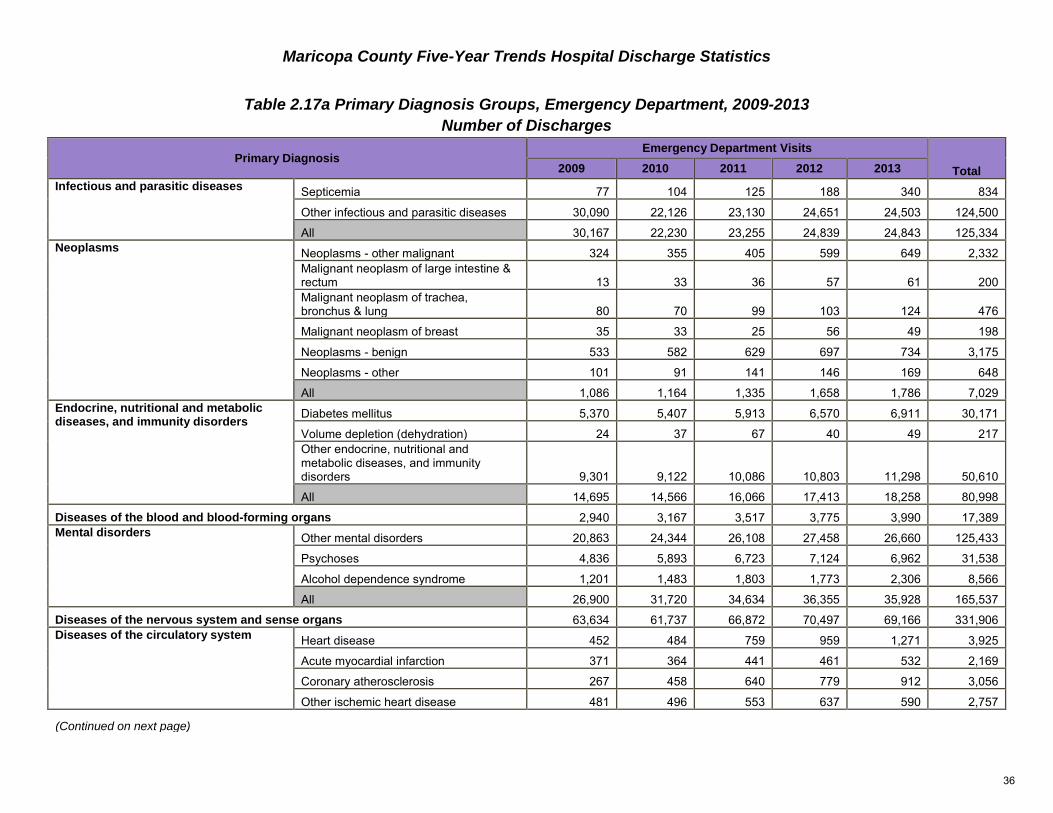
Maricopa County Five-Year Trends Hospital Discharge Statistics
Table 2.17a Primary Diagnosis Groups, Emergency Department, 2009-2013
Number of Discharges
Primary Diagnosis Emergency Department Visits
Total 2009 2010 2011 2012 2013
Infectious and parasitic diseases Septicemia 77 104 125 188 340 834
Other infectious and parasitic diseases 30,090 22,126 23,130 24,651 24,503 124,500
All 30,167 22,230 23,255 24,839 24,843 125,334
Neoplasms Neoplasms - other malignant 324 355 405 599 649 2,332
Malignant neoplasm of large intestine & rectum 13 33 36 57 61 200
Malignant neoplasm of trachea, bronchus & lung 80 70 99 103 124 476
Malignant neoplasm of breast 35 33 25 56 49 198
Neoplasms - benign 533 582 629 697 734 3,175
Neoplasms - other 101 91 141 146 169 648
All 1,086 1,164 1,335 1,658 1,786 7,029
Endocrine, nutritional and metabolic diseases, and immunity disorders
Diabetes mellitus 5,370 5,407 5,913 6,570 6,911 30,171
Volume depletion (dehydration) 24 37 67 40 49 217
Other endocrine, nutritional and metabolic diseases, and immunity disorders 9,301 9,122 10,086 10,803 11,298 50,610
All 14,695 14,566 16,066 17,413 18,258 80,998
Diseases of the blood and blood-forming organs 2,940 3,167 3,517 3,775 3,990 17,389
Mental disorders Other mental disorders 20,863 24,344 26,108 27,458 26,660 125,433
Psychoses 4,836 5,893 6,723 7,124 6,962 31,538
Alcohol dependence syndrome 1,201 1,483 1,803 1,773 2,306 8,566
All 26,900 31,720 34,634 36,355 35,928 165,537
Diseases of the nervous system and sense organs 63,634 61,737 66,872 70,497 69,166 331,906
Diseases of the circulatory system Heart disease 452 484 759 959 1,271 3,925
Acute myocardial infarction 371 364 441 461 532 2,169
Coronary atherosclerosis 267 458 640 779 912 3,056
Other ischemic heart disease 481 496 553 637 590 2,757
(Continued on next page)
36
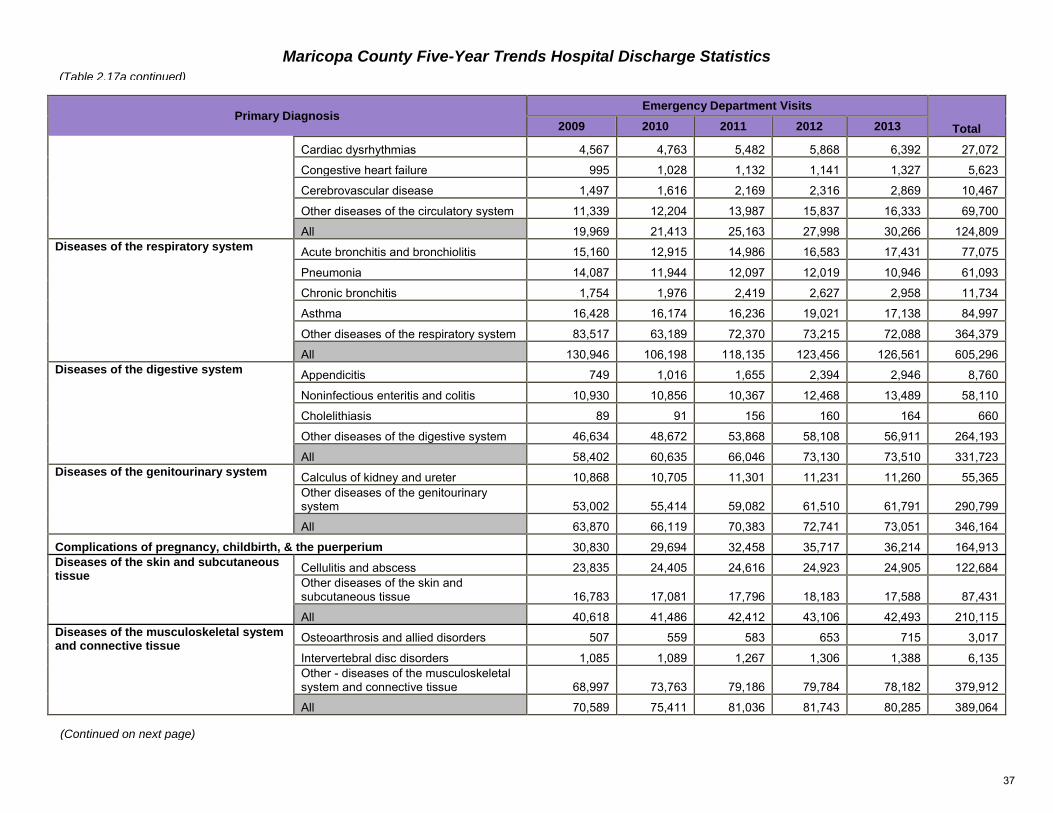
Maricopa County Five-Year Trends Hospital Discharge Statistics
Primary Diagnosis Emergency Department Visits
Total 2009 2010 2011 2012 2013
Cardiac dysrhythmias 4,567 4,763 5,482 5,868 6,392 27,072
Congestive heart failure 995 1,028 1,132 1,141 1,327 5,623
Cerebrovascular disease 1,497 1,616 2,169 2,316 2,869 10,467
Other diseases of the circulatory system 11,339 12,204 13,987 15,837 16,333 69,700
All 19,969 21,413 25,163 27,998 30,266 124,809
Diseases of the respiratory system Acute bronchitis and bronchiolitis 15,160 12,915 14,986 16,583 17,431 77,075
Pneumonia 14,087 11,944 12,097 12,019 10,946 61,093
Chronic bronchitis 1,754 1,976 2,419 2,627 2,958 11,734
Asthma 16,428 16,174 16,236 19,021 17,138 84,997
Other diseases of the respiratory system 83,517 63,189 72,370 73,215 72,088 364,379
All 130,946 106,198 118,135 123,456 126,561 605,296
Diseases of the digestive system Appendicitis 749 1,016 1,655 2,394 2,946 8,760
Noninfectious enteritis and colitis 10,930 10,856 10,367 12,468 13,489 58,110
Cholelithiasis 89 91 156 160 164 660
Other diseases of the digestive system 46,634 48,672 53,868 58,108 56,911 264,193
All 58,402 60,635 66,046 73,130 73,510 331,723
Diseases of the genitourinary system Calculus of kidney and ureter 10,868 10,705 11,301 11,231 11,260 55,365
Other diseases of the genitourinary system 53,002 55,414 59,082 61,510 61,791 290,799
All 63,870 66,119 70,383 72,741 73,051 346,164
Complications of pregnancy, childbirth, & the puerperium 30,830 29,694 32,458 35,717 36,214 164,913
Diseases of the skin and subcutaneous tissue
Cellulitis and abscess 23,835 24,405 24,616 24,923 24,905 122,684
Other diseases of the skin and subcutaneous tissue 16,783 17,081 17,796 18,183 17,588 87,431
All 40,618 41,486 42,412 43,106 42,493 210,115
Diseases of the musculoskeletal system and connective tissue
Osteoarthrosis and allied disorders 507 559 583 653 715 3,017
Intervertebral disc disorders 1,085 1,089 1,267 1,306 1,388 6,135
Other - diseases of the musculoskeletal system and connective tissue 68,997 73,763 79,186 79,784 78,182 379,912
All 70,589 75,411 81,036 81,743 80,285 389,064
(Continued on next page)
(Table 2.17a continued)
37
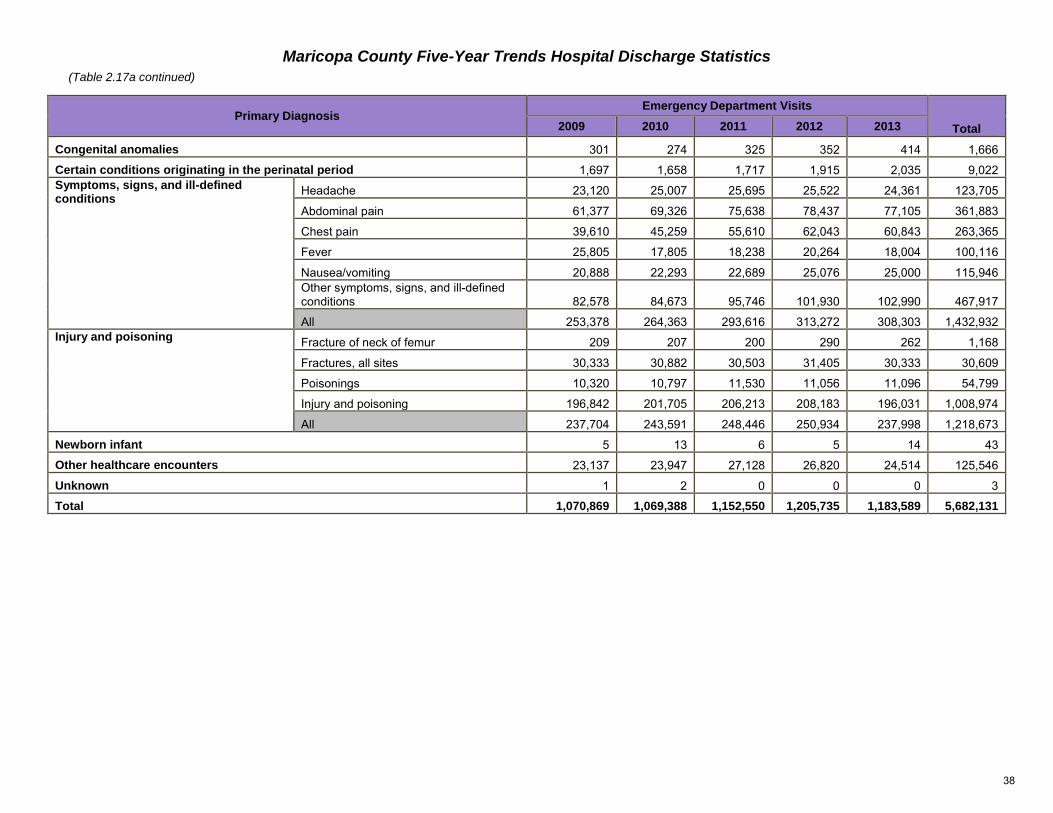
Maricopa County Five-Year Trends Hospital Discharge Statistics
Primary Diagnosis Emergency Department Visits
Total 2009 2010 2011 2012 2013
Congenital anomalies 301 274 325 352 414 1,666
Certain conditions originating in the perinatal period 1,697 1,658 1,717 1,915 2,035 9,022
Symptoms, signs, and ill-defined conditions
Headache 23,120 25,007 25,695 25,522 24,361 123,705
Abdominal pain 61,377 69,326 75,638 78,437 77,105 361,883
Chest pain 39,610 45,259 55,610 62,043 60,843 263,365
Fever 25,805 17,805 18,238 20,264 18,004 100,116
Nausea/vomiting 20,888 22,293 22,689 25,076 25,000 115,946
Other symptoms, signs, and ill-defined conditions 82,578 84,673 95,746 101,930 102,990 467,917
All 253,378 264,363 293,616 313,272 308,303 1,432,932
Injury and poisoning Fracture of neck of femur 209 207 200 290 262 1,168
Fractures, all sites 30,333 30,882 30,503 31,405 30,333 30,609
Poisonings 10,320 10,797 11,530 11,056 11,096 54,799
Injury and poisoning 196,842 201,705 206,213 208,183 196,031 1,008,974
All 237,704 243,591 248,446 250,934 237,998 1,218,673
Newborn infant 5 13 6 5 14 43
Other healthcare encounters 23,137 23,947 27,128 26,820 24,514 125,546
Unknown 1 2 0 0 0 3
Total 1,070,869 1,069,388 1,152,550 1,205,735 1,183,589 5,682,131
(Table 2.17a continued)
38
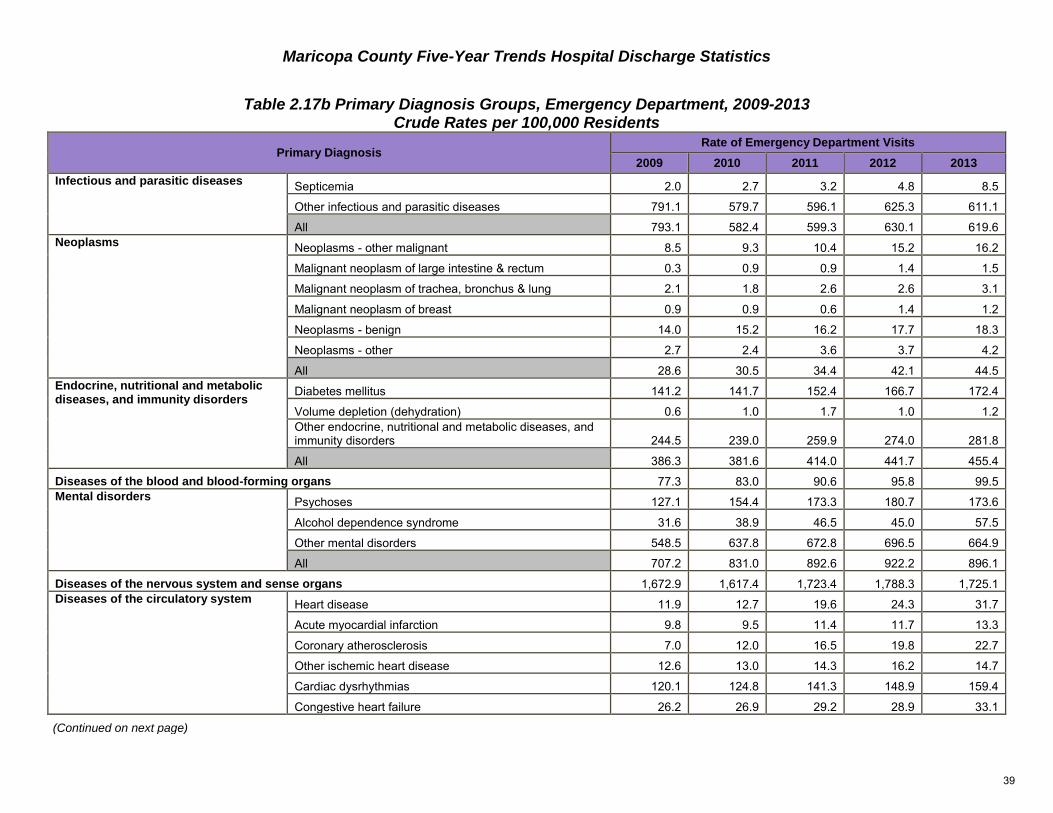
Maricopa County Five-Year Trends Hospital Discharge Statistics
Table 2.17b Primary Diagnosis Groups, Emergency Department, 2009-2013 Crude Rates per 100,000 Residents
Primary Diagnosis Rate of Emergency Department Visits
2009 2010 2011 2012 2013
Infectious and parasitic diseases Septicemia 2.0 2.7 3.2 4.8 8.5
Other infectious and parasitic diseases 791.1 579.7 596.1 625.3 611.1
All 793.1 582.4 599.3 630.1 619.6
Neoplasms Neoplasms - other malignant 8.5 9.3 10.4 15.2 16.2
Malignant neoplasm of large intestine & rectum 0.3 0.9 0.9 1.4 1.5
Malignant neoplasm of trachea, bronchus & lung 2.1 1.8 2.6 2.6 3.1
Malignant neoplasm of breast 0.9 0.9 0.6 1.4 1.2
Neoplasms - benign 14.0 15.2 16.2 17.7 18.3
Neoplasms - other 2.7 2.4 3.6 3.7 4.2
All 28.6 30.5 34.4 42.1 44.5
Endocrine, nutritional and metabolic diseases, and immunity disorders
Diabetes mellitus 141.2 141.7 152.4 166.7 172.4
Volume depletion (dehydration) 0.6 1.0 1.7 1.0 1.2
Other endocrine, nutritional and metabolic diseases, and immunity disorders 244.5 239.0 259.9 274.0 281.8
All 386.3 381.6 414.0 441.7 455.4
Diseases of the blood and blood-forming organs 77.3 83.0 90.6 95.8 99.5
Mental disorders Psychoses 127.1 154.4 173.3 180.7 173.6
Alcohol dependence syndrome 31.6 38.9 46.5 45.0 57.5
Other mental disorders 548.5 637.8 672.8 696.5 664.9
All 707.2 831.0 892.6 922.2 896.1
Diseases of the nervous system and sense organs 1,672.9 1,617.4 1,723.4 1,788.3 1,725.1
Diseases of the circulatory system Heart disease 11.9 12.7 19.6 24.3 31.7
Acute myocardial infarction 9.8 9.5 11.4 11.7 13.3
Coronary atherosclerosis 7.0 12.0 16.5 19.8 22.7
Other ischemic heart disease 12.6 13.0 14.3 16.2 14.7
Cardiac dysrhythmias 120.1 124.8 141.3 148.9 159.4
Congestive heart failure 26.2 26.9 29.2 28.9 33.1
(Continued on next page)
39
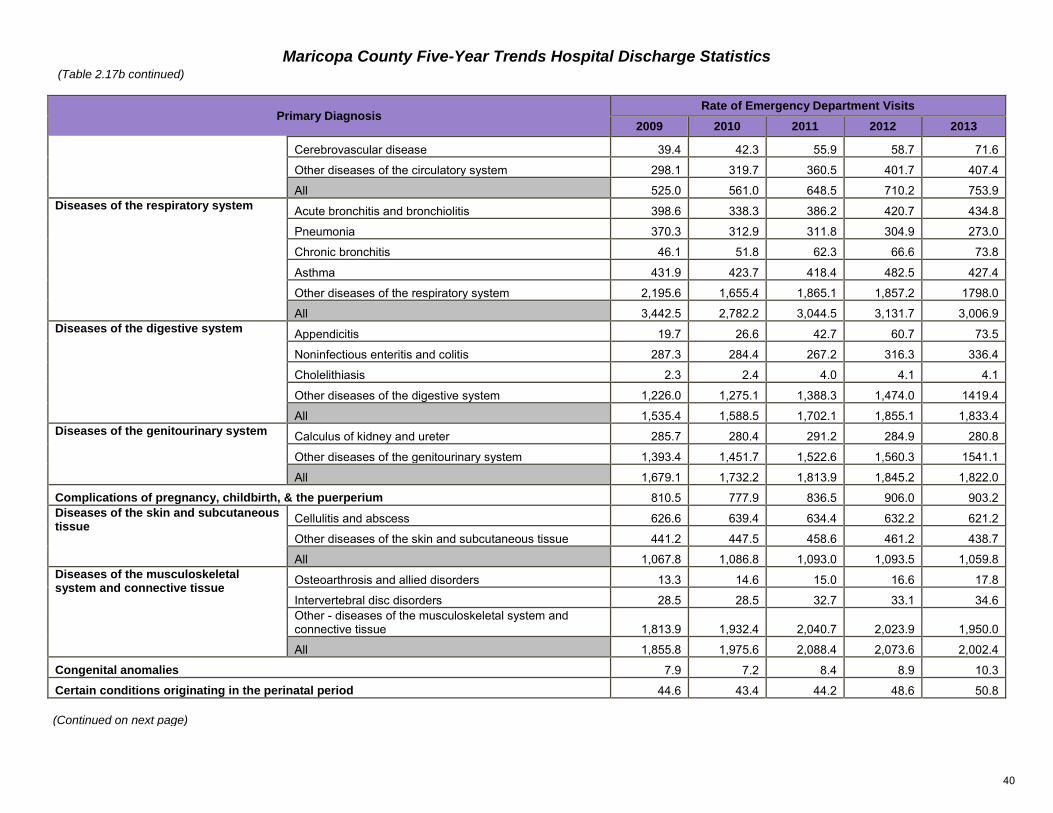
Maricopa County Five-Year Trends Hospital Discharge Statistics
Primary Diagnosis Rate of Emergency Department Visits
2009 2010 2011 2012 2013
Cerebrovascular disease 39.4 42.3 55.9 58.7 71.6
Other diseases of the circulatory system 298.1 319.7 360.5 401.7 407.4
All 525.0 561.0 648.5 710.2 753.9
Diseases of the respiratory system Acute bronchitis and bronchiolitis 398.6 338.3 386.2 420.7 434.8
Pneumonia 370.3 312.9 311.8 304.9 273.0
Chronic bronchitis 46.1 51.8 62.3 66.6 73.8
Asthma 431.9 423.7 418.4 482.5 427.4
Other diseases of the respiratory system 2,195.6 1,655.4 1,865.1 1,857.2 1798.0
All 3,442.5 2,782.2 3,044.5 3,131.7 3,006.9
Diseases of the digestive system Appendicitis 19.7 26.6 42.7 60.7 73.5
Noninfectious enteritis and colitis 287.3 284.4 267.2 316.3 336.4
Cholelithiasis 2.3 2.4 4.0 4.1 4.1
Other diseases of the digestive system 1,226.0 1,275.1 1,388.3 1,474.0 1419.4
All 1,535.4 1,588.5 1,702.1 1,855.1 1,833.4
Diseases of the genitourinary system Calculus of kidney and ureter 285.7 280.4 291.2 284.9 280.8
Other diseases of the genitourinary system 1,393.4 1,451.7 1,522.6 1,560.3 1541.1
All 1,679.1 1,732.2 1,813.9 1,845.2 1,822.0
Complications of pregnancy, childbirth, & the puerperium 810.5 777.9 836.5 906.0 903.2
Diseases of the skin and subcutaneous tissue
Cellulitis and abscess 626.6 639.4 634.4 632.2 621.2
Other diseases of the skin and subcutaneous tissue 441.2 447.5 458.6 461.2 438.7
All 1,067.8 1,086.8 1,093.0 1,093.5 1,059.8
Diseases of the musculoskeletal system and connective tissue
Osteoarthrosis and allied disorders 13.3 14.6 15.0 16.6 17.8
Intervertebral disc disorders 28.5 28.5 32.7 33.1 34.6
Other - diseases of the musculoskeletal system and connective tissue 1,813.9 1,932.4 2,040.7 2,023.9 1,950.0
All 1,855.8 1,975.6 2,088.4 2,073.6 2,002.4
Congenital anomalies 7.9 7.2 8.4 8.9 10.3
Certain conditions originating in the perinatal period 44.6 43.4 44.2 48.6 50.8
(Continued on next page)
(Table 2.17b continued)
40
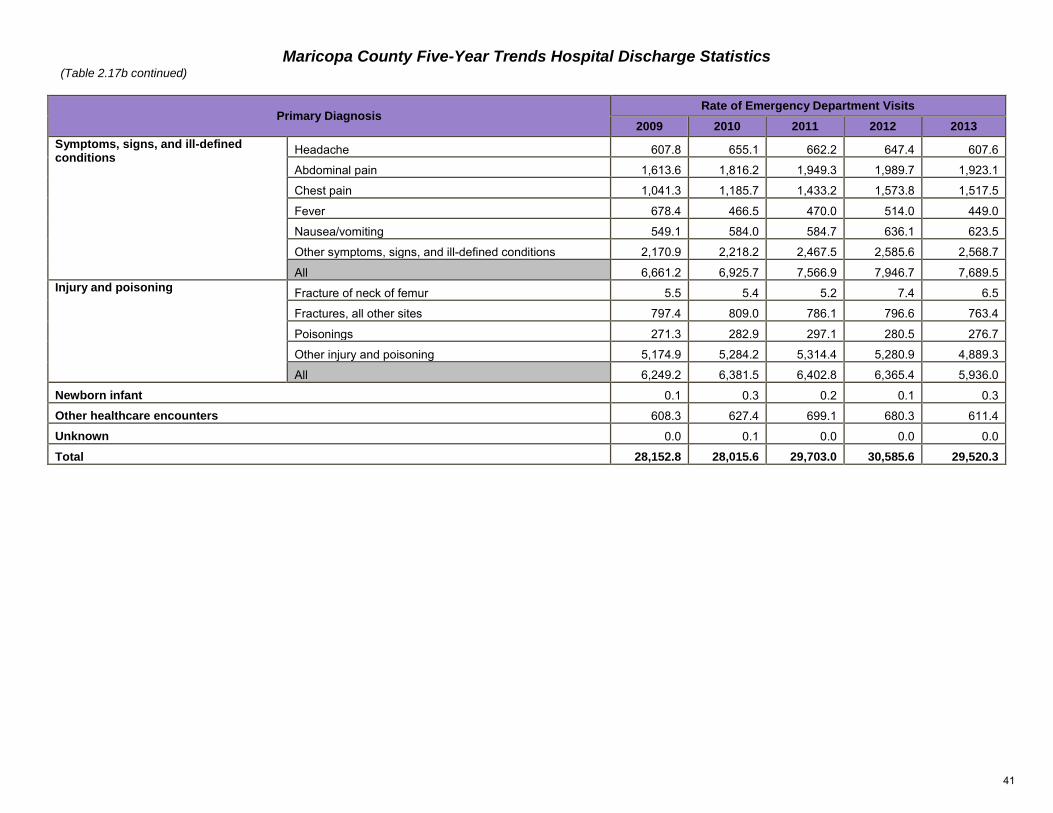
Maricopa County Five-Year Trends Hospital Discharge Statistics
Primary Diagnosis Rate of Emergency Department Visits
2009 2010 2011 2012 2013
Symptoms, signs, and ill-defined conditions
Headache 607.8 655.1 662.2 647.4 607.6
Abdominal pain 1,613.6 1,816.2 1,949.3 1,989.7 1,923.1
Chest pain 1,041.3 1,185.7 1,433.2 1,573.8 1,517.5
Fever 678.4 466.5 470.0 514.0 449.0
Nausea/vomiting 549.1 584.0 584.7 636.1 623.5
Other symptoms, signs, and ill-defined conditions 2,170.9 2,218.2 2,467.5 2,585.6 2,568.7
All 6,661.2 6,925.7 7,566.9 7,946.7 7,689.5
Injury and poisoning Fracture of neck of femur 5.5 5.4 5.2 7.4 6.5
Fractures, all other sites 797.4 809.0 786.1 796.6 763.4
Poisonings 271.3 282.9 297.1 280.5 276.7
Other injury and poisoning 5,174.9 5,284.2 5,314.4 5,280.9 4,889.3
All 6,249.2 6,381.5 6,402.8 6,365.4 5,936.0
Newborn infant 0.1 0.3 0.2 0.1 0.3
Other healthcare encounters 608.3 627.4 699.1 680.3 611.4
Unknown 0.0 0.1 0.0 0.0 0.0
Total 28,152.8 28,015.6 29,703.0 30,585.6 29,520.3
(Table 2.17b continued)
41
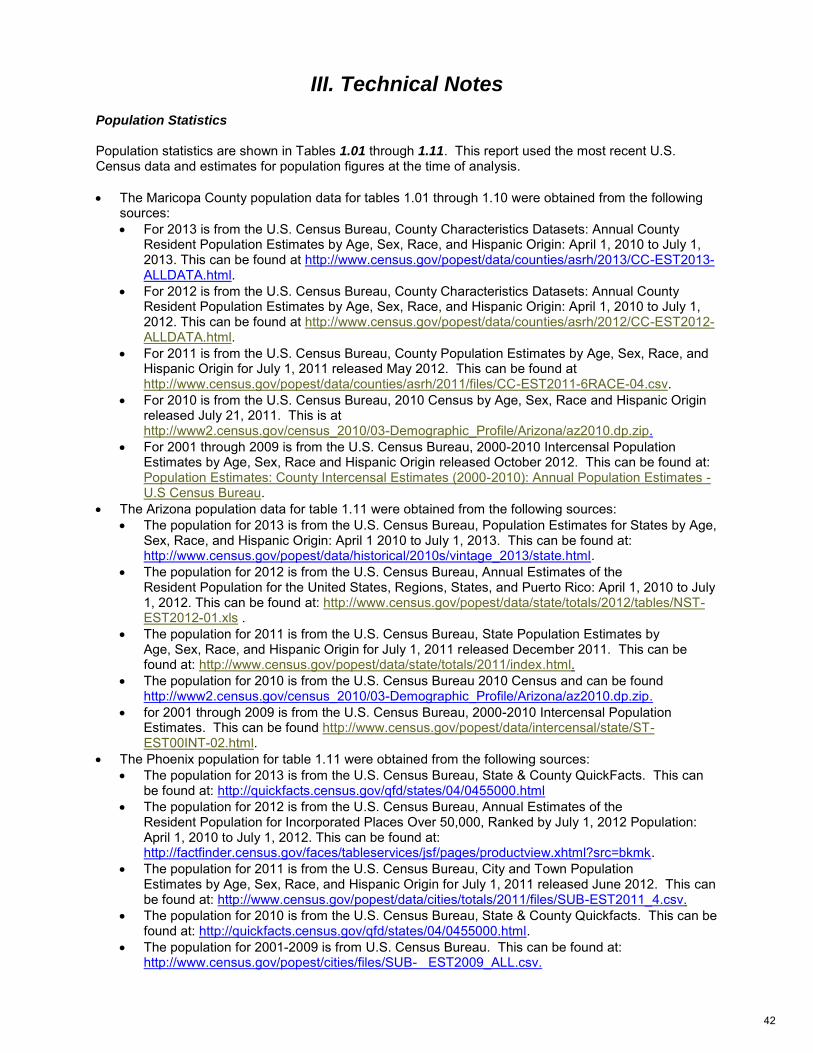
III. Technical Notes
Population Statistics
Population statistics are shown in Tables 1.01 through 1.11. This report used the most recent U.S. Census data and estimates for population figures at the time of analysis.
The Maricopa County population data for tables 1.01 through 1.10 were obtained from the followingsources:
For 2013 is from the U.S. Census Bureau, County Characteristics Datasets: Annual CountyResident Population Estimates by Age, Sex, Race, and Hispanic Origin: April 1, 2010 to July 1,2013. This can be found at http://www.census.gov/popest/data/counties/asrh/2013/CC-EST2013-ALLDATA.html.
For 2012 is from the U.S. Census Bureau, County Characteristics Datasets: Annual CountyResident Population Estimates by Age, Sex, Race, and Hispanic Origin: April 1, 2010 to July 1,2012. This can be found at http://www.census.gov/popest/data/counties/asrh/2012/CC-EST2012-ALLDATA.html.
For 2011 is from the U.S. Census Bureau, County Population Estimates by Age, Sex, Race, andHispanic Origin for July 1, 2011 released May 2012. This can be found athttp://www.census.gov/popest/data/counties/asrh/2011/files/CC-EST2011-6RACE-04.csv.
For 2010 is from the U.S. Census Bureau, 2010 Census by Age, Sex, Race and Hispanic Originreleased July 21, 2011. This is athttp://www2.census.gov/census_2010/03-Demographic_Profile/Arizona/az2010.dp.zip.
For 2001 through 2009 is from the U.S. Census Bureau, 2000-2010 Intercensal PopulationEstimates by Age, Sex, Race and Hispanic Origin released October 2012. This can be found at:Population Estimates: County Intercensal Estimates (2000-2010): Annual Population Estimates -U.S Census Bureau.
The Arizona population data for table 1.11 were obtained from the following sources:
The population for 2013 is from the U.S. Census Bureau, Population Estimates for States by Age,Sex, Race, and Hispanic Origin: April 1 2010 to July 1, 2013. This can be found at:http://www.census.gov/popest/data/historical/2010s/vintage_2013/state.html.
The population for 2012 is from the U.S. Census Bureau, Annual Estimates of theResident Population for the United States, Regions, States, and Puerto Rico: April 1, 2010 to July1, 2012. This can be found at: http://www.census.gov/popest/data/state/totals/2012/tables/NST-EST2012-01.xls .
The population for 2011 is from the U.S. Census Bureau, State Population Estimates byAge, Sex, Race, and Hispanic Origin for July 1, 2011 released December 2011. This can befound at: http://www.census.gov/popest/data/state/totals/2011/index.html.
The population for 2010 is from the U.S. Census Bureau 2010 Census and can be foundhttp://www2.census.gov/census_2010/03-Demographic_Profile/Arizona/az2010.dp.zip.
for 2001 through 2009 is from the U.S. Census Bureau, 2000-2010 Intercensal PopulationEstimates. This can be found http://www.census.gov/popest/data/intercensal/state/ST-EST00INT-02.html.
The Phoenix population for table 1.11 were obtained from the following sources:
The population for 2013 is from the U.S. Census Bureau, State & County QuickFacts. This canbe found at: http://quickfacts.census.gov/qfd/states/04/0455000.html
The population for 2012 is from the U.S. Census Bureau, Annual Estimates of theResident Population for Incorporated Places Over 50,000, Ranked by July 1, 2012 Population:April 1, 2010 to July 1, 2012. This can be found at:http://factfinder.census.gov/faces/tableservices/jsf/pages/productview.xhtml?src=bkmk.
The population for 2011 is from the U.S. Census Bureau, City and Town PopulationEstimates by Age, Sex, Race, and Hispanic Origin for July 1, 2011 released June 2012. This canbe found at: http://www.census.gov/popest/data/cities/totals/2011/files/SUB-EST2011_4.csv.
The population for 2010 is from the U.S. Census Bureau, State & County Quickfacts. This can befound at: http://quickfacts.census.gov/qfd/states/04/0455000.html.
The population for 2001-2009 is from U.S. Census Bureau. This can be found at:http://www.census.gov/popest/cities/files/SUB- EST2009_ALL.csv.
42
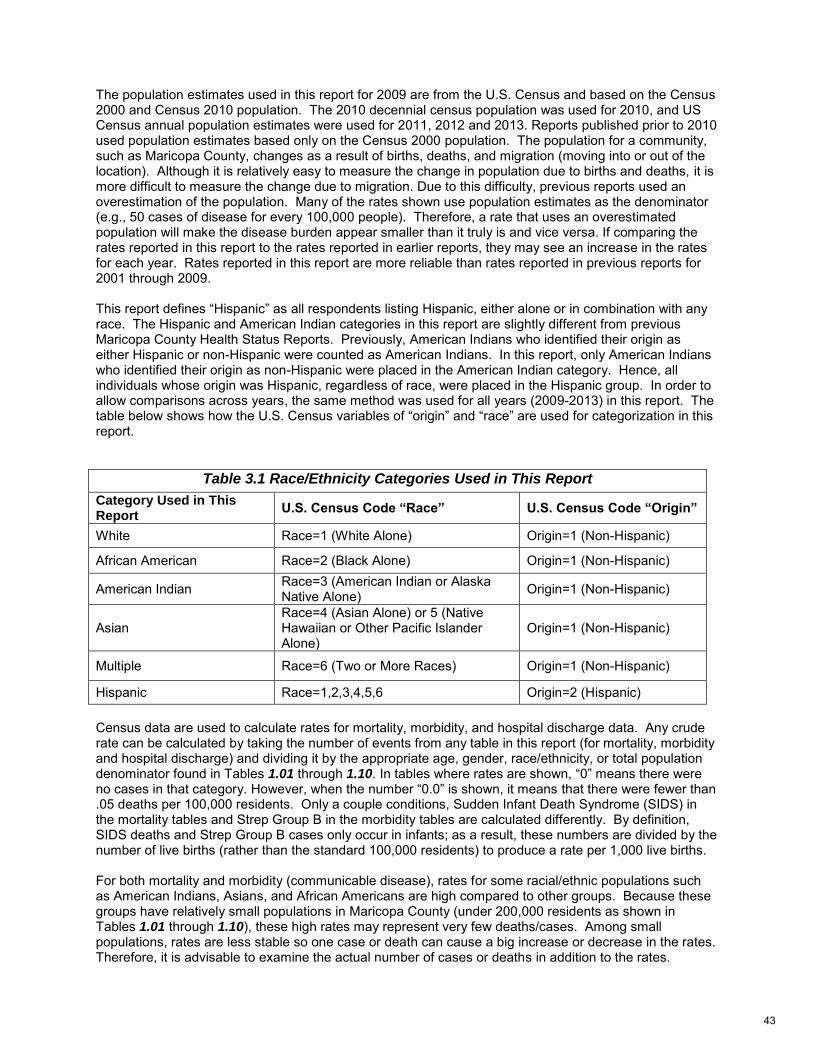
The population estimates used in this report for 2009 are from the U.S. Census and based on the Census 2000 and Census 2010 population. The 2010 decennial census population was used for 2010, and US Census annual population estimates were used for 2011, 2012 and 2013. Reports published prior to 2010 used population estimates based only on the Census 2000 population. The population for a community, such as Maricopa County, changes as a result of births, deaths, and migration (moving into or out of the location). Although it is relatively easy to measure the change in population due to births and deaths, it is more difficult to measure the change due to migration. Due to this difficulty, previous reports used an overestimation of the population. Many of the rates shown use population estimates as the denominator (e.g., 50 cases of disease for every 100,000 people). Therefore, a rate that uses an overestimated population will make the disease burden appear smaller than it truly is and vice versa. If comparing the rates reported in this report to the rates reported in earlier reports, they may see an increase in the rates for each year. Rates reported in this report are more reliable than rates reported in previous reports for 2001 through 2009.
This report defines “Hispanic” as all respondents listing Hispanic, either alone or in combination with any race. The Hispanic and American Indian categories in this report are slightly different from previous Maricopa County Health Status Reports. Previously, American Indians who identified their origin as either Hispanic or non-Hispanic were counted as American Indians. In this report, only American Indians who identified their origin as non-Hispanic were placed in the American Indian category. Hence, all individuals whose origin was Hispanic, regardless of race, were placed in the Hispanic group. In order to allow comparisons across years, the same method was used for all years (2009-2013) in this report. The table below shows how the U.S. Census variables of “origin” and “race” are used for categorization in this report.
Table 3.1 Race/Ethnicity Categories Used in This Report
Category Used in This Report
U.S. Census Code “Race” U.S. Census Code “Origin”
White Race=1 (White Alone) Origin=1 (Non-Hispanic)
African American Race=2 (Black Alone) Origin=1 (Non-Hispanic)
American Indian Race=3 (American Indian or Alaska Native Alone)
Origin=1 (Non-Hispanic)
Asian Race=4 (Asian Alone) or 5 (Native Hawaiian or Other Pacific Islander Alone)
Origin=1 (Non-Hispanic)
Multiple Race=6 (Two or More Races) Origin=1 (Non-Hispanic)
Hispanic Race=1,2,3,4,5,6 Origin=2 (Hispanic)
Census data are used to calculate rates for mortality, morbidity, and hospital discharge data. Any crude rate can be calculated by taking the number of events from any table in this report (for mortality, morbidity and hospital discharge) and dividing it by the appropriate age, gender, race/ethnicity, or total population denominator found in Tables 1.01 through 1.10. In tables where rates are shown, “0” means there were no cases in that category. However, when the number “0.0” is shown, it means that there were fewer than .05 deaths per 100,000 residents. Only a couple conditions, Sudden Infant Death Syndrome (SIDS) in the mortality tables and Strep Group B in the morbidity tables are calculated differently. By definition, SIDS deaths and Strep Group B cases only occur in infants; as a result, these numbers are divided by the number of live births (rather than the standard 100,000 residents) to produce a rate per 1,000 live births.
For both mortality and morbidity (communicable disease), rates for some racial/ethnic populations such as American Indians, Asians, and African Americans are high compared to other groups. Because these groups have relatively small populations in Maricopa County (under 200,000 residents as shown in Tables 1.01 through 1.10), these high rates may represent very few deaths/cases. Among small populations, rates are less stable so one case or death can cause a big increase or decrease in the rates. Therefore, it is advisable to examine the actual number of cases or deaths in addition to the rates.
43
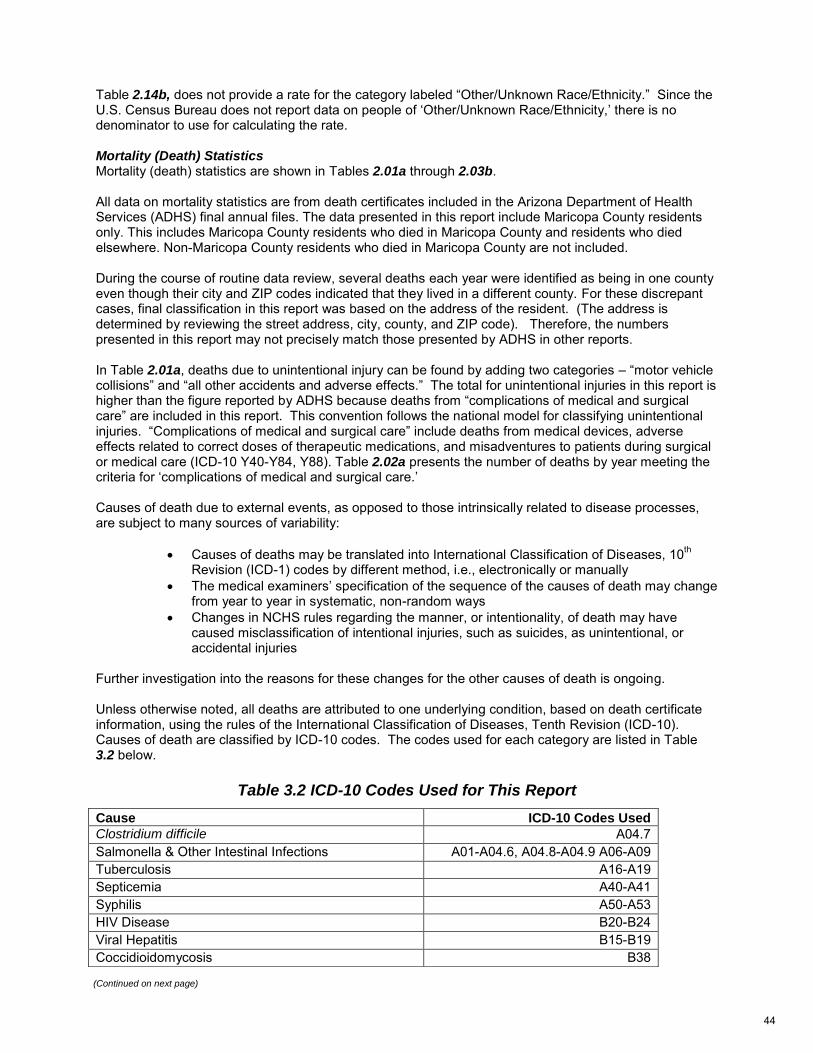
Table 2.14b, does not provide a rate for the category labeled “Other/Unknown Race/Ethnicity.” Since the U.S. Census Bureau does not report data on people of ‘Other/Unknown Race/Ethnicity,’ there is no denominator to use for calculating the rate.
Mortality (Death) Statistics Mortality (death) statistics are shown in Tables 2.01a through 2.03b.
All data on mortality statistics are from death certificates included in the Arizona Department of Health Services (ADHS) final annual files. The data presented in this report include Maricopa County residents only. This includes Maricopa County residents who died in Maricopa County and residents who died elsewhere. Non-Maricopa County residents who died in Maricopa County are not included.
During the course of routine data review, several deaths each year were identified as being in one county even though their city and ZIP codes indicated that they lived in a different county. For these discrepant cases, final classification in this report was based on the address of the resident. (The address is determined by reviewing the street address, city, county, and ZIP code). Therefore, the numbers presented in this report may not precisely match those presented by ADHS in other reports.
In Table 2.01a, deaths due to unintentional injury can be found by adding two categories – “motor vehicle collisions” and “all other accidents and adverse effects.” The total for unintentional injuries in this report is higher than the figure reported by ADHS because deaths from “complications of medical and surgical care” are included in this report. This convention follows the national model for classifying unintentional injuries. “Complications of medical and surgical care” include deaths from medical devices, adverse effects related to correct doses of therapeutic medications, and misadventures to patients during surgical or medical care (ICD-10 Y40-Y84, Y88). Table 2.02a presents the number of deaths by year meeting the criteria for ‘complications of medical and surgical care.’
Causes of death due to external events, as opposed to those intrinsically related to disease processes, are subject to many sources of variability:
Causes of deaths may be translated into International Classification of Diseases, 10th
Revision (ICD-1) codes by different method, i.e., electronically or manually
The medical examiners’ specification of the sequence of the causes of death may changefrom year to year in systematic, non-random ways
Changes in NCHS rules regarding the manner, or intentionality, of death may havecaused misclassification of intentional injuries, such as suicides, as unintentional, oraccidental injuries
Further investigation into the reasons for these changes for the other causes of death is ongoing.
Unless otherwise noted, all deaths are attributed to one underlying condition, based on death certificate information, using the rules of the International Classification of Diseases, Tenth Revision (ICD-10). Causes of death are classified by ICD-10 codes. The codes used for each category are listed in Table 3.2 below.
Table 3.2 ICD-10 Codes Used for This Report
Cause ICD-10 Codes Used
Clostridium difficile A04.7
Salmonella & Other Intestinal Infections A01-A04.6, A04.8-A04.9 A06-A09
Tuberculosis A16-A19
Septicemia A40-A41
Syphilis A50-A53
HIV Disease B20-B24
Viral Hepatitis B15-B19
Coccidioidomycosis B38
(Continued on next page)
44
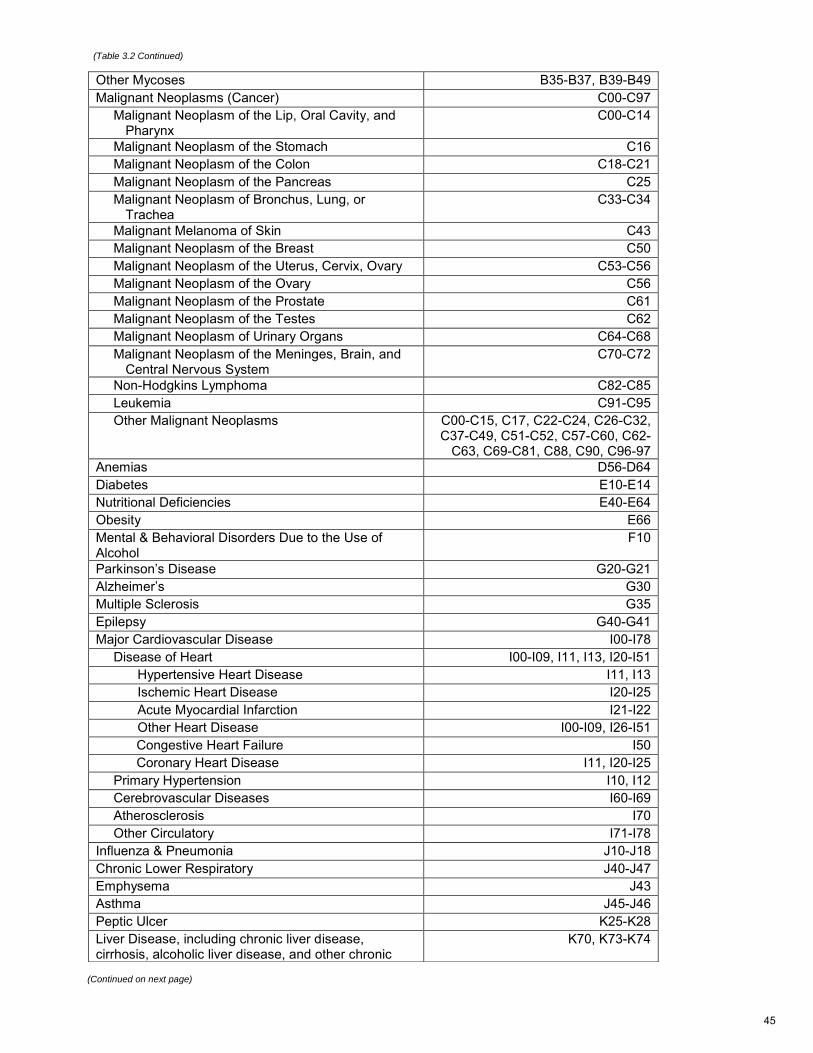
Other Mycoses B35-B37, B39-B49
Malignant Neoplasms (Cancer) C00-C97
Malignant Neoplasm of the Lip, Oral Cavity, and Pharynx
C00-C14
Malignant Neoplasm of the Stomach C16
Malignant Neoplasm of the Colon C18-C21
Malignant Neoplasm of the Pancreas C25
Malignant Neoplasm of Bronchus, Lung, or Trachea
C33-C34
Malignant Melanoma of Skin C43
Malignant Neoplasm of the Breast C50
Malignant Neoplasm of the Uterus, Cervix, Ovary C53-C56
Malignant Neoplasm of the Ovary C56
Malignant Neoplasm of the Prostate C61
Malignant Neoplasm of the Testes C62
Malignant Neoplasm of Urinary Organs C64-C68
Malignant Neoplasm of the Meninges, Brain, and Central Nervous System
C70-C72
Non-Hodgkins Lymphoma C82-C85
Leukemia C91-C95
Other Malignant Neoplasms C00-C15, C17, C22-C24, C26-C32, C37-C49, C51-C52, C57-C60, C62-
C63, C69-C81, C88, C90, C96-97
Anemias D56-D64
Diabetes E10-E14
Nutritional Deficiencies E40-E64
Obesity E66
Mental & Behavioral Disorders Due to the Use of Alcohol
F10
Parkinson’s Disease G20-G21
Alzheimer’s G30
Multiple Sclerosis G35
Epilepsy G40-G41
Major Cardiovascular Disease I00-I78
Disease of Heart I00-I09, I11, I13, I20-I51
Hypertensive Heart Disease I11, I13
Ischemic Heart Disease I20-I25
Acute Myocardial Infarction I21-I22
Other Heart Disease I00-I09, I26-I51
Congestive Heart Failure I50
Coronary Heart Disease I11, I20-I25
Primary Hypertension I10, I12
Cerebrovascular Diseases I60-I69
Atherosclerosis I70
Other Circulatory I71-I78
Influenza & Pneumonia J10-J18
Chronic Lower Respiratory J40-J47
Emphysema J43
Asthma J45-J46
Peptic Ulcer K25-K28
Liver Disease, including chronic liver disease, cirrhosis, alcoholic liver disease, and other chronic
K70, K73-K74
(Table 3.2 Continued)
(Continued on next page)
45
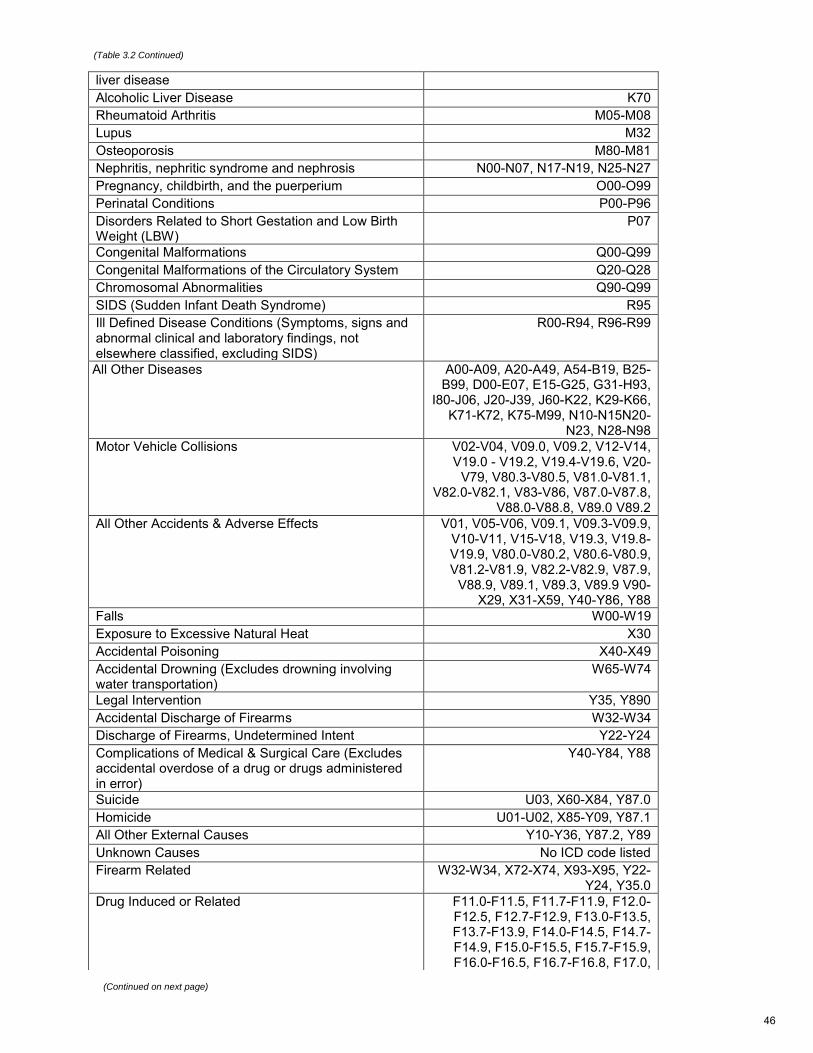
liver disease
Alcoholic Liver Disease K70
Rheumatoid Arthritis M05-M08
Lupus M32
Osteoporosis M80-M81
Nephritis, nephritic syndrome and nephrosis N00-N07, N17-N19, N25-N27
Pregnancy, childbirth, and the puerperium O00-O99
Perinatal Conditions P00-P96
Disorders Related to Short Gestation and Low Birth Weight (LBW)
P07
Congenital Malformations Q00-Q99
Congenital Malformations of the Circulatory System Q20-Q28
Chromosomal Abnormalities Q90-Q99
SIDS (Sudden Infant Death Syndrome) R95
Ill Defined Disease Conditions (Symptoms, signs and abnormal clinical and laboratory findings, not elsewhere classified, excluding SIDS)
R00-R94, R96-R99
All Other Diseases A00-A09, A20-A49, A54-B19, B25-B99, D00-E07, E15-G25, G31-H93,
I80-J06, J20-J39, J60-K22, K29-K66, K71-K72, K75-M99, N10-N15N20-
N23, N28-N98
Motor Vehicle Collisions V02-V04, V09.0, V09.2, V12-V14, V19.0 - V19.2, V19.4-V19.6, V20-
V79, V80.3-V80.5, V81.0-V81.1, V82.0-V82.1, V83-V86, V87.0-V87.8,
V88.0-V88.8, V89.0 V89.2
All Other Accidents & Adverse Effects V01, V05-V06, V09.1, V09.3-V09.9, V10-V11, V15-V18, V19.3, V19.8-V19.9, V80.0-V80.2, V80.6-V80.9, V81.2-V81.9, V82.2-V82.9, V87.9,
V88.9, V89.1, V89.3, V89.9 V90-X29, X31-X59, Y40-Y86, Y88
Falls W00-W19
Exposure to Excessive Natural Heat X30
Accidental Poisoning X40-X49
Accidental Drowning (Excludes drowning involving water transportation)
W65-W74
Legal Intervention Y35, Y890
Accidental Discharge of Firearms W32-W34
Discharge of Firearms, Undetermined Intent Y22-Y24
Complications of Medical & Surgical Care (Excludes accidental overdose of a drug or drugs administered in error)
Y40-Y84, Y88
Suicide U03, X60-X84, Y87.0
Homicide U01-U02, X85-Y09, Y87.1
All Other External Causes Y10-Y36, Y87.2, Y89
Unknown Causes No ICD code listed
Firearm Related W32-W34, X72-X74, X93-X95, Y22-Y24, Y35.0
Drug Induced or Related F11.0-F11.5, F11.7-F11.9, F12.0-F12.5, F12.7-F12.9, F13.0-F13.5, F13.7-F13.9, F14.0-F14.5, F14.7-F14.9, F15.0-F15.5, F15.7-F15.9, F16.0-F16.5, F16.7-F16.8, F17.0,
(Table 3.2, Continued)
(Table 3.2 Continued)
(Table 3.2 Continued)
(Continued on next page)
46
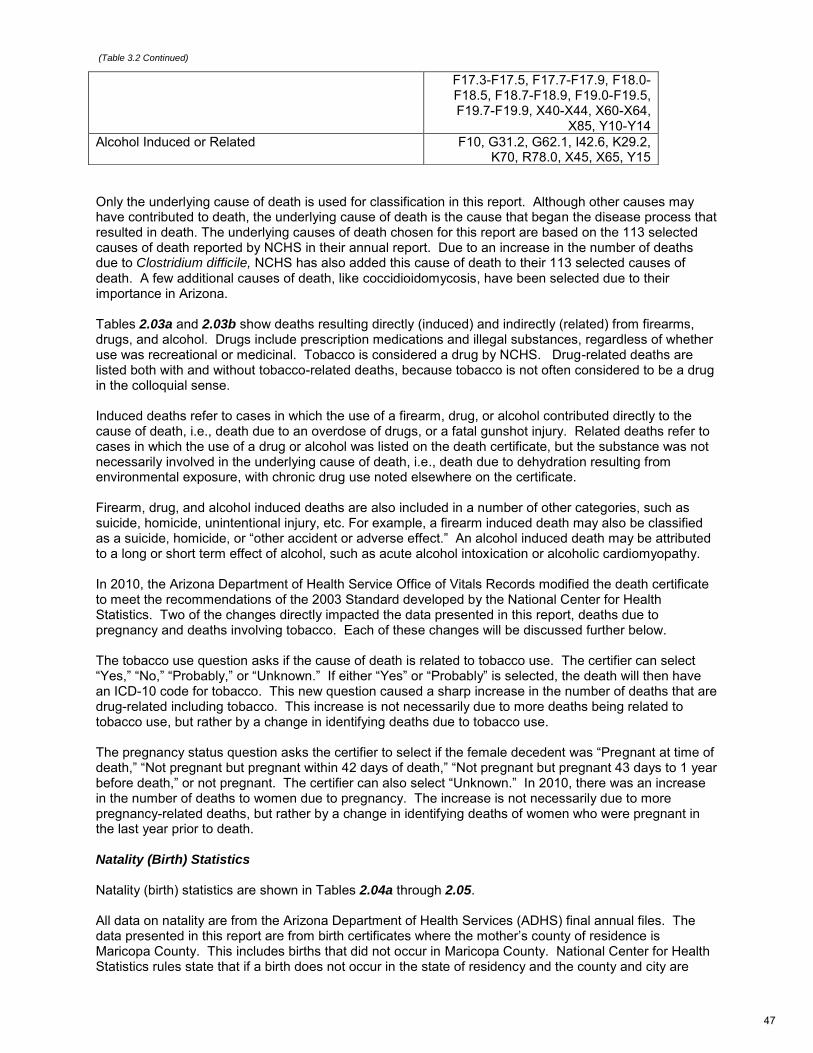
Only the underlying cause of death is used for classification in this report. Although other causes may have contributed to death, the underlying cause of death is the cause that began the disease process that resulted in death. The underlying causes of death chosen for this report are based on the 113 selected causes of death reported by NCHS in their annual report. Due to an increase in the number of deaths due to Clostridium difficile, NCHS has also added this cause of death to their 113 selected causes of death. A few additional causes of death, like coccidioidomycosis, have been selected due to their importance in Arizona.
Tables 2.03a and 2.03b show deaths resulting directly (induced) and indirectly (related) from firearms, drugs, and alcohol. Drugs include prescription medications and illegal substances, regardless of whether use was recreational or medicinal. Tobacco is considered a drug by NCHS. Drug-related deaths are listed both with and without tobacco-related deaths, because tobacco is not often considered to be a drug in the colloquial sense.
Induced deaths refer to cases in which the use of a firearm, drug, or alcohol contributed directly to the cause of death, i.e., death due to an overdose of drugs, or a fatal gunshot injury. Related deaths refer to cases in which the use of a drug or alcohol was listed on the death certificate, but the substance was not necessarily involved in the underlying cause of death, i.e., death due to dehydration resulting from environmental exposure, with chronic drug use noted elsewhere on the certificate.
Firearm, drug, and alcohol induced deaths are also included in a number of other categories, such as suicide, homicide, unintentional injury, etc. For example, a firearm induced death may also be classified as a suicide, homicide, or “other accident or adverse effect.” An alcohol induced death may be attributed to a long or short term effect of alcohol, such as acute alcohol intoxication or alcoholic cardiomyopathy.
In 2010, the Arizona Department of Health Service Office of Vitals Records modified the death certificate to meet the recommendations of the 2003 Standard developed by the National Center for Health Statistics. Two of the changes directly impacted the data presented in this report, deaths due to pregnancy and deaths involving tobacco. Each of these changes will be discussed further below.
The tobacco use question asks if the cause of death is related to tobacco use. The certifier can select “Yes,” “No,” “Probably,” or “Unknown.” If either “Yes” or “Probably” is selected, the death will then have an ICD-10 code for tobacco. This new question caused a sharp increase in the number of deaths that are drug-related including tobacco. This increase is not necessarily due to more deaths being related to tobacco use, but rather by a change in identifying deaths due to tobacco use.
The pregnancy status question asks the certifier to select if the female decedent was “Pregnant at time of death,” “Not pregnant but pregnant within 42 days of death,” “Not pregnant but pregnant 43 days to 1 year before death,” or not pregnant. The certifier can also select “Unknown.” In 2010, there was an increase in the number of deaths to women due to pregnancy. The increase is not necessarily due to more pregnancy-related deaths, but rather by a change in identifying deaths of women who were pregnant in the last year prior to death.
Natality (Birth) Statistics
Natality (birth) statistics are shown in Tables 2.04a through 2.05.
All data on natality are from the Arizona Department of Health Services (ADHS) final annual files. The data presented in this report are from birth certificates where the mother’s county of residence is Maricopa County. This includes births that did not occur in Maricopa County. National Center for Health Statistics rules state that if a birth does not occur in the state of residency and the county and city are
F17.3-F17.5, F17.7-F17.9, F18.0-F18.5, F18.7-F18.9, F19.0-F19.5, F19.7-F19.9, X40-X44, X60-X64,
X85, Y10-Y14
Alcohol Induced or Related F10, G31.2, G62.1, I42.6, K29.2, K70, R78.0, X45, X65, Y15
(Table 3.2 Continued)
47
unknown, the city of residency is assigned to the largest city in the state of residency. For Arizona, the largest city is Phoenix. Therefore, some births that occurred outside of Arizona are included in Maricopa County’s final year end statistics even though the county and city of residence are unknown. For further explanation, please see http://www.cdc.gov/nchs/data/dvs/3amanual.pdf.
During the course of routine data review, several births were identified as being in one county even though their city and ZIP codes indicated that they lived in a different county. For these discrepant cases, final classification in this report was based on the address of the resident. (The address is determined by reviewing the street address, city, county, and ZIP code). Therefore, the numbers presented in this report may not precisely match those presented by ADHS in other reports.
Adequate prenatal care is based on the Adequacy of Prenatal Care Utilization Index (APCUI)1. This
index considers both the timing of prenatal care initiation and the number of visits after care was initiated, comparing the number of actual visits to the number of visits recommended by the American College of Obstetricians and Gynecologists. This index does not describe the quality of the care or adjust for maternal risk factors. Only singleton births (the birth of one baby rather than twins, triplets or other multiple births) are shown in these tables because twins and higher order births are typically higher risk pregnancies, and the index is not appropriate for summarizing their prenatal care usage.
a) Inadequate: Prenatal care began after the fourth month of pregnancy or less than 50% of theexpected prenatal care visits were attended
b) Intermediate: Prenatal care began before the fourth month and 50 to 70% of the expectedvisits were attended
c) Adequate: Prenatal care began prior to the fourth month and 80-109% of expected visitswere attended
d) Adequate plus: Prenatal care began prior to the fourth month of pregnancy and 110% ormore of the expected visits were attended
Infants transferred from Banner Good Samaritan Hospital to Phoenix Children’s Hospital have not been counted as transfers since the two hospitals share facilities, with Phoenix Children’s Hospital providing Neonatal Intensive Care services to infants born at Banner Good Samaritan.
Infant Mortality Statistics
Infant mortality statistics are shown in Tables 2.06a through 2.12b.
Infant mortality statistics shown in this report are from linked and unlinked data as indicated in each table. An explanation of linked and unlinked data is presented below.
The infant mortality rates for older and younger maternal age groups (fewer than 15 and over 45) may be high compared to other groups. These groups have relatively small populations in Maricopa County. Although rates may be high, they may represent only one or two cases in a given category. Therefore, it is advisable to check the raw numbers.
The following definitions related to reproductive health have been established by NCHS2:
Birth or Live Birth3 – The complete expulsion or extraction from the mother of a product of human
conception, irrespective of the duration of pregnancy or birthweight which, after such expulsion orextraction, breathes or shows any other evidence of life such as beating of the heart, pulsation ofthe umbilical cord or definite movement of voluntary muscles, whether or not the umbilical cordhas been cut or the placenta is attached.
Fertility Rate – Number of live births during a calendar year per 1,000 women age 15 to 44.
1 Kotelchuck, M. An Evaluation of the Kessner Adequacy of Prenatal Care Index and a Proposed Adequacy of Prenatal Care
Utilization Index, American Journal of Public Health, 1994; 84(9):1414-1420. 2 NCHS guidelines were adopted from those established by the World Health Organization (WHO).
3 The Arizona statute defining a live birth follows this definition.
48
Births to Teenage Mothers − Live births occurring to females under age twenty.
Birth Weight – The weight of a neonate determined immediately after delivery or as soonthereafter as possible.
Low Birthweight – Any neonate weighing less than 2,500 grams at birth (less than 5 pounds, 8ounces).
Very Low Birthweight – Any neonate weighing less than 1,500 grams at births (less than 3pounds, 4 ounces).
Preterm – Any neonate whose birth occurs through the end of the last day of the 37th week (259
th
day), following onset of the last menstrual period.
Infant Death – Any death at any time from birth up to, but not including, the first year of age (<365days).
Infant Mortality Rate – Number of infant deaths per 1,000 live births.
Neonatal Mortality Rate – Number of deaths to infants at or under 28 days of age, per 1,000 livebirths.
Postnatal (Postneonatal) Mortality Rate – Number of deaths to infants between 29 days and 365days after birth, per 1,000 live births.
Unlinked Infant Mortality – The number of infant deaths in a given calendar year, as determinedfrom mortality records.
Linked Infant Mortality – Whenever possible, infant death certificate data are linked to birthcertificate information to determine parental, demographic and birth data. Not all infant deathscan be linked (up to 3% are lost to follow-up). In this report, MCDPH created a linked deathcohort such that one calendar year of infant death data linked back to the birth data from thecurrent or prior calendar year.
Communicable Disease (Morbidity) Statistics
Communicable disease statistics are shown in Tables 2.13a through 2.15.
The data presented in this report include communicable diseases to residents of Maricopa County. This includes Maricopa County residents who acquired a disease in Maricopa County and residents who acquired a disease elsewhere. Non-Maricopa County residents are not included, even if they acquired a disease in Maricopa County. Other reports or press releases may show different morbidity rates because they include non-residents who acquired disease in Maricopa County or they exclude residents who were exposed outside of the county. For Hansen’s disease only, tables include residents from various counties in Arizona, regardless of where the disease was acquired.
All data on communicable diseases are new cases for each specific year from the ADHS final annual data files. There are several exceptions: data on genital herpes, gonorrhea, Chlamydia, syphilis, and Hansen’s disease are from MCDPH data files.
Data on tuberculosis, STDs, HIV, and AIDS may differ from other reports published by MCDPH and ADHS. Data on these diseases are in databases that may have been updated during the time between reports.
Communicable disease data include only confirmed and probable cases, with the exception of: norovirus, RSV, Hansen’s disease, tuberculosis, genital herpes, gonorrhea, syphilis, chlamydia, and HIV/AIDS. Data for norovirus, RSV, tuberculosis, genital herpes, gonorrhea, syphilis, chlamydia, and HIV/AIDS includes only confirmed cases. Data for Hansen’s disease includes all known “active” cases of Hansen’s
49
disease in Maricopa County, diagnosed between 1955 and 2013. To be considered “active,” the prevalent cases being treated, managed, and followed-up at MCDPH and the Hansen’s disease clinic have to be seen by a Hansen’s disease physician, physical therapist, or occupational therapist within the past five years. This includes all confirmed, suspect, and probable cases diagnosed in Maricopa County, including diagnoses to non-county residents, as mentioned earlier. Other reports or releases may show different prevalence rates, as validation of past data revealed cases that were no longer “active,” causing a drop in the number of “active” cases between the 2009-2011 reported numbers compared to 2012-2013.
Primary and secondary syphilis are shown as “Syphilis-Primary and Secondary.” The “Syphilis - All others” category includes latent and congenital syphilis. These two categories can be added to determine the total number of syphilis cases. Congenital syphilis details may be found in Tables 2.14a and 2.14b.
All communicable disease statistics in this report are new cases for each specified year (incidence). The only exception is Hansen’s disease for which the prevalence (all existing “active” cases from all years) is shown.
Data can be classified by date of onset, date of diagnosis or date of report to the health department. All diseases/conditions listed in this report are classified by the date of report to the health department. The only exceptions are HIV, AIDS, and Hansen’s disease which are classified by the date of diagnosis.
The category “Encephalitis Viral Other” includes St. Louis encephalitis and all other types of viral encephalitis except for West Nile virus. This may differ somewhat from other reports that include only certain types of encephalitides.
In 2012, the case definition of Lyme Disease changed, which may explain the sudden increase in numbers in 2013 (n=16).
In 2009, a major laboratory changed their reporting practices of Coccidioidomycosis, causing a significant increase in reported cases in subsequent years. Changes in testing practices may account for the significant drop of cocci cases in 2013.
Comparison of hepatitis B cases from 2009-2013 to previous years will show a decrease in the total number of cases. This decrease is most likely due to changes in the investigation of the disease and not due to a change in the communicability of the disease in Maricopa County.
A sharp decrease in the number of reported cases of genital herpes occurred in 2009. A review of the cases indicated a large decrease in the number of laboratory reported cases. Although no explanation for this decrease has been identified, it is not believed to be due to an actual decrease in the incidence of disease in the community. In 2012, ADHS removed Genital Herpes from the administrative code of reportable diseases, resulting in the significant decrease between 2012 and 2013.
In Tables 2.13a and 2.13b, the category labeled “All Others” includes all reportable diseases in the ADHS communicable disease database that are not listed previously on the table.
Hospital Discharge Statistics
Hospital Discharge statistics are shown in Tables 2.16a through 2.17b.
Hospital Discharge Data (HDD) is submitted by Arizona Hospitals to Arizona Department of Health Services (ADHS). Data is submitted by half years, with the first half (January 1 – June 30) is due August 15 of the same year and the second half (July 1 – December 31) is due by February 15
th of the following
year. ADHS then prepares the data for public release and the data are released between 3 and 6 months after collection. This dataset only contains hospitalizations from facilities within the state of Arizona. Hospitalizations of Maricopa Residents that occur outside of Arizona are not captured.
HDD provides an address for each patient but does not include information about the county of residence. In order to select Maricopa County Residents, an algorithm was derived to determine residence based on
50
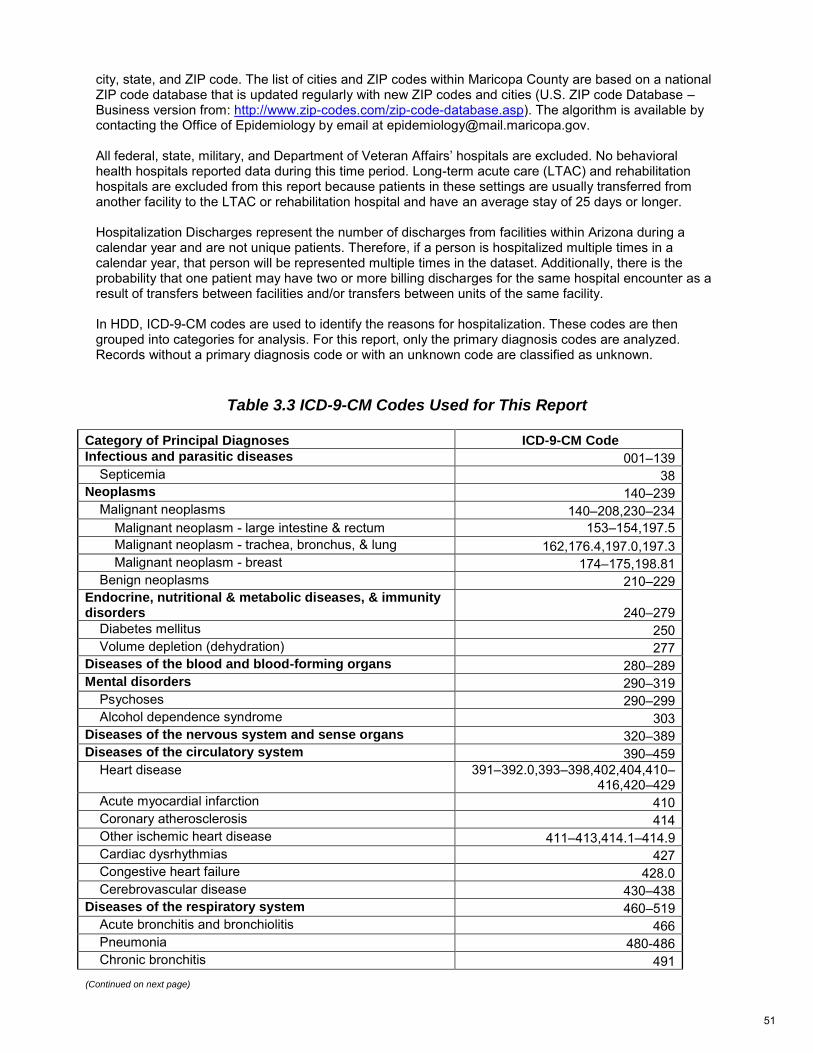
city, state, and ZIP code. The list of cities and ZIP codes within Maricopa County are based on a national ZIP code database that is updated regularly with new ZIP codes and cities (U.S. ZIP code Database – Business version from: http://www.zip-codes.com/zip-code-database.asp). The algorithm is available by contacting the Office of Epidemiology by email at [email protected].
All federal, state, military, and Department of Veteran Affairs’ hospitals are excluded. No behavioral health hospitals reported data during this time period. Long-term acute care (LTAC) and rehabilitation hospitals are excluded from this report because patients in these settings are usually transferred from another facility to the LTAC or rehabilitation hospital and have an average stay of 25 days or longer.
Hospitalization Discharges represent the number of discharges from facilities within Arizona during a calendar year and are not unique patients. Therefore, if a person is hospitalized multiple times in a calendar year, that person will be represented multiple times in the dataset. Additionally, there is the probability that one patient may have two or more billing discharges for the same hospital encounter as a result of transfers between facilities and/or transfers between units of the same facility.
In HDD, ICD-9-CM codes are used to identify the reasons for hospitalization. These codes are then grouped into categories for analysis. For this report, only the primary diagnosis codes are analyzed. Records without a primary diagnosis code or with an unknown code are classified as unknown.
Table 3.3 ICD-9-CM Codes Used for This Report
Category of Principal Diagnoses ICD-9-CM Code
Infectious and parasitic diseases 001–139
Septicemia 38
Neoplasms 140–239
Malignant neoplasms 140–208,230–234
Malignant neoplasm - large intestine & rectum 153–154,197.5
Malignant neoplasm - trachea, bronchus, & lung 162,176.4,197.0,197.3
Malignant neoplasm - breast 174–175,198.81
Benign neoplasms 210–229
Endocrine, nutritional & metabolic diseases, & immunity disorders 240–279
Diabetes mellitus 250
Volume depletion (dehydration) 277
Diseases of the blood and blood-forming organs 280–289
Mental disorders 290–319
Psychoses 290–299
Alcohol dependence syndrome 303
Diseases of the nervous system and sense organs 320–389
Diseases of the circulatory system 390–459
Heart disease 391–392.0,393–398,402,404,410–416,420–429
Acute myocardial infarction 410
Coronary atherosclerosis 414
Other ischemic heart disease 411–413,414.1–414.9
Cardiac dysrhythmias 427
Congestive heart failure 428.0
Cerebrovascular disease 430–438
Diseases of the respiratory system 460–519
Acute bronchitis and bronchiolitis 466
Pneumonia 480-486
Chronic bronchitis 491
(Continued on next page)
51
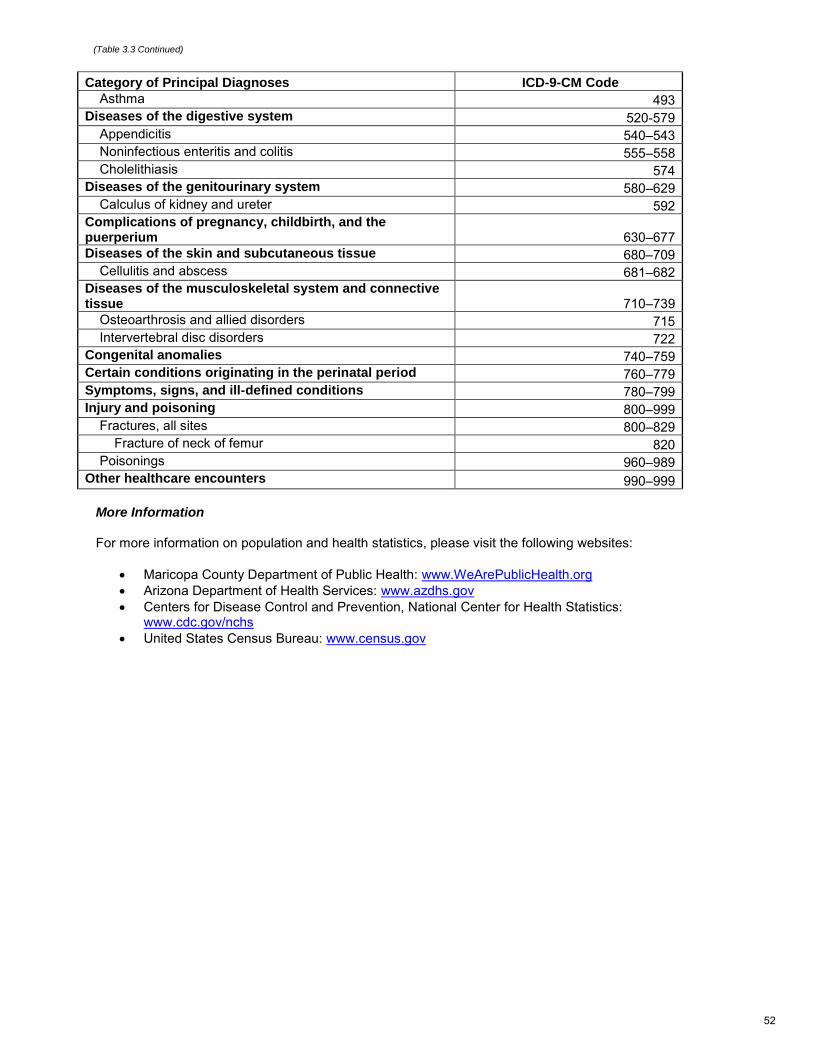
Category of Principal Diagnoses ICD-9-CM Code
Asthma 493
Diseases of the digestive system 520-579
Appendicitis 540–543
Noninfectious enteritis and colitis 555–558
Cholelithiasis 574
Diseases of the genitourinary system 580–629
Calculus of kidney and ureter 592
Complications of pregnancy, childbirth, and the puerperium 630–677
Diseases of the skin and subcutaneous tissue 680–709
Cellulitis and abscess 681–682
Diseases of the musculoskeletal system and connective tissue 710–739
Osteoarthrosis and allied disorders 715
Intervertebral disc disorders 722
Congenital anomalies 740–759
Certain conditions originating in the perinatal period 760–779
Symptoms, signs, and ill-defined conditions 780–799
Injury and poisoning 800–999
Fractures, all sites 800–829
Fracture of neck of femur 820
Poisonings 960–989
Other healthcare encounters 990–999
More Information
For more information on population and health statistics, please visit the following websites:
Maricopa County Department of Public Health: www.WeArePublicHealth.org
Arizona Department of Health Services: www.azdhs.gov
Centers for Disease Control and Prevention, National Center for Health Statistics:www.cdc.gov/nchs
United States Census Bureau: www.census.gov
(Table 3.3 Continued)
52