
THE MARICOPA COUNTY DEMAND REDUCTION PROGRAM · located in Maricopa County, Arizona initiated the...
20
, • 'f • .' ! ' RESPONDING TO CASUAL DRUG USERS: AN EVALUATION REPORT OF THE MARICOPA COUNTY DEMAND REDUCTION PROGRAM Prepared by: John R. Hepburn, Ph. D. Arizona State University C. Wayne Johnston, Research Analyst and Scott Rogers, Computer Specialist with contributions from: Celesta Albonetti, Ph. D. Texas A&M University and Scott Decker, Ph. D. University of Missouri-St. Louis April,1992 This evaluation is based on data obtained by the Arizona Institute for Criminal Justice under National Institute of Justice Grant 89-DD-CX-0055, U.S. Department of Justice. Data analyses, interpretations, conclusions, and recommendations expressed within this document are those of the authors and do not necessarily represent the position or policy of either the Arizona Institute of Criminal Justice or the U.S. Department of Justice. .'" 31 1992 ACQUISITION S If you have issues viewing or accessing this file contact us at NCJRS.gov.
-
Upload
trinhkhanh -
Category
Documents
-
view
222 -
download
2
Transcript of THE MARICOPA COUNTY DEMAND REDUCTION PROGRAM · located in Maricopa County, Arizona initiated the...

, • 'f
•
.'
! '
EXECUTIVESU~ARY
RESPONDING TO CASUAL DRUG USERS:
AN EVALUATION REPORT OF
THE MARICOPA COUNTY DEMAND REDUCTION PROGRAM
Prepared by:
John R. Hepburn, Ph. D. Arizona State University
C. Wayne Johnston, Research Analyst and
Scott Rogers, Computer Specialist
with contributions from:
Celesta Albonetti, Ph. D. Texas A&M University
and Scott Decker, Ph. D.
University of Missouri-St. Louis
April,1992
This evaluation is based on data obtained by the Arizona Institute for Criminal Justice under National Institute of Justice Grant 89-DD-CX-0055, U.S. Department of Justice. Data analyses, interpretations, conclusions, and recommendations expressed within this document are those of the authors and do not necessarily represent the position or policy of either the Arizona Institute of Criminal Justice or the U.S. Department of Justice.
.'" 31 1992
ACQUISITION S
If you have issues viewing or accessing this file contact us at NCJRS.gov.
U.S. Department of Justice National Institute of Justice
138224
This document has been reproduced exactly as received from the person or organization originating it. Points of view or opinions stated in this document are those of the authors and do not necessarily represe nt the official po~ition or policies of the National Institute of Justice.
Permission to reproduce this '. 'f J material has been granted by
_ PJJbl j C Doma j n/NIJ U.S. Depa;r:tment of Justice
to the National Criminal Justice Reference Service (NCJRS),
Further reproduction outside of the NCJRS system requires permission of the • U" owner.
'. , It .'
•
•
•
•
•
I.-
ACKNOWLEDGEMENTS
Many persons, representing a variety of agencies, contributed to this evaluative study. Their cooperation and insights aided in the development of the evaluation design and in the collection of data. Their support, which was critical to the completion of the study, is greatly appreciated and only briefly acknowledged.
*Maricopa County Attorney's Office: Richard M.Romley, Maricopa County Attorney; Jerry Landau, Chief, Controlled Substances Division; William Parks, Chief, Narcotics Bureau; Henry Ong, Deputy County Attorney; Gloria Nakamura, Secretary;
*Phoenix Police Department: Ruben Ortega, Chief; John Buchanan, Captain; James Watson, Lieutenant; Leslie Mihata Bloom, Public Relations Specialist.
*Maricopa County Sheriff's Office: Thomas Agnos, Sheriff; John Coppoch, Major; Jesse Locksa, Major;
*Maricopa County Law Enforcement Information System: Thomas Davidson,Director;
Glen Beard, Systems Group Manager; Bob Beeks, Computer Specialist ill; Warren Petersen, Systems Analyst IV; Fred Gresbach, Programmer Analyst ill; Michael Mai, Computer Specialist ill;
*Treatment Assessment Screening Center, Inc.: Barbara Zugor, Executive Director; Ron Rian, Associate Director;
*Drug Enforcement Administration, Phoenix Office: Thomas Childers, Senior Special Agent, Demand
Reduction Coordinator.
•
•
•
DEMAND REDUCTION EVALUATION ...
1
RESPONDING TO CASUAL DRUG USERS: AN EVALUATION REPORT OF
THE MARICOPA COUNTY DEMAND REDUCTION PROGRAM
I. USER ACCOUNTABILITY AS DEMAND REDUCTION
Early efforts to call attention to the need for demand reduction emphasized education, prevention, and treatment. More recently, law enforcement and punishment -- which had been the exclusive province of the supply-side effort -- became a part of the strategy to reduce demand. With the passage of the Anti-Drug Abuse Act of 1988, a national policy of "user accountability" was established. Casual drug use was viewed as an integral and contributing part of the national drug problem, and a broad-based range of social and legal sanctions were to be used to hold these drug users accountable for their illegal and irresponsible behavior. Drug users -- even casual users -- are seen as a criminal justice problem because they provide the customer base for the criminogenic suppliers of these illegal drugs. Drug users are criminal co-conspirators, and legal remedies should impact ,?n both the supply side and the demand side of this conspiracy.
II. THE MARICOPA COUNTY DEMAND REDUCTION PROGRAM
A consortium of 26 municipal, county, state, and federal law enforcement agencies located in Maricopa County, Arizona initiated the Maricopa County Demand Reduction Program in March, 1989. Originally designed to address "the escalating problem of illegal drug use" in the City of Phoenix and surrounding metropolitan area, the Program sought two objectives. First, the Program wanted to create a community-wide awareness of the severity of the drug problem -to develop a moral consensus -- and to alert drug users to the increased risk of legal sanctions. The message that drug users are subject to criminal penalty has been widely disseminated through the public campaign slogan "DO DRUGS.DO TIME." Second, the Program adopted a zero-tolerance position of User Accountability: increased and coordinated law enforcement activities, combined with either full prosecution or diversion to treatment in lieu of prosecution, were believed to reduce the demand for drugs.
A. Program Components and Process
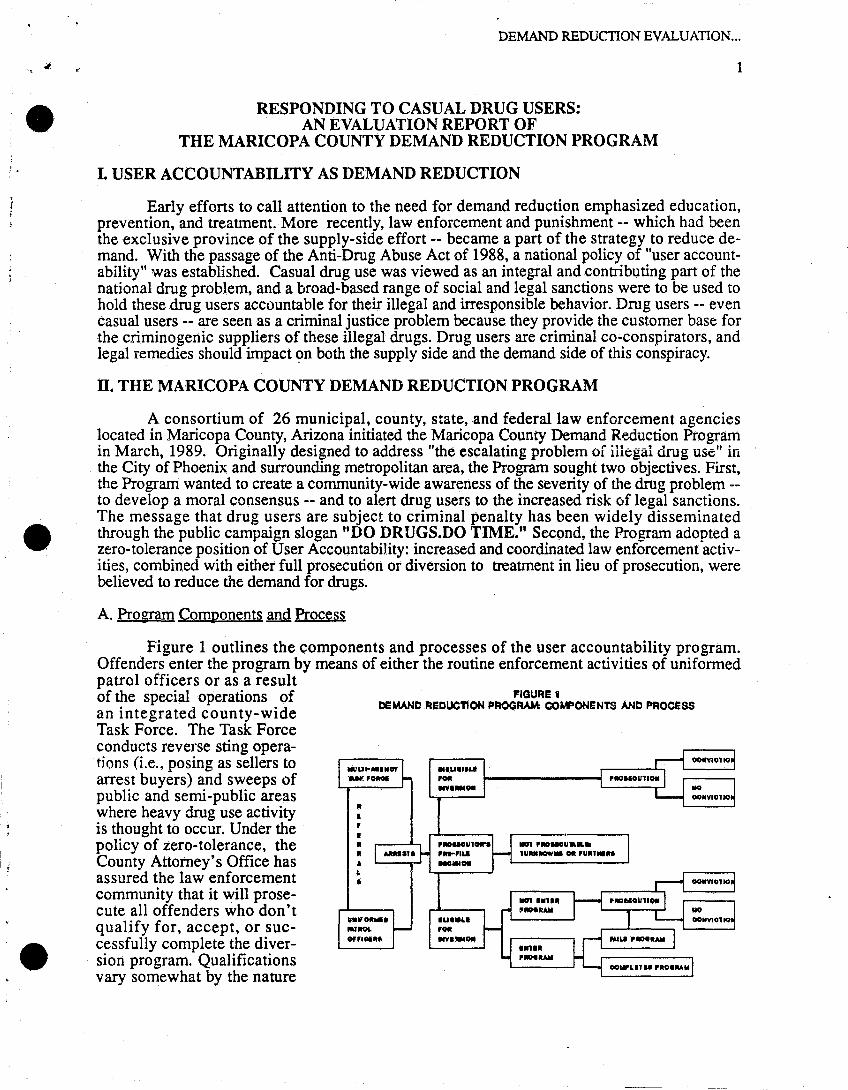
Figure 1 outlines the components and processes of the user accountability program. Offenders enter the program by means of either the routine enforcement activities of uniformed patrol officers or as a result of the special operations of an integrated county-wide Task Force. The Task Force conducts reverse sting opera-tjons (i.e., posing as sellers to arrest buyers) and sweeps of public and semi-public areas where heavy drug use activity is thought to occur. Under the policy of zero-tolerance, the County Attorney's Office has assured the law enforcement community that it will prosecute all offenders who don't qualify for, accept, or successfully complete the diversion program. Qualifications vary somewhat by the nature
FIGURE 1 DEMAND REDUCTION PROGRAM: COW'ONENTS AND PRoceSS
lit
• , • lit II A L
•
0"1010
•• ualN.II '011 1--------.( .." .... 011
'011 ..".,.,011
•
•
•
DEMAND REDUCTION EVALUATION ...
2
of the drug possessed, but their general purpose is to offer diversion to only casual users with no prior criminal history. Finally, the Adult Deferred Prosecution Drug Program is a TASC-operated community-based treatment program designed to reduce subsequent drug use. Eligible offenders may reject the diversion program, but those who enter the program must agree to meet all program conditions, including random urinalysis monitoring, and pay all fees for their own treatment (with a sliding fee schedule for lower income and indigent offenders).
B. Features .Qf the Demand Reduction Program
In general, the program is characterized by five features. First, this is a comprehensive program which integrates education, law enforcement, and treatment into a unified campaign against casual drug use. Second, there is complete participation of all law enforcement agencies in the affected area, thereby providing a singular voice, a unified program plan and a pool of personnel, equipment, information, and other resources designed specifically for this program.
FIGURE 2
SCHEDULE OF FEES AND FINES PAID In' PERSONS DIVERTED TO TREATMENT·
TYPE OF DRUG CHARGE
POSSESS MARIJUANA
POSSESS OBTAIN DANGEROUS OTHER COCAINE DRUC$-FAAUO DRUGS
OFFENDER PA"8:
JAIL HOUSE FEE
AZ DRUG ENFORCEMENT FUND
ISO
MOO
860 t60
11200 8no
ISO
• 8760-11200
TREATMENT PROGRAM FEE 8111 116M/)'r 81111 HOI ------
TOTAL COST: .. u
PROGRAM LENGTH: "'Mot. ,.2 YRI. ,.2 YR8.
• AIIIZOU allu. II'OIICDI .. T ,ula AIID TllurMDT PIIa.1IAM .... AIII1II\IVlD .011 PIII.a .. WNO MIlT .-11 ___ a •• la •• DeY
• ACTUAL AMaUIT a, pUla .11 ..,. .. .,. TYI'I DP DIIU ..
816061 82066
,.2 YRI.
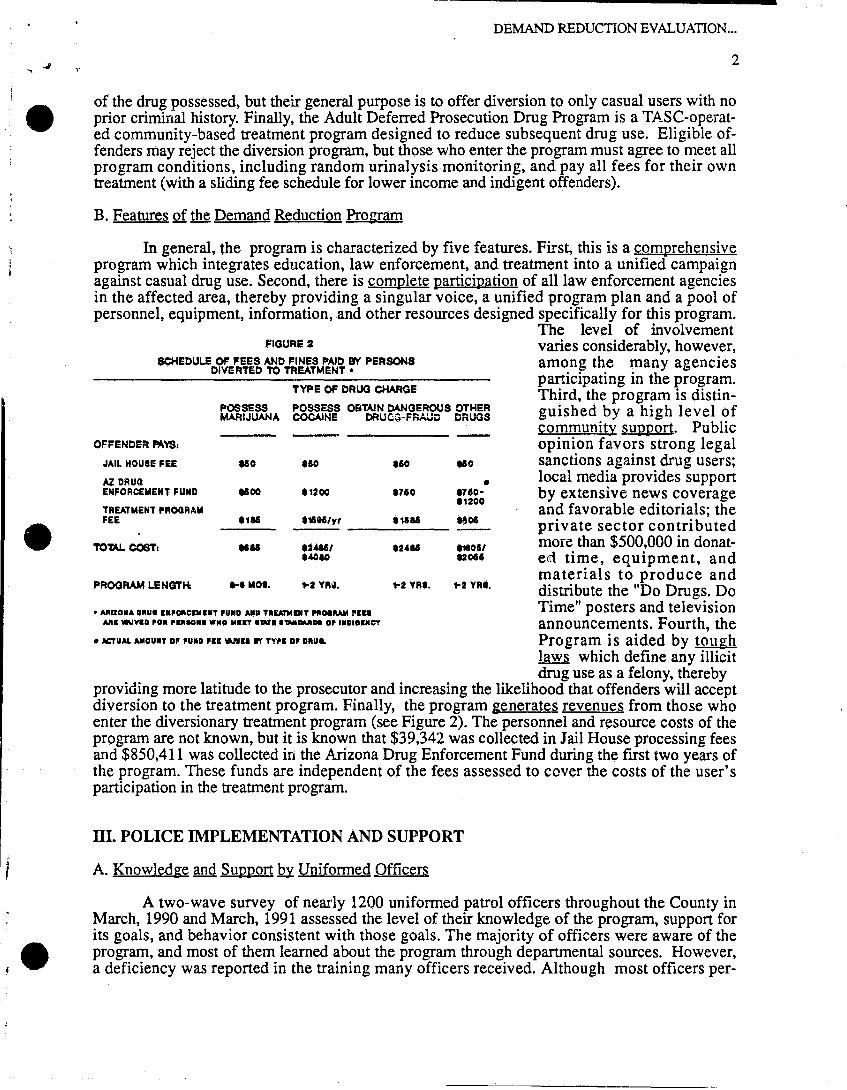
The level of involvement varies considerably, however, among the many agencies participating in the program. Third, the program is distinguished by a high level of community support. Public opinion favors strong legal sanctions against drug users; local media provides support by extensive news coverage and favorable editorials; the private sector contributed more than $500,000 in donated time, equipment, and materials to produce and distribute the "Do Drugs. Do Time" posters and television announcements. Fourth, the Program is aided by tough laws which define any illicit drug use as a felony, thereby
providing more latitude to the prosecutor and increasing the likelihood that offenders will accept diversion to the treatment program. Finally, the program generates revenues from those who enter the diversionary treatment program (see Figure 2), The personnel and resource costs of the program are not known, but it is known that $39,342 was collected in Jail House processing fees and $850,411 was collected in the Arizona Drug Enforcement Fund during the first two years of the program. These funds are independent of the fees assessed to cover the costs of the user's participation in the treatment program.
ITI. POLICE IMPLEMENTATION AND SUPPORT
A. Knowledge and Support .Qy Unifonned Officers
A two-wave survey of nearly 1200 uniformed patrol officers throughout the County in March, 1990 and March, 1991 assessed the level of their knowledge of the program, support for its goals, and behavior consistent with those goals. The majority of officers were aware of the program, and most of them learned about the program through departmental sources. However, a deficiency was reported in the training many officers received. Although most officers per-

•
•
•
----------------------------------------------------~~ ,
DEMAND REDUCTION EVALUATION ...
3
ceived no increased levels of prosecution against casual drug users, a majority of officers felt that diversion of cases to treatment had occurred. Many officers also indicated they had increased their own enforcement efforts, and an even larger number felt that their department was making a greater effort in the enforcement of laws against casual drug use. It appears, however, that uniformed officers should receive periodic information and training sessions regarding the program and systematic updates on the operations of the program and the outcome of cases submitted by that agency.
B. Task Force Operations
A small but highly visible role was delegated to the Task Force, which conducted a total of 38 operations, producing a total of 730 arrests during the first two years of the program's operation. Table 1 indicates that these operations were nearly evenly divided between sweeps and reversals, with reversals accounting for a somewhat higher proportion of the total number of persons arrested by the Task Force. Since more arrests followed reversals than sweeps, the higher number of arrests found in the East Region, compared to the West Region, may reflect the greater use of reversals in the East Region. The type of drug charge is related to the type of Task Force operation: sweeps account for 96 percent of all persons charged with possession, whereas reversals netted 99 percent of those charged with attempt to possess, 82 percent of those charged with sales or offering for sale, and 82 percent of those charged with non-drug offenses. Of the 552 cases submitted to the Demand
TABLE 1 SUMMARY OF TASK FORCE OPERATIONS
MARCH, 1989 - FEBRUARY, 1991
OPERATION :ITU Sweep Reversal warrant
OP~MpON ~ central West Multi-Region
CHb~ ~E --pQSSeSS"Harijuana
Possess Narcotic Drug Possess Dangerous Drug Attempt-Possess Narcotic Drug sale/Offer for Sale Drug Paraphernalia Other Drug Charge Non~Drug Charges No Charges
TOTAL: ~tO~~g~ted to
County Attorney Submitted to Other unit at Countv Attorney
Further Turndown File Unknown
Submitted to Demand Reduction Program
Further Turndown File Divert TASC
TOTAL:
NUMBER OF OPERATIONS
19
(~i
3 16 41 11
10 85
154 303
308 391
7H
201 397
77
7%
234 78 15
300 56
7 5
33
73t 76
71
552
ARRESTS !
42.2 53.6 42"
10~
27.5 54.4 10.6 7.5
100.0
32.0 10.7
2 •. 0 41.1 7.7 1.0 0.7 4.5
10H
10.9
10.2 4.2
22.5 57.8 15.5
78.9 1.8
15.4 27.9 54.9
'I'U'u.U
R~jl.>ction Program, about 17 percent were turned down or returned for further information, 55 percent were referred to TASC for treatment, and 28 percent were filed on and prosecuted.
If the value of Task Force operations were based simply on the number of persons arrested and either prosecuted or diverted to TASC, this number could not justify the Task Force's very high costs in time, resources, and personnel. But the value of the Task Force resides in its ability, especially when aided by local electronic and print media, to provide the requisite highprofile activities designed to alert the public that drug users are being legally sanctioned. Occurring at a rate of more than one per month. these operations are sufficiently frequent within, and geographically dispersed around, Maricopa County to achieve their intended purpose. In sum, Task Force operations are the visible personification of the "DO DRUGS.DO TIME." campaign .

•
•
DEMAND REDUCTION EVALUATION ...
4
IV. PROGRAM IMPACT •• CASE PROCESSING AND OUTCOMES
The evaluation of the operations and impact of the Demand Reduction Program is based on a study of 7012 persons against whom criminal charges were submitted to, and initially reviewed 1;>y, the County Attorney's Demand Reduction Program during the Program's first twenty-four months, from March, 1989 through February, 1991.
A. Prosecutorial Review
Information about those cases submitted to the County Attorney is summarized in Figure 3 and Table 2. Fewer than one-fifth of these cases were rejected by the County Attorney's Office. When cases were rejected, they were overwhelmingly likely to be turned down rather than returned for further information. The reasons for turning down a case were (1) no conviction
FIGUFtE a . INITIAL REVIEWING DECISION OUTCOMES, All. CASES, MARCH, sa; - FEBRUARY, UIIU
COUNTY ATTORNEY REVIEW
7012 100t.
I
likely (70.7 percent), (2) questions of search and seizure or other legal issues (21.5 percent), and (3) referral to another agency or jurisdiction (7.8 percent). Select offender and offense characteristics, in Table 2, indicate that persons referred to the Demand Reduction Program tend to be young, Anglo, male and first offenders. The majority of the cases originated from the Phoenix Police Department, charged the person with a
17171U .. 'PROSECUtABLE
1271 .. 2 .. , NOT PROSECUTABLE I
single count, and charged possession of either marijuana or cocaine.
ELIGIBLE FOR INELIGIBLE FOR DIVERSIOH TO DIVERSION TO TREATMENT TREATMENT 41&772 .... '17027.4"
·.,. .... DIIf.~ ...... 1. ....
TURNDOWN FURTHER
1122 u.0'I. 1&1 12.0'1.
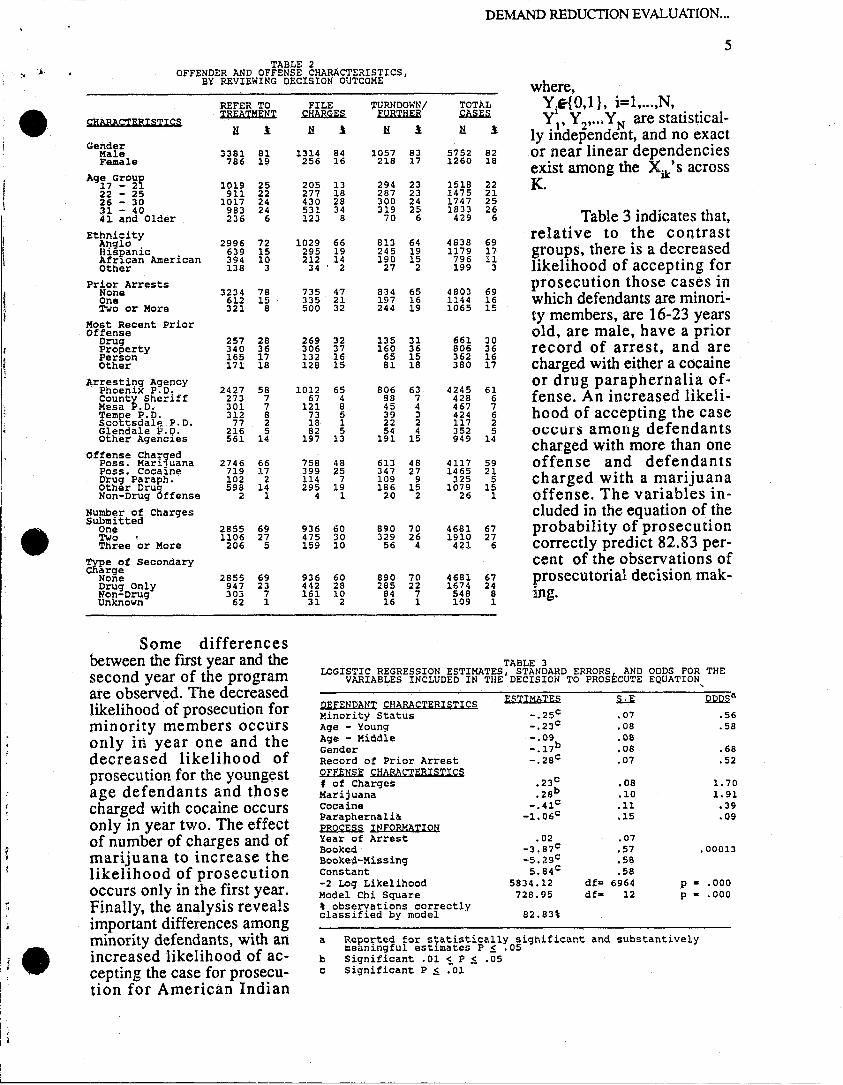
A breakdown of offender and offense characteristics by outcome of the reviewing decision reveals important differences. Prior arrest record and the nature and type of drug use are formal criteria in determining eligibility for diversion to treatment, and they are reflected in the eligibility decisions which were made. First offenders comprise 78 percent of the cases referred to treatment, but only 47 percent of the cases which were deemed ineligible for diversion. Similarly, cases referred to treatment have fewer charges submitted than do those cases filed. Also, cases referred to treatment are much more likely to be charged with marijuana and much less likely to be charged with cocaine or another drug than are those cases filed.
A series of logistic regression equations is used to estimate the main effects of select defendant characteristics, offense characteristics, and process information on two decisions by the County Attorney's Office. One is the initial decision that the case is prosecutable -- i.e., that the strength of the case warrants it be accepted for prosecution rather than be rejected and returned to the submitting agency. The second decision is the determination that the case either is or is not eligible for deferred prosecution pending successful completion of the TASC treatment program. These two decisions by the prosecutor affect the number and type of cases entering into and moving through the Demand Reduction Program. The dependent variable is assumed to depend on K observable variables that account for variation in the probability that P=1. The assumptions guiding the analysis of the decision to prosecute and the decision to divert are those associated with a logit model defined as:
P(Y=ltX) = exp(t.bkXk)/[I+exp(tbkX.)],
•
•
•
DEMAND REDUCTION EVALUATION ...
5 TABLE 2
OFFENDER AND OFFENSE CHARACTERISTICS, BY REVIEWING DECISION OUTCOME where,
CHARACTERISTICS
Gender Male Female
Age Group 17 - 21 22 - 25 26 - 30 Jl - 40 41 and Older
Ethnicity A~glo . Hl.spanJ.c Afrl.can American Other
Prior Arrests None One Two or More
Most Recent prior Offense
Drug Property Person Other
Arresti~g Agency Phoenl.x P.O. County Sheriff Mesa P.O. Tempe P.O. Scottsdalp,P.D. Glendale k'.D. Other Agencies
Offense Charged Poss. Mari,uana Poss. cocaIne Drug Paraph. Other Drug Non-Drug Offense
Number of Charges Submitted
One Two Three or More
TYPe of Secondary Cnarge
None Drug only Non-Drug Unknown
REFER TO TREATMENT
Ii 1
3381 81 786 19
1019 25 911 22
1017 24 983 24 236 6
2996 72 639 15 394 10 138 3
3234 78 612 15 321 8
257 28 340 36 165 17 171 18
2427 58 273 7 301 7 312 8
77 2 216 5 561 14
2746 66 719 17 102 2 598 14
2 1
2855 69 1106 27
206 5
2855 69 947 23 303 7
62 1
Some differences between the fIrst year and the second year of the program are observed. The decreased likelihood of prosecution for minority members occurs only in year one and the decreased likelihood of prosecution for the youngest age defendants and those charged with cocaine occurs only in year two. The effect of number of charges and of marijuana to increase the likelihood of prosecution occurs only in the first year. Finally, the analysis reveals important differences among minority defendants, with an increased likelihood of accepting the case for prosecution for American Indian
FILE CHARGES
Ii 1
1314 84 256 16
205 13 277 18 430 28 531 34 123 8
1029 66 295 19 212 14 34' 2
735 47 335 21 500 32
269 32 306 37 132 16 128 15
1012 65 67 4
121 8 73 5 18 1 82 5
197 13
758 48 399 25 114 7 295 19
4 1
936 60 475 30 159 10
936 60 442 28 161 10
31 2
TURNDOWN! FURTHER
Ii 1
1057 83 218 17
294 23 287 23 300 24 319 25
70 6
813 64 245 19 190 15
27 2
834 65 197 16 244 19
135 31 160 36
65 15 81 18
806 63 88 7 45 4 39 :I 22 2 54 4
1.91 15
613 48 347 27 109 9 186 15
20 2
890 70 329 26
56 4
890 70 285 22
84 7 16 1
TOTAL ~
H 1
5752 82 1260 18
1518 22 1475 21 1747 25 1833 26
429 6
4838 69 1179 17
796 11 199 3
4803 69 1144 16 1065 15
661 30 806 36 362 16 380 17
4245 61 428 6 467 7 424 6 117 2 352 5 949 14
4117 59 1465 21
325 5 1079 15
26 1
4681 67 1910 27
421 6
4681 67 1674 24
548 8 109 1
Y.E{O,l}, i=l, ... ,N, Y~, Y 2"" Y N are statistical
ly independent, and no exact or near linear dependencies exist among the Xik's across K.
Table 3 indicates that, relative to the contrast groups, there is a decreased likelihood of accepting for prosecution those cases in which defendants are minority members, are 16-23 years old, are male, have a prior record of arrest, and are charged with either a cocaine or drug paraphernalia offense. An increased likelihood of accepting the case occurS among defendants charged with more than one offense and defendants charged with a marijuana offense. The variables included in the equation of the probability of prosecution correctly predict 82.83 percent of the observations of prosecutorial decision making.
TABLE 3 LOGISTIC REGRESSION ESTIMATES, STANDARD ERRORS~ AND ODDS FOR THE
VARIABLES INCLUDED IN THE DECISION TO PROSt;CUTE EQUATION
DEFENDANT CHARACTERISTICS Minority status Age - Young Age - Middle Gender Record of Prior Arrest ~~ CHABbGTERISTICS t of Charges Marijuana Cocaine Paraphernali", PROCESS INFORMATION Year of Arrest Booked Booked-Missing Constant -2 Log Likelihood Model Chi Square , observations correctly classified by model .
ES.TIMATES
-.25c -.23 c -.09 _.17b
_.28 c
.02 -3.87c -5.29c
5.84 c 5834.12 728.95
82.83%
df= df-
.07
.08
.08
.08
.07
.08
.10 .11 .15
.07 .57 .58 .58
6964 12
,
.56
.58
.68
.52
1. 70 1.91
.39
.09
.00013
p ... 000 p - .000
a Reported for statistically significant and substantively meaningful estimates P ~ .05
b Significant .01 ~ P ~ .05 c Significant P ~ .01
•
•
•
DEMAND REDUCTION EVALUATION. ..
6
defendants and a decreased likelihood of accepting the case for prosecution for Hispanic and African-American defendants.
TABLE 4 LOGISTIC REGRESSION ESTIMATESL STANDARD ERRORSL AND ODDS FOR THE
VARIABLES INCLUDED IN TH~ DECISION TO DIV~RT EQUATION -
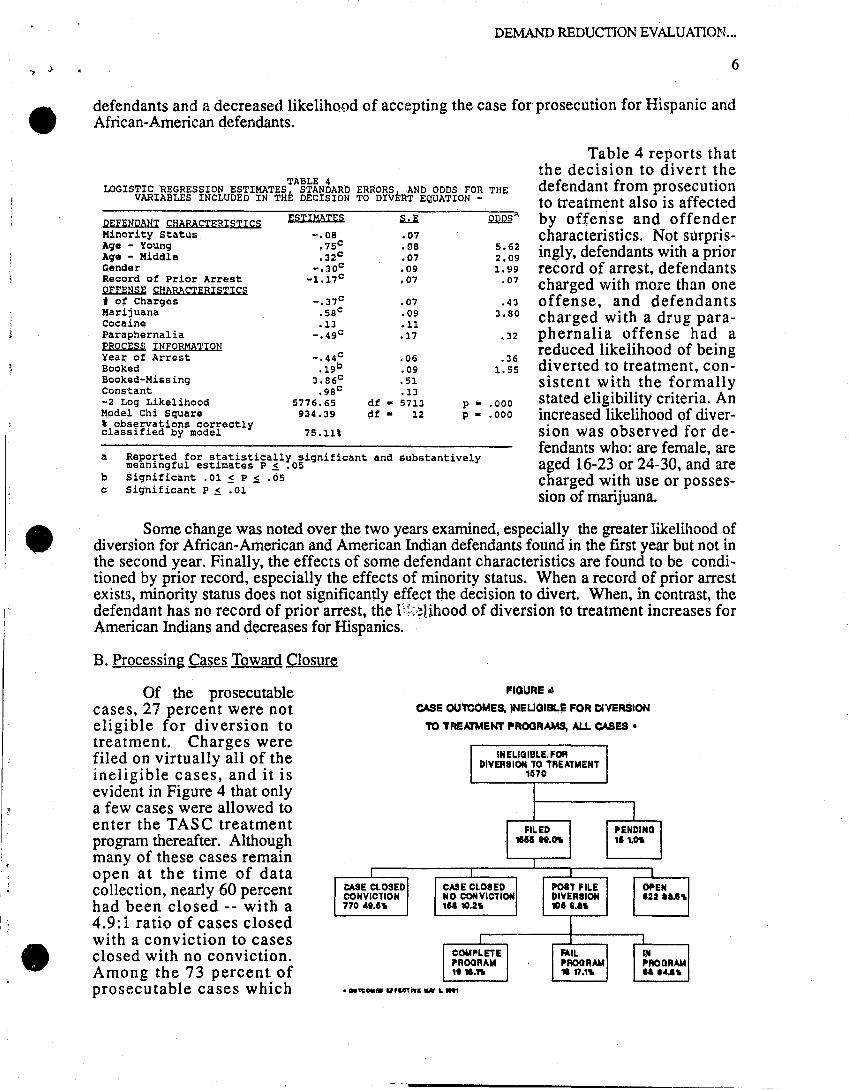
Table 4 reports that the decision to divert the defendant from prosecution to treatment also is affected by offense and offender characteristics. Not surprisingly, defendants with a prior record of arrest, defendants charged with more than one offense, and defendants charged with a drug paraphernalia offense had a reduced likelihood of being diverted to treatment, consistent with the formally stated eligibility criteria. An increased likelihood of diversion was observed for defendants who: are female, are aged 16-23 or 24-30, and are charged with use or possession of marijuana.
DEFENDANT CHARACTEEI~ ESTIMATES ~
Minority Status -.08 .07 Age - Young .75c .08 Age - Middle .32c .07 Gender -.30c .09 Record ot Prior Arrest -1.17c .07 QII~H~~ ~H~RACT~BI~II~~ t of Charges -.37c .07 Marijuana .58c .09 Cocaine .13 .11 Paraphernalia -.49c .17 EBQ~~:i~ IHEQBHAIIQtl Year of Arrest -.44c .06 Booked .19b .09 Booked-Missing 3.86c .51 Constant .98c .13 -2 Log Likelihood 5776.65 df • 5713 P -Model Chi Square 934.39 dt • 12 P -, observations correctly classified by model 75.11\
a Repo~ted for statistically significant and substantively mean~ngful est~mates P ~ .05
b Significant .01 ~ P ~ .05 c Significant P ~ .01
.QJ.U2§'1
5.62 2.09 1.!!l9
.07
.43 3.80
,32
.36 1.55
.000
.000
Some change was noted over the two years examined, especially the greater likelihood of diversion for African-American and American Indian defendants found in the fIrst year but not in the second year. Finally, the effects of some defendant characteristics are found to be conditioned by prior record, especially the effects of minority status. When a record of prior arrest exists, minority status does not significantly effect the decision to divert. When, in contrast, the defendant has no record of prior arrest, the r;>~lihood of diversion to treatment increases for American Indians and decreases for Hispanics.
B. Processing Cases Toward Closure
Of the prosecutable cases, 27 percent were not eligible for diversion to treatment. Charges were filed on virtually all of the ineligible cases, and it is evident in Figure 4 that only a few cases were allowed to enter the TASC treatment program thereafter. Although many of these cases remain open at the time of data collection, nearly 60 percent had been closed -- with a 4.9: 1 ratio of cases closed with a conviction to cases closed with no conviction. Among the 73 percent of prosecutable cases which
CASE ClOSED CONVICTION 770.&.1 ..
FIQURE .,
CASE OUTCOMES, INEUQIBLE FOR DIVERSION
TO TREATMENT PROQRAMS, AU. CASES •
INELIGIBLE. FOR DIVERSIOH TO TREATMENT
11170
l I
FILED PENDING I 1611 ".Ott 111.Ott
CASE CLOSED 1"08T FILE OPEN NO CONVICTIOH DIVERSIOH 122 ...... '" 10.2" 'lOll •• "
I COMPLETE I ~IL ,I 1M PROORAM PROGRAM PROGRAM "11.'" 1117.'" ..........

_ ..t"-k'\
•
I Not E"t., P,oar ...
215113 12.3'"
I I
R.lu •• P,og,a ..
351 13.S'"
1 Fila
361 10010
I I I I
c ... c ... .... t FII. Clo .. cI CI ..... DI ... ,olo" Co"vlct No Co"vlc'
121 34.S'" 14 ...... SIS 10 ...
I r •
Co .. ,"" Fa" P ....... P,oa""
, 10.0'" .. 11.4'"
• FIGURE 5
CASE OUTCOMES, ELIGIBLE FOR DIVERSION TO TREATMENT PROGRAM, ALL CASES ~
Eligible for Diversion
to Treatment
"167
"."cll"g
'22 I .....
I H • .... , ••••
T. L.Uer
lUi .... ,.
I I I
Tu,,,cI_,, PII. Fu,th.,
,., ...... 10., It .....
I I I I -.
0,." C ... C ... .... , PII. 0,." C ••• C, .... Clo .. cI DI ... ,o'." Clo .. " C.",,'at No Co"vlct Convict
171 4 •• 7 ... "' al.2'" '" .... III 11.S'" .., .... , ... 140 48.4'"
I I I 1
I" c ••• ~ F." ,,,
P,og .... Prog'." P,og, ... ..,.g, ...
2408 ..... II 38.1'10 411 •• 1 ... ~'O 43.711
'---- '-- -- --
• OUTCOMES EFFECTIVE MA.Y 1. laal
• 'i
'"
I E"I.,
",og, ...
1452 34.8'"
I I I I -
C •• ,I.t. 'ft Fa .. ..,." .. ",og, ... ",og, ...
... 1t.1'" 304 10 ..... 18. 11.''10
I FII ..
18. '00'10
I I I I
c ... "o.t FII. Op." Cloncl DI ..... lo"
No Co"vlct II 7.S'" 3 1.0'" 1215 43.''10
I I I I
Co .. ,I.,. F.II I" "'0" ... P,og .... P,oara ..
1 33.3'" 0 0 ... 2 U.7'1.
, '>
•
•
••
DEMAND REDUCTION EVALUATION ...
8
were eligible for diversion to treatment (see Figure 5), only 35 percent accepted the initial offer to be diverted to treatment. That is, only 1452 (or about 25 percent) of the 5737 prosecutable cases are both eligible for and accept the offer of treatment. A very large number of cases which could have been handled by TASC do not leave the Office of the County Attorney.
Relatively few persons directly refuse the treatment option, however. It is far more likely that these eligible cases fail to enter treatment because they simply fail to respond to the letters of infonnation about the diversion program sent by the County Attorney. When the offender fails to respond, the case is filed and a warrant is issued. Until they are re-arrested, these cases will represent a substantial proportion of the "open" cases. They may be listed as filed and "in prosecution," but they are inactive cases.
Among those cases which had refused treatment as a pre-file diversion, 10 percent were diverted to treatment after charges were filed, over one-third were closed with a conviction, about 7 percent were closed with no conviction, and the remainder are unresolved at the end of data collection. The case outcome of those who did not respond to the letter is similar: 12 percent were referred to treatment after charges were filed, 32 percent were closed with a conviction, 9 percent were closed with no conviction, and 47 percent remain open.
Of those cases which entered the treatment program initially, the ratio of success to failure is nearly 3 to 1. Moreover, the likelihood of eligibility for, entrance into, and successful completion of the treatment program is related to the type of drug use. Compared to other drug users, especially users of cocaine, marijuana users were significantly more likely to be eligible for diversion, to enter the treatment when eligible, and to complete the program they entered. Charges are filed on those who fail the treatment program, and most cases which are closed have been closed by a conviction. (A note of caution is warranted in discussing conviction rates: we should not assume that the likelihood of conviction for cases which require more time will be the same as for those cases closed quickly; because the greatest probability of conviction occurs among cases that are settled quickly, the large numbers of cases still open may, when eventually closed, have different conviction rates.)
D. Program Impact on Recidivism
Recidivism is defined as any new charge submitted to the County Attorney's Office after the initial offense which fIrst brought the offender to the attention of the Demand Reduction Program. Of the 7012 offenders referred to the Demand Reduction Program, 21 percent were arrested for a subsequent offense during the period of observation. Of those who were, 44 percent were charged with a drug offense, 29 percent were charged with a property offense, 12 percent were charged with a crime against a person, and 15 percent were arrested for some other type of offense. V/hen a subsequent crime did occur, the mean length of time between entry to the Demand Reduction Program and recidivism was 177 days.
Marked differences in recidivism occur between those who accept and those who refuse the treatment option. Among those offenders reviewed by the County Attorney's OffIce between March, 1989 and March, 1990, 26 percent of those who did not respond to the offer of treatment, 18 percent of those who refused treatment, and 11 percent of those who entered treatment committed another crime before May 1, 1991. A similar difference in recidivism occurs when looking at only those who entered the T,,'\SC treatment program during the first year of the Program: at least one crime is committed by 25 percent of those who enter and fail to complete the TASC program and 8 percent of those who enter and successfully complete the TASC program .
Focusing on the effects of exposure to TASC treatment on recidivism, controlling for defendant characteristics and offense characteristics, recidivism -- the outcome measure -- is measured in terms of the length of time between the initial arrest, by which the offender is
~~--- ~------
, '>
•
•
•
DEMAND REDUCTION EVALUATION ...
9
brought to the attention of the Demand Reduction Program, and the first subsequent rearrest. Analyses include only those offenders who were eligible for diversion to the TASC treatment program.
The analysis estimates life tables of survival rates and regression equations of the length of tin le to recidivism. The regression equations are estimated using a survival analysis procedure appropriate for dependent variables with right censoring. The analysis includes a non parametric estimation of the survival distribution function using life tables, and a parametric estimation of the variables affecting length until recidivism using five distribution functions and a general nonparametric proportional hazard model found in earlier research on recidivism. The life table method is used to estimate the survival distribution function instead of the product limit estima~ tor.
The survival distribution function is estimated over the 810 day period of data collection. The survival time T is assumed to be a random variable with some distribution characterized by a cumulative distribution function F(t,O). 0 is a set of parameters to be estimated and F(t,O)=PCT.st)=the probability of failure at or before time t, for any ~O. The fact that F(t,O) is a cumulative distribution function implies that F(t,O) approaches one as t approaches infinity. The survival function is defined as
S(t,O) = l~F(t,O) = P(T>t). ,-'-This formula gives the probability of survival ~~ that is, the probability of no rearrest until time t. That is to say, the survival rate is 1.00 immediately following arrest for the instant offense and then, with increased exposure to a "hazardous" environment, it decreases to some degree throughout the follow-up period.
1. Nonparametric Estimates of Treatment Effects on Recidivism
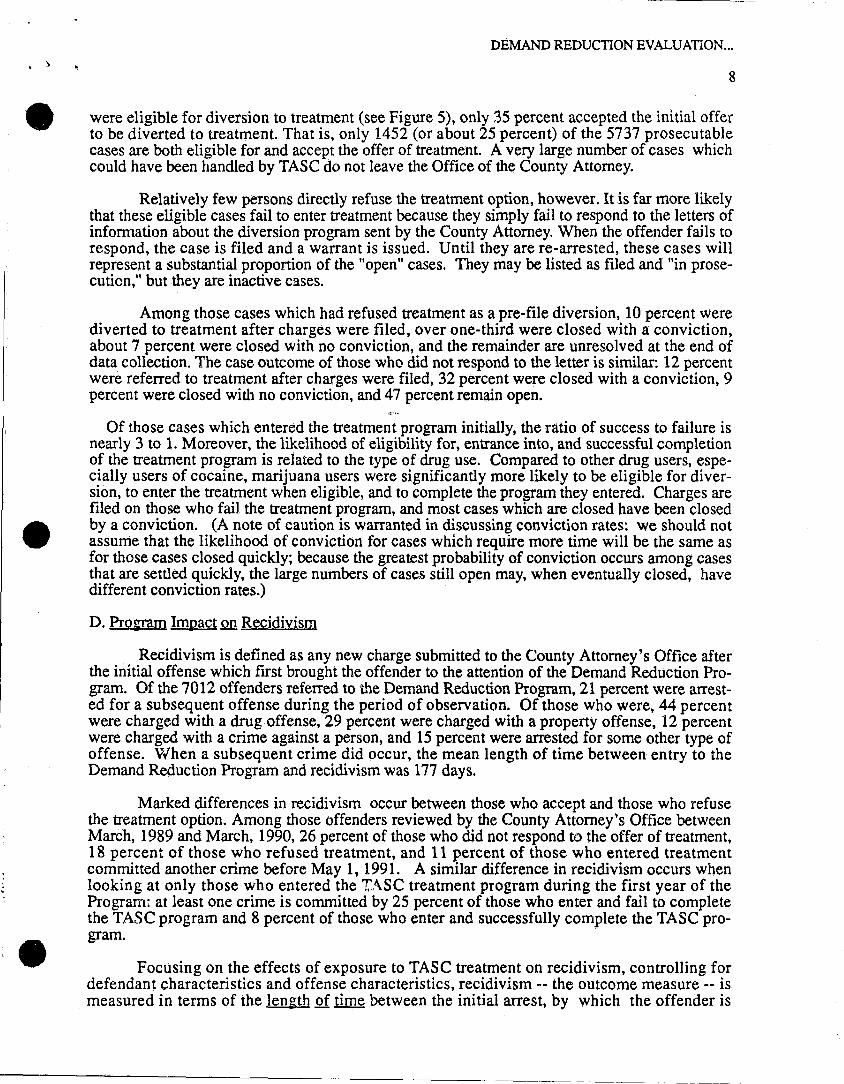
-To explore the effect of TASC treatment on length of time until recidivism, life'table survival rates were estimated separately for four offender groups: (1) those eligible for diversion who did not enter TASC treatment, (2) those eligible for diversion who agreed to enter TASC treatment, (3) those who entered and successfully completed TASC treatment, and (4) those who entered but then failed to complete TASC treatment. The degree of selection bias is unknown and uncontrolled, so we are not able to determine how much of the Observed differences in recidivism are due to the effects of the treatment itself and how much are due to the effects of those factors which lead some people to enter treatment and to succeed in treatment.
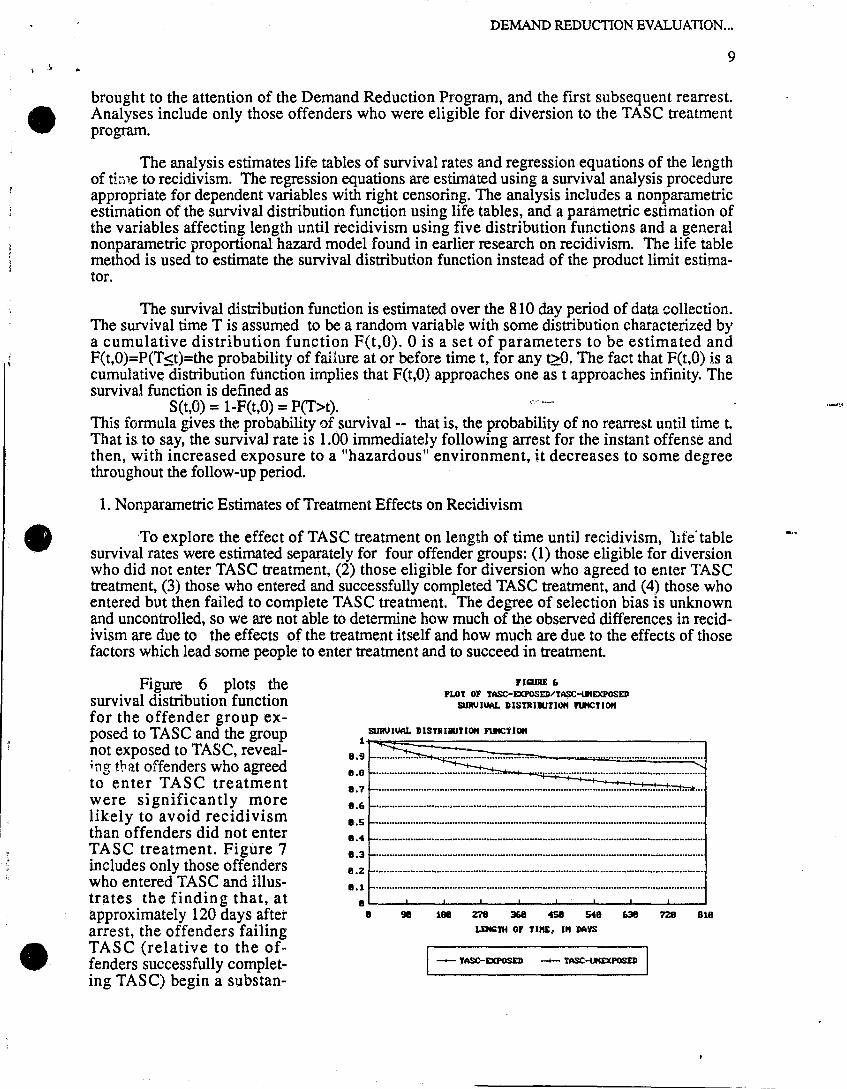
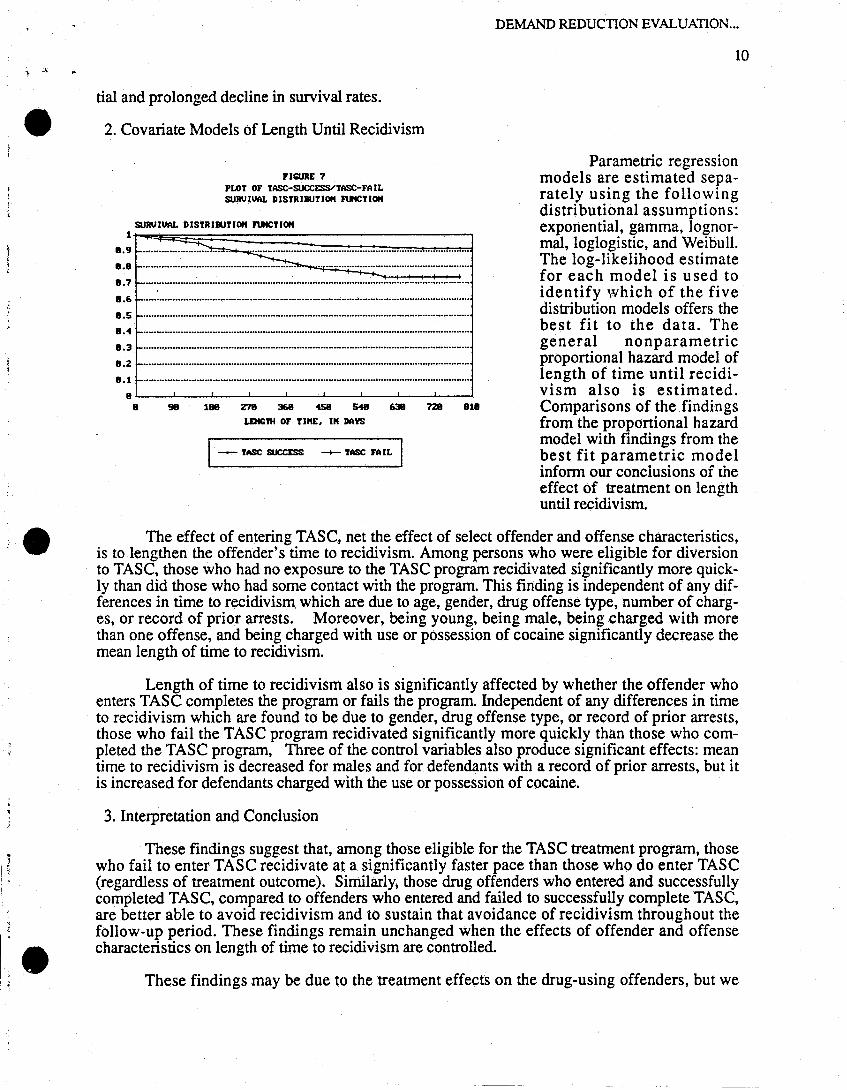
Figure 6 plots the survival distribution function for the offender group ex~ posed to TASC and the group not exposed to TASC, reveal;ng that offenders who agreed to enter TASC treatment were significantly more likely to avoid recidivism than offenders did not enter TASC treatment. Figure 7 includes only those offenders who entered TASC and illus~ trates the finding that, at approximately 120 days after arrest, the offenders failing TASC (relative to the offenders successfully completing TASC) begin a substan-
rlQ/JIE 6 PLOT OF TASC-EXPOSElVTASC-urtEXPOSED
SURUIUAL DISTRIBUTION FUHCTIOH
SURUIUAL DISTRIIUTIOH FUHCTIOH
:::~~~:::::::~~::::~:::;::.::: .. :: ... :;.::~::::~:::.~.:::;':::;::':~::'~"":"':"":' .. = ... = ... = .... = ... = ... :=:.:=:::.=:::=::::=::::=:::=::::=:::=::::=:::=::::d::::
8.? i-..................................................................................................................... -;z .. .
8.6 1-........................... ., ............................................................................................. ..
8. 5 _ ........................................................... _ ............................................................ ..
8. 4 _ ........................................................... - ............................................................. .
8.3 r-........................................................................................................................... . 8.Z ........................................................................................................................... .
8.1 .......................................................................................................................... ..
8~--~--~--~--~--~--~--~--~~ 8 98 188 Z78 368 4S8 &-fB Ii3II! ?Z8 BlB
LEttC;nt OF TlltE" I" DAYS
I -- TASC-ElCPOSEi) -- 'I'ASC-lIHEXPOSED
.. -
DEMAND REDUCTION EVALUATION ...
10
tial and prolonged decline in survival rates.
• 2. Covariate Models of Length Until Recidivism
•
•
rJc:uRE 7 PLOT OF TASe-SUCCESS/TASe-FIIJL SORV IIIIIL DISH IIIUTlOIt FUttCT 10It
SURVIIIIIL DISTRIIlUTIOIt FUHCTIOIt
8.~tf-:'''''~'''=''''~'''~''~=''''~''';' .. : .. ~: ... ==.= ... = .... = .... = ... = .... = ... ; .... ; ... ~ .... ~ ... ~ .... ~ ... ~ .... ~ ... ~ .... :. ... : .... : ... :: .... : .... : ... : .... :J .. .. IlI.S f-.......................................................... . ...................................................... .. 8.7 f-.......................................................................................................................... .. 1.6 ........... _ ................................................................................................................................ .
11.5 .......................................................................................................................................... .
8.4 ................................................................ - ........................................................ .
1.3 ..................................................................................................................................... .
8.2 ................................................ _ ........................................................................ ..
11.1 f-........................................................................................................................... . 8~--~--~--~--~--~--~--~--~~
8 98 188 27B 368 458 S4B 63B 728 818
LDtGtH OF I lItE, IN DIIYS
I - 'lASe SUCXESS: -+- lASe FIlIL I
Parametric regression models are estimated separately using the following distributional assumptions: exponential, gamma, lognormal, loglogistic, and Weibull. The log-likelihood estimate for each model is u sed to identify which of the five distribution models offers the best fit to the data. The general nonparametric proportional hazard model of length of time until recidivism also is estimated. Comparisons of the findings from the proportional hazard model with findings from the best fit parametric model inform our conclusions of [he effect of treatment on length until recidivism.
The effect of entering TASC, net the effect of select offender and offense characteristics, is to lengthen the offender's time to recidivism. Among persons who were eligible for diversion to TASC, those who had no exposure to the TASC program recidivated significantly more quickly than did those who had some contact with the program. This finding is independent of any differences in time to recidivism which are due to age, gender, drug offense type, number of charges, or record of prior arrests. Moreover, being young, being male, being charged with more than one offense, and being charged with use or possession of cocaine significantly decrease the mean length of time to recidivism.
Length of time to recidivism also is significantly affected by whether the offender who enters TASC completes the program or fails the program. Independent of any differences in time to recidivism which are found to be due to gender, drug offense type, or record of prior arrests, those who fail the TASC program recidivated significantly more quickly than those who completed the TASC program, Three of the control variables also produce significant effects: mean time to recidivism is decreased for males and for defendants with a record of prior arrests, but it is increased for defendants charged with the use or possession of cocaine.
3. Interpretation and Conclusion
These findings suggest that, among those eligible for the TASC treatment program, those who fail to enter TASC recidivate at a significantly faster pace than those who do enter TASC (regardless of treatment outcome). Similarly, those drug offenders who entered and successfully completed TASC, compared to offenders who entered and failed to successfully complete TASC, are better able to avoid recidivism and to sustain that avoidance of recidivism throughout the follow-up period. These findings remain unchanged when the effects of offender and offense characteristics on length of time to recidivism are controlled.
These findings may be due to the treatment effects on the drug-using offenders, but we

•
•
I
• , '
DEMAND REDUCTION EVALUATION ...
11
can not exclude the possibility that the results are due, in whole or in part, to the self-selection factor. That is, the same reasons which motivate persons to enter and succeed in the TASC program may be the reasons which motivate those persons to cease future criminal activities. Whether the observed difference in recidivism is due to the effect of the treatment, to the self-selection into treatment, or both, it remains the case that (1) entering and (2) complet. ing TASC are significant indicators of differential length of time to recidivism. This is a Signal Effect: entering TASC signals the probability of a slower return to future criminal activity, regardless of whether that is due to the treatment received or to the individual's reasons for entering the treatment program.
v. A TIME-SERIES ANALYSIS
A time-series analysis of aggregated data visually illustrates changes over time which may be attributed to the program. Data for the 62-month period from January, 1986 through February, 1991 provide a 38-month baseline prior to the beginning of the Program against which the activities during the flrst 24 months following implementation of the program are compared. Law Enforcement Justice Information System (LEJIS) data were used to create four types of drug offenses, based on the criminal charges at the time the case is submitted to the Office of the County Attorney for prosecutorial review. (1) "user. drug only" offenses: this group contains only those cases in which the offense at
submission."is simple possession or use of drugs and there is no other non-drug charge submitted simultaneously. This is the pure type for which the Demand Reduction Program is designed. (2) "user. mixed charge" offenses: all cases in which the offense at submission is simple posses
sion or use of drugs and there is at least one other charge for a non-drug offense, such as theft, assault, or prostitution. Offenses of this type may be eligible for the Demand Reduction Program, depending on the severity of the non-drug offense. (3) "non-user. drug only" offenses: this grouping is comprised of all cases in which the charge
at submission is for a drug charge other than use or possession, such as sale, possession for sale, or trafficking, and in which there is no other charge for a non-drug offense. Persons charged with drug sales and trafficking are not eligible for the Demand Reduction Program. (4) "non-user. mixed charge" offenses: these are all cases which involve at least one non-user
drug charge, such as sales and possession for sale, and one other charge for a non-drug offense. These cases are cr'\\'lsidered ineligible for the Demand Reduction Program.
Each of the four groups includes submitted cases involving a drug charge; combined, the four groups account for all cases submitted to the County Attorney's Office for drug offenses during the period under review. By including each of the four groups, we can examine the changes in the "user, drug only" group over time in the context of changes which may be occurring within the other types of drug offenses.
A. Trends in Drug Offense Enforcement
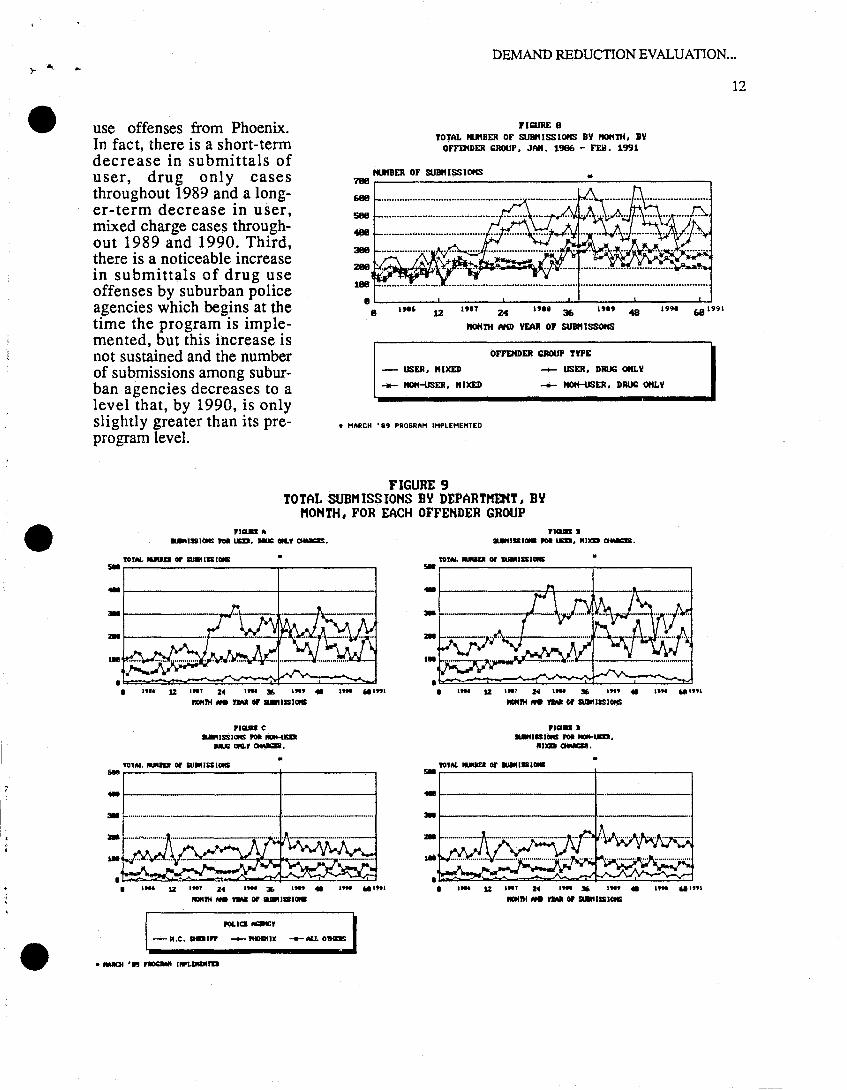
Changes in the monthly number of arrests submitted to the County Attorney's Office, by type of drug offense, are illustrated rather dramatically in Figures 8 and 9. It is evident that the number of arrests submitted for the two user groups began to increase rather substantially in late 1987, receded in mid-1988, and then increased again in late 1988 and early 1989. The increase in submissions in late 1987 and early 1988 corresponds to the timing of an administrative change which shifted those cases charging possession of a small amount of illegal drugs from the Office of the City Prosecutor to the Maricopa County Attorney's Office. The increase which occurred in March, 1989, as the Program was being formally and publicly implemented, was not sustained, and by mid-1990 the number of submissions per month had decreased to a level approximately equal to that of mid-1988 .
These data lead to three conclusions. First, the majority of all submittals originate in Phoenix. Second, the start of the program had no effect on the number of submittals for drug
r ....
•
•
•
DEMAND REDUCTION EVALUATION ...
rlQJJIE B TOTAL IUUIER OF SlJlIfIISS IOI'IS BY ~TH. BY
OFFDIDER GROUP. JAIl. 1986 - FEB. 1991
IUtBER OF SUBttISSIOl'lS
use offenses from Phoenix. In fact, there is a short-term decrease in submittals of user, drug only cases throughout 1989 and a longer-term decrease in user, mixed charge cases throughout 1989 and 1990. Third, there is a noticeable increase in submittals of drug use offenses by suburban police agencies which begins at the time the program is implemented, but this increase is not sustained and the number of submissions among suburban agencies decreases to a level that, by 1990, is only slightly greater than its preprogram level.
~~----"----------------------~------------~ 688
see 488
388
~~~~k~~~~~ 188
8~------~------~------~~------~------~
'IGUII A
8 24 I,.. 36 I,., 4B
~TH MJ) YEAR OF SUBIIISSOttS
OFFElfDER c:JIOUP TYPE
-+- USER. DRUG ottLY
__ HOtt-USER. DRUG ottLY
• MftRCH • 89 PR06RftM IMPLEMEHTEO
FIGURE 9 TOTAL SUBMISSIOHS BY DEPARTMEHT, BY
MOHTH, FOR EACH OFFEHDER GROUP rlQJD •
... ISIlI __ IISD. IIUI: GIL, OWIGIS.
TOtAl. _Ell or 1UIII11S10IC
68 1991
s-r-------------------r-----------, .. r-------------------+------------i
• ltll 12 tnT 24 Int 3fs 1nt. "" 6IIHI _ JH _ YMI fW ... IISI_
'IQJD C "'ISSI __ -.tEll
IIUI: ClIIi.Y OM.:III.
TO,ftl. _Ell or SU .. IISIOlC SMr-------------------+-----------, .. r-----------------~------------i
• I", 1Z IN' 24 .... 3L I",. ",. ,,"91 _JH _ YMI fW ... IIIIICIIII
i-,,_m -~=; -~-J • MIOI 1M ,1OCIIIlfI INPLl:RDltD
SIt .. -:.
.-•
• ,- tt '"' Z4 ltD 31'> .- 41 .- .. ItYl _JH _ YMI III ... IISI _
rlGUII • ... IISI __ -..a.
"IXD~.
TOt"" -.0 or SU_III11I_
• . - tt '"' Z4 ,on S ."' • .- 6I.ttl _JH _ YMI fW ... IISICIIS
12
•
•
! ~
• I ~,
FIGlJJIE 18 PERCDlT OF TOTAL SUIIIIISSIOHS BOOKED, BY ItOtITH, BY goup, JAt!. 1986 - FEB. 1991
l<BOOKED • lMr-----------------------~------------~
48 ...••.•................•......••.•..•.....••.•••••••....•..•••.••...•.......••.•.••..•.••...•...•.....•..•••..•.•.....•....
28 ....••..•. _ .•..•.•...••.•..••••.•.•..••.••.•.•.•.••••••..•.•.•...•......•..••••.•..•.••.•••....•...•...•••.....••...••.•..
8~ ____ ~ ______ ~ ______ ~~ ____ ~ ____ ~~
8 191~
1Z 19a7 24 "81 3& I'"~ 48 I'"~ 68'99' ItOtI TH AtID YEAR OF Slllllt I SS I OHS
OFFDlJ)ER goup TYPE
-+- USER, DJII.IG OtILY
-- IIOH-USER, DJII.IG otILY
• M~RCH • 89 'RoaR~M IMPLEMEHTED
DEMANDtffi
13
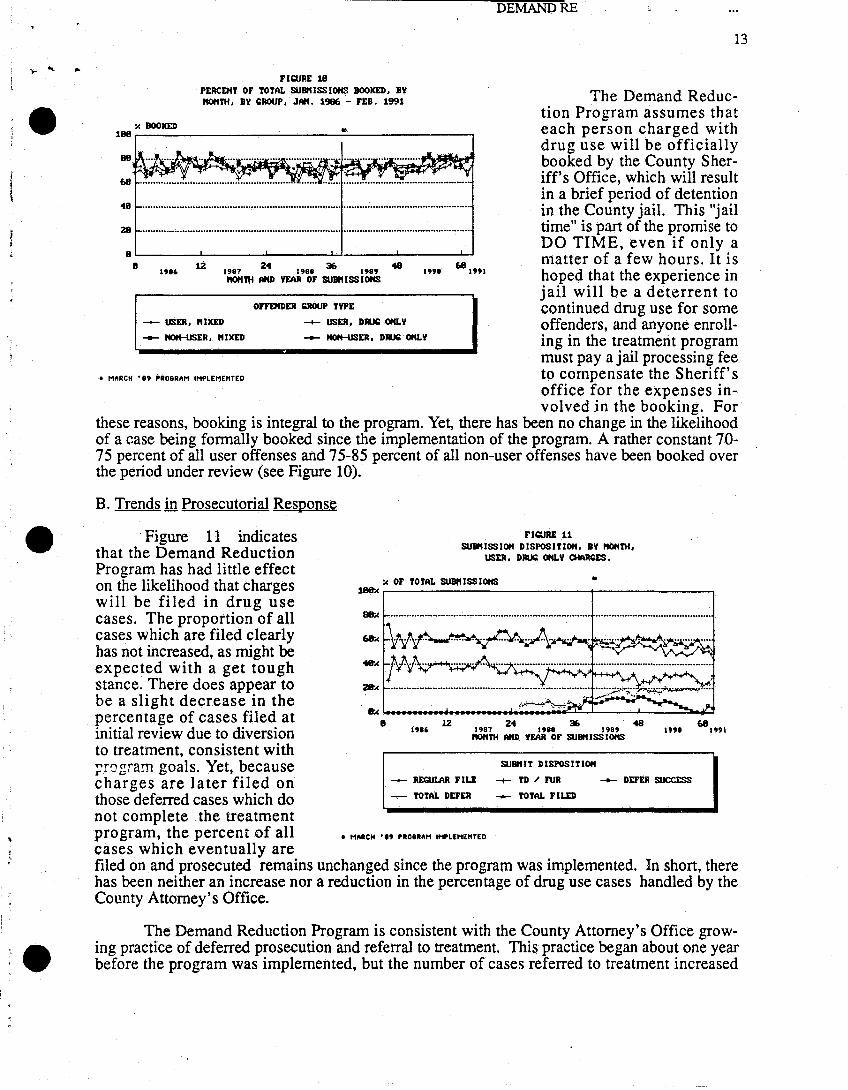
The Demand Reduction Program assumes that each person charged with drug use will be officially booked by the County Sheriff's Office, which will result in a brief period of detention in the County jail. This "jail time" is part of the promise to DO TIME, even if only a matter of a few hours. It is hoped that the experience in jail will be a deterrent to continued drug use for some offenders, and anyone enrolling in the treatment program must pay a jail processing fee to compensate the Sheriff's office for the expenses in-volved in the booking. For
these reasons, booking is integral to the program. Yet, there has been no change in the likelihood of a case being formally booked since the implementation of the program. A rather constant 70-75 percent of all user offenses and 75-85 percent of all non-user offenses have been booked over the period under review (see Figure 10).
B. Trends in Prosecutorial Response
, Figure 11 indicates that the Demand Reduction Program has had little effect on the likelihood that charges will be filed in drug use cases. The proportion of all cases which are filed clearly has not increased, as might be expected with a get tough stance. There does appear to be a slight decrease in the percentage of cases filed at initial review due to diversion to treatment, consistent with ;-ragram goals. Yet, because charges are later filed on those deferred cases which do not complete the treatment program, the percent of all cases which eventually are
FIGlJJIE .11 SUllltISSlotl DISPOSlTlotI, BY ItOtITH,
USER , DJII.IG 0tIL Y CHARGES.
:c OF TOTAL SUllltISSIOHS • lMt~r-----------------------~----------~
Mt~ ....................................................................................................................... .
~~.--.~~--~~--~~~~--~----~~
"16 8 It,. 24 36
1987 "I. 19a, 48
ItOtITH AtID YEAR OF SllIlltISSIOHS
SllBflIT D ISPOS IT loti
- RECULAII FILE -+- TD " ruJI -- DEFER SUCCESS
-. TOTAL DEFER __ TOTAL FILED
68 19"
filed on and prosecuted remains unchanged since the program was implemented. In short, there has been neither an increase nor a reduction in the percentage of drug use cases handled by the County Attorney's Office.
The Demand Reduction Program is consistent with the County Attorney's Office growing practice of deferred prosecution and referral to treatment. This practice began about one year before the program was implemented. but the number of cases referred to treatment increased
: J
DEMAND REDUCTION EVALUl\TION ... _ ,'" ... 14
• substantially due to the expanded eligibility criteria used in the Program.
•
•
The program served to "widen the net" of the criminal justice system. The decrease in the percentage of cases filed on at submission suggests that some cases were truly being diverted from prosecution. Yet, the decrease in the percentage of cases turned down at submission suggests that many diverted cases would not have been retained in the system were it not for the diversion option. That is, the diversion option enabled the County Attorney to fulfill the commitment of zero tolerance -- diverting to treatment cases which previously it would have elected not to prosecute. Since unsuccessfully deferred cases are to be prosecuted, however, the effect is to retain in the system cases which might have been turned down if the diversion option were unavailable to the County Attorney. The inclusion of these cases widens the net in terms of both the number and types of offenders.
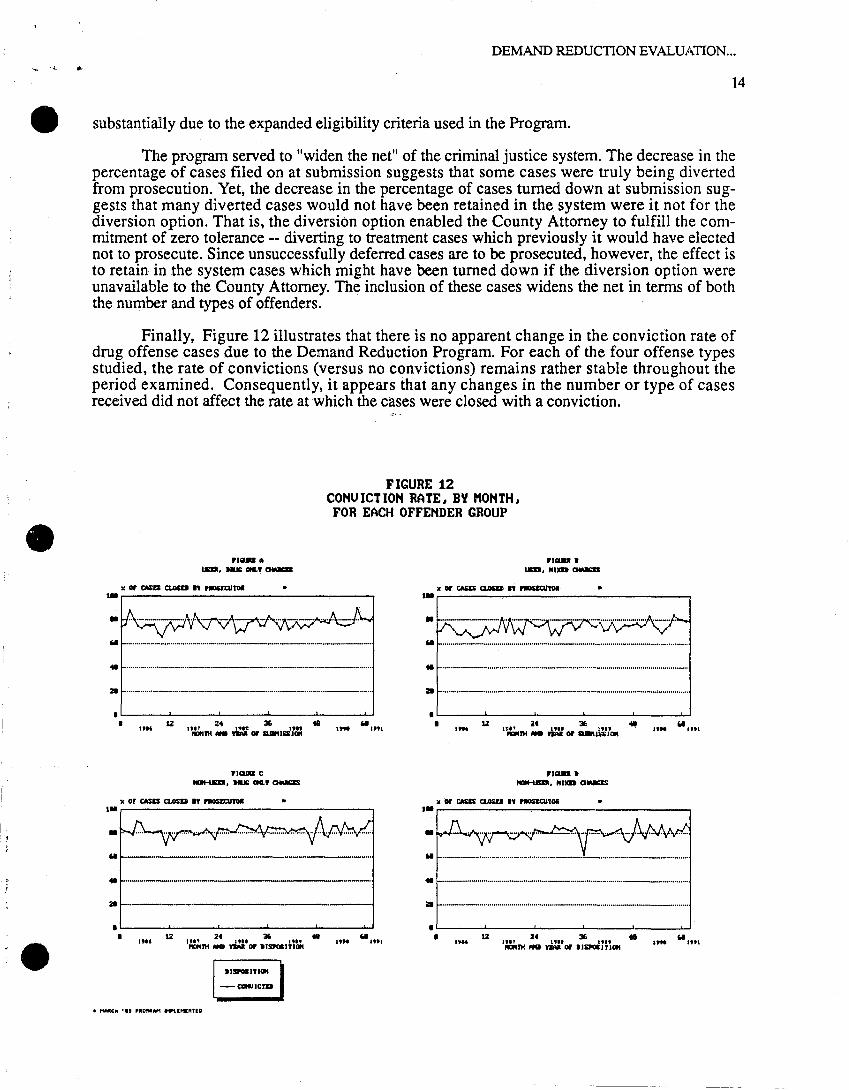
Finally, Figure 12 illustrates that there is no apparent change in the conviction rate of drug offense cases due to the Demand Reduction Program. For each of the four offense types studied, the rate of convictions (versus no convictions) remains rather stable throughout the period examined. Consequently, it appears that any changes in the number or type of cases received did not affect the rate at which the cases were closed with a conviction.
FIGURE 12 COHVICTIOH RATE. BY 110HTH. FOR EACH OFFEHDER GROUP
x 01' aliD a.osa n .-..aItoI
t.~---------------------------,
.. . ....... _----_ .. _ .•.. _-_ .... _.-.... _-_._._-_ ...... _-_._-... __ ....... .
41 ....... -............. --.... --.-..... -...... --....... - .. --.. -.......... -.......... -....... -... -..... . ZI ..•. - ..•..• --•..••. --.. - ...... - .. ----.. --.•.••.• - .••• - .. - •..• - ........ --.-••• - •• - .•
rlC:UIII C -.ui:D. HJ: ClIG.I QIoII;IS
" or CASa CLOSD n PIIOSEaItoI t.~---------------------------, .. .. ~---------------41~--------------------------
ZI -------------
.~--~----~----~----~----~ • 12 , .. , 24 310 411 lin I'" It .. _III _ ~ or ,1_171011
.. ItM ""
"QIII • uaa. "IXU CJWII:D
" 01' CAiIEI a.osa " .-..aItoI -r----------------------------,
.. .... _._ ........ _._ ... _._-_ .. _ .. __ ._ .... _ .......... _----............. _ ... .
41 ........... -.. -.--.. --.-..... -.-...... -..... -....... -.......... -_ .... -......... -.-........... _ .... _ .... . ZI - ....... ---.--.-•• -_ •.• --.-....• -.--.................... _ ..•..•••.•...••••••. -.-.-•••••. - .••••...
.~--~----~----~----~----~ • I", 12 .",. 24 1'" 36 un .. UN "Ittl _III _ .- or a..u;;a;10fI
" or CAiIEI a.osa ., .-..aIYOli t.r----------------------------, • .. .._-_ .... __ ...... __ ............ _ ..... -... _._ ... _ ............. _ ....... _ ...... _._._._ ... _ ... _ ..... . . . .... _ ..... _ ...... -............. _ ..... _--.... _ ....... _ ..... _ ......... _ ......... _-... _ .............. .
ZI •..•.• - .. -.--.•.•.•..•... - ...•...•...•...• - .• - •..•...•..•..........•.. _ ..•... _ ....•• - ..• - •........ - ••.....•.... . ~--~----~----~----~----~ • , .. , ".. 24 "" :IIi "" • If" .. '''' _!It _ YIN 01' IIl:1'CSlfJOfI

•
•
•
DEMAND REDUCTION EVALUATION ...
15
VI. SUMMARY AND CONCLUSION
The concept of "User Accountability" asserts a new rationale for treating casual users as a serious legal problem. It redirects the discussion away from the longstanding debate over the hannfulness of drugs to their users and focuses instead on the argument that users must be seen as a legal threat because they provide the customer base for the criminogenic suppliers of illegal drugs. Although developed at the national level, the survival of "User Accountability" as a viable demand reduction strategy depends on local implementation. The Maricopa County Demand Reduction Program contains a rather comprehensive and integrated user accountability program, and it illustrates the general principles and criteria of such a program.
A. Internal Operations of the Program and Definitions of Success
Various indicators suggest that the Demand Reduction Program has been successful. Local agencies and their representatives often define program success on the basis of raw numbers:
(1) the Program has received high visibility and positive publicity, aided by a strong commitment from the private sector and cooperative media coverage;
(2) a large number of offenders is processed through the progr~m annually, reaching over. 10,000 in the first two years; (3) vast funds have been generated over the first two years in both the County Jail fees
($39,342) and Arizona Drug Enforcement Fund fees ($850,411). The Arizona Drug Enforcement Funds are directed to the Maricopa County General Fund. The costs to participating agencies in personnel and resources are not known, however.
In addition, this evaluation has produced findings which reflect positively on the Demand Reduction Program: . .
(1) of the cases accepted for prosecution, nearly three-fourths were eligible for deferred prosecution pending successfulc;ompletion of the treatment program provided by TASC, indicating that the referrals and eligibility criteria were appropriate to generate a large volume of cases for diversion from prosecution;
(2) consistent with the stated criteria of eligibility, persons deemed eligible for deferred prosecution, compared to those judged to be ineligible, were less likely to have a record of prior arrests, less likely to be charged with multiple charges, and more likely to be charged with a marijuana offense.
(3) charges were filed against virtually all of the cases which failed to enter the TASC treatment program;
(4) among those prosecuted cases which have been closed to date, a conviction was four-tofive times more likely than no conviction;
(5) persons who entered TASC were three times more likely to successfully complete the treatment program than to fail the treatment program (excluding unresolved or "open" cases); inffi.·iji.lana cases were much more likely than cocaine and other drug cases to enter and to complete these programs; we did not determine whether the greater success of marijuana cases is due to the less debilitating effects of the drug on its user, to the shorter and less costly program for marijuana users, or to some other factor;
(6) the length of time to recidivism was longer for those eligible offenders who agreed to enter TASC than for those eligible offenders who did not have contact with TASC and, among those who did enter TASC, it was longer for those who completed the treatment program than for those who failed the treatment program. Whether these results are due to the effectiveness of treatment or to the fact that there is a selectivity bias (the same reasons which lead people to agree to enter treatment are also lead them to reduce their criminal behavior), it is clear that the act of entering TASC's treatment program signals a reduced likelihood of subsequent criminal activity .
...
•
~~
l ~
J ! !
~ i i
. • !
DEMAND REDUCTION EVALUATION ...
16
Despite these positive indicators, there are other factors which raise serious questions about the successful operation of the Demand Reduction Program .
(1) fully three-fifths of those persons judged eligible for deferred prosecution do not enter the TASC treatment program, indicating that fewer cases than anticipated will be diverted from the prosecutorial and court case loads;
(2) although charges are filed against virtually all persons who do not enter TASC, a very large percentage of these cases remain "open" for extended periods of time (with or without a warrant outstanding), with more than 25 percent of all cases still open more than 15 months after they were declared eligible for the deferred prosecution program;
(3) the outcomes of both the initial prosecutorial decision to accept or reject a case for prosecution and the subsequent decision regarding the case's eligibility for deferred prosecution are significantly related to extralegal factors, including the offender's ethnicity, gender, and age. These relationships persist when the effects of prior arrest record, type of drug, and number of charges are controlled. The reason for this finding is not known.
B. Program Impact
Analyses of individual case data reveal that something is happening -- that there are large numbers of cases being processed through the stages of the Demand Reduction Program. Yet, a larger issue is explored by use of aggregate data to study the trends over a five-year period. These data allow us to ask "what has changed since tl}e Program began?"
(1) there was no increase in the number of drug use cases submitted to the County Attorney by Phoenix police, and the increase by suburban departments was not sustained over time;
(2) there was no increase in the proportion of all cases fonnally booked at the County jaii; (3) there was no change in the conviction rate of closed cases; (4) the was an increased use of deferred prosecution and diversion to treatment, which corre
sponded to a decrease in the percentage of cases against which charges were filed or were turned down.'
(5) there was no change in the percentage of all cases which are prosecuted (sooner or later) because so many deferred cases do not accept the TASC option.
C. Summation
The Demand Reduction program has produced no apparent changes ~n the level of enforcement or the resolution of drug use cases. There is no indication of a sustained increase in arrests, other than through the publicized and largely symbolic Task Force operations. Neither the number of cases submitted nor the percentage of cases formally booked at the County Jail were affected by the implementation of the Program. Similarly, there is no indication of increased enforcement by the County Attomey's Office.
The only evidence of substantial change is in the increased use of deferred prosecution. In doing so, it has "widened the net" by bringing into treatment persons who otherwise would not have been retained in the criminal justice system. Since many of these cases would not have been prosecuted in the first place, they can not be said to be "diverted" from prosecution now. This finding is consistent with the intended objective of a "zero-tolerance" policy toward drug users: cases which would have been prosecuted earlier continue to be prosecuted within the Program, but cases which would have been rejected earlier now are retained within the Program by means of the deferred prosecution option. When these deferred cases fail to complete the treatment, they then return to the prosecutor's office, thereby increasing the total volume and the diversity of cases now being prosecuted.
Further, our analysis indicates that persons who agree to enter the TASC treatment program, especially those who complete the treatment program, have a significantly slower return to future criminal offenses than other eligible defendants who do not enter the TASC treatment program. This delay in returning to criminal activity may be due to the treatment program itself,

!'t-
•
'.
DEMAND REDUCTION EVALUATION ...
17
but we are not able to rule out the likelihood that the self-selection of defendants into TASC has created a selectivity bias. Regardless, it is apparent that the act of entering TASC, and then of completing the TASC treatment, signals a lower probability of early recidivism.
In conclusion, the Demand Reduction Program has succeeded in achieving the following: (1) it has established a very high profile for itself and its "DO DRUGS.DO TIME." campaign,
which may be viewed as a public education/deterrence program; (2) it has moved toward a policy of zero tolerance and net widening, by retaining within the
criminal justice system cases which previously would have been turned down; (3) it has expanded the use of diversion to treatment, largely with pre~file cases; (4) it has generated revenue for the County Jail and the general funds of the County through
the collection of fees from persons who accept the option to treatment; and (5) it has observed that the decision of eligible defendants to entert and then successfully
complete, the TASC treatment program signals a significant delay in the length of time to recidivism.