FIRST-HAND NICOTINE/TOBACCO EXPOSURE ON …
88
FIRST-HAND NICOTINE/TOBACCO EXPOSURE ON STREPTOCOCCUS MUTANS BIOFILM AND EFFECTS OF SODIUM CHLORIDE, POTASSIUM CHLORIDE AND POTASSIUM IODIDE SALTS by AbdulRahman BalHaddad Submitted to the Graduate Faculty of the School of Dentistry in partial fulfillment of the requirements for the degree of Master of Science in Dentistry, Indiana University School of Dentistry, May 2017.
Transcript of FIRST-HAND NICOTINE/TOBACCO EXPOSURE ON …
FIRST-HAND NICOTINE/TOBACCO EXPOSURE ON STREPTOCOCCUS MUTANS
BIOFILM AND EFFECTS OF SODIUM CHLORIDE,
POTASSIUM CHLORIDE AND POTASSIUM
IODIDE SALTS
by
AbdulRahman BalHaddad
Submitted to the Graduate Faculty of the School of Dentistry in partial fulfillment of the requirements for the degree of Master of Science in Dentistry, Indiana University School of Dentistry, May 2017.
ii
Thesis accepted by the faculty of the Department of Operative Dentistry, Indiana University, in partial fulfillment of the requirements for the degree of Master of Science in Dentistry.
L. Jack Windsor
Richard L. Gregory Chair of the Committee Norman Blaine Cook Program Director
Date

iii
DEDICATION
iv
I would like to thank and show gratitude to Allah for his many blessings, graces,
and virtues. You gave me the strength and the patience to continue moving
throughout this difficult life; you facilitated all the tough times that faced me, and you
always have been my guide. Thank you so much. And I also ask you to bless me and
have mercy on me in both lives, and to grant my parents, my family, friends, beloved
ones, and me a place in paradise.
All my thanks, gratitude, and prayers go to my beloved parents, because their
keenness to provide what I needed since my childhood is what made me who I am
today; they are the ones who taught me, supported me, and kept me going; they made
possible what is impossible and difficult, so that I can accomplish my dreams and reach
my goal; and I know that their happiness when I succeed exceeds my happiness. May
God bless them and grant them happiness.
All my love goes to my lovely wife, who keeps everything in my life easier by
being by my side whenever I need her. Thank you so much for your support and all my
thanks for being my mirror, my twin, and everything in my life.
My thanks go to my sister and brothers, with whom I share my childhood
memories. I hope we can meet soon beneath one roof as we used to do every weekend; I
really miss that.
All my thanks go to my supportive friends, and to those people who care about
me and contact me occasionally.

v
ACKNOWLEDGMENTS

vi
My appreciation and thanks go to my research committee: Dr. Richard L.
Gregory, Dr. Blaine Cook, and Dr. Jack Windsor. I am very grateful for their help and
guidance in this thesis. Their experience and knowledge are outstanding and their
positive impact on me is remarkable.
I would like to extend thanks to Mr. George Eckert and Ms. Beth Moser for their
help in the biostatistics section. I also would like to express appreciation to all my
professors in the school for teaching me what was helpful in obtaining my degree.
Finally, thanks go to my government and to my university, the University of
Dammam, for sponsoring me and providing what I needed during this program.

vii
TABLE OF CONTENTS
viii
Introduction…………………………………………………………………… 1
Review of Literature………………………………………………………….. 6
Methods and Materials……………………………………………………….. 15
Results………………………………………………………………………… 20
Figures and Tables……………………………………………………………. 23
Discussion…………………………………………………………………….. 55
Summary and Conclusion…………………………………………………….. 59
References…………………………………………………………………….. 61
Abstract……………………………………………………………………….. 72
Curriculum Vitae

ix
LIST OF ILLUSTRATIONS

x
FIGURE 1 S. mutans UA159 was grown in TSB at 37oC in 5% CO2 and
stored with 10% glycerol at -80oC for 24 hours……………………………...................................................
24
FIGURE 2 Each salt (NaCl, KCl and KI) was dissolved in TSBS………………………………………………………………
25
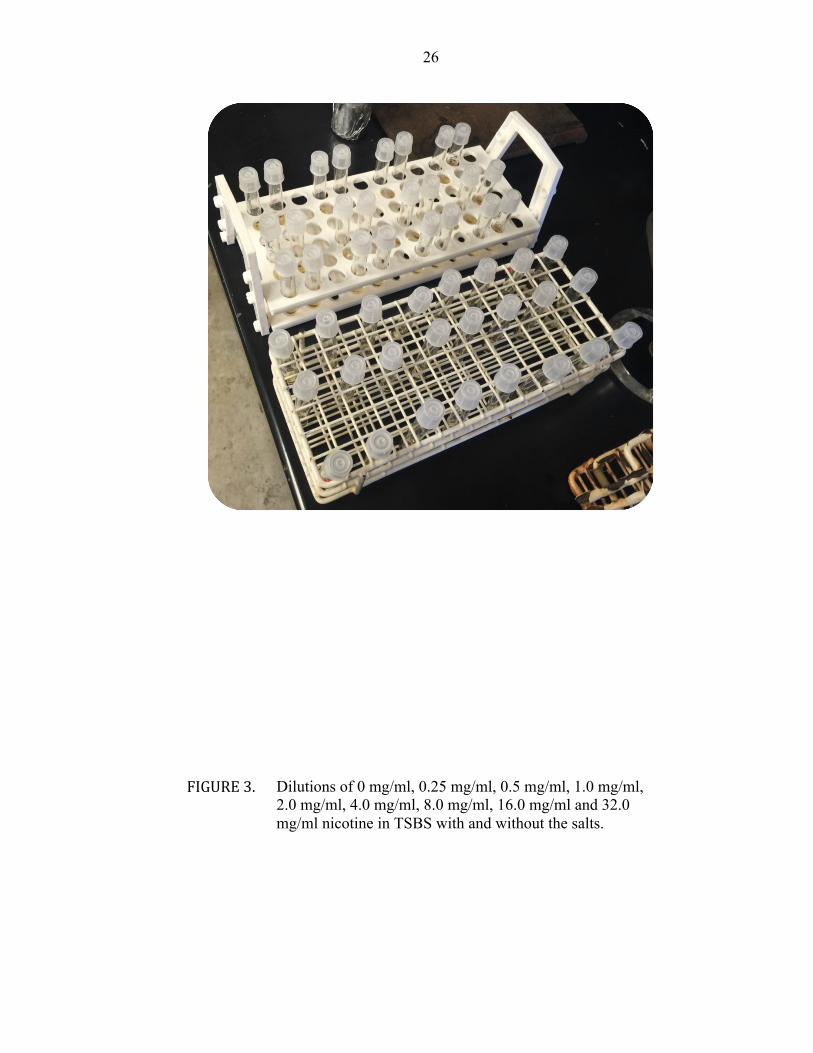
FIGURE 3
Many sets of dilutions were arranged to have TSBS with 0 mg/ml, 0.25 mg/ml, 0.5 mg/ml, 1.0 mg/ml, 2.0 mg/ml, 4.0 mg/ml, 8.0 mg/ml, 16.0 mg/ml and 32.0 mg/ml nicotine with and without salts……………………………………………………….
26
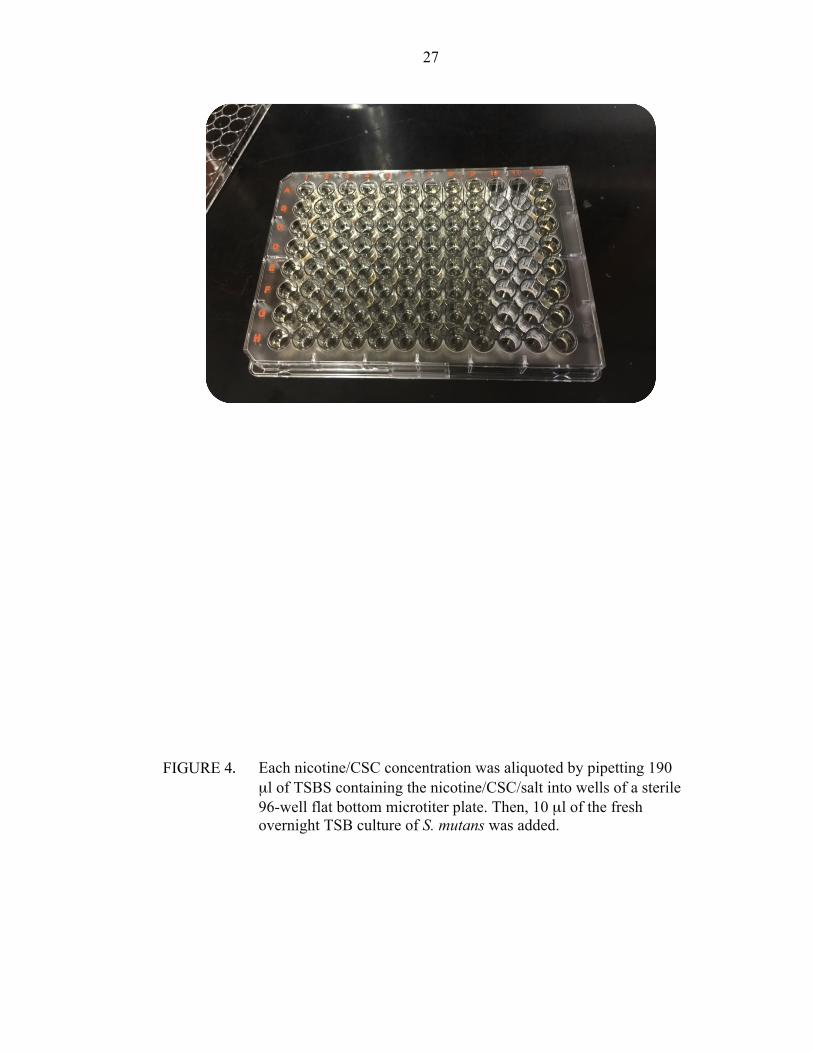
FIGURE 4 Each nicotine/CSC concentration was aliquoted by pipetting 190 µl of TSBS containing the nicotine/CSC/salt into wells of a sterile 96-well flat bottom microtiter plate. Then, 10 µl of the fresh overnight TSB culture of S. mutans was added…………….
27
FIGURE 5 Biofilm formation can be seen clearly in the control group (row E, F, G and H) after 30 minutes following the application of formaldehyde……………………………………………………...
28
FIGURE 6 Two hundred (200) µl of 0.5% crystal violet dye was added to each well and the cells stained for 30 min………………………………………………………………...
29
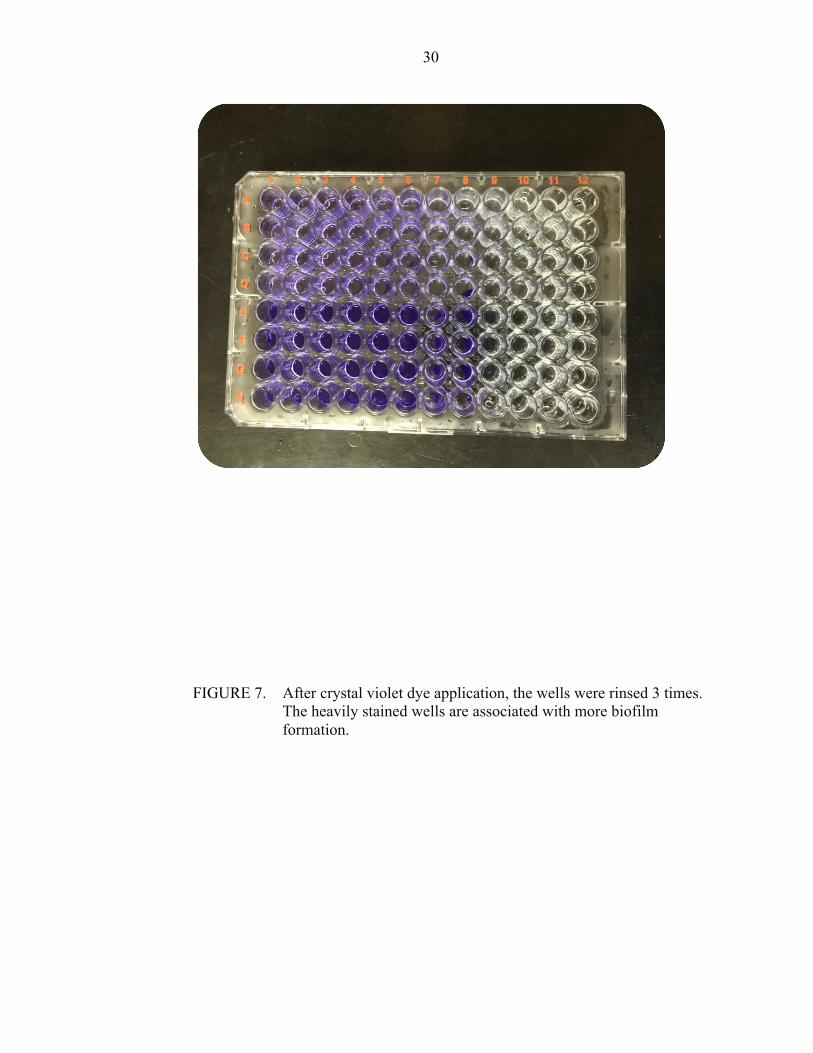
FIGURE 7
After crystal violet dye application, the wells were rinsed 3 times. The heavily stained wells are associated with more biofilm formation………………………………………………………….
30
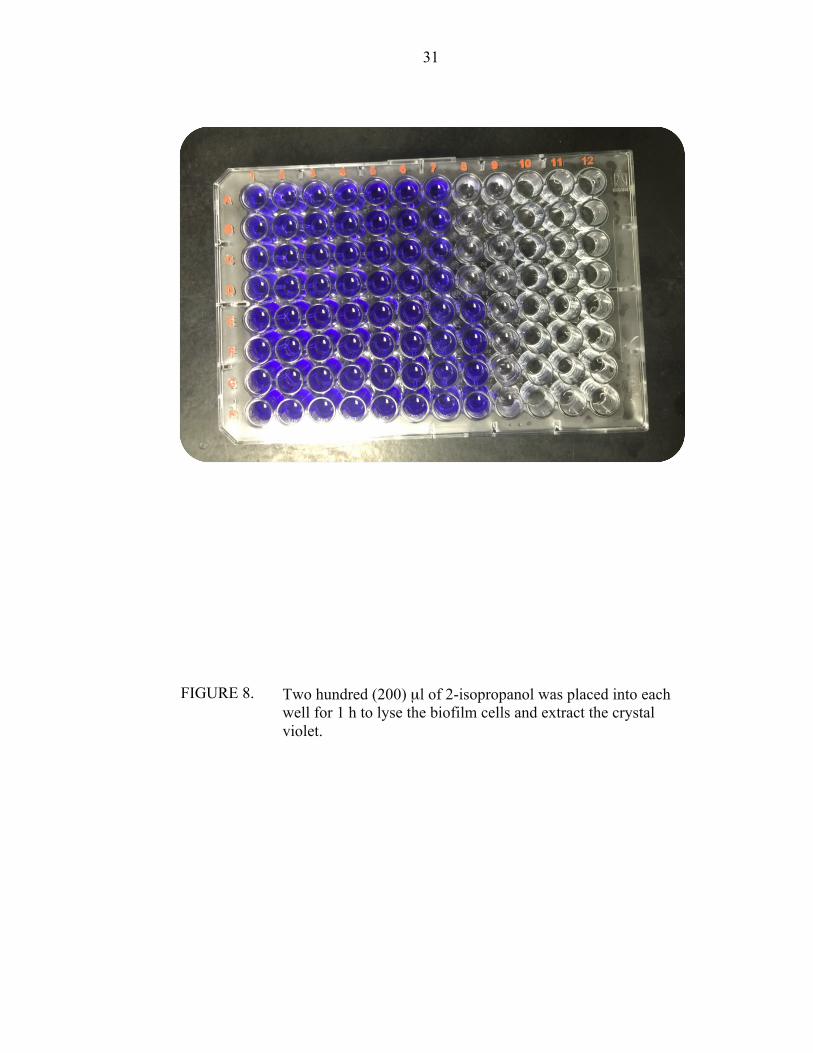
FIGURE 8 Two hundred (200) µl of 2-isopropanol was placed into each well for 1 h to lyse the cells and extract the crystal violet………………………………………………………………
31
FIGURE 9 Microtiter plate wells were read using spectrophotometer……….. 32 FIGURE 10
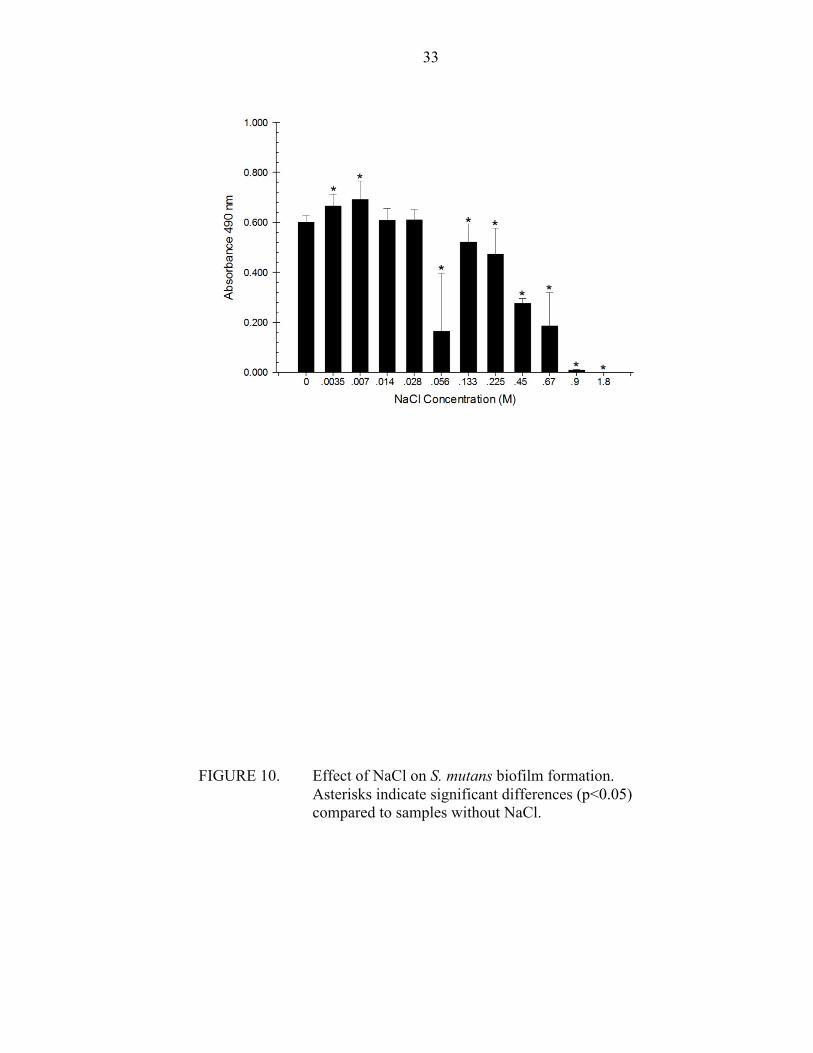
Effect of NaCl on S. mutans biofilm formation. Asterisks indicate significant differences (p<0.05) compared to samples without NaCl……………..……...................................................................
33
xi
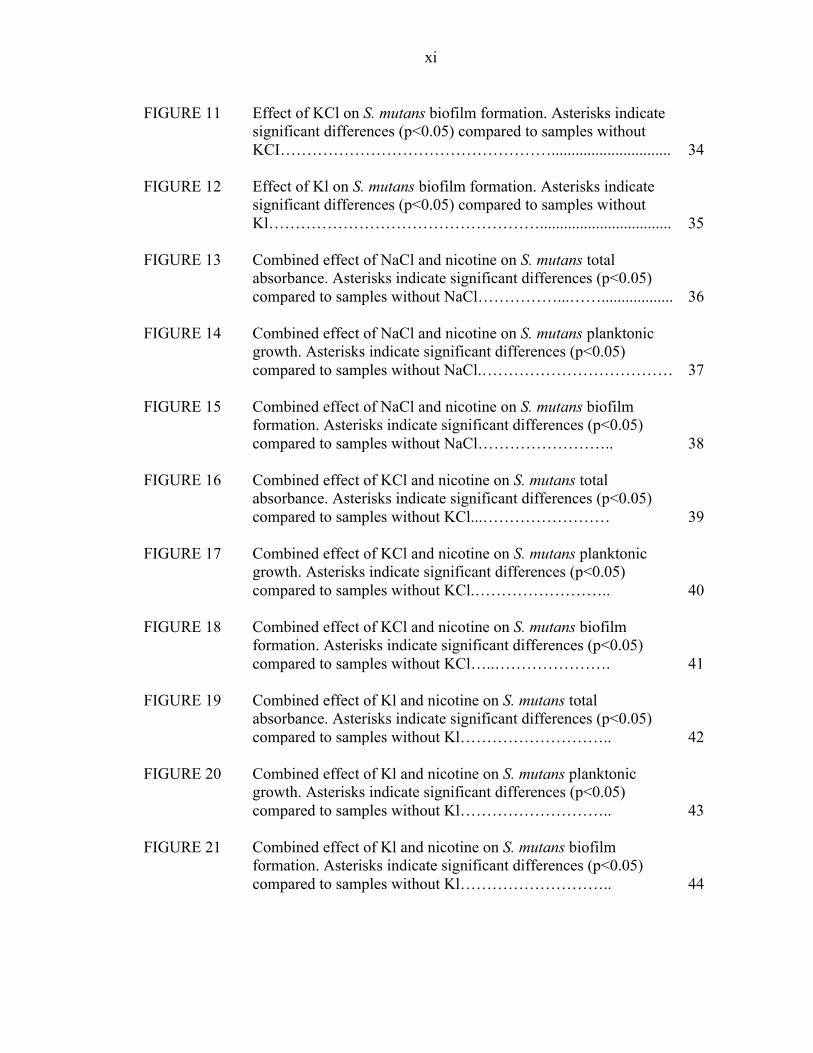
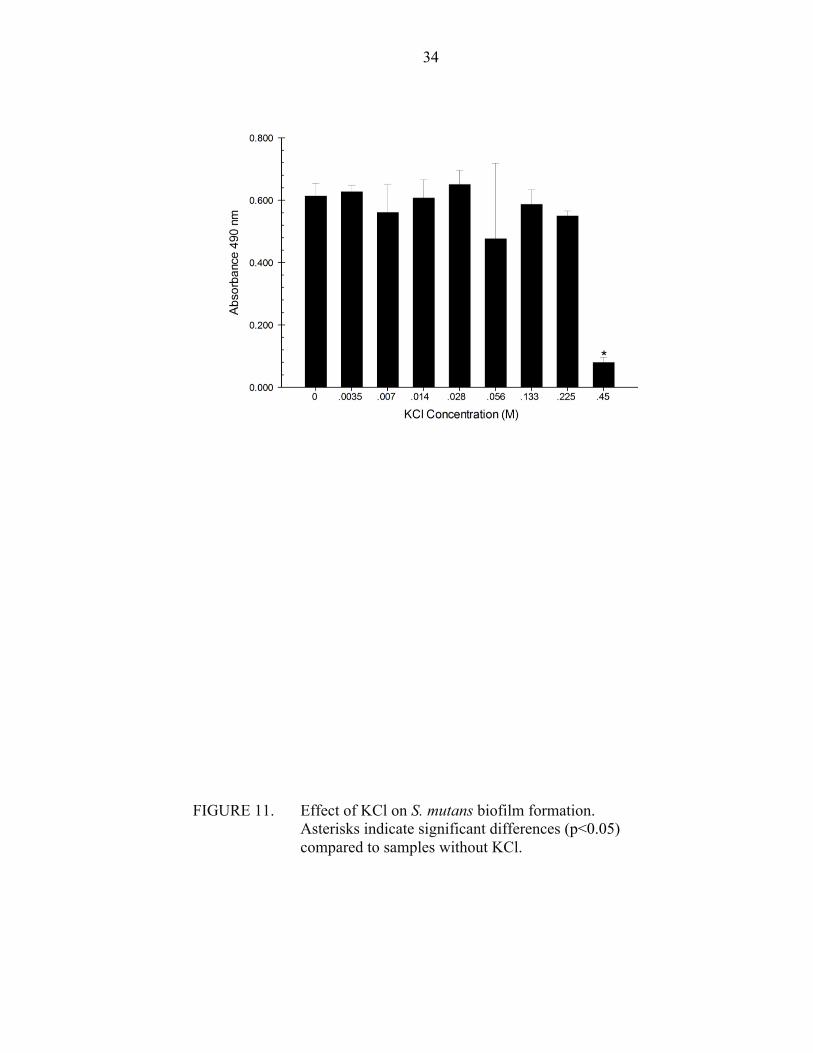
FIGURE 11 Effect of KCl on S. mutans biofilm formation. Asterisks indicate significant differences (p<0.05) compared to samples without KCI……………………………………………..............................
34
FIGURE 12
Effect of Kl on S. mutans biofilm formation. Asterisks indicate significant differences (p<0.05) compared to samples without Kl…………………………………………….................................
35
FIGURE 13
Combined effect of NaCl and nicotine on S. mutans total absorbance. Asterisks indicate significant differences (p<0.05) compared to samples without NaCl……………...……..................
36
FIGURE 14 Combined effect of NaCl and nicotine on S. mutans planktonic growth. Asterisks indicate significant differences (p<0.05) compared to samples without NaCl.………………………………
37
FIGURE 15 Combined effect of NaCl and nicotine on S. mutans biofilm formation. Asterisks indicate significant differences (p<0.05) compared to samples without NaCl……………………..
38
FIGURE 16 Combined effect of KCl and nicotine on S. mutans total absorbance. Asterisks indicate significant differences (p<0.05) compared to samples without KCl...……………………
39
FIGURE 17 Combined effect of KCl and nicotine on S. mutans planktonic growth. Asterisks indicate significant differences (p<0.05) compared to samples without KCl.……………………..
40
FIGURE 18 Combined effect of KCl and nicotine on S. mutans biofilm formation. Asterisks indicate significant differences (p<0.05) compared to samples without KCl…..………………….
41
FIGURE 19 Combined effect of Kl and nicotine on S. mutans total absorbance. Asterisks indicate significant differences (p<0.05) compared to samples without Kl………………………..
42
FIGURE 20
Combined effect of Kl and nicotine on S. mutans planktonic growth. Asterisks indicate significant differences (p<0.05) compared to samples without Kl………………………..
43
FIGURE 21 Combined effect of Kl and nicotine on S. mutans biofilm formation. Asterisks indicate significant differences (p<0.05) compared to samples without Kl………………………..
44
xii
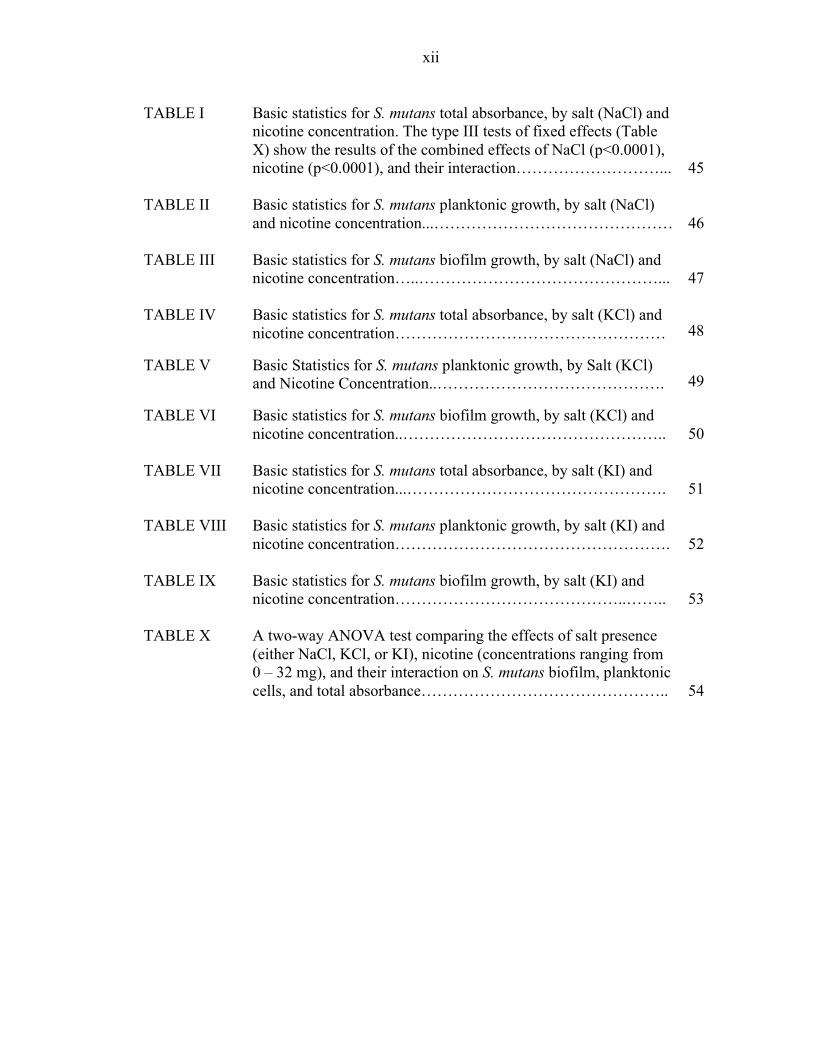
TABLE I Basic statistics for S. mutans total absorbance, by salt (NaCl) and nicotine concentration. The type III tests of fixed effects (Table X) show the results of the combined effects of NaCl (p<0.0001), nicotine (p<0.0001), and their interaction………………………...
45
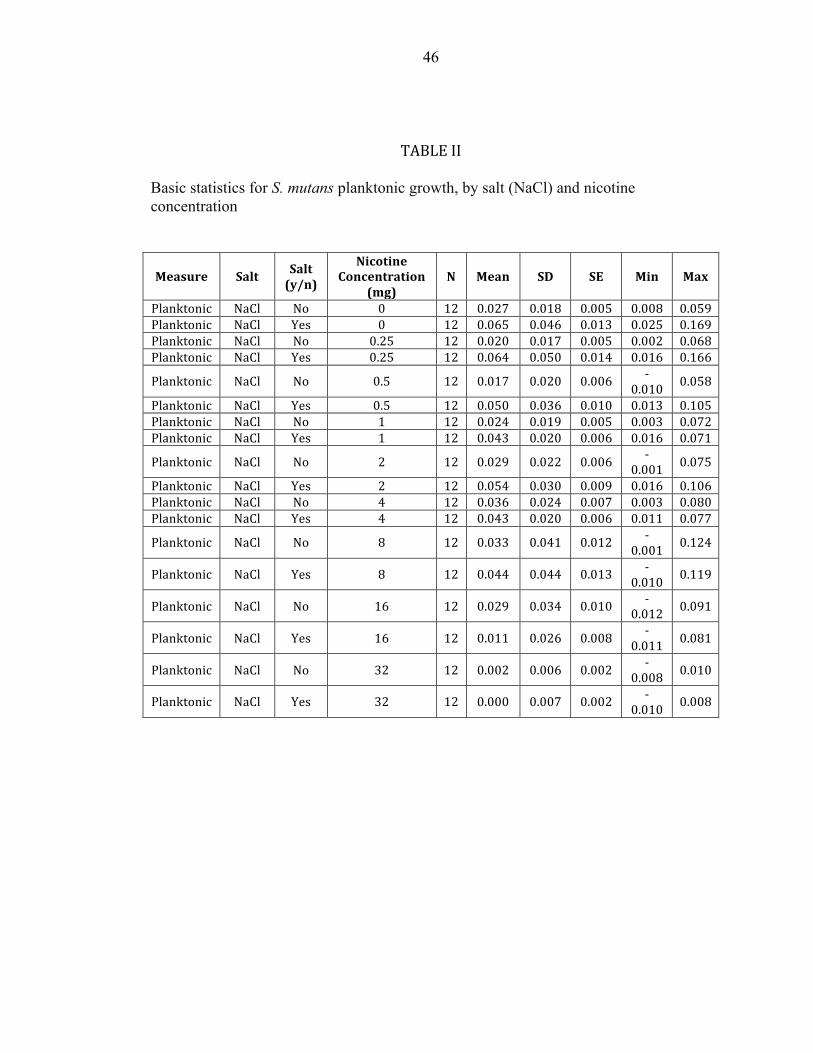
TABLE II Basic statistics for S. mutans planktonic growth, by salt (NaCl) and nicotine concentration...………………………………………
46
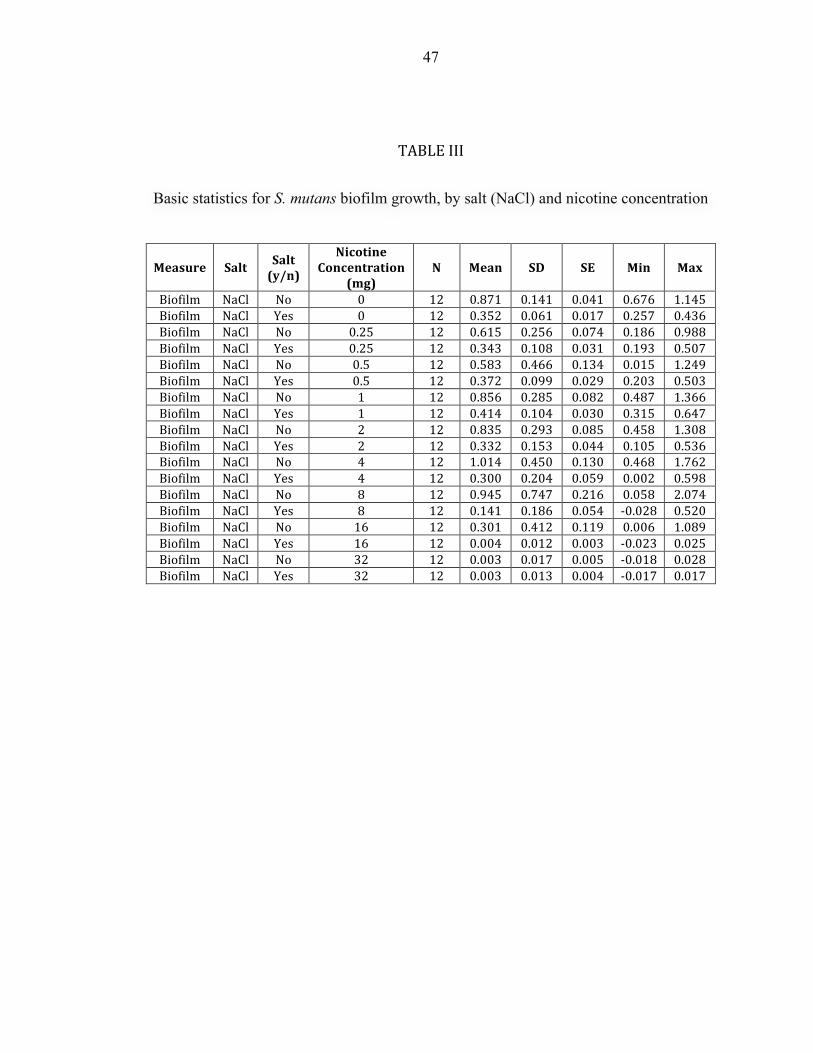
TABLE III
Basic statistics for S. mutans biofilm growth, by salt (NaCl) and nicotine concentration…..………………………………………...
47
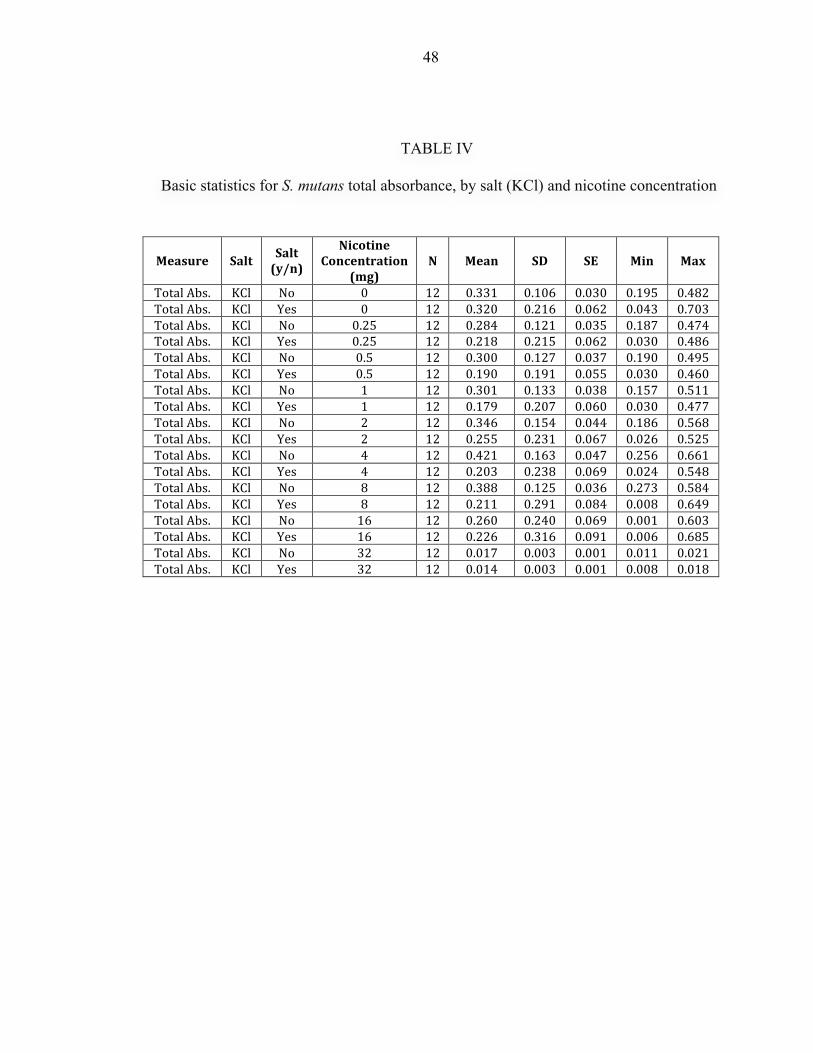
TABLE IV Basic statistics for S. mutans total absorbance, by salt (KCl) and nicotine concentration…………………………………………… 48
TABLE V Basic Statistics for S. mutans planktonic growth, by Salt (KCl) and Nicotine Concentration..……………………………………. 49
TABLE VI Basic statistics for S. mutans biofilm growth, by salt (KCl) and nicotine concentration..…………………………………………..
50
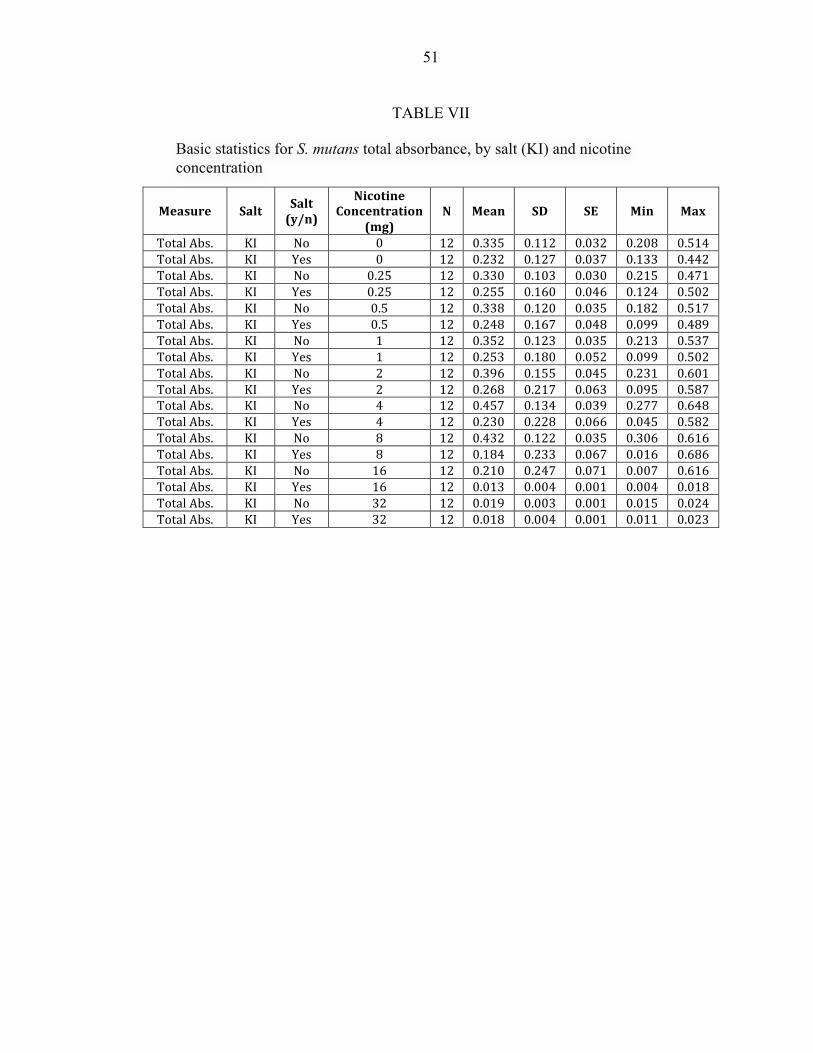
TABLE VII Basic statistics for S. mutans total absorbance, by salt (KI) and nicotine concentration...………………………………………….
51
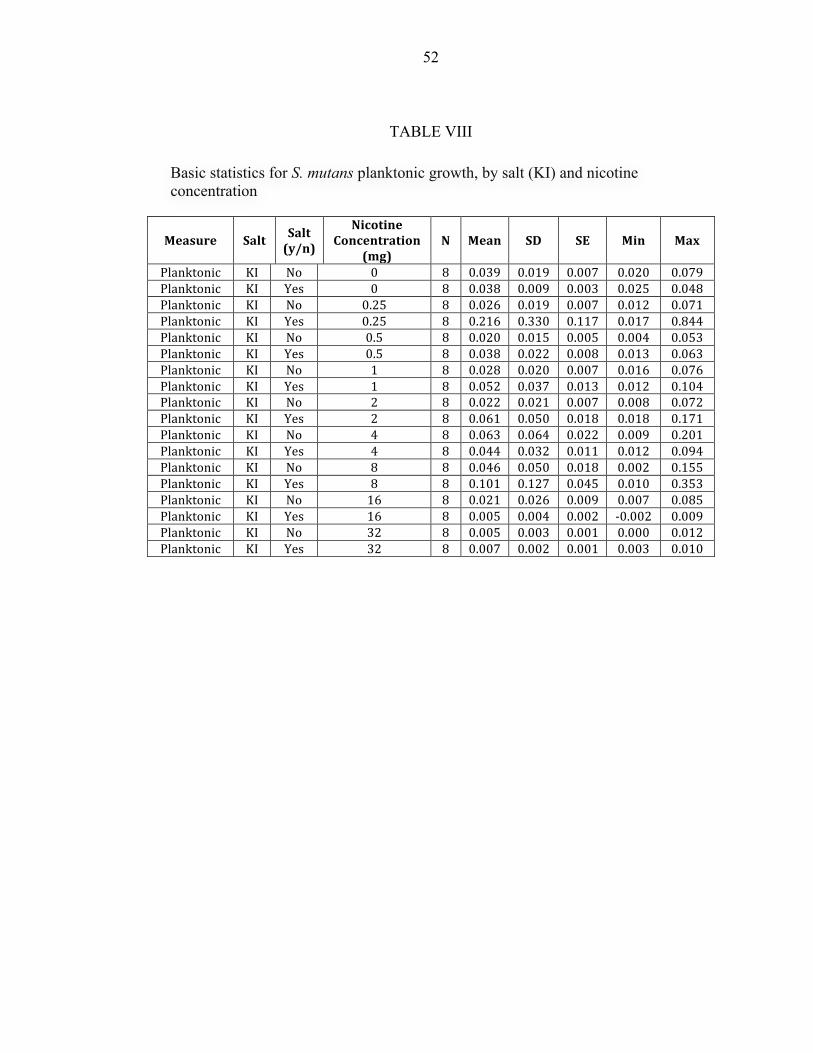
TABLE VIII Basic statistics for S. mutans planktonic growth, by salt (KI) and nicotine concentration…………………………………………….
52
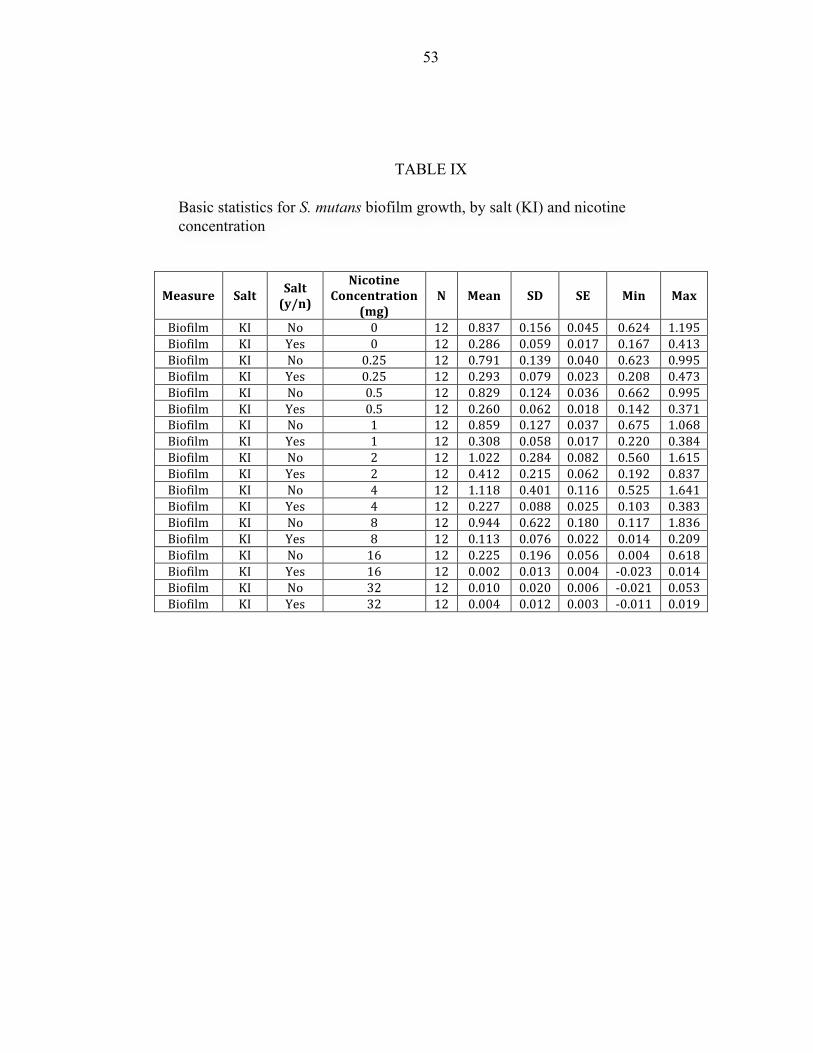
TABLE IX
Basic statistics for S. mutans biofilm growth, by salt (KI) and nicotine concentration……………………………………..……..
53
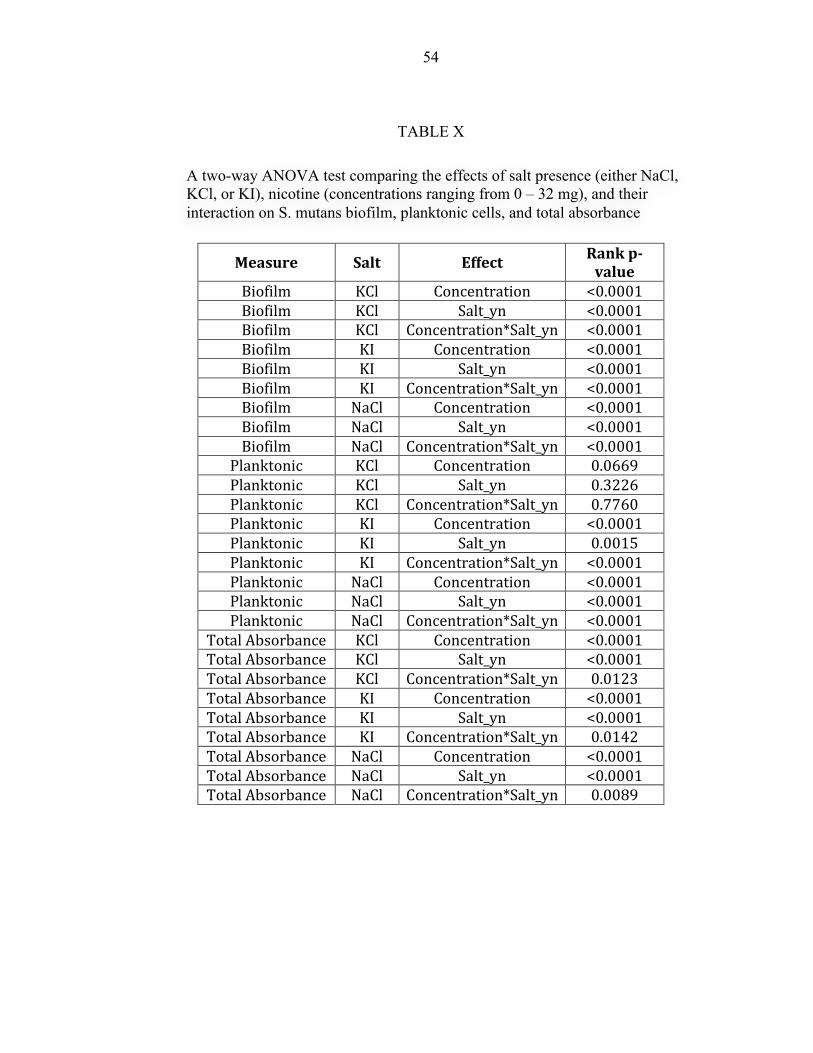
TABLE X A two-way ANOVA test comparing the effects of salt presence (either NaCl, KCl, or KI), nicotine (concentrations ranging from 0 – 32 mg), and their interaction on S. mutans biofilm, planktonic cells, and total absorbance………………………………………..
54

1
INTRODUCTION

2
Dental caries is one of the most prevalent chronic oral diseases. Sixty percent to
90 percent of school children and nearly 100 percent of adults around the world have
caries.1 In the USA in 2007, around 91 percent of individuals older than age 20 had some
level of caries experience, and 27 percent had untreated carious lesions.2 About 38
percent of children aged two through eight years in the US had some caries experience,
and 14 percent were recognized with untreated dental caries.3 In addition, Dye et al.
stated that one in five children aged five to 11 years and one in seven adolescents aged 11
to 19 years have at least one untreated dental caries lesion.4 Dental caries can be defined
as a multifactorial disease resulting from an ecological shift of the microbial species
inside the mouth, leading to mineral loss from the tooth structure.5 The concept behind
dental caries has been expanded to involve many aspects such as the caustic bacteria,
nutrition, host and other factors related to economy and education.6-9 In addition, the
concept has been explained as a dynamic process of demineralization and
remineralization cycles that affects the quantity of minerals inside the tooth structure. If
demineralization dominates, loss of minerals from the enamel may occur and teeth may
become cavitated. But if remineralization dominates, the lesion could be arrested and
teeth could gain the minerals back.10,11 This concept leads many dental practitioners to
understand the difference between cavitated and non-cavitated lesions as non-cavitated
lesions could be remineralized without any need for aggressive intervention, i.e. tooth
drilling and filling.12 For a long time, scoring non-cavitated lesions was eliminated from
caries indexes because these lesions are difficult to diagnose.13 However, this concept
3
was refuted by many studies stating that dental practitioners can be trained to recognize
such lesions.14, 15 As a result, non-cavitated lesions have been added in many caries
detection systems. The fact that these lesions could be reversed before cavitation raises
many questions regarding how the enamel could be remineralized. So, dental
practitioners should be able to recognize non-cavitated lesions as these lesions could be
remineralized without surgical intervention.16
Remineralization Strategies
Many strategies have been developed to arrest or reverse the process of
demineralization. Fluoride is considered the most widely used anti-caries agent as
fluoride dentifrices have contributed to decreasing the amount of caries incidence in
many countries.17,18 In 2003 Marinho et al. conducted a systematic review of 70 clinical
trials that compared fluoride dentifrice with a placebo. It was found that fluoride is
capable of decreasing the DMFS score by 24 percent among permanent teeth.19
Moreover, fluoride mouthwash has a significant effect in reducing caries incidence.20, 21
In addition, many studies discussed the ability of casein phosphopeptide (CPP)
amorphous calcium-phosphate (ACP) complexes to inhibit demineralization and increase
the remineralization process. These compounds increase the amount of calcium and
phosphate in the dental plaque. So, they restore the same minerals that were lost during
the demineralization process.22-25 Recently, silver diamine fluoride (SDF) provided
fascinating results regarding its ability to arrest both enamel and dentin caries.22 In 2002
Chu et al. conducted a clinical trial study among 376 school children using SDF. It was
found that annual application of SDF is more effective than 5.0-percent sodium fluoride
varnish, and it was found that SDF is effective no matter if the caries was removed or
4
not.27
Another aim to decrease the incidence of caries has been focused on reducing the
load of Streptococcus mutans and dental plaque. Many agents have been used for these
purposes such as chlorhexidine, essential oils, triclosan, cetylpyridinium chloride,
sanquinarin, sodium dodecyl sulphate, tin, zinc, and copper ions. With the exception of
chlorhexidine, the effectiveness of these agents is still questionable.26 Many salts such as
sodium chloride (NaCl), potassium chloride (KCl) and potassium iodide (KI) are
available in everyday life and are easy to obtain. The antimicrobial activities of these
salts have been demonstrated in the literature. It was found that the salt tolerance test, that
contains TSB and 6.5-percent NaCl, inhibits the growth of Streptococcus pyogenes and
Streptococcus bovis.28 Also, the combination of NaCl and KCl demonstrated some kind
of inhibition against many bacterial species including Staphylococcus aureus.29 KI has
been used to treat many fungal and respiratory tract infections.30 Moreover, some studies
investigated the effect of these salts on S. mutans, but no study has investigated the effect
of these salts specifically on S. mutans biofilm formation or nicotine-induced S. mutans
biofilm formation.
Objectives/Specific Aim
Hypothesis
The presence of a specific concentration of NaCl, KCl and KI inhibit first hand
nicotine-induced S. mutans biofilm formation (nicotine; 0-32 mg/ml).

5
The null hypothesis is that the presence of a specific concentration of NaCl, KCl
and KI salts increase or have no effect on S. mutans biofilm formation with first hand
nicotine exposure.

6
REVIEW OF LITERATURE
7
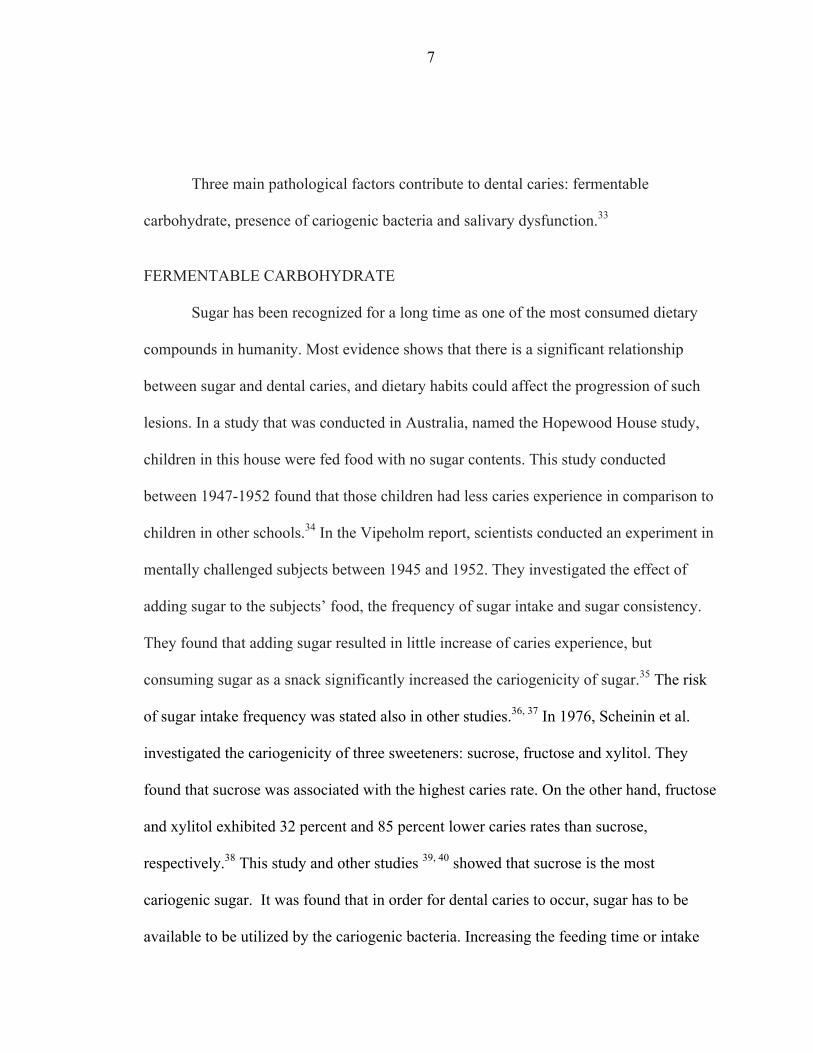
Three main pathological factors contribute to dental caries: fermentable
carbohydrate, presence of cariogenic bacteria and salivary dysfunction.33
FERMENTABLE CARBOHYDRATE
Sugar has been recognized for a long time as one of the most consumed dietary
compounds in humanity. Most evidence shows that there is a significant relationship
between sugar and dental caries, and dietary habits could affect the progression of such
lesions. In a study that was conducted in Australia, named the Hopewood House study,
children in this house were fed food with no sugar contents. This study conducted
between 1947-1952 found that those children had less caries experience in comparison to
children in other schools.34 In the Vipeholm report, scientists conducted an experiment in
mentally challenged subjects between 1945 and 1952. They investigated the effect of
adding sugar to the subjects’ food, the frequency of sugar intake and sugar consistency.
They found that adding sugar resulted in little increase of caries experience, but
consuming sugar as a snack significantly increased the cariogenicity of sugar.35 The risk
of sugar intake frequency was stated also in other studies.36, 37 In 1976, Scheinin et al.
investigated the cariogenicity of three sweeteners: sucrose, fructose and xylitol. They
found that sucrose was associated with the highest caries rate. On the other hand, fructose
and xylitol exhibited 32 percent and 85 percent lower caries rates than sucrose,
respectively.38 This study and other studies 39, 40 showed that sucrose is the most
cariogenic sugar. It was found that in order for dental caries to occur, sugar has to be
available to be utilized by the cariogenic bacteria. Increasing the feeding time or intake
8
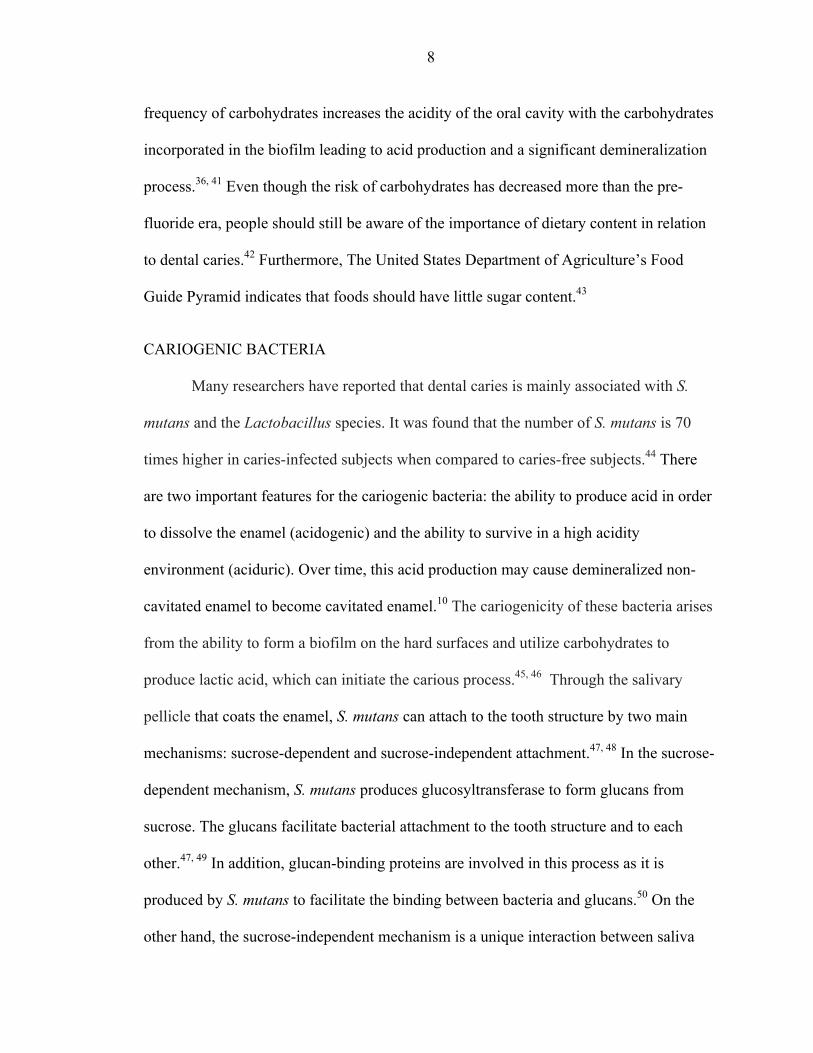
frequency of carbohydrates increases the acidity of the oral cavity with the carbohydrates
incorporated in the biofilm leading to acid production and a significant demineralization
process.36, 41 Even though the risk of carbohydrates has decreased more than the pre-
fluoride era, people should still be aware of the importance of dietary content in relation
to dental caries.42 Furthermore, The United States Department of Agriculture’s Food
Guide Pyramid indicates that foods should have little sugar content.43
CARIOGENIC BACTERIA
Many researchers have reported that dental caries is mainly associated with S.
mutans and the Lactobacillus species. It was found that the number of S. mutans is 70
times higher in caries-infected subjects when compared to caries-free subjects.44 There
are two important features for the cariogenic bacteria: the ability to produce acid in order
to dissolve the enamel (acidogenic) and the ability to survive in a high acidity
environment (aciduric). Over time, this acid production may cause demineralized non-
cavitated enamel to become cavitated enamel.10 The cariogenicity of these bacteria arises
from the ability to form a biofilm on the hard surfaces and utilize carbohydrates to
produce lactic acid, which can initiate the carious process.45, 46 Through the salivary
pellicle that coats the enamel, S. mutans can attach to the tooth structure by two main
mechanisms: sucrose-dependent and sucrose-independent attachment.47, 48 In the sucrose-
dependent mechanism, S. mutans produces glucosyltransferase to form glucans from
sucrose. The glucans facilitate bacterial attachment to the tooth structure and to each
other.47, 49 In addition, glucan-binding proteins are involved in this process as it is
produced by S. mutans to facilitate the binding between bacteria and glucans.50 On the
other hand, the sucrose-independent mechanism is a unique interaction between saliva
9
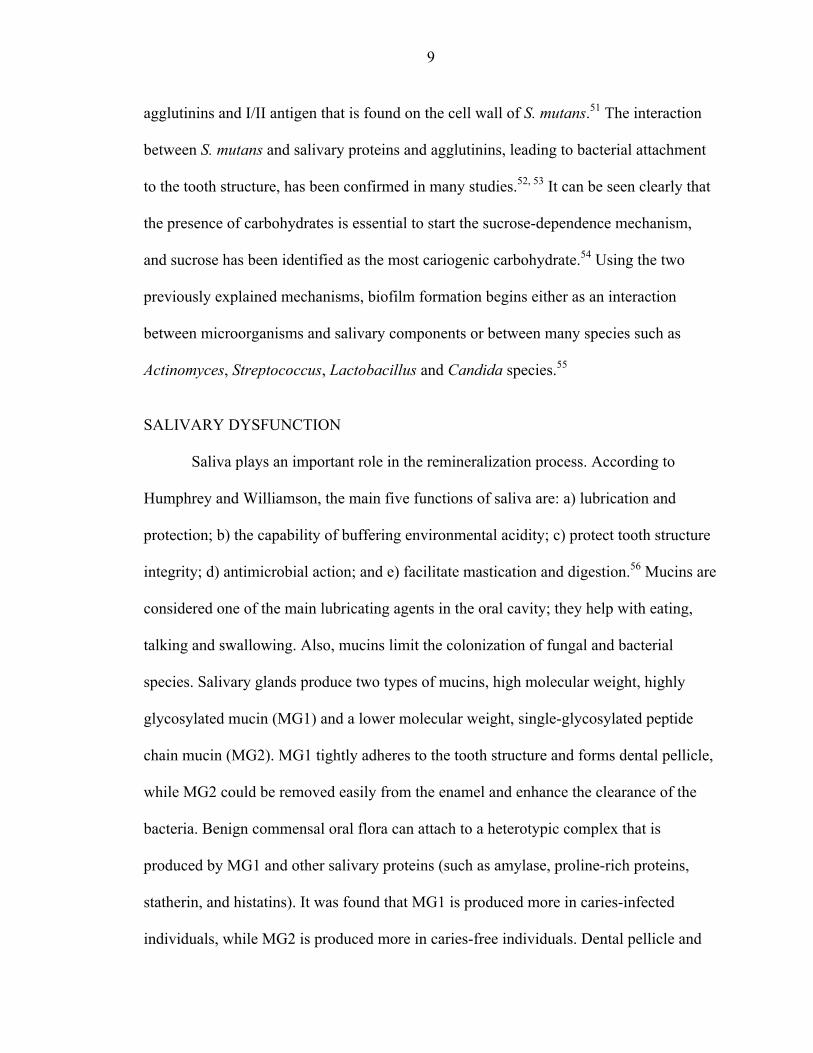
agglutinins and I/II antigen that is found on the cell wall of S. mutans.51 The interaction
between S. mutans and salivary proteins and agglutinins, leading to bacterial attachment
to the tooth structure, has been confirmed in many studies.52, 53 It can be seen clearly that
the presence of carbohydrates is essential to start the sucrose-dependence mechanism,
and sucrose has been identified as the most cariogenic carbohydrate.54 Using the two
previously explained mechanisms, biofilm formation begins either as an interaction
between microorganisms and salivary components or between many species such as
Actinomyces, Streptococcus, Lactobacillus and Candida species.55
SALIVARY DYSFUNCTION
Saliva plays an important role in the remineralization process. According to
Humphrey and Williamson, the main five functions of saliva are: a) lubrication and
protection; b) the capability of buffering environmental acidity; c) protect tooth structure
integrity; d) antimicrobial action; and e) facilitate mastication and digestion.56 Mucins are
considered one of the main lubricating agents in the oral cavity; they help with eating,
talking and swallowing. Also, mucins limit the colonization of fungal and bacterial
species. Salivary glands produce two types of mucins, high molecular weight, highly
glycosylated mucin (MG1) and a lower molecular weight, single-glycosylated peptide
chain mucin (MG2). MG1 tightly adheres to the tooth structure and forms dental pellicle,
while MG2 could be removed easily from the enamel and enhance the clearance of the
bacteria. Benign commensal oral flora can attach to a heterotypic complex that is
produced by MG1 and other salivary proteins (such as amylase, proline-rich proteins,
statherin, and histatins). It was found that MG1 is produced more in caries-infected
individuals, while MG2 is produced more in caries-free individuals. Dental pellicle and
10
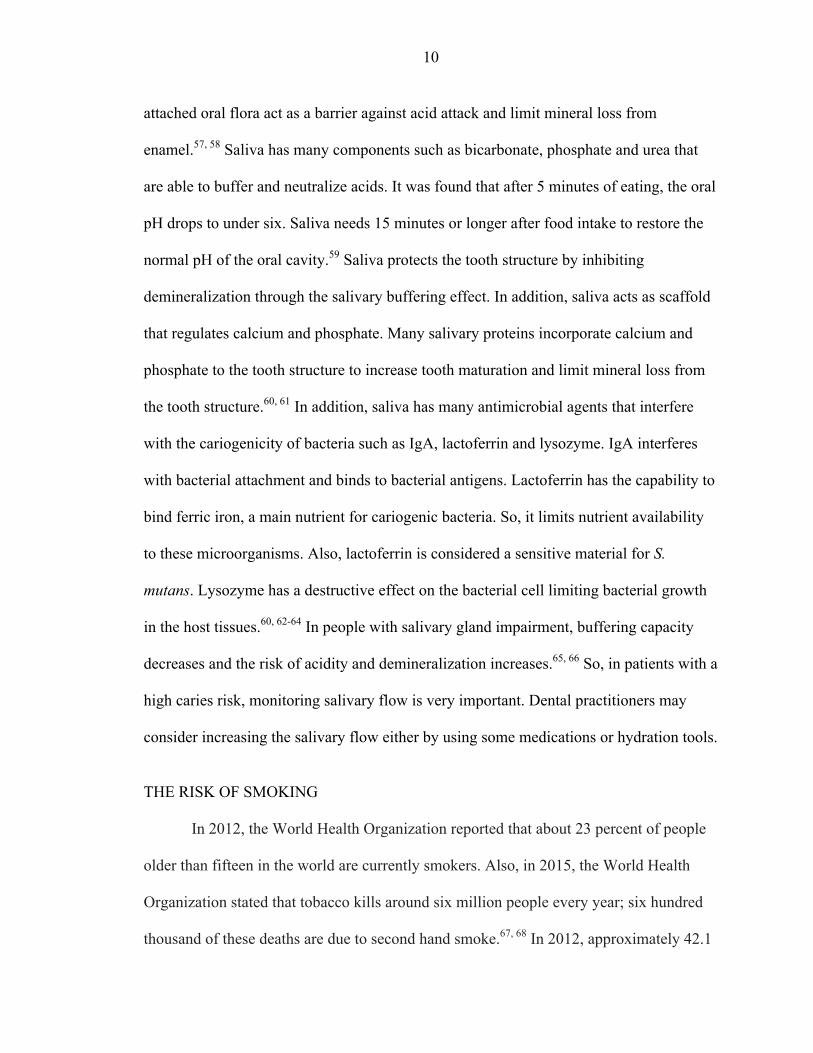
attached oral flora act as a barrier against acid attack and limit mineral loss from
enamel.57, 58 Saliva has many components such as bicarbonate, phosphate and urea that
are able to buffer and neutralize acids. It was found that after 5 minutes of eating, the oral
pH drops to under six. Saliva needs 15 minutes or longer after food intake to restore the
normal pH of the oral cavity.59 Saliva protects the tooth structure by inhibiting
demineralization through the salivary buffering effect. In addition, saliva acts as scaffold
that regulates calcium and phosphate. Many salivary proteins incorporate calcium and
phosphate to the tooth structure to increase tooth maturation and limit mineral loss from
the tooth structure.60, 61 In addition, saliva has many antimicrobial agents that interfere
with the cariogenicity of bacteria such as IgA, lactoferrin and lysozyme. IgA interferes
with bacterial attachment and binds to bacterial antigens. Lactoferrin has the capability to
bind ferric iron, a main nutrient for cariogenic bacteria. So, it limits nutrient availability
to these microorganisms. Also, lactoferrin is considered a sensitive material for S.
mutans. Lysozyme has a destructive effect on the bacterial cell limiting bacterial growth
in the host tissues.60, 62-64 In people with salivary gland impairment, buffering capacity
decreases and the risk of acidity and demineralization increases.65, 66 So, in patients with a
high caries risk, monitoring salivary flow is very important. Dental practitioners may
consider increasing the salivary flow either by using some medications or hydration tools.
THE RISK OF SMOKING
In 2012, the World Health Organization reported that about 23 percent of people
older than fifteen in the world are currently smokers. Also, in 2015, the World Health
Organization stated that tobacco kills around six million people every year; six hundred
thousand of these deaths are due to second hand smoke.67, 68 In 2012, approximately 42.1
11
million adults in the United States were smokers.69 Smoking or tobacco use is considered
one of the biggest health problems in the world. Many studies that were based on daily
use of tobacco stated that smoking can cause serious health problems.70 Smoking
contributes to cardiovascular diseases. And it has been proven that light smoking had the
same risk as intermittent smoking. It was found that heart disease from light smoking,
which is about four to seven cig/day, is about 70 percent of heart disease found in heavy
smokers (>23 cig/day).71, 72 Light smoking is three times higher in causing ischemic heart
disease and twice as high in causing myocardial infarction than non-smokers.71, 73 In
addition, light smoking can cause aortic aneurysm three times higher than non-smokers.74
Generally speaking, over a long-term period, 11% of light smokers were found to have
cardiac problems when compared to 3.7 percent for non-smokers.75 Also, it is known that
heavy smoking is associated with higher percentages of cardiac problems. In addition, it
was found that heavy smokers, both men and women, were 23 and 13 times, respectively,
greater in developing lung cancer than non-smokers. Because smoking and lung cancer
have a dose-response relationship, these numbers are lower in light smokers, 3-5 times
higher than non-smokers.70, 71, 74 Also, smoking was found to cause other types of cancer
such as stomach, pancreas and esophagus cancers. In addition, other conditions are
associated with smoking such as respiratory infections, reproductive problems, ectopic
pregnancy and physical disability.76 Smoking has been recognized as one of the risk
factors of many oral health problems. Many studies show that first and secondhand
smokers are at higher risk of edentulism than non-smokers.77-79 In addition, a strong
association is seen between smoking and oropharyngeal cancer. It was found that heavy
tobacco users are 5-25 times higher risk for oropharyngeal cancer than non-tobacco users.
12
For those people who are heavy tobacco users and drink heavily, this rate rises to 35
times higher.80,81 Moreover, smoking has been recognized as a risk factor for periodontal
diseases, implant failure and peri-implantitis.82,83 Many studies have investigated the
relationship between smoking and dental caries, and it was found that smoking is
correlated with high caries incidence.84-86 Nicotine load is higher in the oral cavity of
smokers,87 and this concentration ranges from 0-2.27 mg/ml in saliva.87-89 In 2012, Huang
et al. conducted a study to investigate the effects of nicotine on seven S. mutans strains,
UA159, UA130, 10449, A32-2, NG8, LM7, and OMZ175. They found that the minimum
inhibitory concentration (MIC) and minimum bactericidal concentration (MBC) for
nicotine was 16 and 32 mg/ml-1, respectively. Also, they illustrated that the minimum
biofilm inhibitory concentration (MBIC) was 16 mg/ml-1 for all strains except for strains
10449 which was 8 mg/ml-1.90 The same conclusion was reported by Li et al. who
concluded that nicotine could also increase the growth of S. mutans over Streptococcus
sanguinis in dual species experiments.91 The same authors investigated the specific
mechanism of nicotine that allows S. mutans biofilm to increase. They found that nicotine
is able to increase the number of S. mutans and extracellular polysaccharide (EPS)
synthesis, the main component of biofilm matrix. Also, they stated that nicotine increases
GbpA expression up to 4.0 fold, Gtfs expression up to 2.2 fold, and no change in GbpB
expression. While this study demonstrated that nicotine has nothing to do with lactate
dehydrogenase (LDH) activity, it can be concluded that increasing the number of S.
mutans cells leads to more LDH production.92 A recent metabolomic study indicated that
nicotine increases lactate concentration of S. mutans by two fold.93 In addition, Tanaka et
al. suggested that smoking during pregnancy or in the postnatal period could increase the
13
risk of caries in primary dentition.94 For those people who cannot stop smoking or those
who spend time with smokers, an important question should be answered regarding how
the effects of nicotine on the growth of biofilm could be diminished.
How to Limit The Cariogenicity of Nicotine?
NaCl, in the form of saline, has been used in the medical field for many decades.95
It is used as an intravenous infusion, in wound cleaning, and nasal irrigation procedures
to treat bronchiolitis.96, 97 Hypertonic saline, saline with a higher concentration of NaCl,
is another form of saline and is used to manage intracranial pressure and traumatic brain
injury.98 NaCl is considered one of the antibacterial tools that can be used in dentistry,
and its potency varies in different situations. Hirasawa and Takada found that adding
NaCl to aztreonam and carumonam can inhibit the growth of S. mutans.99 Another study
found that the presence of NaCl can decrease glucosyltransferase activity of S. mutans.100
In addition, it has been found that the combination of sodium salts with certain materials
such as NaHCO3 or human salivary lysosome causes S. mutans lysis.101, 102 Mutanolysin
is a bacteriolytic enzyme that was discovered in 1972 by Yokogawa and Yoshimura.103
When this enzyme was applied to S. mutans, no significant reduction in optical density
was noticed. But after the addition of 1 M of NaCl to mutanolysin, significant S. mutans
lysis was observed.104 The adaptive response is the ability of an organism to adapt to
unusual conditions leading to resistance to possible damage. It was found that S. mutans
is able to resist the acidity of the surrounding environment by a gene called ClpP, which
encodes for serine protease.105, 106 Deng et al. investigated the induction of ClpP after
exposing S. mutans to many antimicrobial agents including NaCl. They found that 0.25
and 0.5 M of NaCl stimulated a significant induction of ClpP that means NaCl has some
14
antimicrobial effect on S. mutans.107 The ability of NaCl and KCl to inhibit the
demineralization process and acid production has been studied.108, 109 In addition, it was
found the S. mutans attachment to salivary agglutinin could be inhibited by using NaCl or
KCl salts.110 Both NaCl and KCl has been used in many studies to suspend growth of S.
mutans 111-115 or as buffering agents.115-118 However, some studies indicated that NaCl
and KCl were not effective in reducing the cariogenicity or the growth of S. mutans.119-121
KI has been used in different medical fields such as dermatology, treatment of
hyperthyroidism and fungal infections.30, 122, 123 In addition, it has been found that KI
could reduce the growth of the S. mutans. In a study done by Hamama et al., it was found
that when KI is combined with silver diamine fluoride (SDF), a synergistic effect could
be developed to diminish S. mutans growth.124 Also, Knight et al. demonstrated that the
combination of KI and SDF could increase fluoride uptake of dentin.125 In another study,
the same authors found that this combination is able to inhibit caries progression in vitro
and prevent biofilm formation.126

15
MATERIALS AND METHODS
16
PRELIMINARY EXPERIMENT
Before starting the main study, a preliminary experiment was done to investigate
the most effective inhibitory concentration of sodium chloride (NaCl), potassium chloride
(KCl) and potassium iodide (KI). According to many researchers, the most commonly
used antimicrobial concentrations of NaCl, KCl and KI range from 0.075 to 0.35 M.99, 101,
102, 108, 127, 128 This preliminary experiment was designed to investigate the MIC of 0.0035,
0.007, 0.014, 0.028, 0.056, 0.113, 0.225, 0.25, 0.3, 0.35, 0.4, 0.45, 0.72 and 0.9 M of
NaCl, KCl and KI on the growth of S. mutans. Ten µl of an overnight culture of S.
mutans [approximately 106 colony-forming units (CFU), determined by spiral plating] in
Tryptic Soy Broth (TSB) was treated with 0.0035 M, 0.007 M, 0.014 M, 0.028 M, 0.056
M, 0.113 M, 0.225 M, 0.25 M, 0.3 M, 0.35 M, 0.4 M, 0.45 M, 0.72 M and 0.9 M of
NaCl, KCl or KI, which were diluted in TSB supplemented with 1.0-percent sucrose
(TSBS), for 24 h in sterile 96-well flat-bottom microtiter plates (Fisher Scientific,
Newark, DE). Each salt was investigated separately in different 96-well flat-bottom
microtiter plates. The optical density (OD) values of the bacterial cultures were measured
at 595 nm in a spectrophotometer (SpectraMax 190; Molecular Devices, Sunnyvale, CA)
The MIC was determined by the concentration where there was an obvious clear-cut
decrease in the absorbance. After incubation, the unbound planktonic cells were gently
aspirated and transferred to a new 96-well plate and the OD at 595 nm was determined in
order to calculate the effect on planktonic cells. The remaining planktonic cells were
discarded from the biofilm microtiter plate wells (leaving the attached biofilm cells), and
17
200 µl of 10-percent formaldehyde was added to each well for 30 min to fix the cells.
After 30 min, the formaldehyde was removed and the biofilm cells were washed 3 times
with deionized water. 200 µl of 0.5-percent crystal violet dye was added to each well and
the cells stained for 30 min. The wells were rinsed 3 times and 200 µl of 2-isopropanol
was placed into each well for 1 h to lyse the cells and extract the crystal violet. The plates
were read in a spectrophotometer at 490 nm to measure biofilm formation.129
FIRST-HAND NICOTINE EXPOSURE
After determining the MIC for the three salts, a culture of S. mutans UA159
(American Type Culture Collection, Rockville, MD; ATCC 700610) was grown in TSB
at 37oC in 5.0 percent CO2 and stored with 10-percent glycerol at -80oC. Stock solutions
of NaCl, KCl, and KI were dissolved in water, (4.2 g/40 ml; 1.8 M) for NaCl, (5.4 g/ 40
ml; 1.8 M) for KCl, and (11.95 g/40 ml; 1.8 M) for KI. All were stored in a -20oC freezer
until used. Then, an overnight culture of S. mutans UA159 was grown in TSB. NaCl,
KCl and KI salts were diluted in TSBS to obtain the MICs determined above, 0.45 M for
NaCl, 0.225 M for KCl, and 0.113 M for KI, using the following measurements:
1) NaCl:
• 2.5 ml of 1.8 M of NaCl was mixed with 7.5 ml of TSBS è 10 ml of
0.45 M NaCl/TSBS
2) KCl:
• 1.28 ml of 1.8 M of KCl was mixed with 8.72 ml of TSBS è 10 ml of
0.225 M KCl/TSBS
3) KI:
18
• 0.63 ml of 1.8 M of KI was mixed with 9.37 ml of TSBS è 10 ml of
0.113 M KI/TSBS
The dilutions of each salt with TSBS were arranged to have 0, 0.25, 0.5, 1.0, 2.0,
4.0, 8.0, 16.0 and 32.0 mg/ml nicotine (Sigma-Aldrich Chemical Co., St. Louis, MO).
Another set of TSBS dilutions was arranged to have 0 mg/dl, 0.25 mg/dl, 0.5 mg/dl, 1.0
mg/dl, 2.0 mg/dl, 4.0 mg/dl, 8.0 mg/dl, 16.0 mg/dl and 32.0 mg/ml nicotine (Sigma-
Aldrich Chemical Co., St. Louis, MO) without the NaCl, KCl and KI salts. In addition,
each salt was investigated alone. Each nicotine concentration was aliquoted by pipetting
190 µl of TSBS containing the nicotine/salt into wells of a sterile 96-well flat bottom
microtiter plate. 10 µl of the fresh overnight TSB culture of S. mutans was added. The
microtiter plates were kept in 5.0-percent CO2 at 37oC for 24 h. The following day, total
absorbance (biofilm & planktonic growth) was measured in a spectrophotometer
(SpectraMax 190; Molecular Devices Inc., Sunnyvale, CA) at 595 nm. Then, 120 µl from
each well was moved to the corresponding well of a new microtiter plate. The absorbance
of each well was measured at 595 nm to investigate planktonic growth. The remaining
planktonic cells were discarded from the biofilm microtiter plate wells (leaving attached
biofilm cells), and 200 µl of 10-percent formaldehyde was added to each well for 30 min
to fix the cells. After 30 min, the formaldehyde was removed and the biofilm cells were
washed 3 times with deionized water. 200 µl of 0.5-percent crystal violet dye was added
to each well and the cells stained for 30 min. The wells were rinsed 3 times and 200 µl of
2-isopropanol was placed into each well for 1 h to lyse the cells and extract the crystal
violet. The plates were read in a spectrophotometer at 490 nm to measure biofilm
formation.

19
CONTROLS
Controls included biofilms of S. mutans without nicotine and with or without NaCl,
KCl and KI salts.
STATISTICAL ANALYSES
Each experiment was repeated three times and each group consisted of 4 wells.
Two-way ANOVA was utilized to compare the effects of NaCl, KCl and KI salt exposure
(individually or all three combined) and nicotine and their interaction on planktonic,
biofilm, and total growth. Pair-wise comparisons were achieved using Fisher’s Protected
Least Significant Differences method to control the overall significance level at 5
percent. The primary focus of the study hypotheses are the comparisons involving NaCl,
KCl and KI salt exposure. The distribution of the measurements was investigated and
found to be non-normal, therefore a rank transformation was used to satisfy the ANOVA
assumptions prior to analysis.
SAMPLE SIZE CALCULATIONS
Based on prior studies, the within-group standard deviation of the absorbance
measurements for biofilm formation is estimated to be 0.15. With 4 samples in each of 3
trials of the study, the study will have 80-percent power to detect a difference of 0.2
between salts for each nicotine concentration, assuming two-sided tests conducted at an
overall 5-percent significance level.

20
RESULTS

21
RESULTS OF THE PRELIMINARY EXPERIMENT
From the results of the preliminary experiment, the MIC of these salts was
determined as follows: 0.45 M for NaCl, 0.23 M for KCl, and 0.113 M for KI. Results
indicated NaCl, KCl, and KI were able to inhibit biofilm formation significantly
(p<0.05). Starting with NaCl, it was found that most of the concentrations of NaCl tested
were capable of inhibiting biofilm formation. There was significant reduction (p<0.05) in
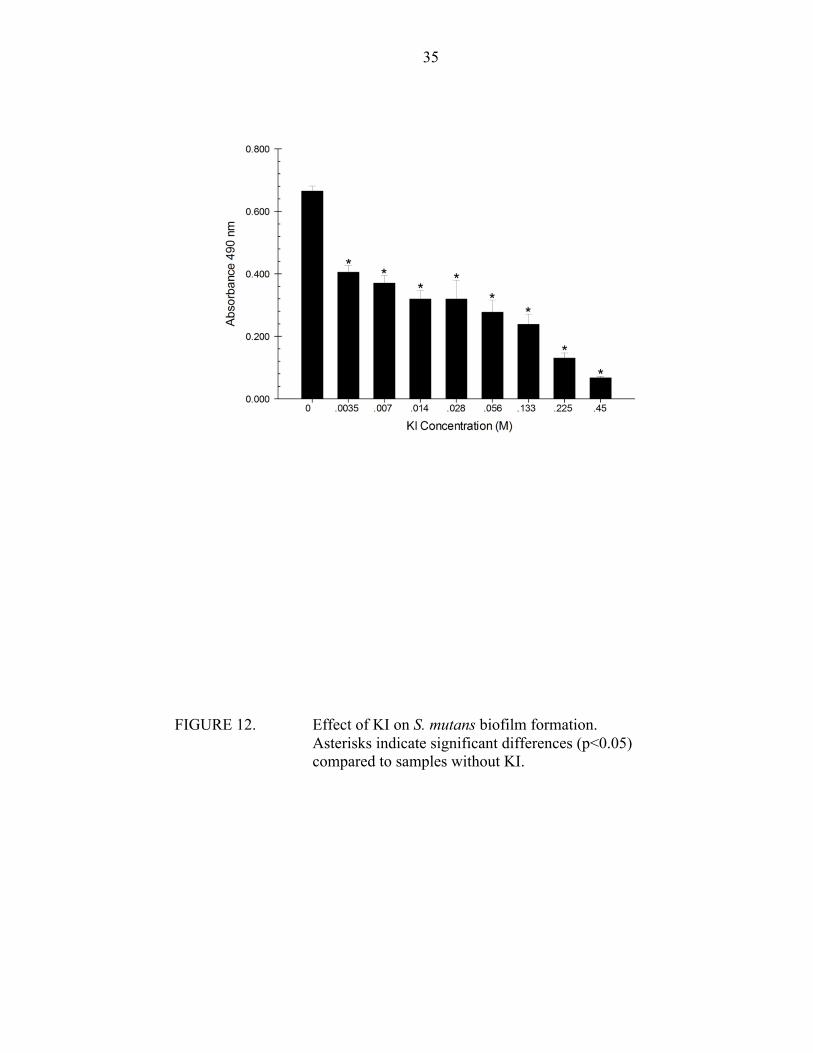
biofilm formation between 0.45 M and 0.72 M. It was seen clearly that 0.72 M of NaCl is
bactericidal, while 0.45 M NaCl exhibited minimum biofilm formation inhibition. For
this reason, 0.45 M of NaCl was recognized as the MIC for S. mutans biofilm formation.
Regarding KCl, most of the concentrations assayed were capable of inhibiting biofilm
formation. However, there was significant biofilm inhibition between two consecutive
concentrations, 0.225 and 0.3 M, indicating 0.225 M could be recognized as the MIC
while 0.3 M could be recognized as the MBC. Therefore, 0.225 M of KCl was
determined as the MIC. Finally, KI results demonstrated the same results regarding
biofilm formation. 0.113 M was determined as the MIC as any higher concentration than
that was bactericidal.
RESULTS OF THE MAIN EXPERIMENT
Overall, there was a significant effect for salt presence, nicotine concentration,
and their interaction for all salts (NaCl, KCl, and KI) and measures (biofilm, planktonic,
total absorbance), with the exception of KCl and planktonic growth. Regarding total
22
absorbance, there was a significant effect for NaCl presence, nicotine and their
interaction to reduce S. mutans total absorbance when the nicotine concentration was 0, 4
or 8 mg/ml. Also, the NaCl/nicotine interaction demonstrated a significant effect
inhibiting S. mutans biofilm formation with all concentrations in comparison to the no
NaCl group except when the nicotine concentration was 32 mg/ml. On the other hand,
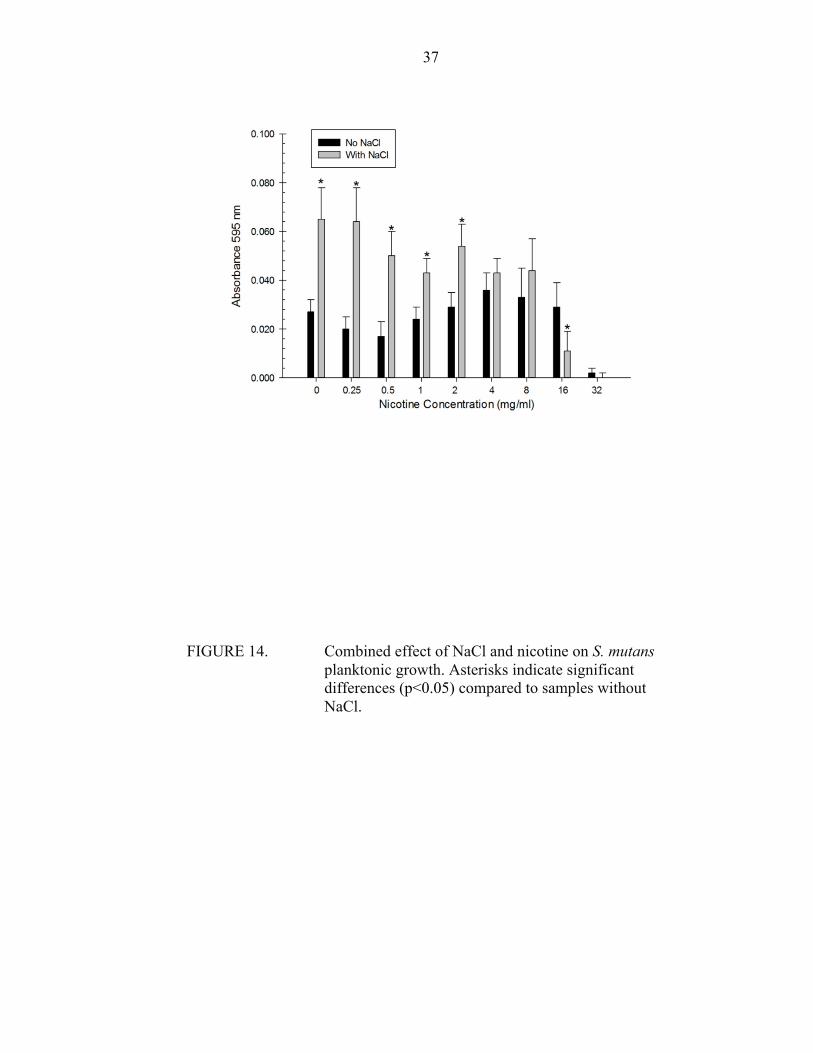
NaCl presence increased S. mutans planktonic growth significantly except when the
nicotine concentration was 4, 8 or 32 mg/ml.
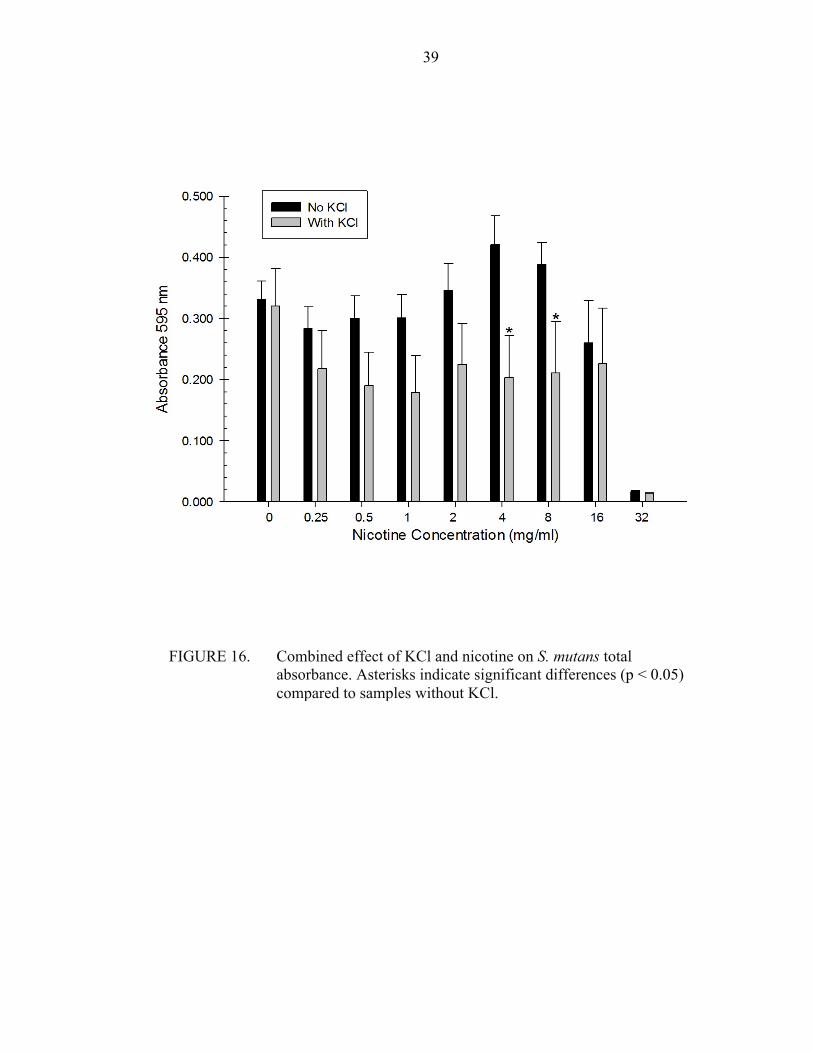
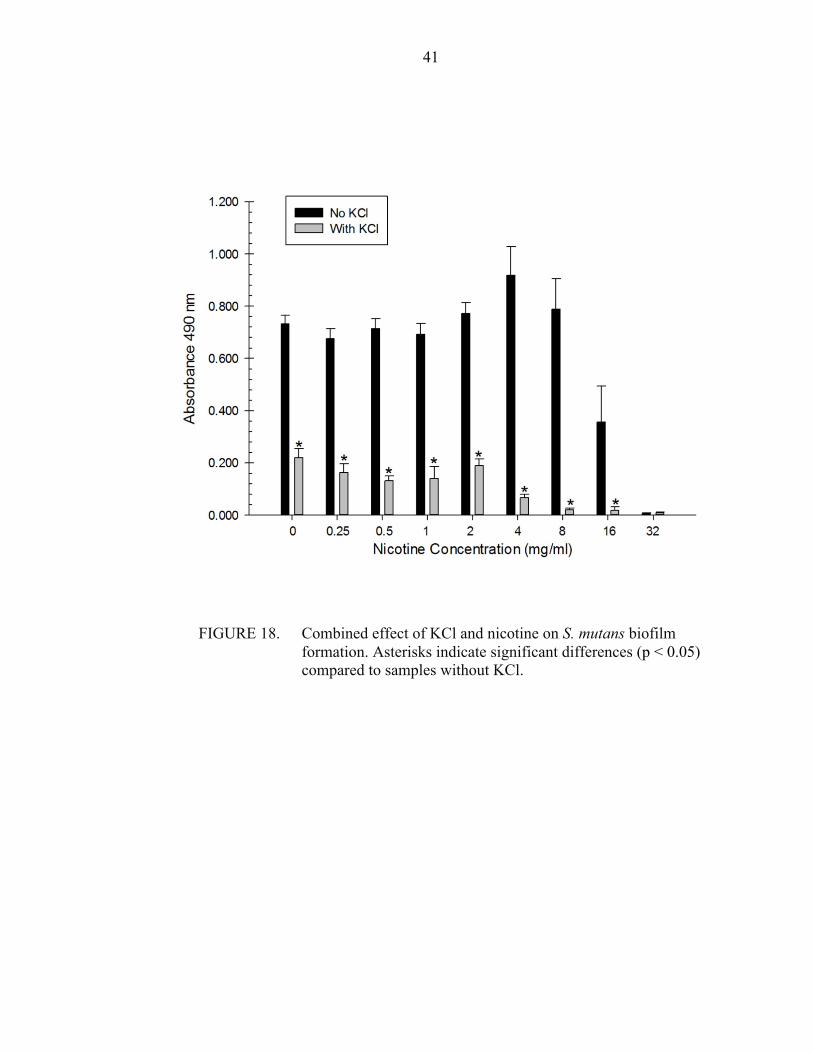
KCl exhibited significant interaction with nicotine as S. mutans total absorbance
was reduced when the nicotine concentration was 4 or 8 mg/ml. With the exception of the
32 mg/ml nicotine concentration, KCl/nicotine interaction significantly decreased S.
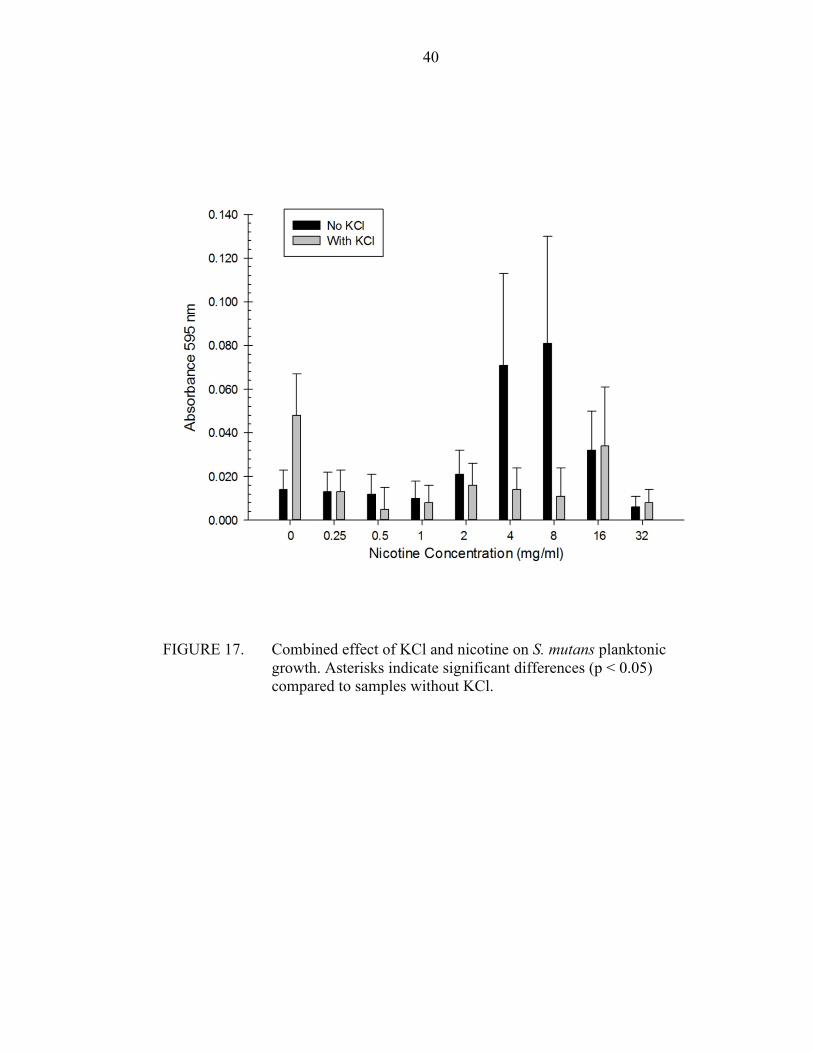
mutans biofilm formation when it was compared to the no KCl group. Regarding
planktonic growth, no significant effect was found between the KCl/nicotine and nicotine
groups.
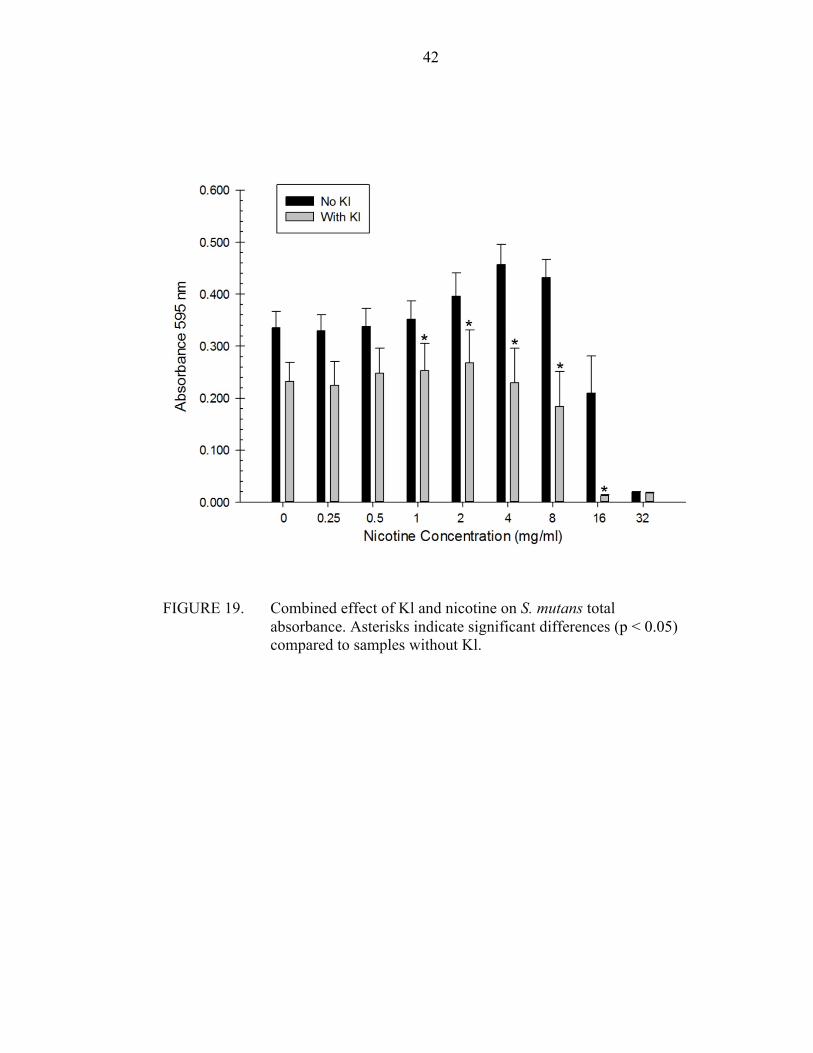
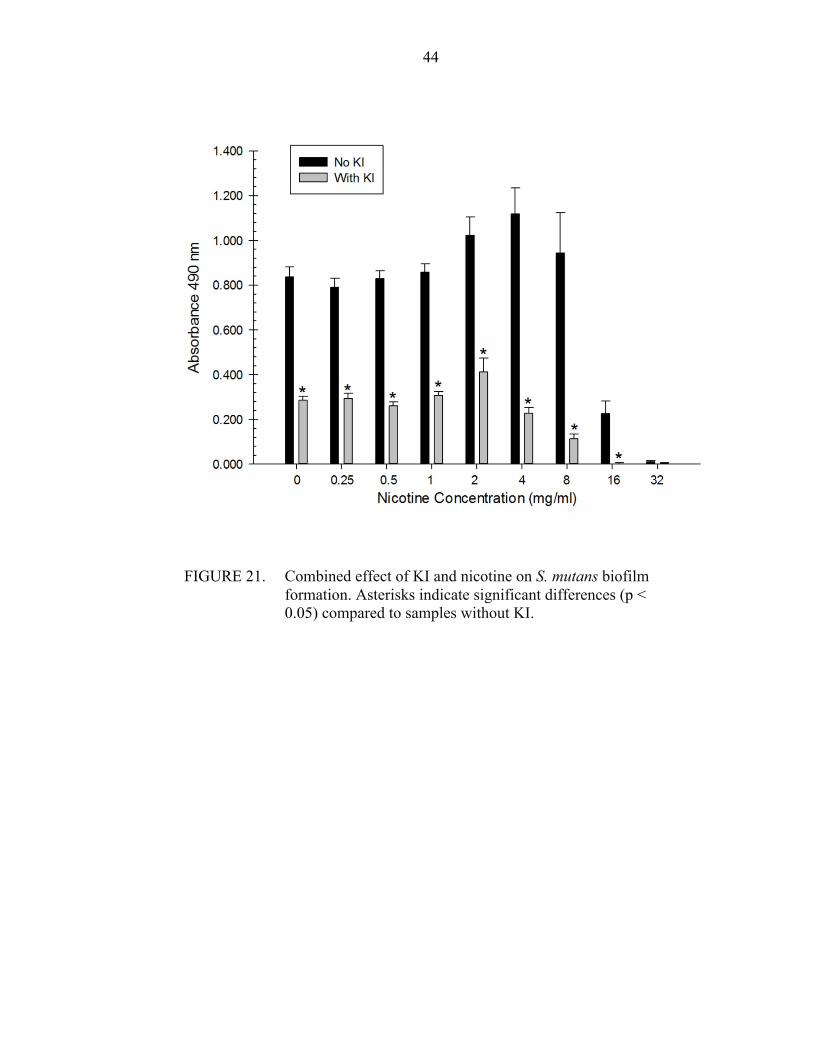
Also, the KI/nicotine interaction significantly reduced S. mutans total absorbance
except when the nicotine concentration was 0, 0.25, 0.5 and 32 mg/ml. The KI/nicotine
interactions significantly diminished S. mutans biofilm formation with all nicotine
concentrations except the 32 mg/ml concentration. Finally, the KI/nicotine interaction
significantly reduced S. mutans planktonic growth when the nicotine concentration was
0.25, 0.5, 2 and 16 mg/ml.

23
FIGURES AND TABLES

24
FIGURE 1. S. mutans UA159 was grown in TSB at 37oC in 5% CO2 for 24 hours and stored with 10% glycerol at -80oC.

25
FIGURE 2. Each salt (NaCl, KCl and KI) was dissolved in TSBS.
26
FIGURE 3. Dilutions of 0 mg/ml, 0.25 mg/ml, 0.5 mg/ml, 1.0 mg/ml, 2.0 mg/ml, 4.0 mg/ml, 8.0 mg/ml, 16.0 mg/ml and 32.0 mg/ml nicotine in TSBS with and without the salts.
27
FIGURE 4. Each nicotine/CSC concentration was aliquoted by pipetting 190 µl of TSBS containing the nicotine/CSC/salt into wells of a sterile 96-well flat bottom microtiter plate. Then, 10 µl of the fresh overnight TSB culture of S. mutans was added.
28
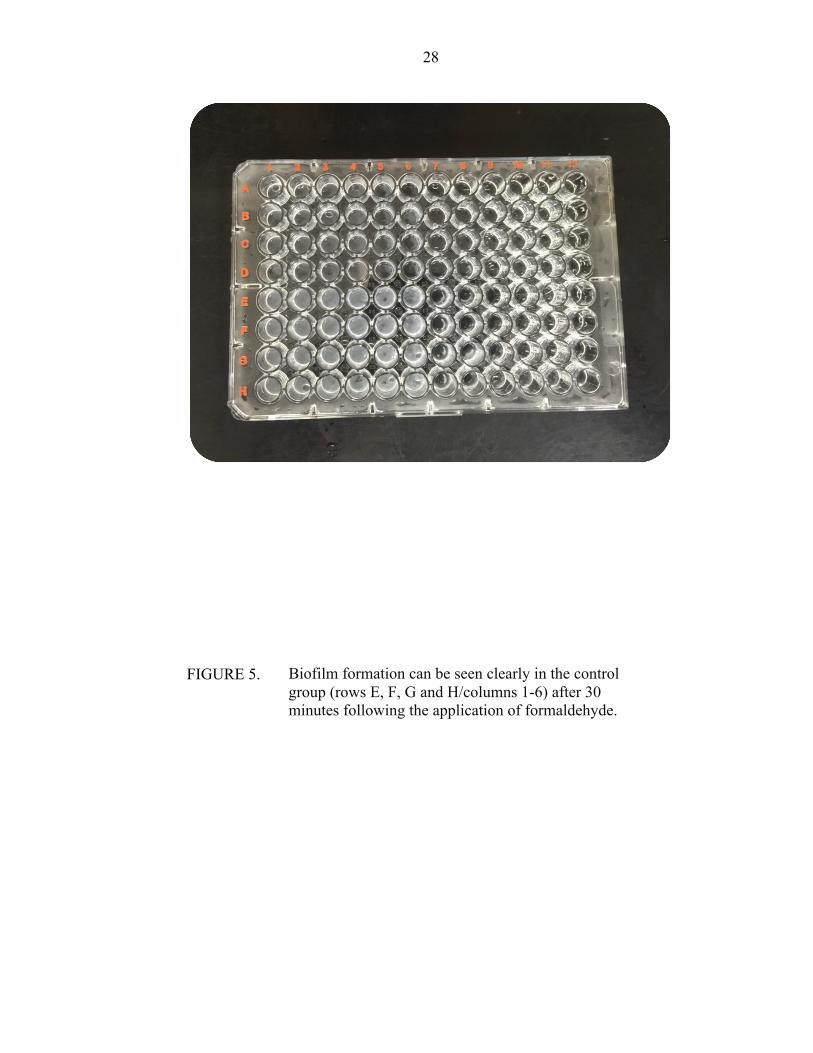
FIGURE 5.
Biofilm formation can be seen clearly in the control group (rows E, F, G and H/columns 1-6) after 30 minutes following the application of formaldehyde.
29
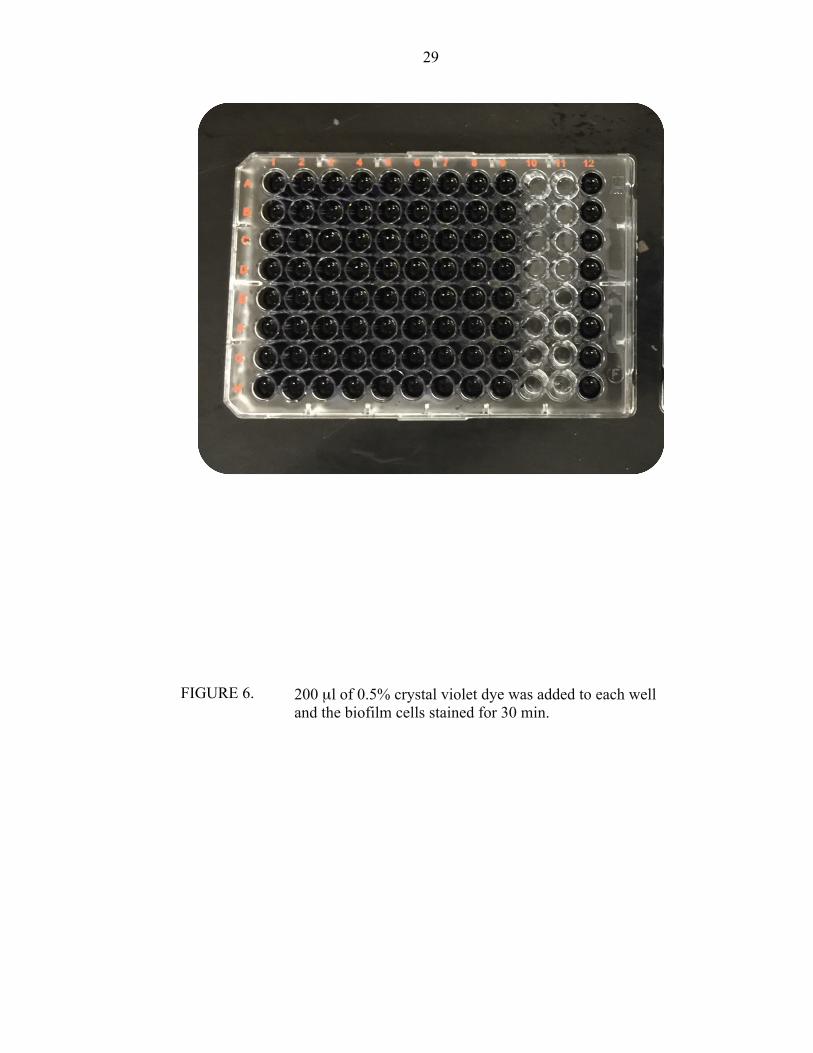
FIGURE 6. 200 µl of 0.5% crystal violet dye was added to each well and the biofilm cells stained for 30 min.
30
FIGURE 7. After crystal violet dye application, the wells were rinsed 3 times. The heavily stained wells are associated with more biofilm formation.
31
FIGURE 8. Two hundred (200) µl of 2-isopropanol was placed into each well for 1 h to lyse the biofilm cells and extract the crystal violet.

32
FIGURE 9. Microtiter plate wells were read using a spectrophotometer.
33
FIGURE 10. Effect of NaCl on S. mutans biofilm formation. Asterisks indicate significant differences (p<0.05) compared to samples without NaCl.
34
FIGURE 11. Effect of KCl on S. mutans biofilm formation. Asterisks indicate significant differences (p<0.05) compared to samples without KCl.
35
FIGURE 12. Effect of KI on S. mutans biofilm formation. Asterisks indicate significant differences (p<0.05) compared to samples without KI.

36
FIGURE 13. Combined effect of NaCl and nicotine on S. mutans total absorbance. Asterisks indicate significant differences (p<0.05) compared to samples without NaCl.
37
FIGURE 14. Combined effect of NaCl and nicotine on S. mutans planktonic growth. Asterisks indicate significant differences (p<0.05) compared to samples without NaCl.

38
FIGURE 15. Combined effect of NaCl and nicotine on S. mutans biofilm formation. Asterisks indicate significant differences (p<0.05) compared to samples without NaCl.
39
FIGURE 16. Combined effect of KCl and nicotine on S. mutans total absorbance. Asterisks indicate significant differences (p < 0.05) compared to samples without KCl.
40
FIGURE 17. Combined effect of KCl and nicotine on S. mutans planktonic growth. Asterisks indicate significant differences (p < 0.05) compared to samples without KCl.
41
FIGURE 18. Combined effect of KCl and nicotine on S. mutans biofilm formation. Asterisks indicate significant differences (p < 0.05) compared to samples without KCl.
42
FIGURE 19. Combined effect of Kl and nicotine on S. mutans total absorbance. Asterisks indicate significant differences (p < 0.05) compared to samples without Kl.

43
FIGURE 20. Combined effect of KI and nicotine on S. mutans planktonic growth. Asterisks indicate significant differences (p < 0.05) compared to samples without KI.
44
FIGURE 21. Combined effect of KI and nicotine on S. mutans biofilm formation. Asterisks indicate significant differences (p < 0.05) compared to samples without KI.
45
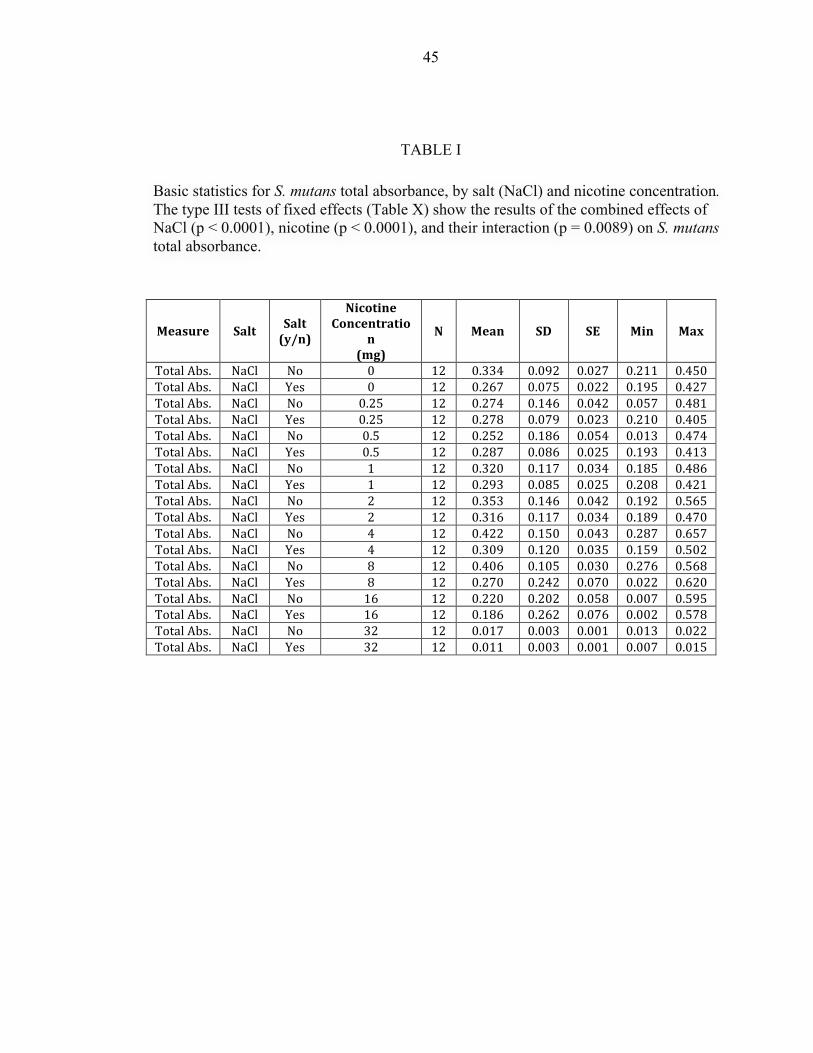
TABLE I
Measure Salt Salt (y/n)
Nicotine Concentratio
n (mg)
N Mean SD SE Min Max
Total Abs. NaCl No 0 12 0.334 0.092 0.027 0.211 0.450 Total Abs. NaCl Yes 0 12 0.267 0.075 0.022 0.195 0.427 Total Abs. NaCl No 0.25 12 0.274 0.146 0.042 0.057 0.481 Total Abs. NaCl Yes 0.25 12 0.278 0.079 0.023 0.210 0.405 Total Abs. NaCl No 0.5 12 0.252 0.186 0.054 0.013 0.474 Total Abs. NaCl Yes 0.5 12 0.287 0.086 0.025 0.193 0.413 Total Abs. NaCl No 1 12 0.320 0.117 0.034 0.185 0.486 Total Abs. NaCl Yes 1 12 0.293 0.085 0.025 0.208 0.421 Total Abs. NaCl No 2 12 0.353 0.146 0.042 0.192 0.565 Total Abs. NaCl Yes 2 12 0.316 0.117 0.034 0.189 0.470 Total Abs. NaCl No 4 12 0.422 0.150 0.043 0.287 0.657 Total Abs. NaCl Yes 4 12 0.309 0.120 0.035 0.159 0.502 Total Abs. NaCl No 8 12 0.406 0.105 0.030 0.276 0.568 Total Abs. NaCl Yes 8 12 0.270 0.242 0.070 0.022 0.620 Total Abs. NaCl No 16 12 0.220 0.202 0.058 0.007 0.595 Total Abs. NaCl Yes 16 12 0.186 0.262 0.076 0.002 0.578 Total Abs. NaCl No 32 12 0.017 0.003 0.001 0.013 0.022 Total Abs. NaCl Yes 32 12 0.011 0.003 0.001 0.007 0.015
Basic statistics for S. mutans total absorbance, by salt (NaCl) and nicotine concentration. The type III tests of fixed effects (Table X) show the results of the combined effects of NaCl (p < 0.0001), nicotine (p < 0.0001), and their interaction (p = 0.0089) on S. mutans total absorbance.
46
TABLE II
Basic statistics for S. mutans planktonic growth, by salt (NaCl) and nicotine concentration
Measure Salt Salt (y/n)
Nicotine Concentration
(mg) N Mean SD SE Min Max
Planktonic NaCl No 0 12 0.027 0.018 0.005 0.008 0.059 Planktonic NaCl Yes 0 12 0.065 0.046 0.013 0.025 0.169 Planktonic NaCl No 0.25 12 0.020 0.017 0.005 0.002 0.068 Planktonic NaCl Yes 0.25 12 0.064 0.050 0.014 0.016 0.166
Planktonic NaCl No 0.5 12 0.017 0.020 0.006 -‐0.010 0.058
Planktonic NaCl Yes 0.5 12 0.050 0.036 0.010 0.013 0.105 Planktonic NaCl No 1 12 0.024 0.019 0.005 0.003 0.072 Planktonic NaCl Yes 1 12 0.043 0.020 0.006 0.016 0.071
Planktonic NaCl No 2 12 0.029 0.022 0.006 -‐0.001 0.075
Planktonic NaCl Yes 2 12 0.054 0.030 0.009 0.016 0.106 Planktonic NaCl No 4 12 0.036 0.024 0.007 0.003 0.080 Planktonic NaCl Yes 4 12 0.043 0.020 0.006 0.011 0.077
Planktonic NaCl No 8 12 0.033 0.041 0.012 -‐0.001 0.124
Planktonic NaCl Yes 8 12 0.044 0.044 0.013 -‐0.010 0.119
Planktonic NaCl No 16 12 0.029 0.034 0.010 -‐0.012 0.091
Planktonic NaCl Yes 16 12 0.011 0.026 0.008 -‐0.011 0.081
Planktonic NaCl No 32 12 0.002 0.006 0.002 -‐0.008 0.010
Planktonic NaCl Yes 32 12 0.000 0.007 0.002 -‐0.010 0.008
47
TABLE III
Measure Salt Salt (y/n)
Nicotine Concentration
(mg) N Mean SD SE Min Max
Biofilm NaCl No 0 12 0.871 0.141 0.041 0.676 1.145 Biofilm NaCl Yes 0 12 0.352 0.061 0.017 0.257 0.436 Biofilm NaCl No 0.25 12 0.615 0.256 0.074 0.186 0.988 Biofilm NaCl Yes 0.25 12 0.343 0.108 0.031 0.193 0.507 Biofilm NaCl No 0.5 12 0.583 0.466 0.134 0.015 1.249 Biofilm NaCl Yes 0.5 12 0.372 0.099 0.029 0.203 0.503 Biofilm NaCl No 1 12 0.856 0.285 0.082 0.487 1.366 Biofilm NaCl Yes 1 12 0.414 0.104 0.030 0.315 0.647 Biofilm NaCl No 2 12 0.835 0.293 0.085 0.458 1.308 Biofilm NaCl Yes 2 12 0.332 0.153 0.044 0.105 0.536 Biofilm NaCl No 4 12 1.014 0.450 0.130 0.468 1.762 Biofilm NaCl Yes 4 12 0.300 0.204 0.059 0.002 0.598 Biofilm NaCl No 8 12 0.945 0.747 0.216 0.058 2.074 Biofilm NaCl Yes 8 12 0.141 0.186 0.054 -‐0.028 0.520 Biofilm NaCl No 16 12 0.301 0.412 0.119 0.006 1.089 Biofilm NaCl Yes 16 12 0.004 0.012 0.003 -‐0.023 0.025 Biofilm NaCl No 32 12 0.003 0.017 0.005 -‐0.018 0.028 Biofilm NaCl Yes 32 12 0.003 0.013 0.004 -‐0.017 0.017
Basic statistics for S. mutans biofilm growth, by salt (NaCl) and nicotine concentration
48
Measure Salt Salt (y/n)
Nicotine Concentration
(mg) N Mean SD SE Min Max
Total Abs. KCl No 0 12 0.331 0.106 0.030 0.195 0.482 Total Abs. KCl Yes 0 12 0.320 0.216 0.062 0.043 0.703 Total Abs. KCl No 0.25 12 0.284 0.121 0.035 0.187 0.474 Total Abs. KCl Yes 0.25 12 0.218 0.215 0.062 0.030 0.486 Total Abs. KCl No 0.5 12 0.300 0.127 0.037 0.190 0.495 Total Abs. KCl Yes 0.5 12 0.190 0.191 0.055 0.030 0.460 Total Abs. KCl No 1 12 0.301 0.133 0.038 0.157 0.511 Total Abs. KCl Yes 1 12 0.179 0.207 0.060 0.030 0.477 Total Abs. KCl No 2 12 0.346 0.154 0.044 0.186 0.568 Total Abs. KCl Yes 2 12 0.255 0.231 0.067 0.026 0.525 Total Abs. KCl No 4 12 0.421 0.163 0.047 0.256 0.661 Total Abs. KCl Yes 4 12 0.203 0.238 0.069 0.024 0.548 Total Abs. KCl No 8 12 0.388 0.125 0.036 0.273 0.584 Total Abs. KCl Yes 8 12 0.211 0.291 0.084 0.008 0.649 Total Abs. KCl No 16 12 0.260 0.240 0.069 0.001 0.603 Total Abs. KCl Yes 16 12 0.226 0.316 0.091 0.006 0.685 Total Abs. KCl No 32 12 0.017 0.003 0.001 0.011 0.021 Total Abs. KCl Yes 32 12 0.014 0.003 0.001 0.008 0.018
TABLE IV
Basic statistics for S. mutans total absorbance, by salt (KCl) and nicotine concentration

49
TABLE V
Measure Salt Salt (y/n)
Nicotine Concentration
(mg) N Mean SD SE Min Max
Planktonic KCl No 0 12 0.014 0.030 0.009 -‐0.025 0.081
Planktonic KCl Yes 0 12 0.048 0.064 0.019 -‐0.024 0.167
Planktonic KCl No 0.25 12 0.013 0.031 0.009 -‐0.031 0.057
Planktonic KCl Yes 0.25 12 0.013 0.033 0.010 -‐0.030 0.051
Planktonic KCl No 0.5 12 0.012 0.031 0.009 -‐0.034 0.052
Planktonic KCl Yes 0.5 12 0.005 0.033 0.010 -‐0.037 0.058
Planktonic KCl No 1 12 0.010 0.026 0.008 -‐0.027 0.056
Planktonic KCl Yes 1 12 0.008 0.029 0.008 -‐0.032 0.045
Planktonic KCl No 2 12 0.021 0.040 0.011 -‐0.034 0.089
Planktonic KCl Yes 2 12 0.016 0.034 0.010 -‐0.032 0.060
Planktonic KCl No 4 12 0.071 0.147 0.042 -‐0.025 0.504
Planktonic KCl Yes 4 12 0.014 0.033 0.010 -‐0.028 0.081
Planktonic KCl No 8 12 0.081 0.169 0.049 -‐0.017 0.595
Planktonic KCl Yes 8 12 0.011 0.045 0.013 -‐0.039 0.080
Planktonic KCl No 16 12 0.032 0.062 0.018 -‐0.035 0.139
Planktonic KCl Yes 16 12 0.034 0.093 0.027 -‐0.038 0.275
Planktonic KCl No 32 12 -‐0.006 0.019 0.005 -‐
0.032 0.011
Planktonic KCl Yes 32 12 -‐0.008 0.020 0.006 -‐
0.037 0.008
Basic statistics for S. mutans planktonic growth, by salt (KCl) and nicotine concentration

50
TABLE VI
Measure Salt Salt (y/n)
Nicotine Concentration
(mg) N Mean SD SE Min Max
Biofilm KCl No 0 12 0.732 0.116 0.033 0.599 0.995 Biofilm KCl Yes 0 12 0.220 0.123 0.035 0.098 0.454 Biofilm KCl No 0.25 12 0.676 0.133 0.038 0.545 0.938 Biofilm KCl Yes 0.25 12 0.163 0.117 0.034 0.052 0.399 Biofilm KCl No 0.5 12 0.714 0.132 0.038 0.557 0.973 Biofilm KCl Yes 0.5 12 0.132 0.061 0.018 0.045 0.275 Biofilm KCl No 1 12 0.693 0.143 0.041 0.561 0.999 Biofilm KCl Yes 1 12 0.140 0.162 0.047 0.051 0.638 Biofilm KCl No 2 12 0.772 0.142 0.041 0.562 1.080 Biofilm KCl Yes 2 12 0.119 0.084 0.024 0.048 0.311 Biofilm KCl No 4 12 0.919 0.378 0.109 0.377 1.795 Biofilm KCl Yes 4 12 0.067 0.045 0.013 0.026 0.161 Biofilm KCl No 8 12 0.788 0.404 0.117 0.150 1.365 Biofilm KCl Yes 8 12 0.020 0.023 0.007 0.005 0.081 Biofilm KCl No 16 12 0.356 0.482 0.139 -‐0.005 1.260 Biofilm KCl Yes 16 12 0.019 0.044 0.013 -‐0.009 0.154 Biofilm KCl No 32 12 0.005 0.012 0.004 -‐0.018 0.026 Biofilm KCl Yes 32 12 0.008 0.014 0.004 -‐0.006 0.040
Basic statistics for S. mutans biofilm growth, by salt (KCl) and nicotine concentration
51
TABLE VII
Measure Salt Salt (y/n)
Nicotine Concentration
(mg) N Mean SD SE Min Max
Total Abs. KI No 0 12 0.335 0.112 0.032 0.208 0.514 Total Abs. KI Yes 0 12 0.232 0.127 0.037 0.133 0.442 Total Abs. KI No 0.25 12 0.330 0.103 0.030 0.215 0.471 Total Abs. KI Yes 0.25 12 0.255 0.160 0.046 0.124 0.502 Total Abs. KI No 0.5 12 0.338 0.120 0.035 0.182 0.517 Total Abs. KI Yes 0.5 12 0.248 0.167 0.048 0.099 0.489 Total Abs. KI No 1 12 0.352 0.123 0.035 0.213 0.537 Total Abs. KI Yes 1 12 0.253 0.180 0.052 0.099 0.502 Total Abs. KI No 2 12 0.396 0.155 0.045 0.231 0.601 Total Abs. KI Yes 2 12 0.268 0.217 0.063 0.095 0.587 Total Abs. KI No 4 12 0.457 0.134 0.039 0.277 0.648 Total Abs. KI Yes 4 12 0.230 0.228 0.066 0.045 0.582 Total Abs. KI No 8 12 0.432 0.122 0.035 0.306 0.616 Total Abs. KI Yes 8 12 0.184 0.233 0.067 0.016 0.686 Total Abs. KI No 16 12 0.210 0.247 0.071 0.007 0.616 Total Abs. KI Yes 16 12 0.013 0.004 0.001 0.004 0.018 Total Abs. KI No 32 12 0.019 0.003 0.001 0.015 0.024 Total Abs. KI Yes 32 12 0.018 0.004 0.001 0.011 0.023
Basic statistics for S. mutans total absorbance, by salt (KI) and nicotine concentration
52
TABLE VIII
Measure Salt Salt (y/n)
Nicotine Concentration
(mg) N Mean SD SE Min Max
Planktonic KI No 0 8 0.039 0.019 0.007 0.020 0.079 Planktonic KI Yes 0 8 0.038 0.009 0.003 0.025 0.048 Planktonic KI No 0.25 8 0.026 0.019 0.007 0.012 0.071 Planktonic KI Yes 0.25 8 0.216 0.330 0.117 0.017 0.844 Planktonic KI No 0.5 8 0.020 0.015 0.005 0.004 0.053 Planktonic KI Yes 0.5 8 0.038 0.022 0.008 0.013 0.063 Planktonic KI No 1 8 0.028 0.020 0.007 0.016 0.076 Planktonic KI Yes 1 8 0.052 0.037 0.013 0.012 0.104 Planktonic KI No 2 8 0.022 0.021 0.007 0.008 0.072 Planktonic KI Yes 2 8 0.061 0.050 0.018 0.018 0.171 Planktonic KI No 4 8 0.063 0.064 0.022 0.009 0.201 Planktonic KI Yes 4 8 0.044 0.032 0.011 0.012 0.094 Planktonic KI No 8 8 0.046 0.050 0.018 0.002 0.155 Planktonic KI Yes 8 8 0.101 0.127 0.045 0.010 0.353 Planktonic KI No 16 8 0.021 0.026 0.009 0.007 0.085 Planktonic KI Yes 16 8 0.005 0.004 0.002 -‐0.002 0.009 Planktonic KI No 32 8 0.005 0.003 0.001 0.000 0.012 Planktonic KI Yes 32 8 0.007 0.002 0.001 0.003 0.010
Basic statistics for S. mutans planktonic growth, by salt (KI) and nicotine concentration
53
TABLE IX
Measure Salt Salt (y/n)
Nicotine Concentration
(mg) N Mean SD SE Min Max
Biofilm KI No 0 12 0.837 0.156 0.045 0.624 1.195 Biofilm KI Yes 0 12 0.286 0.059 0.017 0.167 0.413 Biofilm KI No 0.25 12 0.791 0.139 0.040 0.623 0.995 Biofilm KI Yes 0.25 12 0.293 0.079 0.023 0.208 0.473 Biofilm KI No 0.5 12 0.829 0.124 0.036 0.662 0.995 Biofilm KI Yes 0.5 12 0.260 0.062 0.018 0.142 0.371 Biofilm KI No 1 12 0.859 0.127 0.037 0.675 1.068 Biofilm KI Yes 1 12 0.308 0.058 0.017 0.220 0.384 Biofilm KI No 2 12 1.022 0.284 0.082 0.560 1.615 Biofilm KI Yes 2 12 0.412 0.215 0.062 0.192 0.837 Biofilm KI No 4 12 1.118 0.401 0.116 0.525 1.641 Biofilm KI Yes 4 12 0.227 0.088 0.025 0.103 0.383 Biofilm KI No 8 12 0.944 0.622 0.180 0.117 1.836 Biofilm KI Yes 8 12 0.113 0.076 0.022 0.014 0.209 Biofilm KI No 16 12 0.225 0.196 0.056 0.004 0.618 Biofilm KI Yes 16 12 0.002 0.013 0.004 -‐0.023 0.014 Biofilm KI No 32 12 0.010 0.020 0.006 -‐0.021 0.053 Biofilm KI Yes 32 12 0.004 0.012 0.003 -‐0.011 0.019
Basic statistics for S. mutans biofilm growth, by salt (KI) and nicotine concentration
54
TABLE X
Measure Salt Effect Rank p-‐value
Biofilm KCl Concentration <0.0001 Biofilm KCl Salt_yn <0.0001 Biofilm KCl Concentration*Salt_yn <0.0001 Biofilm KI Concentration <0.0001 Biofilm KI Salt_yn <0.0001 Biofilm KI Concentration*Salt_yn <0.0001 Biofilm NaCl Concentration <0.0001 Biofilm NaCl Salt_yn <0.0001 Biofilm NaCl Concentration*Salt_yn <0.0001
Planktonic KCl Concentration 0.0669 Planktonic KCl Salt_yn 0.3226 Planktonic KCl Concentration*Salt_yn 0.7760 Planktonic KI Concentration <0.0001 Planktonic KI Salt_yn 0.0015 Planktonic KI Concentration*Salt_yn <0.0001 Planktonic NaCl Concentration <0.0001 Planktonic NaCl Salt_yn <0.0001 Planktonic NaCl Concentration*Salt_yn <0.0001
Total Absorbance KCl Concentration <0.0001 Total Absorbance KCl Salt_yn <0.0001 Total Absorbance KCl Concentration*Salt_yn 0.0123 Total Absorbance KI Concentration <0.0001 Total Absorbance KI Salt_yn <0.0001 Total Absorbance KI Concentration*Salt_yn 0.0142 Total Absorbance NaCl Concentration <0.0001 Total Absorbance NaCl Salt_yn <0.0001 Total Absorbance NaCl Concentration*Salt_yn 0.0089
A two-way ANOVA test comparing the effects of salt presence (either NaCl, KCl, or KI), nicotine (concentrations ranging from 0 – 32 mg), and their interaction on S. mutans biofilm, planktonic cells, and total absorbance

55
DISCUSSION
56
The preliminary experiment was designed for two main reasons: 1) to confirm the
antimicrobial activities of the three salts and 2) to determine the MIC of each salt. Even
though the antimicrobial activity of these salts was discussed in many previous studies,
there was a lack of evidence regarding the direct effect of these salts on S. mutans biofilm
growth. In addition, S. mutans is considered one of the normal flora species in the oral
cavity. So, it is biologically relevant to obtain the MIC to not negatively affect the normal
ecology of the oral flora. An overnight culture of S. mutans was placed in 96-well
microtiter plates with TSBS to stimulate S. mutans growth and biofilm formation.
Nicotine was added to both study and control groups to increase biofilm formation as this
was confirmed in previous studies.90-93 The results of this study indicate that NaCl, KCl
and KI are able to significantly diminish the biofilm formation of S. mutans. In addition,
these three salts are able to significantly limit the ability of nicotine to increase the
growth of S. mutans, especially biofilm formation. Each salt was investigated in different
microtiter plates. Each plate contained the study group involving the salt/nicotine
combination and a control group of nicotine without the salt, as it was better to include
both study and control groups in one microtiter plate in order to standardize the
environment and preparation conditions. A sterility group was added to assure
contamination was not present, because if there was contamination, the sterility wells will
exhibit some kind of bacterial growth. A two-way ANOVA was used to compare the
effects of salt presence (either NaCl, KCl, or KI) and nicotine (concentrations ranging
from 0 – 32 mg) on S. mutans biofilm, planktonic cells, and total absorbance. Since the
57
experimental trial was repeated 3 times (with 4 samples per group per repeat), a random
effect for the multiple trials was used. Due to non-normality, a rank transformation was
used prior to analysis.
The most important phase of bacterial growth between total absorbance,
planktonic and biofilm is the biofilm form as it is the most favorable one for oral bacteria
to grow in vivo and cause disease. 124 Also, protein expression in biofilm cells differs
from the expression that is observed in planktonic cells.130 So, even though the salts
demonstrated minor restriction of nicotine activity when total absorbance and planktonic
growth are observed, this restriction was recognized clearly when biofilm formation is
observed, with the exception of the 32 mg/ml nicotine concentration. In the nicotine
group (with no salt), 0.25-8 mg/ml of nicotine increased biofilm formation. The MIC and
MBC concentrations were found with 16 and 32 mg/ml of nicotine, respectively, and this
was found also in a study by Huang et al. who investigated the effect of nicotine on seven
species of S. mutans including the UA 159 strain.90 This is because nicotine becomes
toxic to S. mutans above 8 mg/ml of nicotine. The toxicity of nicotine to S. mutans UA
159 with > 8 mg/ml of nicotine was described in the Huang et al. study.90 It is understood
that any salt with 16 or 32 mg of nicotine demonstrated more inhibition than nicotine
alone and this probably is because of the combined antimicrobial effect of the salt and
nicotine. But at a 8 mg/ml nicotine concentration, it was observed that with no salt, there
was more biofilm formation than concentrations < 8 mg/ml nicotine. However, when any
salt was added, there was less biofilm formation with 8 mg of nicotine than with
concentrations < 8 mg/ml nicotine. A reasonable explanation is that a synergistic effect
58
was developed between each salt and nicotine at this specific concentration of nicotine, 8
mg/ml.
The clinical implication of these results can be related to the amount of nicotine in
human saliva of smokers. Feyerabend et al. found that the nicotine level in human saliva
ranges from 0-0.31 mg/ml for those people who are not smokers but are affected by
secondary or tertiary hand smoke. For light or medium smokers, the range of nicotine in
human saliva is between 0-1.33 mg/ml and for heavy smokers is 0-2.27 mg/ml.88 In
another study, it was found that the level of nicotine in human saliva ranges from 0.07-
1.56 mg/ml for those people who have smoked for at least ten years.87 For smokers, if we
suppose that the average nicotine level in human saliva is 1 mg/ml, it could be said that
the presence of 0.45 M of NaCl, 0.23 M of KCl and 0.113 M of KI significantly inhibited
first hand nicotine-induced S. mutans biofilm formation by 52 percent, 79.7 percent and
64.1 percent, respectively.
However, the last statement could be refuted because of the fact that the previous
mentioned nicotine levels was found in the saliva, and what is needed specifically is to
determine the level of nicotine in the biofilm itself. Further research may discuss how
NaCl, KCl and KI specifically inhibit S. mutans biofilm formation, and what affect these
salts may have on extracellular polysaccharide synthesis, glucosyltransferase synthesis,
glucan-binding protein synthesis and acid production. Nicotine was found to increase
extracellular polysaccharide (EPS) synthesis, GbpA expression, Gtfs expression, and
lactic acid production.92 So, NaCl, KCl, and KI may interfere with EPS synthesis, GbpA,
Gtfs expression or lactic acid production. In addition, in-vivo studies are needed to
confirm the anti-microbial effect of these salts and its biocompatibility with oral tissues.
59
SUMMARY AND CONCLUSION

60
This study indicates that the growth of nicotine-induced S. mutans could be
diminished in the presence of NaCl, KCl and KI salts. NaCl, KCl and KI demonstrated an
inhibitory effect on the growth of S. mutans, this could be beneficial clinically by asking
smokers to rinse with these salts to diminish the cariogenicity of first hand nicotine-
induced S. mutans biofilm formation. In-vivo studies are needed to confirm this benefit.

61
REFERENCES
62
1. WHO, http://www.who.int/mediacentre/factsheets/fs318/en/ , 2012 April, (Facts Sheet). 2. NCHS Data Brief No. 197, http://www.cdc.gov/nchs/data/databriefs/db197.htm . May 2015. 3. NCHS Data Brief No. 191, http://www.cdc.gov/nchs/products/databriefs/db191.htm . March 2015. 4. Dye BA, Xianfen L, Beltrán-Aguilar ED. Selected Oral Health Indicators in the United States 2005–2008. NCHS Data Brief, no. 96. Hyattsville, MD: National Center for Health Statistics, Centers for Disease Control and Prevention; 2012. 5. Fejerskov O. Changing paradigms in concepts on dental caries: consequences for oral health care. Caries Res 2004;38(3):182-91. 6. Mandel ID. The role of saliva in maintaining oral homeostasis. J Am Dent Assoc 1989;119(2):298-304. 7. Marsh PD. Microbial ecology of dental plaque and its significance in health and disease. Adv Dent Res 1994;8(2):263-71. 8. Featherstone JD. Prevention and reversal of dental caries: role of low level fluoride. Community Dent Oral Epidemiol 1999;27(1):31-40. 9. Saldunaite K, Bendoraitiene EA, Slabsinskiene E, Vasiliauskiene I, Andruskeviciene V, Zubiene J. The role of parental education and socioeconomic status in dental caries prevention among Lithuanian children. Medicina (Kaunas) 2014;50(3):156-61. 10. Featherstone JD. Dental caries: a dynamic disease process. Aust Dent J 2008;53(3):286-91. 11. ten Cate JM, Featherstone JD. Mechanistic aspects of the interactions between fluoride and dental enamel. Crit Rev Oral Biol Med 1991;2(3):283-96. 12. Rosenstiel SF. Clinical diagnosis of dental caries: a North American perspective. J Dent Educ 2001;65(10):979-84. 13. Nyvad B, Machiulskiene V, Baelum V. Reliability of a new caries diagnostic system differentiating between active and inactive caries lesions. Caries Res 1999;33(4):252-60. 14. Ismail AI, Brodeur JM, Gagnon P, Payette M, Picard D, Hamalian T, et al. Prevalence of non-cavitated and cavitated carious lesions in a random sample of 7-9-
63
year-old schoolchildren in Montreal, Quebec. Community Dent Oral Epidemiol 1992;20(5):250-5. 15. Pitts NB, Fyffe HE. The effect of varying diagnostic thresholds upon clinical caries data for a low prevalence group. J Dent Res 1988;67(3):592-6. 16. Featherstone JD. The science and practice of caries prevention. J Am Dent Assoc 2000;131(7):887-99. 17. Hargreaves JA, Thompson GW, Wagg BJ. Changes in caries prevalence of Isle of Lewis children between 1971 and 1981. Caries Res 1983;17(6):554-9. 18. Stookey GK. Critical evaluation of the composition and use of topical fluorides. J Dent Res 1990;69 Spec No:805-12; discussion 20-3. 19. Marinho VC, Higgins JP, Sheiham A, Logan S. Fluoride toothpastes for preventing dental caries in children and adolescents. Cochrane Database Syst Rev 2003(1):CD002278. 20. Marinho VC, Higgins JP, Logan S, Sheiham A. Fluoride mouthrinses for preventing dental caries in children and adolescents. Cochrane Database Syst Rev 2003(3):CD002284. 21. Twetman S, Petersson L, Axelsson S, Dahlgren H, Holm AK, Kallestal C, et al. Caries-preventive effect of sodium fluoride mouthrinses: a systematic review of controlled clinical trials. Acta Odontol Scand 2004;62(4):223-30. 22. Reynolds EC. The prevention of sub-surface demineralization of bovine enamel and change in plaque composition by casein in an intra-oral model. J Dent Res 1987;66(6):1120-7. 23. Reynolds EC, Cai F, Shen P, Walker GD. Retention in plaque and remineralization of enamel lesions by various forms of calcium in a mouthrinse or sugar-free chewing gum. J Dent Res 2003;82(3):206-11. 24. Shen P, Cai F, Nowicki A, Vincent J, Reynolds EC. Remineralization of enamel subsurface lesions by sugar-free chewing gum containing casein phosphopeptide-amorphous calcium phosphate. J Dent Res 2001;80(12):2066-70. 25. Geiger S, Matalon S, Blasbalg J, Tung M, Eichmiller FC. The clinical effect of amorphous calcium phosphate (ACP) on root surface hypersensitivity. Oper Dent 2003;28(5):496-500. 26. Zero DT. Dentifrices, mouthwashes, and remineralization/caries arrestment strategies. BMC Oral Health 2006;6 Suppl 1:S9.
64
27. Chu CH, Lo EC, Lin HC. Effectiveness of silver diamine fluoride and sodium fluoride varnish in arresting dentin caries in Chinese pre-school children. J Dent Res 2002;81(11):767-70. 28. Mac Faddin JF. Media for isolation-cultivation-identification-maintenance of medical bacteria: Williams & Wilkins; 1985. 29. Bidlas E, Lambert RJ. Comparing the antimicrobial effectiveness of NaCl and KCl with a view to salt/sodium replacement. Int J Food Microbiol 2008;124(1):98-102. 30. Costa RO, Macedo PM, Carvalhal A, Bernardes-Engemann AR. Use of potassium iodide in dermatology: updates on an old drug. An Bras Dermatol 2013;88(3):396-402. 31. Li YH, Tian X. Quorum sensing and bacterial social interactions in biofilms. Sensors (Basel) 2012;12(3):2519-38. 32. Huang R, Li M, Gregory RL. Bacterial interactions in dental biofilm. Virulence 2011;2(5):435-44. 33. Featherstone JD. The caries balance: contributing factors and early detection. J Calif Dent Assoc 2003;31(2):129-33. 34. Marthaler TM. Epidemiological and clinical dental findings in relation to intake of carbohydrates. Caries Res 1967;1(3):222-38. 35. Gustafsson BE, Quensel CE, Lanke LS et al. The Vipeholm dental caries study; the effect of different levels of carbohydrate intake on caries activity in 436 individuals observed for five years. Acta Odontol Scand 1954;11(3-4):232-64. 36. Shaw JH. The role of sugar in the aetiology of dental caries.(Pt 6). Evidence from experimental animal research. J Dent 1983;11(3):209-13. 37. Moynihan P, Petersen PE. Diet, nutrition and the prevention of dental diseases. Public Health Nutr 2004;7(1A):201-26. 38. Scheinin A, Makinen KK. Turku sugar studies. An overview. Acta Odontol Scand 1976;34(6):405-8. 39. Grenby TH, Bull JM. Changes in the dental plaque after eating sweets containing starch hydrolysates instead of sucrose. Proc Nutr Soc 1973;32(1):39A-40A. 40. Grenby TH, Paterson FM, Cawson RA. Dental caries and plaque formation from diets containing sucrose or glucose in gnotobiotic rats infected with Streptococcus strain IB-1600. Br J Nutr 1973;29(2):221-8.
65
41. Takahashi N, Nyvad B. Caries ecology revisited: microbial dynamics and the caries process. Caries Res 2008;42(6):409-18. 42. Zero DT. Sugars - the arch criminal? Caries Res 2004;38(3):277-85. 43. United States Department of Agriculture, Center for Nutrition, Policy and Promotion. HTTP//:http://WWW.USDA.GOV/CNPP/, 1999. 44. Peterson SN, Snesrud E, Liu J, Ong AC, Kilian M, Schork NJ, et al. The dental plaque microbiome in health and disease. PLoS One 2013;8(3):e58487. 45. Nishimura M, Chen HJ, Docor R. The relationship between a caries activity test (Cariostat) and plate colony counts of mutans streptococci in human dental plaque. Int J Japan Soc Pediatric Dent 1994;4(1):23-7. 46. Moynihan P, Petersen PE. Diet, nutrition and the prevention of dental diseases. Public Health Nutr 2004;7((A1)):201-26. 47. Bowen WH, Koo H. Biology of Streptococcus mutans-derived glucosyltransferases: role in extracellular matrix formation of cariogenic biofilms. Caries Res 2011;45(1):69-86. 48. Krzysciak W, Jurczak A, Koscielniak D, Bystrowska B, Skalniak A. The virulence of Streptococcus mutans and the ability to form biofilms. Eur J Clin Microbiol Infect Dis 2014;33(4):499-515. 49. Duque C, Stipp RN, Wang B, Smith DJ, Hofling JF, Kuramitsu HK, et al. Downregulation of GbpB, a component of the VicRK regulon, affects biofilm formation and cell surface characteristics of Streptococcus mutans. Infect Immun 2011;79(2):786-96. 50. Wen ZT, Yates D, Ahn SJ, Burne RA. Biofilm formation and virulence expression by Streptococcus mutans are altered when grown in dual-species model. BMC Microbiol 2010;10:111. 51. Brady LJ, Maddocks SE, Larson MR, Forsgren N, Persson K, Deivanayagam CC, et al. The changing faces of Streptococcus antigen I/II polypeptide family adhesins. Mol Microbiol 2010;77(2):276-86. 52. Ahn SJ, Burne RA. Effects of oxygen on biofilm formation and the AtlA autolysin of Streptococcus mutans. J Bacteriol 2007;189(17):6293-302. 53. Ahn SJ, Ahn SJ, Wen ZT, Brady LJ, Burne RA. Characteristics of biofilm formation by Streptococcus mutans in the presence of saliva. Infect Immun 2008;76(9):4259-68.
66
54. Aires CP, Del Bel Cury AA, Tenuta LM, Klein MI, Koo H, Duarte S, et al. Effect of starch and sucrose on dental biofilm formation and on root dentine demineralization. Caries Res 2008;42(5):380-6. 55. Zijnge V, van Leeuwen MB, Degener JE, Abbas F, Thurnheer T, Gmur R, et al. Oral biofilm architecture on natural teeth. PLoS One 2010;5(2):e9321. 56. Humphrey SP, Williamson RT. A review of saliva: normal composition, flow, and function. J Prosthet Dent 2001;85(2):162-9. 57. Slomiany BL, Murty VL, Piotrowski J, Slomiany A. Salivary mucins in oral mucosal defense. Gen Pharmacol 1996;27(5):761-71. 58. Tabak LA. Structure and function of human salivary mucins. Crit Rev Oral Biol Med 1990;1(4):229-34. 59. Mandel ID. Impact of saliva on dental caries. Compend Suppl 1989(13):S476-81. 60. Dowd FJ. Saliva and dental caries. Dent Clin North Am 1999;43(4):579-97. 61. Richardson CF, Johnsson M, Raj PA, Levine MJ, Nancollas GH. The influence of histatin-5 fragments on the mineralization of hydroxyapatite. Arch Oral Biol 1993;38(11):997-1002. 62. Lassiter MO, Newsome AL, Sams LD, Arnold RR. Characterization of lactoferrin interaction with Streptococcus mutans. J Dent Res 1987;66(2):480-5. 63. McNabb PC, Tomasi TB. Host defense mechanisms at mucosal surfaces. Annu Rev Microbiol 1981;35:477-96. 64. Pollock JJ, Lotardo S, Gavai R, Grossbard BL. Lysozyme-protease-inorganic monovalent anion lysis of oral bacterial strains in buffers and stimulated whole saliva. J Dent Res. 1987;66(2):467-74. 65. Bibby BG, Mundorff SA, Zero DT, Almekinder KJ. Oral food clearance and the pH of plaque and saliva. J Am Dent Assoc 1986;112(3):333-7. 66. Edgar WM. The role of saliva in the control of pH changes in human dental plaque. Caries Res 1976;10(4):241-54. 67. WHO. Prevalence of tobacco use.http://www.who.int/gho/tobacco/use/en/. 68. WHO. Tobacco. July 2015:http://www.who.int/mediacentre/factsheets/fs339/en/.
67
69. CDC, Smoking and Tobacco use Fast Facts. http://www.cdc.gov/tobacco/data_statistics/fact_sheets/fast_facts/index.htm - use. Accessed Sept 2014. 70. Surgeon General. Treating Tobacco Use and Dependence:2008 Update-Clinical Practice Guidelines. US Department of Health and Human Services; 2008. 71. Bjartveit K, Tverdal A. Health consequences of smoking 1-4 cigarettes per day. Tob Control 2005;14(5):315-20. 72. Pope CA, 3rd, Burnett RT, Krewski D, et al. Cardiovascular mortality and exposure to airborne fine particulate matter and cigarette smoke: shape of the exposure-response relationship. Circulation 2009;120(11):941-8. 73. Prescott E, Scharling H, Osler M, Schnohr P. Importance of light smoking and inhalation habits on risk of myocardial infarction and all cause mortality. A 22 year follow up of 12 149 men and women in The Copenhagen City Heart Study. J Epidemiol Community Health 2002;56(9):702-6. 74. Surgeon General. The Health Consequences of Smoking. Rockville: US Department of Health and Human Services; 2004. 75. Rosengren A, Wilhelmsen L, Wedel H. Coronary heart disease, cancer and mortality in male middle-aged light smokers. J Intern Med 1992;231(4):357-62. 76. Schane RE, Ling PM, Glantz SA. Health effects of light and intermittent smoking: a review. Circulation 2010;121(13):1518-22. 77. Aligne CA, Moss ME, Auinger P, Weitzman M. Association of pediatric dental caries with passive smoking. JAMA 2003;289(10):1258-64. 78. Felton DA. Edentulism and comorbid factors. Tex Dent J. 2010;127(4):389-401. 79. Hanioka T, Ojima M, Tanaka K, Matsuo K, Sato F, Tanaka H. Causal assessment of smoking and tooth loss: a systematic review of observational studies. BMC Public Health 2011;11:221. 80. Blot WJ, McLaughlin JK, Winn DM, Austin DF, Greenberg RS, Preston-Martin S, et al. Smoking and drinking in relation to oral and pharyngeal cancer. Cancer Res 1988;48(11):3282-7. 81. IARC Working Group on the Evaluation of Carcinogenic Risks to Humans: Tobacco smoke and involuntary smoking, Vol 83. Lyon, France, IARC Press, 2004. 82. Bergstrom J. Periodontitis and smoking: an evidence-based appraisal. J Evid Based Dent Pract 2006;6(1):33-41.
68
83. Atieh MA, Alsabeeha NH, Faggion CM, Jr., Duncan WJ. The frequency of peri-implant diseases: a systematic review and meta-analysis. J Periodontol. 2013;84(11):1586-98. 84. Aguilar-Zinser V, Irigoyen ME, Rivera G, Maupome G, Sanchez-Perez L, Velazquez C. Cigarette smoking and dental caries among professional truck drivers in Mexico. Caries Res 2008;42(4):255-62. 85. Avsar A, Darka O, Topaloglu B, Bek Y. Association of passive smoking with caries and related salivary biomarkers in young children. Arch Oral Biol 2008;53(10):969-74. 86. Campus G, Cagetti MG, Senna A, Blasi G, Mascolo A, Demarchi P, et al. Does smoking increase risk for caries? a cross-sectional study in an Italian military academy. Caries Res 2011;45(1):40-6. 87. Hoffmann D, Adams JD. Carcinogenic tobacco-specific N-nitrosamines in snuff and in the saliva of snuff dippers. Cancer Res 1981;41(11 Pt 1):4305-8. 88. Feyerabend C, Higenbottam T, Russell MA. Nicotine concentrations in urine and saliva of smokers and non-smokers. Br Med J (Clin Res Ed) 1982;284(6321):1002-4. 89. Dhar P. Measuring tobacco smoke exposure: quantifying nicotine/cotinine concentration in biological samples by colorimetry, chromatography and immunoassay methods. J Pharm Biomed Anal 2004;35(1):155-68. 90. Huang R, Li M, Gregory RL. Effect of nicotine on growth and metabolism of Streptococcus mutans. Eur J Oral Sci 2012;120(4):319-25. 91. Li M, Huang R, Zhou X, Zhang K, Zheng X, Gregory RL. Effect of nicotine on dual-species biofilms of Streptococcus mutans and Streptococcus sanguinis. FEMS Microbiol Lett 2014;350(2):125-32. 92. Huang R, Li M, Gregory RL. Nicotine promotes Streptococcus mutans extracellular polysaccharide synthesis, cell aggregation and overall lactate dehydrogenase activity. Arch Oral Biol 2015;60(8):1083-90. 93. Li M, Huang R, Zhou X, Qiu W, Xu X, Gregory RL. Effect of nicotine on cariogenic virulence of Streptococcus mutans. Folia Microbiol (Praha) 2016;61(6):505-12. 94. Tanaka K, Miyake Y, Nagata C, Furukawa S, Arakawa M. Association of prenatal exposure to maternal smoking and postnatal exposure to household smoking with dental caries in 3-year-old Japanese children. Environ Res 2015;143(Pt A):148-53.
69
95. Awad S, Allison SP, Lobo DN. The history of 0.9% saline. Clin Nutr 2008;27(2):179-88. 96. Intravenous fluid resuscitation. The Merck Manual. July 2012. http://www.merckmanuals.com/professional/critical-care-medicine/shock-and-fluid-resuscitation/intravenous-fluid-resuscitation. 97. Schreiber S, Ronfani L, Ghirardo S, Minen F, Taddio A, Jaber M, et al. Nasal irrigation with saline solution significantly improves oxygen saturation in infants with bronchiolitis. Acta Paediatr 2016;105(3):292-6. 98. Khanna S, Davis D, Peterson B, Fisher B, Tung H, O'Quigley J, et al. Use of hypertonic saline in the treatment of severe refractory posttraumatic intracranial hypertension in pediatric traumatic brain injury. Crit Care Med 2000;28(4):1144-51. 99. Hirasawa M, Takada K. Susceptibility of Streptococcus mutans and Streptococcus sobrinus to cell wall inhibitors and development of a novel selective medium for S. sobrinus. Caries Res 2002;36(3):155-60. 100. Takada K, Fukushima K. Effects of certain salts on glucosyltransferase synthesis by Streptococcus mutans strain PS-14. J Dent Res 1986;65(3):452-5. 101. Twetman S, Linder L, Modeer T. Influence of bacterial cell concentration and inorganic anions on lysis of Streptococcus mutans BHT by salivary lysozyme. Scand J Dent Res 1984;92(6):533-8. 102. Pollock JJ, Goodman H, Elsey PK, Iacono VJ. Synergism of lysozyme, proteases and inorganic monovalent anions in the bacteriolysis of oral Streptococcus mutans GS5. Arch Oral Biol 1983;28(9):865-71. 103. Yokogawa K, Kawata S, Yoshimura Y. Bacteriolytic activity of enzymes derived from Streptomyces species. Agr. biol. Chem 1972, 36, 2055-2065. 104. Hamada S, Torii M, Kotani S, Masuda N, Ooshima T, Yokogawa K, et al. Lysis of Streptococcus mutans cells with mutanolysin, a lytic enzyme prepared from a culture liquor of Streptomyces globisporus 1829. Arch Oral Biol 1978;23(7):543-9. 105. Crawford DR, Davies KJ. Adaptive response and oxidative stress. Environ Health Perspect 1994;102 Suppl 10:25-8. 106. Hamilton IR, Buckley ND. Adaptation by Streptococcus mutans to acid tolerance. Oral Microbiol Immunol 1991;6(2):65-71. 107. Deng DM, ten Cate JM, Crielaard W. The adaptive response of Streptococcus mutans towards oral care products: involvement of the ClpP serine protease. Eur J Oral Sci 2007;115(5):363-70.
70
108. Marsh PD, Williamson MI, Keevil CW, McDermid AS, Ellwood DC. Influence of sodium and potassium ions on acid production by washed cells of Streptococcus mutans ingbritt and Streptococcus sanguis NCTC 7865 grown in a chemostat. Infect Immun 1982;36(2):476-83. 109. Brudevold F, Tehrani A, Attarzadeh F, Goulet D, van Houte J. Effect of some salts of calcium, sodium, potassium, and strontium on intra-oral enamel demineralization. J Dent Res 1985;64(1):24-7. 110. Ligtenberg AJ, Veerman EC, Nieuw Amerongen AV. A role for Lewis a antigens on salivary agglutinin in binding to Streptococcus mutans. Antonie Van Leeuwenhoek 2000;77(1):21-30. 111. Munukka E, Lepparanta O, Korkeamaki M, Vaahtio M, Peltola T, Zhang D, et al. Bactericidal effects of bioactive glasses on clinically important aerobic bacteria. J Mater Sci Mater Med 2008;19(1):27-32. 112. Pereira CA, Costa AC, Carreira CM, Junqueira JC, Jorge AO. Photodynamic inactivation of Streptococcus mutans and Streptococcus sanguinis biofilms in vitro. Lasers Med Sci 2013;28(3):859-64. 113. Pereira CA, Romeiro RL, Costa AC, Machado AK, Junqueira JC, Jorge AO. Susceptibility of Candida albicans, Staphylococcus aureus, and Streptococcus mutans biofilms to photodynamic inactivation: an in vitro study. Lasers Med Sci 2011;26(3):341-8. 114. Belli WA, Marquis RE. Adaptation of Streptococcus mutans and Enterococcus hirae to acid stress in continuous culture. Appl Environ Microbiol 1991;57(4):1134-8. 115. Eisenberg AD, Marquis RE. Enhanced transmembrane proton conductance in Streptococcus mutans GS-5 due to ionophores and fluoride. Antimicrob Agents Chemother 1981;19(5):807-12. 116. Cisar JO, Kolenbrander PE, McIntire FC. Specificity of coaggregation reactions between human oral streptococci and strains of Actinomyces viscosus or Actinomyces naeslundii. Infect Immun 1979;24(3):742-52. 117. Foley J, Blackwell A. Ion release from copper phosphate cement and influence on Streptococcus mutans growth in vitro: a comparative study. Caries Res 2003;37(6):416-24. 118. Noji S, Sato Y, Suzuki R, Taniguchi S. Effect of intracellular pH and potassium ions on a primary transport system for glutamate/aspartate in Streptococcus mutans. Eur J Biochem 1988;175(3):491-5.

71
119. Dashper SG, Reynolds EC. Effects of organic acid anions on growth, glycolysis, and intracellular pH of oral streptococci. J Dent Res 2000;79(1):90-6. 120. Radcliffe CE, Akram NC, Hurrell F, Drucker DB. Effects of nitrite and nitrate on the growth and acidogenicity of Streptococcus mutans. J Dent 2002;30(7-8):325-31. 121. Skjorland K, Gjermo P, Rolla G. Effect of some polyvalent cations on plaque formation in vivo. Scand J Dent Res 1978;86(2):103-7. 122. Mahajan VK. Sporotrichosis: An Overview and Therapeutic Options. Dermatol Res Pract 2014; 2014: 272376. 123. Carroll R, Matfin G. Endocrine and metabolic emergencies: thyroid storm. Ther Adv Endocrinol Metab 2010;1(3):139-45. 124. Hamama HH, Yiu CK, Burrow MF. Effect of silver diamine fluoride and potassium iodide on residual bacteria in dentinal tubules. Aust Dent J 2015;60(1):80-7. 125. Knight GM, McIntyre JM, Craig GG, Mulyani. Ion uptake into demineralized dentine from glass ionomer cement following pretreatment with silver fluoride and potassium iodide. Aust Dent J 2006;51(3):237-41. 126. Knight GM, McIntyre JM, Craig GG, Mulyani, Zilm PS, Gully NJ. Differences between normal and demineralized dentine pretreated with silver fluoride and potassium iodide after an in vitro challenge by Streptococcus mutans. Aust Dent J 2007;52(1):16-21. 127. Goodman H, Pollock JJ, Katona LI, Iacono VJ, Cho MI, Thomas E. Lysis of Streptococcus mutans by hen egg white lysozyme and inorganic sodium salts. J Bacteriol 1981;146(2):764-74. 128. Greger JE, Eisenberg AD. Adenosine 5'-triphosphate content of Streptococcus mutans GS-5 during starvation in a buffered salt medium. Caries Res 1985;19(4):314-9. 129. Huang R, Li M, Gregory RL. Gregory. Effect of nicotine on growth and metabolism of Streptococcus mutans. Eur J Oral Sci 2012;120(4):319-25. 130. Sanui T, Gregory RL. Analysis of Streptococcus mutans biofilm proteins recognized by salivary immunoglobulin A. Oral Microbiol Immunol 2009;24(5):361-8.

72
ABSTRACT
73
FIRST-HAND NICOTINE/TOBACCO EXPOSURE ON STREPTOCOCCUS MUTANS
BIOFILM AND EFFECTS OF SODIUM CHLORIDE,
POTASSIUM CHLORIDE AND POTASSIUM
IODIDE SALTS
by
AbdulRahman BalHaddad
Indiana University School of Dentistry Indianapolis, Indiana
Objective: The aim of this study is to investigate the effects of first hand nicotine
exposure on Streptococcus mutans biofilm formation and the inhibitory effects of sodium
chloride (NaCl), potassium chloride (KCl) and potassium iodide (KI) salts. This study
examined bacterial growth with varying concentrations of NaCl, KCl and KI salts and
nicotine levels consistent with primary levels of nicotine exposure.
74
Design: A preliminary experiment was done to investigate the most likely
effective concentration of NaCl, KCl and KI. Then, a 24-hour culture of S. mutans UA159
in microtiter plates was treated with nicotine (0-32 mg/ml) in Tryptic Soy broth
supplemented with 1.0-percent sucrose (TSBS) simulating first hand exposure with and
without 0.45 M of NaCl, 0.23 M of KCl and 0.113 M of KI. A spectrophotometer was
used to determine total growth and planktonic growth. The biofilm was fixed, stained
with crystal violet dye and the absorbance measured to determine biofilm formation.
Results: The presence of 0.45 M of NaCl, 0.23 M of KCl and 0.113 M of KI
significantly inhibited (p<0.05) first hand nicotine-induced S. mutans biofilm formation
by 52 percent%, 79.7 percent, and 64.1 percent, respectively. Similar results were
obtained for planktonic growth.
Conclusion: These results provided more evidence regarding the negative effects
of nicotine and also demonstrated the positive influence of these salts in reducing
nicotine-induced biofilm formation, which needs be confirmed by in-vivo studies.

CURRICULUM VITAE
AbdulRahman A. BalHaddad
June 30, 1989 Born in Al-Khobar, Saudi Arabia 2007 to 2013 BDS, University of Dammam, Dammam, Saudi Arabia 2013 to 2014 Internship Program University of Dammam, Dammam, Saudi Arabia 2014 to 2015 Teaching Assistant University of Dammam, Dammam, Saudi Arabia 2015 to present MSD Program, Operative Dentistry Indiana University School of Dentistry, Indianapolis, Indiana Professional Organization Academy of Operative Dentistry International Association for Dental Research American Association for Dental Research American Society for Microbiology, Indiana Branch Saudi Dental Society