Final Report: Solar Oven Development and Testing
27
Solar Oven Development and Testing Final Report FSEC 26-58-876 15 February 2002 (Rev. June 2002) Prepared for: Mr. Darwin O. Curtis Solar Household Energy, Inc. Contract Representative for The Dorothy Ann Foundation Prepared by: Philip Fairey John Harrison Mark Thornbloom Florida Solar Energy Center 1679 Clearlake Road Cocoa, Florida 32922-5703
Transcript of Final Report: Solar Oven Development and Testing

Solar
Solar
Development
FS
15 February 2002 (R
MSolar Hou
ContracThe Doro
Florida So1
Cocoa,
Solar Oven and Testing
Final Report EC 26-58-876 ev. June 2002)
Prepared for: r. Darwin O. Curtis sehold Energy, Inc. t Representative for thy Ann Foundation
Prepared by: Philip Fairey
John Harrison Mark Thornbloom
lar Energy Center 679 Clearlake Road Florida 32922-5703
1
SOLAR OVEN DEVELOPMENT AND TESTING CONTRACT FINAL REPORT 15 February 2002
Philip Fairey John Harrison
Mark Thornbloom Florida Solar Energy Center
The Florida Solar Energy Center (FSEC) was contracted by the Dorothy Ann Foundation (and its agent and representative, Darwin O. Curtis), to conduct an investigative study into the development of a state-of-the art solar cooker. A major goal of the contract was to investigate the potential means of improving the performance and long-term durability of the existing Cookit solar cooker. Many of the activities and accomplishments conducted as part of this contract have been provided in the reports and analyses previously sent to the contact representative. The purpose of this final report is to list the various task accomplishments defined in the initial contract. 1. SYSTEM DESIGN The first task listed in the contract was to develop a basic reflector design. As part of this task, FSEC was contracted to analytically evaluate alternative designs using a computerized optical ray tracing program. The objective of this task was to optimize cooker system performance. To become familiar with solar cooker technology FSEC initially conducted an in-depth review of the available options, designs, and materials used. The vast amount of information gathered through this investigation provided FSEC staff unfamiliar with this topic a better understanding of solar cooker technology. The initial design of the cooker was envisioned to be one comprising an adjustable parabolic type reflector with a greenhouse and pot hanging from the upper hub of a tripod. (Additional information and illustration of this design are included in Appendix A, Solar Cooker Project Report, 5 July 2001.) FSEC conducted a ray tracing analysis of the initial parabolic design and presented it to Mr. Curtis. (This initial ray tracing analysis is included in Appendix B.) Upon review of the ray tracing analysis and the design, it was concluded by all parties that this type of concentrator design was not feasible due to the various factors discussed in the report provided in Appendix A. After the initial cooker design, FSEC staff conducted a second ray tracing analysis of a design that incorporated panel cooker type features. The analysis from this simulation is provided in Appendix C. Based on this analysis and an ancillary prototype model (High Back) sent to FSEC by Mr. Curtis, FSEC initiated the construction of prototype models for future evaluation and testing.

2
Figure 1 below shows both the prototype developed through the second ray tracing analysis (Proto A) and the High Back prototype design provided by the contract representative (Proto B).
Figure 1
There are several features that need to be emphasized on each prototype. In Prototype A, note the angle of the bottom reflector section (A2), the size of the back (A1), and the large front reflector (A3). In Prototype B, note the similar yet shorter back (B1), and the side wings (B2 and B3). The final prototype that is being tested incorporates several features of each unit. These include the back configuration (B1), the side wings (B2 and B3) from Prototype B, and from Prototype A, the rear bottom angle (A2), and a somewhat modified and reduced front reflector (A3). The final version of the test prototype is shown in Figures 2 and 6 below. This unit will be referred to as the FSEC/High Back cooker since it incorporates features derived from both the FSEC ray tracing analysis model and the High Back model presented to FSEC by Mr. Curtis. (Note that in several tables, graphs and text in this report, the unit is identified simply as the “High Back” model due to space constraints.)

3
Figure 2
2. MATERIAL SELECTION The second task listed in the contract was to conduct an investigative study to determine the most appropriate materials for the prototype cooker. A search was performed to exhaust all potential sources. This has been the most time consuming and exhaustive part of the project. The search encompassed investigations related to the material for the body of the cooker, reflective material, and the greenhouse unit. This investigation included the use of numerous Internet search engines, solar cooking community web sites, related industries associations, industrial manufacturers, discussions with manufacturing products representatives, discussions with solar cooking community personnel, and other reasonable means of identifying materials and products. Reflective material An investigative report was provided in December 2001 detailing the findings and recommendations of this research. This report is provided in Appendix D.
Body material As noted above, one of the goals of this contract was to develop a cooker that could withstand both environmental degradation and daily use for longer periods of time. The primary problem with the Cookit, as understood by FSEC staff, was that the unit, although a fine product, deteriorated due to constant use and environmental factors such
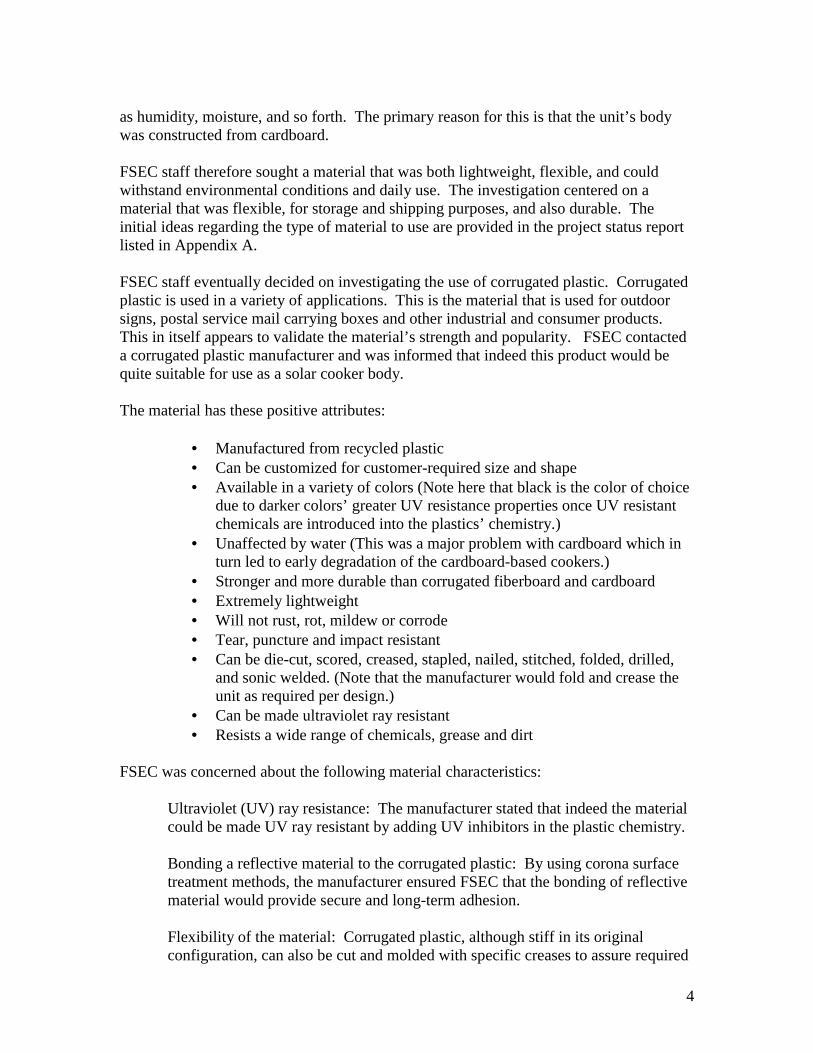
4
as humidity, moisture, and so forth. The primary reason for this is that the unit’s body was constructed from cardboard. FSEC staff therefore sought a material that was both lightweight, flexible, and could withstand environmental conditions and daily use. The investigation centered on a material that was flexible, for storage and shipping purposes, and also durable. The initial ideas regarding the type of material to use are provided in the project status report listed in Appendix A. FSEC staff eventually decided on investigating the use of corrugated plastic. Corrugated plastic is used in a variety of applications. This is the material that is used for outdoor signs, postal service mail carrying boxes and other industrial and consumer products. This in itself appears to validate the material’s strength and popularity. FSEC contacted a corrugated plastic manufacturer and was informed that indeed this product would be quite suitable for use as a solar cooker body. The material has these positive attributes:
• Manufactured from recycled plastic • Can be customized for customer-required size and shape • Available in a variety of colors (Note here that black is the color of choice
due to darker colors’ greater UV resistance properties once UV resistant chemicals are introduced into the plastics’ chemistry.)
• Unaffected by water (This was a major problem with cardboard which in turn led to early degradation of the cardboard-based cookers.)
• Stronger and more durable than corrugated fiberboard and cardboard • Extremely lightweight • Will not rust, rot, mildew or corrode • Tear, puncture and impact resistant • Can be die-cut, scored, creased, stapled, nailed, stitched, folded, drilled,
and sonic welded. (Note that the manufacturer would fold and crease the unit as required per design.)
• Can be made ultraviolet ray resistant • Resists a wide range of chemicals, grease and dirt
FSEC was concerned about the following material characteristics:
Ultraviolet (UV) ray resistance: The manufacturer stated that indeed the material could be made UV ray resistant by adding UV inhibitors in the plastic chemistry. Bonding a reflective material to the corrugated plastic: By using corona surface treatment methods, the manufacturer ensured FSEC that the bonding of reflective material would provide secure and long-term adhesion. Flexibility of the material: Corrugated plastic, although stiff in its original configuration, can also be cut and molded with specific creases to assure required

5
design folding and storage of manufactured units. A question regarding the durability of joints that are constantly being bent needs to be addressed.
Following initial discussions, FSEC developed schematic drawings of the prototype cooker that were sent to the manufacturer to determine the cost of producing solar cookers from corrugated plastic. This request to the manufacturer as well as the resulting manufacturing quote is included in Appendix E.
Greenhouse material In the past, most panel type solar cookers used a standard pot, with or without a cover, and a plastic cooking bag. The pot was placed inside the plastic bag which was then sealed. Although very practical, this method had several drawbacks. One of these was that the bag had to be opened to stir the food. The performance efficiency of cooking via this bag method was also questioned. FSEC decided to further investigate the use of a “greenhouse” type cooking apparatus. The term “greenhouse” in this report refers to the use of a metal pot that is placed into a glass bowl and sealed with a lid creating a greenhouse affect. The following action was taken by FSEC. The exterior of a standard 4-quart stainless steel mixing pot was painted with flat black paint. A circular aluminum ring was machined to allow a proper fit between the glass bowl and the metal pot. Silicone sealant was used to seal the lip of the metal pot to the aluminum ring. The metal pot and ring were then lowered over the glass container. A glass lid was then placed over the metal pot. The air space between the glass bowl and the metal pot created a “greenhouse” type effect that in theory increases the overall temperature and seals in the generated heat. Figure 3 below shows this strategy.

6
Figure 3 FSEC developed “Greenhouse.”
FSEC staff conducted a computer-based analysis of the projected performance of this type of greenhouse design. The in-depth analysis included a simple strategy, as shown above, as well as a variety of other, more technically demanding design options, such as using low-emissivity glass, selective coatings, etc. The results of this analysis are included in Appendix F. This computer analysis indicated that the more sophisticated and technologically demanding concepts theoretically provided outstanding performance results but due to the costs of developing a final product using these methods, further investigation was not conducted. Nevertheless, it is recommended that other parties should further investigate these methods in the future. For example, using a Dewar type design could have major implications, but manufacturing this type of “greenhouse” would require the voluntary participation of a major vacuum product manufacturer who could shoulder the burden of developing prototypes.
Note how the bowl fits inside on a lip of the aluminum ring. The bowl was then siliconed at this point to the aluminum ring.
The aluminum ring is then fit onto the glass bowl creating the “greenhouse.”

7
A separate investigation related to the basic greenhouse concept involved determining the feasibility of using polycarbonate material. The contract representative asked FSEC to investigate the feasibility of using polycarbonate material as the exterior greenhouse material – instead of the FSEC recommended borosilicate glass. Therefore, FSEC conducted an exhaustive investigation into the use of polycarbonate material. The findings of this investigation were provided in the report listed in Appendix G. Schematics indicating the dimension of the required greenhouse unit are currently being developed and will be provided to Mr. Curtis upon completion. Mr. Curtis has stated that he has identified a glass manufacturer in Mexico that is agreeable to manufacturing production units of the greenhouse units. Pot material A major drawback in this investigation was finding a standard 5-quart pot that could be matched with a reasonably similar sized (slightly larger) glass container to form a final greenhouse. Unfortunately this author could not find a suitable match for the 5-quart containers. Nevertheless, a suitable match was discovered for a 4-quart metal pot and glass bowl and lid to form the prototype greenhouse used in testing. Further discussion on this will be presented in the test reporting section. 3. TESTING AND EVALUATION The original contract design requirements were to develop a cooker that would be capable of heating one quart of 70 F water contained in a 5 liter cooking pot to 212 F in 56 minutes or less given direct solar radiation that did not exceed 700 w/m2 and a solar reflector surface area that did not exceed 1 m2 in an ambient environment with a temperature that did not exceed 90 F with a wind speed equal to or greater than 3.5 miles per hour. The above were thus the basic test and performance criteria. Soon after the start of the contract an internationally developed test standard (ASAE Standard X580) was identified and all parties agreed, after a request from Mr. Curtis, that this new solar cooker test standard be used instead of the aforementioned testing procedures listed in the initial contract. (A copy of the ASAE X580 test method is provided in Appendix H.) As part of this task, FSEC constructed numerous prototypes of the cooker for testing purposes. This included the model based on the ray tracing analysis as well as a prototype model suggested by the contract representative. Constructing the prototypes included developing specific measurements for the final large-scale unit. As described above, the final cooker design was a synthesis of the design developed through the FSEC ray tracing analysis and the High Back prototype model provided to FSEC by Mr. Curtis. Of special note is the fact that since FSEC and the contract representative agreed to use the internationally developed test standard, the quantity of the water to be used in the test was determined by the reflector’s total aperture size. The aperture size of the originally
8
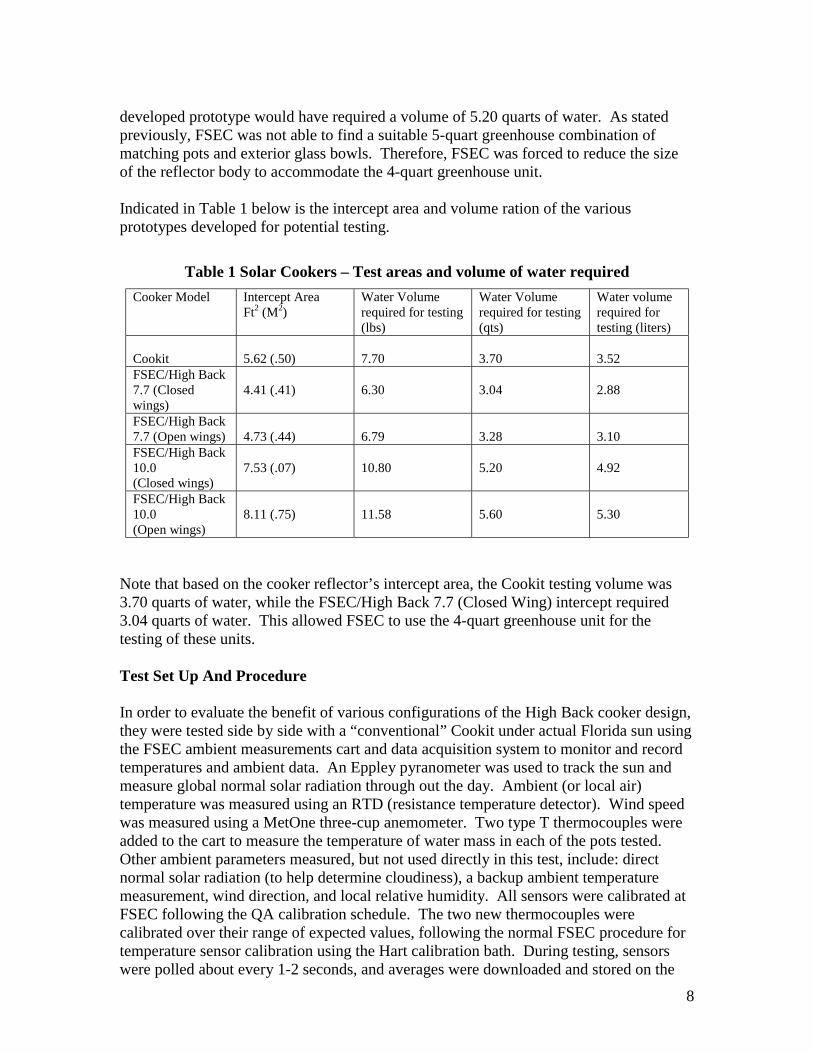
developed prototype would have required a volume of 5.20 quarts of water. As stated previously, FSEC was not able to find a suitable 5-quart greenhouse combination of matching pots and exterior glass bowls. Therefore, FSEC was forced to reduce the size of the reflector body to accommodate the 4-quart greenhouse unit. Indicated in Table 1 below is the intercept area and volume ration of the various prototypes developed for potential testing.
Table 1 Solar Cookers – Test areas and volume of water required Cooker Model Intercept Area
Ft2 (M2) Water Volume required for testing (lbs)
Water Volume required for testing (qts)
Water volume required for testing (liters)
Cookit
5.62 (.50)
7.70
3.70
3.52
FSEC/High Back 7.7 (Closed wings)
4.41 (.41)
6.30
3.04
2.88
FSEC/High Back 7.7 (Open wings)
4.73 (.44)
6.79
3.28
3.10
FSEC/High Back 10.0 (Closed wings)
7.53 (.07)
10.80
5.20
4.92
FSEC/High Back 10.0 (Open wings)
8.11 (.75)
11.58
5.60
5.30
Note that based on the cooker reflector’s intercept area, the Cookit testing volume was 3.70 quarts of water, while the FSEC/High Back 7.7 (Closed Wing) intercept required 3.04 quarts of water. This allowed FSEC to use the 4-quart greenhouse unit for the testing of these units. Test Set Up And Procedure In order to evaluate the benefit of various configurations of the High Back cooker design, they were tested side by side with a “conventional” Cookit under actual Florida sun using the FSEC ambient measurements cart and data acquisition system to monitor and record temperatures and ambient data. An Eppley pyranometer was used to track the sun and measure global normal solar radiation through out the day. Ambient (or local air) temperature was measured using an RTD (resistance temperature detector). Wind speed was measured using a MetOne three-cup anemometer. Two type T thermocouples were added to the cart to measure the temperature of water mass in each of the pots tested. Other ambient parameters measured, but not used directly in this test, include: direct normal solar radiation (to help determine cloudiness), a backup ambient temperature measurement, wind direction, and local relative humidity. All sensors were calibrated at FSEC following the QA calibration schedule. The two new thermocouples were calibrated over their range of expected values, following the normal FSEC procedure for temperature sensor calibration using the Hart calibration bath. During testing, sensors were polled about every 1-2 seconds, and averages were downloaded and stored on the

9
mainframe usually every 30 seconds. These data were then available for plotting and analysis.
Anemometer Pyranometer
Data acquisition
Figure 4
The “High Back 7.7 (Closed wings)” configuration was chosen for testing. A “conventional” Cookit (See Figure 5) was also tested as a control, side by side with the “High Back” cooker (See Figure 6). This allowed a measure of normalization between different days. A preliminary round of tests is discussed here. These tests allowed us to better understand small changes in the chosen configuration. The tests were set up and run with an eye toward meeting the protocol set forth in ASAE Standard X580. This included sizing the pots, reflector, and water mass to meet X580 standards. Each day, about 3.52 liters (3516 grams) of water was placed in the Cookit pot, and about 2.88 liters (2677 grams) was placed in the “High Back” pot, and the actual mass, to the nearest centiliter was recorded for that day. These values may be found in Table 2.

10
Figure 5 Cookit solar cooker
Figure 6 FSEC/High Back solar cooker (Note that the cooker on the right has the front reflector)

11
Figure 7 FSEC/High Back solar cooker
Wind speed statistics for each day while the cookers were on-sun may also be found in Table 2. The higher the wind speed, the greater the heat loss from a cooker. While wind speed can impact the performance of the cooker and maximum allowable wind speeds are called out in the Standard X580, there is currently no protocol for quantifying the wind impact on performance. However, wind speed does impact performance by an unknown amount. The data can be used to provide a subjective analysis of the performance. In addition, testing a Cookit side by side helps normalize the results from different days.
Table 2 Average Parameters for each day’s testing. Day Water Mass [g] Ambient Temp. [C] Solar Radiation [W/m2] Wind Speed [m/s] Cookit FSEC/
High Back
Avg Min Max Avg Min Max Avg Min Max
23 Jan 3515.70 2877.00 26.3 25.1 26.9 1046.3 535.3 1138.7 2.7 1.1 4.4 24 Jan 3515.97 2876.97 26.9 23.9 28.8 857.1 136.4 1205.8 2.0 0.6 3.6 25 Jan 3516.01 2876.99 26.5 21.0 28.8 887.3 57.8 1148.0 1.7 0.0 3.8 29 Jan 3516.00 2877.01 24.9 21.5 26.3 935.9 55.5 1271.7 1.8 0.0 3.6 4 Feb 3515.94 2877.03 17.7 15.6 19.4 835.5 100.6 1290.2 2.7 0.9 4.8 The two cookers were turned “on-sun” within seconds of each other. They were then turned manually each hour to follow the sun throughout the day. The same person turned both cookers each day, to minimize discrepancies in the testing process. Following each day’s test, the data were plotted, and the plots were studied to evaluate various sequential changes to the design. Discussion of that analysis is below.
Note the forward tilt of the back plane.
Front reflector

12
Transmissivities of the various glazings were roughly checked using a beam splitter. Tabulation and a discussion of these results may be found in Appendix I. These results are inherently approximate, due in part to the non-homogeneity of the glass and plastic, and the potential change in reflectivity at off-normal incidence angles, but also due to the imprecision of the test equipment. However, they help to quantify the glazing transmissivities and they help to give a feel for what we might expect in terms of relative performance. Heating Rate vs. Cooling Rate In a solar cooker, the main objective is two-fold: 1) to raise the temperature of the food, and 2) to transfer significant amounts of heat energy into the food. Like any solar collector, the cooker demonstrates a dynamic relationship between the various heating and cooling forces acting on it. If the heating rate exceeds the cooling rate, then the temperature of the food rises. Sunlight acts as a heating force to add energy to the food. Higher rates of sunlight mean higher heating rates, or greater amounts of energy entering the food. Wind and the air temperature act as the main cooling forces, since air temperature is almost always cooler than the cooking food. Higher winds and colder air temperatures mean higher cooling rates, or greater amounts of energy leaving the food. Correspondingly, as the difference in temperature between the food and the air increases, the cooling rate increases. In addition, as the food temperature approaches the boiling point of the water in it, heat loss due to evaporation and mass transfer of vapor out of the pot contribute to the cooling rate. Radiative heat loss might also become significant in certain situations, as the food or pot temperature re-radiates its heat to the surroundings. Added to all this is the mass of the food and pot, which acts as an inertial damper on both the heating and the cooling rate. Like any solar collector, we design the cooker to maximize the heating rate while minimizing the cooling rate. Reflectors concentrate large amounts of sunlight on the food, which increases heating rate. In some cases, reflectors may also provide shielding from wind, which decreases cooling rate somewhat. Glazings around the pot dramatically reduce cooling rate by providing a layer of insulation from the cooling wind, in the form of the solid glass or plastic and the layer of air in between the glazing and the pot. Lids on the pot also dramatically reduce cooling rate by reducing or eliminating mass transfer of water vapor out of the pot. Glazings also reduce the heating rate somewhat, because their transmissivity is always less than 100%. Design of the optimum solar cooker also must take into account the cost of materials. Highly effective materials also cost more. Decisions must be made as to which issues are most important. The rate of temperature rise is a measure of the net transfer of heat into the food. Plotting the food temperature with respect to time provides a good simple measure of heating rate. An upward sloping curve means that heat rate exceeds cooling rate. If the temperature plot has a higher, steeper slope, then the heating rate is greater than a plot with a lower, flatter, or more level slope. A downward sloping, or negative, curve would imply that the cooling rate exceeds the heating rate. The steeper the downward slope, the greater the cooling rate. An unchanging temperature with a flat, or horizontal slope implies that the heating and cooling rate are equal to each other.

13
However, the forces influencing the temperature of the food are constantly changing. Hence, looking at temperature change alone does not allow very accurate comparison. Paul Funk attempts to increase the accuracy of comparison by defining a “cooking power” in Standard X580 to describe the net heating rate. While the cooking power does not take into account wind effects, it provides an excellent measure of performance by which various tests and cookers may be compared. In addition, we have added side-by-side testing of the Cookit to help normalize the results of our tests from day to day. In the plots below, we can see a heating portion as the temperatures rise, indicating that the heat rate is higher than the cooling rate. Then, we see the curves level off, as the cooling rate begins to catch up to the heating rate. Finally, we see a cool-down portion as the cooling rate exceeds the heating rate. This generally corresponds to a significant reduction in sunlight due to clouds or as the sun starts to set. Methods Of Analysis The data from testing was analyzed using two different means to compare the configuration of interest to the conventional Cookit: 1) temperature comparison, and 2) cooking power comparison. For temperature comparison, the temperatures of the water mass in each cooker were plotted as a function of time. Ambient temperature, solar radiation, and wind speed were also plotted, to better understand changes in performance. The plots have three general areas: a heating section, a level section where the temperatures don’t change significantly, and a cooling section where the heat losses exceed the heat gains and the water masses start to cool. Comparing curve slopes and actual temperatures allows us to better understand the magnitude of improvement of each configuration change. Test data from January 29 and February 04 (single vs. double glazed lid) are also evaluated by comparing standardized Cooking Power. For the Cooking Power comparison, the cooking power is plotted as a function of temperature difference for each cooker. In an effort to accumulate as much data as possible and evaluate trends, Cooking Power calculated here meets certain criteria called out in Standard X580, and does not meet other criteria. Hence, Cooking Power calculated here can not be used as a direct comparison but is a very close approximation to actual Cooking Power. Cooking Power is only analyzed when cooker temperatures are increasing, so cooling period is not included. The X580 criteria that are met in this test are: - 4.1 Ambient Temperature (except Feb 04): All ambient temperatures for these
tests, except for Feb 04, were between 20 and 35 degrees C. - 5.3 Water Temperature: Cooking Power was only calculated when water masses
were at least 5 degrees above ambient and 5 degrees below 100 degrees C. - 5.4 Insolation: Cooking Power was only calculated when normal total radiation
(in plane perpendicular to sun’s rays) was between 450 and 1100 W/m2 and varied less than 100 W/m2 during the calculation interval. Note that the calculation interval may exceed 10 minutes.

14
- 5.5 testing between 10:00 and 14:00 Solar Time: Data for 29 Jan are between 10:14 and 15:11 eastern time. Data after 14:00 and any data before 10:00 solar time could be removed to meet this criterion. Data for 04 Feb are between 11:07 and 15:06 eastern time. Data after 14:00 solar time could be removed to meet this criterion.
- 6.1 Water Loading: Each cooker pot was loaded with a certain amount of water, reflecting the 7.0 kg/m2 requirement. The actual mass for each day is recorded to the nearest centiliter.
- 6.2 Tracking: Both cookers were manually adjusted to follow the sun about once per hour.
- 6.3 Temperature Sensing: water mass temperatures were measured using calibrated type-T thermocouples located 10 mm above the bottom and at the center of the pot.
- 7.2 Calculating Cooking Power: The Standard requires a 10-minute interval. Some of the intervals in this report exceed 10 minutes, due to the manner in which the data are read.
- 7.4 Standardizing: Cooking Power is calculated over the previous 20 scans. If more than 30 seconds elapsed between scans, then the interval exceeds 10 minutes. Cooking power is standardized to 700 W/m2.
- 7.6 Plotting: Cooking Power is plotted against the Temperature Difference. - 7.7 Regression: Linear regressions are used to compare performance. However,
not all the regressions meet the minimum coefficient of determination (R2) requirement of 0.75.
The X580 criteria that are NOT met in this test are: - 4.1 at least 30 observations: The Standard requires that the observation be over a
10-minute interval (See 7.2 of the Standard). While many more than 30 observations are presented, these data are calculated for every 30-second scan. Hence, the data overlap each other considerably. To calculate true Cooking Power, data points should be selected in which data do not overlap other data points.
- 5.1 Wind: The Standard is not clear on maximum wind speeds allowed, but does indicate a preference for winds under 1.0 m/s, and no winds averaging in excess of 2.5 m/s over the ten-minute period. For this report, data points were not eliminated due to wind speed. From the table above, it is evident that there may be some data points which exceed the 1.0 m/s requirement, and possibly also the 2.5 m/s requirement.
- 5.2 Ambient Temperature: 04 February does not meet this requirement. - 7.7 Regression: not all regressions shown meet the minimum R2 value of 0.75.
Also, only one day per configuration is presented, not three. - 7.8 Single Measure of performance: this is not calculated. Discussion Of Results January 23: First Test

The “FSEC/High Back 7.7 (Closed wings)” as described elsewhere in this report and in this section called simply the ”High Back” unit, was set up and monitored throughout the heat-up portion of the day, that is, the morning through to mid-afternoon. The data are plotted in Figure 7. Relative to the Cookit, the High Back heating rate (or the slope of the temperature curve) was only slightly more until about mid-day, then its slope began to decrease, or level off. There was a significant amount of condensation on the inside of the High Back lid at this time. The Cookit temperature surpassed the High Back at 13:39. The Cookit maintained a constant heating rate until around 14:00 when it began to level off. Improving the High Back geometry at 14:30 by redirecting the rays back down onto the pot showed an improvement in High Back heating rate performance. No cooling rate performance data were obtained for this day.
Two reasons were put forward foof the High Back. The first was raltitudes found in the tropics. Ththe mid-day sun altitude was signWhile the lowest altitude tested baltitude achieved by the sun in CoTherefore, on this day the altitudethan 42 degrees off horizontal. Fosun altitudes would lead to reflectabove the pot. We determined to
High Back
t
High back
Cooki
15
Figure 8
r the relatively poor performance at high temperatures eflector design. The reflector was designed for high sun e tests were being conducted in January in Florida, so ificantly lower than would be found in the tropics. y the ray-tracing analysis was 50 degrees, the highest coa Florida on January 23 was 41.9 degrees. of all the sun’s rays incident on the collector were less r example, the altitude at 13:39 was 39 degrees. Lower ed rays converging at points higher than desired, that is, adjust for this problem by adjusting the sides and back

16
to effectively bring the rays back down onto the pot. When we spread the side “wings” further apart, this had the desired effect. For all subsequent tests, the High Back reflector was set such that the back was tilted in 10 degrees from vertical, or 80 degrees off horizontal. This sets the side triangles tipped in 8 degrees at about 82 degrees off horizontal, and the side quadrangles tipped out 23 degrees at about 67 degrees off horizontal. In fact, the reflector was changed to this setting at 14:30. An improvement, or increase in the heating rate can be seen in the High Back for the remainder of this day’s test. A second possible reason for the poor performance was the condensation of moisture on the lid. In a cooker, the cooking (or heating) effect is obtained when the energy input (sunlight) exceeds the energy output (losses). Heat loss follows three basic paths: conductive, convective, and radiative heat loss. All three are a function of temperature, among other things: the higher the temperature, the greater the loss rate. Condensation could be considered as a combination of conductive and convective loss, and is an indicator of significant heat loss. This is because steam at 100 degrees C contains much more heat than liquid water at 100 degrees C (about 2257 kJ/kg, or 970 Btu/lb more). If the steam gives up all this energy and turns to liquid water (condensation), this is considerably more heat loss than if the steam or water were to give up heat by simple conduction. To reduce the heat loss due to condensation, a better-insulated lid is needed. We chose to add a black aluminum inner plate to the lid to determine the impact on performance. With this High Back reflector design, many of the sun’s rays make it into the pot through the lid, and adding an opaque inner lid would significantly reduce the heat input through the lid. However, we had concerns about the cost of a glass inner lid, and we had concerns about the ability of most plastics to withstand the relatively high stagnation temperatures found at the lid. Hence, we chose an opaque metal inner lid. January 24: Aluminum Inner Lid This day’s test was run with the black aluminum plate fit tightly to the inside of the glass pot lid. We also added the small front reflector that is shown in the ray trace reflector profile, but was left out of the previous day’s test. And, as with all subsequent tests, the reflector was held in its “wide” position. In spite of a cloudy day and very little sun, both cookers showed a strong temperature rise. Interestingly, the Cookit outperformed the High Back throughout the whole heating portion of the day. The High Back edged slightly closer as both cookers got hotter, and during the cooling portion of this day, the High Back maintained a better, or flatter slope on its heat loss rate. This would indicate that adding the opaque metal plate was detrimental to High Back heat gain performance, but helped improve its heat loss performance.

January 25: Wide Pos This day’s test was runsubsequent tests, the reThus, this day’s test cothe front panel. Also, trate. To make the heat sun at 16:01, although t
t
Cooki17
Figure 9
ition, Front Panel
with the black aluminum plate removed again. As with all flector was in its “wide” position, and the front panel was in place. uld be compared to January 23 to evaluate the wide position and he test was run during the heat loss period to look at the cooling loss period more evident, the cookers were turned away from the here was little sun at the time.
High Back High back
18
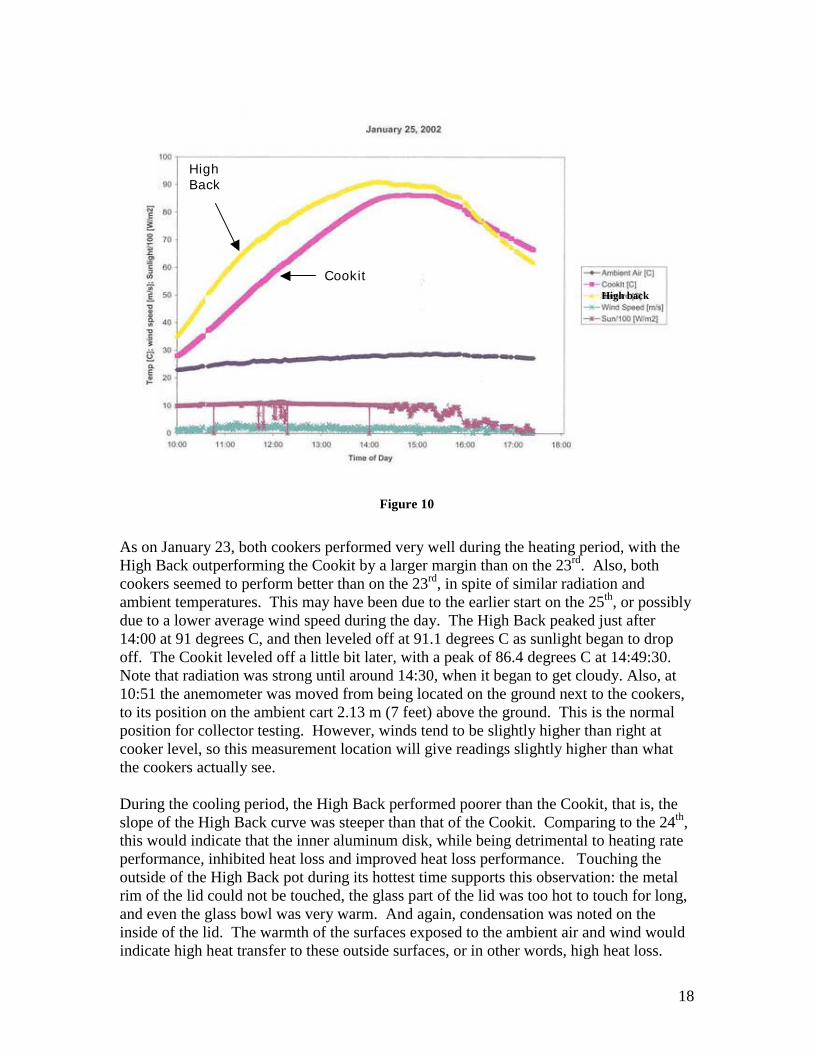
Figure 10
As on January 23, both cookers performed very well during the heating period, with the High Back outperforming the Cookit by a larger margin than on the 23rd. Also, both cookers seemed to perform better than on the 23rd, in spite of similar radiation and ambient temperatures. This may have been due to the earlier start on the 25th, or possibly due to a lower average wind speed during the day. The High Back peaked just after 14:00 at 91 degrees C, and then leveled off at 91.1 degrees C as sunlight began to drop off. The Cookit leveled off a little bit later, with a peak of 86.4 degrees C at 14:49:30. Note that radiation was strong until around 14:30, when it began to get cloudy. Also, at 10:51 the anemometer was moved from being located on the ground next to the cookers, to its position on the ambient cart 2.13 m (7 feet) above the ground. This is the normal position for collector testing. However, winds tend to be slightly higher than right at cooker level, so this measurement location will give readings slightly higher than what the cookers actually see. During the cooling period, the High Back performed poorer than the Cookit, that is, the slope of the High Back curve was steeper than that of the Cookit. Comparing to the 24th, this would indicate that the inner aluminum disk, while being detrimental to heating rate performance, inhibited heat loss and improved heat loss performance. Touching the outside of the High Back pot during its hottest time supports this observation: the metal rim of the lid could not be touched, the glass part of the lid was too hot to touch for long, and even the glass bowl was very warm. And again, condensation was noted on the inside of the lid. The warmth of the surfaces exposed to the ambient air and wind would indicate high heat transfer to these outside surfaces, or in other words, high heat loss.
High Back
Cookit High back

19
The glass lid seems to be a significant heat loss path. The metal rim of the glass lid on the High Back also is a heat loss path, but because of its small area, the actual heat loss is probably not as significant. That the glass lid is a significant heat loss path actually would seem logical, since there is only a single solid surface between the heated mass and the ambient. In the “greenhouse”, there are two: the pot side and the glass bowl. Furthermore, there is a thin layer of air between the two, which increases the insulation effect. In the Cookit, there also are two: the pot side/lid and the plastic bag. While the entrapped air between these surfaces is a larger volume and more conducive to convective currents than in the High Back greenhouse, there is still an insulating effect contributed by the entrapped air mass. Thus, it would seem beneficial to get an entrapped air pocket in the lid between the heated mass and the ambient, like is done in the Cookit. There would be reduction in the amount of heat gain, since the rays would need to penetrate two glazings rather than one. However, as can be seen in the discussion on transmissivities in Appendix I, a double glazing of glass and polycarbonate reduces the transmissivity by only about 10%, compared to the glass alone. Also, in the current design, a substantial amount of reflected rays enter the pot through the lid. If the design of reflector and/or hotpot were modified so that a greater percentage of the sun’s rays were reflected onto the sides and/or bottom of the pot, then the heat gain penalty for double glazing would be less in terms of actual amount of energy gain. One way to accomplish this would be to raise the hot pot on a small wire tripod to increase the view factor of the pot base. Another way might require adding an additional panel to the back and side reflectors to direct rays from the sun at high altitude to the bottom of the pot. January 29: Wide Position, Front Panel, Day Two This day’s test was run in the same configuration as January 25. As would be expected, the results are similar to those of January 25. It was a clear day, and sunlight was strong throughout. During the cooling period, the cookers were turned off-sun at 16:02 to make the heat-loss rate more evident. The pyranometer was covered for a minute to provide a marker in the data of this action. There is also a marked change in slope of the High Back.

20
Figure 11
As on the 25th, the High Back had a much higher heat rate than the Cookit during the heating period. The High Back held its lead while it was on-sun, even though it was 10 to 12 degrees C hotter (hence it would tend to have higher losses) than the Cookit. The High Back reached a peak temperature of 96.0 degrees C at 14:46:30, while the Cookit reached a peak temperature of 84.9 degrees C at 14:40:30. As on the 25th, the High Back demonstrated a higher cooling rate (steeper cooling slope) than the Cookit, especially when it was turned off-sun. This cooling rate more closely matched the Cookit’s as their water temperatures converged. This would imply that the High Back might have the same cooling rate as the Cookit under the same temperatures and ambient conditions. It might be useful to check the cooling rate of the final configuration under controlled conditions, possibly checking the impact of wind direction and wind speed on performance. It is interesting to note that on this day the High Back maintained temperatures above 90 degrees C for over 2.7 hours, until the cookers were turned off-sun. During this time, the radiation averaged 994 W/m2 and the ambient temperatures and wind were as shown in Table 3. Under the same conditions, the Cookit was only able to maintain an average temperature of 81.7 degrees C. As the water temperature approaches boiling (100 degrees C), heat losses due to evaporation from the water mass increase significantly. The heat may be transferred to the lid by evaporation and condensation, then through the thin glass of the lid, then blown away by the wind. Or, it may exit the pot directly by mass transfer when small amounts of steam escape from the pot. However, under the
Cookit
High Back
High back

21
given combination of ambient conditions, the High Back was able to maintain a high water mass temperature in spite of apparent high heat losses. Note also that sun altitude was fairly high during this time period. This could imply that the High Back reflector might perform better under more summer-like or tropical conditions than those experienced during these tests. Also, in none of the other tests to date was the High Back able to maintain temperatures exceeding 90 degrees C. It might be useful to compare the data for the same time periods (i.e. same sun altitudes) or for the same range of radiation levels or wind speeds.
Table 3 Peak Cooker and Corresponding Ambient Conditions for January 29. Solar [W/m2] Wind [m/s] T amb. [Deg C] FSEC/High Back [deg
C] Cookit [deg C]
Avg. 993.8 2.2 25.9 93.8 81.7 Min. 890.2 1.1 25.4 90.1 74.7 Max. 1043.9 3.6 26.3 96.0 84.9 A comparison of Cooking Power for 29 January is given in Figure 12. The large amount of scatter in the data may be due in part to accepting some points which would normally fall outside the bounds stipulated in Standard X580. At first appearance, the data for the two cookers seem to be almost on top of each other. However, a linear regression shows a High Back curve that is higher but with a steeper slope than the Cookit. This would indicate that the High Back performs better at lower temperatures, but poorer at higher temperatures. In fact, the Cookit performance would exceed High Back performance at Td exceeding 60. However, the Cookit was not even able to achieve Td > 60. So, the High Back did out-perform the Cookit, in that it continued to “cook” at Td > 60. This would be seen if second order curves were fit to the data sets. Therefore, the High Back outperformed the Cookit, although to a limited extent.

22
Figure 12
February 04: Acrylic Inner Lid This day’s tests helped look at the impact of adding an inner glazing to the High Back lid. A 2.4 mm (3/32 inch) Plexiglas acrylic disk was sealed in place with silicone to the underside (water side) of the pot lid. This provided two glazings on the lid with a thin layer of air in between them. In the discussion of the Materials Selection Task, acrylic was rejected in favor of glass, because acrylic can not stand up to the high stagnation temperatures anticipated during cooking, or if the pot should be boiled dry in the field. However, it was chosen here because it is easy to cut, and it would allow us to evaluate its performance under carefully monitored conditions. Based on the tests done with the beam splitter, the transmissivity of the glass-acrylic double-glazed lid dropped by 7% for visible light, and by 13.5% for near infrared light. One might expect similar results for a glass-glass double glazed lid. This day’s data show a windier, colder day with a lot of clouds rolling through. Dips in sunlight due to clouds are parroted by subsequent dips in the water temperatures of both cookers. Complete cloud cover after 15:30 gave the same effect as turning the cookers off-sun. At the higher water temperatures, some condensation was noted on the water-side of the acrylic glazing, but not as much as was seen previously with the single-glazed lid. Also, as was the case with the single glazing, when high wind gusts would come, small puffs of relatively cool air could be seen making their way into the pot and evaporating the condensation off the lid. This is because the seal between the pot and lid is not a perfect seal.
High Back
Cookit
Pwr High back

23
Figure 13
In spite of the added acrylic glazing, the High Back showed significant heat gain over the Cookit, with a higher heat rate and temperatures during the heating period. It also maintained a relatively high temperature, in spite of the cold, windy day. During cool down, the cooling rate slope initially was higher than that of the Cookit. Then, as the sun came back out a little bit (600 to 700 W/m2), the slope matched that of the Cookit, in spite of the High Back being about 10 degrees hotter. This would imply that the added acrylic sheet afforded a small improvement (flatter slope) in cooling rate, and did not seem to penalize the heating rate significantly. A comparison of Cooking Power for 04 February is given in Figure 14. Again, as on 29 January, the High Back data and curve is higher but with a steeper slope than the Cookit. However, there is a distinct separation between High Back data and Cookit data, and the High Back curve is significantly higher than the Cookit curve. In addition, the High Back data and curve extend to much higher Td values. Comparing to 29 January, we see that this significant performance improvement is in spite of significantly higher wind speeds. Thus, these results would indicate that the double glazed lid offers a significant improvement over the single glazed lid.
High Back
Cookit High back

Conclusions The “High Baimprovementsreflector confcombination wCookit is a blreflector. Sidouble-glazed Based on the this greenhousignificant hereflector coma significant pAdding a threinto more of tminimize tippdetermine the The reflector tested under sin Florida). M
t
High Back
High back
Cooki
24
Figure 14
ck 7.7 (Closed wings)” reflector configuration showed performance over a “conventional” Cookit. The “High Back 7.7 (Closed wings)”
iguration is with the back plane sloped 10 degrees in and used in ith the glass bowl and lid around a black steel pot. The “conventional”
ack steel pot and lid inside a Reynolds cooking bag, in a cardboard fold-up gnificant performance improvement was only seen when the lid was .
data analyzed, it would seem important to specify a double glazed lid. In se hot pot design, heat loss through the single-glazed lid seems to be a at loss path. In addition, in this combined hot-pot and High Back 7.7 bination under Florida winter sun, heat gain through the lid also seems to be ortion of the overall heat gain, precluding an opaque double glazed lid. e-legged stand when the sun is low might raise the pot enough to bring it he focal area of the reflector. The stand would need to be well designed to ing potential. Also, testing a low emissivity coating on the pot might help benefit of adding such a coating.
geometry of the “High Back 7.7 (Closed wings)” might perform better if unlight at higher altitudes (e.g., in tropical locations or during the summer uch of these data were collected at sun altitudes lower than those

25
anticipated in the ray tracing analysis. The reflector geometry is somewhat sensitive to sun altitude. In addition, it might prove useful to specify designs for specific sun altitudes. For example, a reflector might be designed uniquely for low-altitude sun (e.g. a “1500” model for cooking after 3 p.m.) and a second reflector might be designed for high-altitude sun (e.g. a “1000” model for cooking after 10 a.m.). Or, it might be possible to combine these two reflector configurations into one reflector with two settings. Further testing of the chosen design over at least three days would be necessary in order to define the Standardized Cooking Power curve and value for Td=50C. In addition, it might be useful to better understand the cooling rates of the chosen design, relative to the Cookit. The outdoor testing of the various solar cookers has been greatly delayed by adverse weather conditions (clouds and cold temperature) and personnel shortages. In addition, although the initial contract called for the use of the FSEC solar simulator, due to technical difficulties, being that the simulator is not working, it has not been possible to use the simulator.
Appendix A Solar Cooker Project Report, 5 July 2001 Appendix B Solar Cooker Reflector Optical Evaluation and Design Evolution Appendix C FSEC Solar Cooker Design: Optical Ray Trace Analysis Appendix D Investigation of Reflective Materials for the Solar Cooker Appendix E Corrugated plastic material: Request to manufacturer and manufacturer quotes Appendix F An Analysis of Greenhouse Cookpot Design Considerations for Low-Cost Solar Cookers Appendix G Investigation of Polycarbonate as a Suitable “Greenhouse” Material for Solar Cookers Appendix H Testing and Reporting Solar Cooker Performance, ASAE Standard: ASAE X580 (Draft prepared for Solar Energy Committee SE-414 by Paul Funk on 25/07/2001) Appendix I Glazing Transmissivities

26