Fenestration studies on building energy using the facade ...
85
UNLV Theses, Dissertations, Professional Papers, and Capstones 12-2011 Fenestration studies on building energy using the facade Fenestration studies on building energy using the facade evaluation facility evaluation facility Wendell Cocina University of Nevada, Las Vegas Follow this and additional works at: https://digitalscholarship.unlv.edu/thesesdissertations Part of the Architectural Engineering Commons, Environmental Design Commons, Mechanical Engineering Commons, Natural Resources and Conservation Commons, and the Sustainability Commons Repository Citation Repository Citation Cocina, Wendell, "Fenestration studies on building energy using the facade evaluation facility" (2011). UNLV Theses, Dissertations, Professional Papers, and Capstones. 1289. http://dx.doi.org/10.34917/2839037 This Thesis is protected by copyright and/or related rights. It has been brought to you by Digital Scholarship@UNLV with permission from the rights-holder(s). You are free to use this Thesis in any way that is permitted by the copyright and related rights legislation that applies to your use. For other uses you need to obtain permission from the rights-holder(s) directly, unless additional rights are indicated by a Creative Commons license in the record and/ or on the work itself. This Thesis has been accepted for inclusion in UNLV Theses, Dissertations, Professional Papers, and Capstones by an authorized administrator of Digital Scholarship@UNLV. For more information, please contact [email protected].
Transcript of Fenestration studies on building energy using the facade ...

UNLV Theses, Dissertations, Professional Papers, and Capstones
12-2011
Fenestration studies on building energy using the facade Fenestration studies on building energy using the facade
evaluation facility evaluation facility
Wendell Cocina University of Nevada, Las Vegas
Follow this and additional works at: https://digitalscholarship.unlv.edu/thesesdissertations
Part of the Architectural Engineering Commons, Environmental Design Commons, Mechanical
Engineering Commons, Natural Resources and Conservation Commons, and the Sustainability Commons
Repository Citation Repository Citation Cocina, Wendell, "Fenestration studies on building energy using the facade evaluation facility" (2011). UNLV Theses, Dissertations, Professional Papers, and Capstones. 1289. http://dx.doi.org/10.34917/2839037
This Thesis is protected by copyright and/or related rights. It has been brought to you by Digital Scholarship@UNLV with permission from the rights-holder(s). You are free to use this Thesis in any way that is permitted by the copyright and related rights legislation that applies to your use. For other uses you need to obtain permission from the rights-holder(s) directly, unless additional rights are indicated by a Creative Commons license in the record and/or on the work itself. This Thesis has been accepted for inclusion in UNLV Theses, Dissertations, Professional Papers, and Capstones by an authorized administrator of Digital Scholarship@UNLV. For more information, please contact [email protected].

FENESTRATION STUDIES ON BUILDING ENERGY USING THE FAÇADE
EVALUATION FACILITY
By
Wendell Concina
Bachelor of Science Degree in Mechanical Engineering
University of Nevada, Las Vegas
2009
A thesis submitted in partial fulfillment
of the requirements for the
Master of Science Degree in Mechanical Engineering
Department of Mechanical Engineering
Howard R. Hughes College of Engineering
The Graduate College
University of Nevada, Las Vegas
December 2011

Copyright by Wendell Concina, 2011
All Rights Reserved

ii
THE GRADUATE COLLEGE
We recommend the thesis prepared under our supervision by
Wendell Concina
entitled
Fenestration Studies on Building Energy Using the Façade Evaluation
Facility
be accepted in partial fulfillment of the requirements for the degree of
Master of Science in Mechanical Engineering Department of Mechanical Engineering
Robert Boehm, Committee Chair
Suresh Sadineni, Committee Member
Yitung Chen, Committee Member
Yahia Baghzouz, Graduate College Representative
Ronald Smith, Ph. D., Vice President for Research and Graduate Studies
and Dean of the Graduate College
December 2011

iii
Abstract
The project was developed to assess several types of facades and their influence on
building energy, mainly focused on windows and other building fenestrations.
Requirements for the facility are stated in this paper alongside corresponding solutions.
The facility is designed to represent a section of a building façade. Experimenting on a
wide range of fenestrations including windows with integrated PV elements was the
primary prerequisite. The option of removable façade configurations was used and
allowed testing specimens to be changed effortlessly. Instrumentation and data
acquisition are discussed including calibration and uncertainty analysis. Investigation of
the air conditioning unit was concluded during the calibration stage. Fenestration
property measurements such as the thermal and optical performance have been evaluated
for several windows. Theoretically calculated values and experimental data are
compared. Data acquired demonstrate the influence the façade has on the building energy
loads. Additional research into these characteristics assists in improving building energy
efficiency. Moreover, outcomes of the results are analyzed for residential or commercial
purposes, giving practical information for wide-ranging conditions. Further testing of
different types of facades will continue and comparisons can be inferred between
specimens. Development of the data will help provide valuable information for energy
efficient building design.

iv
Acknowledgments
This development was funded by the U.S. Department of Energy, through the Nevada
Renewable Energy Consortium (NVREC).
Immense gratitude goes toward Dr. Robert Boehm for the opportunity to work at the
Center for Energy Research and his support and patience throughout the process. I would
also greatly thank Dr. Suresh Sadineni for his added insight and assistance. As my
primary advisors, they provided me with the proper direction and tools necessary to
succeed. For these reasons, I am forever indebted to my advisors for their invaluable
guidance.
It was a great pleasure to have Dr. Yitung Chen and Dr Yahia Baghzouz as my
committee members and appreciate their contributions and guidance not only for me but
for the entire Center for Energy Research. Without careful attention to research, progress
will be halted. Thank you to the entire UNLV Mechanical Engineering Department staff
for making this process a pleasant experience.
Special regards go to Rick Hurt (Research Engineer) and to my fellow colleagues at the
Center for Energy Research for their immeasurable aid in the project. I have a great deal
of respect for each one of them and thanks for all the knowledge bestowed upon me.
Lastly, thank you to my family and friends for everything they have done. I am very
fortunate to have such a supportive cast. Thank you to everyone and I wish you the best
on your future endeavors.

v
Table of Contents
Abstract .............................................................................................................................. iii
Acknowledgments.............................................................................................................. iv
Table of Contents ................................................................................................................ v
List of Figures ................................................................................................................... vii
List of Tables ..................................................................................................................... ix
Chapter 1: Introduction ....................................................................................................... 1
Chapter 2: Literature Review .............................................................................................. 7
2.1 Theoretical Window Analysis................................................................................... 7
2.2 Window Structural Analysis ..................................................................................... 8
2.3 Economic Analysis ................................................................................................... 8
2.4 Window Laboratory Testing ..................................................................................... 9
2.5 Facade Testing Facilities......................................................................................... 10
Chapter 3: Development of Facility .................................................................................. 14
3.1 Fundamental Requirements .................................................................................... 14
3.1.1 Physical Unit Requirements ............................................................................. 14
3.1.2 Experimental Data Requirements .................................................................... 17
3.2 Preparation and Installation .................................................................................... 20
3.2.1 Preparation ....................................................................................................... 21
vi
3.2.2 Installation........................................................................................................ 27
Chapter 4: Methodology ................................................................................................... 37
4.1 Test methodology.................................................................................................... 37
4.2 Analytical Model .................................................................................................... 38
4.3 Calibration............................................................................................................... 44
4.4 EER Correlation ...................................................................................................... 46
4.5 Uncertainty Analysis ............................................................................................... 50
Chapter 5: Results and Discussion .................................................................................... 53
5.1 Fenestration Value Comparisons ............................................................................ 53
5.2 Building Energy Simulations .................................................................................. 57
5.3 Facility Improvements ............................................................................................ 65
Chapter 6: Conclusion....................................................................................................... 66
References ......................................................................................................................... 67

vii
List of Figures
Figure 1 - 3D Model Representation of the Façade Evaluation Facility with Double Pane
Glazing Facade.................................................................................................................. 16
Figure 2 - 3D Model Representation of the Façade Evaluation Facility with Carousel and
Personnel Door Placement ................................................................................................ 16
Figure 3 - Shading Analysis First Half of the Year .......................................................... 22
Figure 4 - Shading Analysis Second Half of the Year ...................................................... 23
Figure 5 - R-Value Required for Given Heat Gain Fraction ............................................ 26
Figure 6 - Façade Evaluation Facility (Closed Position) Location and Setup .................. 28
Figure 7 - Insulation Installation in the Facility ................................................................ 29
Figure 8 - Fully Insulated Test Setup ................................................................................ 30
Figure 9 - Personnel Door and Air-Tight Staggered Insulation Plug ............................... 31
Figure 10 - Electrical and Data Logging Components ..................................................... 32
Figure 11 - Mini Split Ductless A/C System .................................................................... 33
Figure 12 - RH, Temperature and Heat Flux Sensors (Pictured from left to right) .......... 34
Figure 13 - Precision Spectral Pyranometer ..................................................................... 34
viii
Figure 14 - Sensors Connected to the Datalogger and Interfacing with a Computer ....... 35
Figure 15 - Facade Interchangeability .............................................................................. 36
Figure 16 – R-Value of Insulation at Given Temperature ................................................ 39
Figure 17 - Mathematical Model vs. Experimental Data Comparison for Fully Insulated
Calibration Setup .............................................................................................................. 44
Figure 18 - Energy Transfer Comparison between Estimated and Measured Values ...... 46
Figure 19 - Energy Efficiency Ratio for given Temperature Difference (Δ°C) ............... 48
Figure 20 - Basic Fitting of the EER for given Temperature Difference Data ................. 50
Figure 21 –Variation of Uncertainty for Heat Transfer through the Window .................. 52
Figure 22- Double-Paned Window Setup ......................................................................... 54
Figure 23 – Triple-Paned Window Setup ......................................................................... 55
Figure 24 – Building Energy Simulation of Cooling Load Requirements for a Code
Standard Home in Las Vegas, NV .................................................................................... 59
Figure 25 - Effects of SHGC on Annual Heating and Cooling Loads.............................. 62
Figure 26 - Effects of U-Factor on Annual Heating and Cooling Loads .......................... 63

ix
List of Tables
Table 1 – Major Structural and Temperature Control Components ................................. 18
Table 2 – Major Relevant Measurement Sensors ............................................................. 19
Table 3 – Major Data Acquisition Components ............................................................... 20
Table 4 – Weather Station Irradiance Data ....................................................................... 24
Table 5 – Weather Station Meteorological Data............................................................... 25
Table 6 – Window 6.3 Fenestration Calculated Values Compared to FEF Fenestration
Experimental Values of Window Glazing ........................................................................ 57
Table 7 – Influence of Window Fenestration Properties on Building Energy during the
Summer Period.................................................................................................................. 60

1
Chapter 1: Introduction
Sustainability and energy efficiency are the prime objectives influencing contemporary
energy policies. Several government entities are dedicated to limiting greenhouse gas
emissions. The urgency of transitioning to a low-carbon economy is escalating due to
climate change. Buildings represent significant amounts of energy consumed, primarily
consisting of heating and cooling energy usage [1,2]. Forty percent of United States
(U.S.) primary energy utilization is consumed by buildings, which contributes up to
thirty-nine percent of the carbon dioxide (CO2) emissions in the U.S. These buildings
also account for seventy-two percent of the total electricity consumption in the U.S. [3].
Residential buildings in the U.S. consume over twenty percent of the annual energy usage
[4]. Other nations also exhibit comparable figures. Global contribution towards energy
consumption from buildings (residential and commercial) has increased steadily between
twenty and forty percent in developed nations, exceeding other major sectors such as
industrial and transportation. Population growth, improved standard of living, demand for
building services and comfort levels, alongside the upward trend of time spent in
buildings assure that the energy demand will continually rise in the future. Due to these
facts, it is reiterated that building energy efficiency is an important matter for energy
policy at the regional, national and international levels [3,5].

2
Research directed by the Department of Energy (DOE) to reduce energy usage aids in
promoting more energy conscious building designs. A DOE sponsored program set goals
to reduce new residential buildings’ energy use by seventy percent and provide thirty
percent of additional onsite power generation by 2020. Additionally, the program plans to
integrate the building’s envelope with its mechanical systems for optimal energy savings.
The building envelope includes walls, windows, roof and foundation. The mechanical
systems include the space/water heating, cooling and ventilation. This essentially turns
the façade into a multifunctional system that plays a major role in building energy [4].
The significance of facades toward energy efficiency and sustainability is exemplified by
advancements of facades touted as high-performance commercial building facades.
Several technological techniques and designs for high performance façades are based on
central concepts such as space conditioning, ventilation, daylighting, and solar heat gain
control. One method of solar heat gain control can be accomplished through the use of
spectrally selective glazing which permits certain portions of the solar spectrum to
transmit through the window and into the building while rejecting any undesired portions.
Daylighting is provided while decreasing solar heat gain, thus reducing building energy
consumption and peak demand. Warm and cold climates can benefit from this technology
because of its solar radiation transmission properties and can be applied to residential or
commercial buildings. Additional solar control window technologies include angular
selective control, solar filters and exterior solar control. Natural ventilation and double
skin facades use a second layer for heat recovery during cold winters and heat extraction

3
during the summer. This offers the opportunity to utilize an all-glass façade for
aesthetically desirable arrangements while providing natural ventilation. Vacancy in the
cavity of the double-skin façade can be taken advantage of by implementing a shading
apparatus. Active facades provide dynamic fine-tuning of optical and thermal properties
in response to climate, occupant preferences, and building energy management control
system requirements. With the combination of these concepts, improved indoor air
quality, enhanced energy efficiency, thermal comfort and occupant performance can be
achieved. Moreover, downsized mechanical equipment capacity requirements and
reduced operating costs for building owners are achieved [6]. Along with glazing, the
building envelope also plays a vital role in energy efficient design. This is especially true
in hot and dry climates where a building envelope of greater thermal mass can deliver a
greater time lag for the transmission of outdoor temperature into the conditioned space.
Careful attention must be considered while applying appropriate strategies for each
unique climate since varying degrees of performance and benefits are realized [1].
An important part of a façade is the glazing component. Emerging glazing technologies
include: insulation-filled glazing, evacuated windows, building integrated photovoltaics
(BIPV), and smart windows (photochromics, thermochromics, liquid crystal device
windows, suspended particle device windows, electrochromic windows, gasochromic
windows, motorized shading) [7].

4
Insulation-filled glazing has several options such as aerogel, honeycombs, and capillary
tubes between glazing panes. This type of glazing provides diffuse light and is less
transparent than standard window glazing. Aerogel is used to prevent convection since
the material can entrap air while still allowing light to pass. Conduction is also reduced
since the cell sizes are smaller than the mean free path of the air. Long-wave thermal
radiation is also virtually eliminated due to the multiple cell walls where the radiation is
absorbed and reradiated. Evacuated windows contain no gas in the gaps between the
panes. No convective or conductive heat transfer will occur between the glass panes
when the vacuum pressure is low enough. The main drawback of this type of window is
its structural integrity since it needs to withstand the normal air pressure and variable
pressures from sources of wind and vibration. It must also handle large thermal stresses
[7].
Smart windows are considered multi-functional and may provide added utility. These
facades can have active and passive features. Reduced energy usage and increased
comfort are some of the benefits of these facades. Passive devices include photochromics
and thermochromics. Active devices include liquid crystal, suspended particle and
electrochromics. Photochromic materials adjust transparency according to the intensity
of light. These materials dim when exposed to bright light and become transparent when
minimal light is present. Thermochromics have variation in transparency in response to
temperature. Liquid crystal device windows serve as a privacy glazing. It can scatter light
and create a translucent layer, and when power is applied the glazing can become

5
transparent. Suspended particle device windows act similarly to the liquid crystal. Of the
switchable technologies, electrochromic windows are the most promising. It has a great
range in adjustable transmission. Gasochromic windows provide a similar effect as
electrochromic windows [7].
Building integrated photovoltaic cells can provide electricity generation to augment the
building energy usage. Photovoltaic (PV) cells can be integrated within a double skin
façade. Ventilation on the rear side of the PV can lower operating temperatures and
prevent overheating. Benefits to this technique include increased cell efficiency and
waste heat recovery. Optimized percentage of the transparent window and opaque PV can
provide balanced daylighting with maximized electricity generation depending on the
situation. Many variables such as the climate, room depth, lighting loads, U-value,
glazing type, and the shading device are encompassed in this evaluation. Photovoltaic
cells can be incorporated into numerous innovative designs that can lead to improved
performance [8–11]. Aside from the energy efficiency standpoint, façades provide
multiple purposes and can serve as a weather shield, a fire retardant, a source of lighting,
a power generation source, and a ventilation source for heating and cooling [9].
The perceived economic benefits for energy efficient buildings include decreased
operating costs by nine percent, increased building value by seven and half percent, an
improved return on investment by about six percent and an increase in occupancy ratio by
three and half percent [12]. Benefits of energy saving measures are also highly regarded

6
by the consumer with the energy saving benefits, environmental benefits, and comfort
benefits attributing to the positive opinion [13].
Due to the complexity of facades, each specific façade component and concept should be
quantitatively evaluated in order to provide performance insights for the building
designers. Providing information on different facades and concepts will aid in overall
energy efficient building design [6]. For this reason, the Façade Evaluation Facility (FEF)
was developed. The Façade Evaluation Facility (FEF) was developed to assess façade
components and provide insight on the overall performance of different façades based on
the thermal and solar characteristics exhibited from testing.

7
Chapter 2: Literature Review
2.1 Theoretical Window Analysis
Window fenestration programs and simulations were used to theoretically determine the
U-Value and Solar Heat Gain Coefficient (SHGC) of glazing. A popular publically
available computer code used for heat transfer analysis using methods consistent with the
updated rating procedure developed by the National Fenestration Rating Council (NFRC)
that is consistent with the ISO 15099 standard is called WINDOW and was developed by
the Lawrence Berkeley National Laboratory (LBL) [14]. Pane spacing analysis in glazing
systems was completed using computer calculations and compared experimentally [15].
Triple paned window computer analysis was accomplished and optimum spacing and
gases were determined, although the analysis had no experimental method to verify the
U-factor [16]. Other types of glazing such as switchable glazing were also analyzed using
computer model programs for calculating the thermal and optical performance
parameters. The performance of the differing solar transmittance spectra, differences of
switching from transmission to reflecting versus transmitting to absorbing, and the effects
of position of the switchable glazing in a window were examined [17].

8
2.2 Window Structural Analysis
Stresses on the structure of the window units can result from temperature and pressure
differences experienced by the window. Multiple gap designs allow for pressure
equilibrium between the gas spaces. This significantly alleviates stresses on the exterior
glazing and eliminates pressure loading in the middle layer. This also helps lessen the
maximum deflection the unit will experience [18]. Research on triple paned windows and
their structural design was conducted for non-standard designs to encourage the use of
triple pane windows and shows promise but still requires further investigation [19]. Small
and large-scale tests revealing the window breakage characteristics of different glazing
samples were performed, including the amount of radiant transmission of energy through
the window. Necessary information is provided by the tests to evaluate the hazards of
radiant energy such as a fire in near proximity to exterior windows to building occupants
and contents. Triple pane windows had lower total transmittance, lower back-side
temperatures and heat flux than that of double-pane windows [20].
2.3 Economic Analysis
Other studies included the research on the environmental impact of advanced windows
and their global environmental impact. This included a life cycle assessment analysis of
the glazing system production, maintenance phase and a thermal balance of its utilization
phase. Cradle-to-grave analysis was completed. It has been proven that the most benefit

9
is gained during the utilization phase, significantly negating any slight increase in
production cost and environmental impact [21].
2.4 Window Laboratory Testing
Many window studies were performed using hot boxes to simulate different operating
conditions. An experiment determining the U-factor of a window with a long-wave high-
reflectivity venetian blind was completed by Fang. The tests were performed in a guarded
hot box configuration in accordance to the American Society of Testing and Materials
standards (ASTM). Two similar hot boxes were constructed and tested simultaneously for
a single and double pane window. The venetian blinds were tested at several angles. An
equation for the U-factor with corrections for wind velocity and to account for a window
frame was produced to provide estimated values. It was shown that the highly reflective
blinds can enhance the thermal insulation performance of the window by adjusting the
slat angle [22]. Another test using the same hot box configuration and windows was
conducted but with a curtain cloth. Two types of curtain cloths were tested, where one
was a dark colored thick cloth and the other being a light colored thin cloth. The effects
of cloth materials on window U-factors were studied. The U-factors can be calculated
using the experimental results and equations developed for the respective windows with a
given cloth curtain. These studies present fenestration results but the values do not

10
represent field test data and require the use of correction factors to determine
performance under realistic conditions [23].
2.5 Facade Testing Facilities
A Mobile Window Thermal Test (MoWiTT) facility was produced that measured the net
heat transfer through two window systems simultaneously [24]. The test facility was
initially developed to confirm the net energy performance estimations of fenestrations
and other complex elements of the building envelope [25]. Previous measurements of
fenestration characteristics were often calculations of instantaneous net energy
performance at certain design conditions. This method lacked quantitative estimates of
the energy consumption to help produce a cost benefit analysis. Also many tests are
performed in laboratory settings as described earlier. Field data would be beneficial.
Other disadvantages include fundamental errors discussed in the paper. For these reasons
the construction of the facility was under consideration. Initially, the best approach in the
design of the facility was determined to be a small test room where different fenestrations
can be mounted. Accurate measurements of the energy balance within the facility and
interior temperature control were early design requirements [25].
Further discussion on the several preceding methods of fenestration characteristic
measurements were established in a continuing paper [26]. Previous ways included the
“field test” approach where windows are tested in actual buildings and the energy inputs

11
are used in an energy simulation to provide the necessary results. Another method used
was a construction of a simplified test room where the fenestration is mounted. From the
energy input measurements, the net heat balance is concluded. These tests however do
not provide conclusive behavior on fenestration performance. These reasons demonstrate
the need for a facility specially designed for measuring the net energy performance.
Designing the facility required sources of error to be identified as well as the need to
produce sufficient quality data to provide conclusive answers on fenestration
performance. Energy efficient strategies employed in buildings yields smaller differences
in heat transfer, thus requiring high accuracy measurements. Several other topics
regarding error in sample buildings, limitations of field measurements and error for a
passive test cell justified the need for a specialized facility for measuring fenestration
energy flow.
The MoWiTT facility was built from the requirements stated earlier and was located at
Lawrence Berkeley Laboratory. It consisted of multiple mobile measurement modules,
with a centralized instrumentation van used to collect data. Each individual module
contains a pair of identical test rooms, each with one removable exterior wall and roof
panel. Direct comparative measurements between the fenestration systems exposed to in
the same weather conditions can be applied. The MoWiTT also had the capability to
relocate to different sites to expose the system to climates of interest. Realistic test
conditions are achieved using similar dimensions and materials of a typical building.
Measurement accuracy was examined for the instrumentations used [26].

12
Results from the MoWiTT are described in several papers [24,27]. Measurements are in
good agreement with computational program calculations. It was found that uncertainties
in thermal performance from solar gain effects overshadow the effects of improved U-
value. Also, the paper states there is still a need for improved methods for accounting
solar gain effects in windows performance comparisons to properly determine the overall
U-value benefits. With no method for treating thermal losses and solar gains, fenestration
energy calculations will remain uncertain [24].
The Passive Solar Components and Systems Testing Project (PASSYS) is located on the
site of the Building Research Establishment’s (BRE) Scottish laboratory in east Kilbride,
near Glasgow. It was constructed to determine the performance characteristics of a
window utilizing pre-heat background room ventilation. It consists of two heavily
insulated rooms with one being a test space and the other as a service room. The south
wall can accommodate the various passive solar components. The test cell was compared
with a theoretical model of heat transfer within the window. Clarification of the effect of
cavity width, ventilation rates, and low-e coating location were intended in the results
[28–30].
More recently, a test facility named the Testing Window Innovative Systems (TWINS)
was developed at the Department of Energetics at the Politecnico di Torino [31]. The
facility consists of two separate identical outdoor cells, where one is used as a reference
and the other houses different façade configurations. Field measurements of different

13
facades were completed, with the indoor conditions controlled. The façade configurations
were evaluated after a measurement campaign, which contained a mechanically
ventilated air gap and venetian blinds. Performance of the façades was evaluated and
currently the active façade is not recommended over opaque facades until further
improvements are attained [31].
14
Chapter 3: Development of Facility
3.1 Fundamental Requirements
Initial design requirements were established for the FEF and approaches to satisfy those
requirements then proceeded. Physical unit requirements and experimental data
requirements are presented in separate sections and solutions are discussed.
3.1.1 Physical Unit Requirements
Location of the experimentation site is handled outdoors. Since outdoor field testing is
necessary, the structure should be weatherproof. A steel shipping container was the most
appropriate candidate for this prerequisite. The structure is prebuilt and readily available.
When the façade is not in evaluation, protection of the unit should be provided. It was
decided that the opening to the main front doors should house the façade specimens, thus
allowing the doors to enclose and protect the contents within, during idle periods.
Clearance for the façade is taken into account. Because the opening for the main entry
doors accommodated the façade, a secondary means of entry was needed. Installation of a
personnel door thus provided access within the facility and its contents.
15
Due to outdoor exposure of solar radiation and high ambient temperature conditions,
insulation is essential in minimizing heat transfers within the facility through the walls
during summer periods. Calculation of an optimal insulation thickness was concluded.
Several varieties and dimensions of façade configurations are planned which require a
method of quick interchangeability during testing. In this case, each type of window is
installed in a structurally supported slab of insulation and can be placed into and removed
from the facility in a short period of time. Adjustment of orientation was also a
fundamental requirement. To fulfill this condition, a carousel can be installed underneath
the facility allowing manipulation of the orientation without difficulty.
With the physical design requirements addressed, a three-dimensional computer model
was rendered with SolidWorks. The subsequent figures exhibit the solutions to each
condition. An example of a façade specimen installed into the FEF is illustrated in Figure
1. This particular façade is double pane glazing. Figure 2 shows a rough representation of
the carousel including the personnel door placement located on the rear side of the
facility.

16
Figure 1 - 3D Model Representation of the Façade Evaluation Facility with Double Pane
Glazing Facade
Figure 2 - 3D Model Representation of the Façade Evaluation Facility with Carousel and
Personnel Door Placement

17
3.1.2 Experimental Data Requirements
Experimental data requirements for the FEF primarily entailed sensors of several types
and data logging equipment. Interior temperature control was also essential. Temperature
control within the facility is fundamental in replicating typical building settings.
Moreover, modest temperature differences between the interior and exterior of the façade
may yield limited and uncertain data for analysis. Significant temperature differences
between the façade interior and exterior can be generated with an air conditioner (AC)
system. A mini split ductless AC system was proposed. Although while increased
temperature difference between the façade interior and exterior is beneficial for data, the
temperature difference also exists between the interior and exterior walls which is
unfavorable as it increases the amount of heat transfer through the walls. This displays
the importance of proper insulation.
Measurement of meteorological data is required to provide the ambient conditions of the
testing location. Ambient temperature probes, pyranometers and a wind sentry were
housed in a weather station located adjacent to the FEF. Global horizontal irradiation,
ambient temperature, wind speed and wind direction are measured using
these meteorological sensors.
Solar irradiance measurement sensors required were a precision spectral pyranometer and
multiple standard pyranometers. The pyranometers measured the solar radiation hitting
the plane of the façade as well as the solar radiation transmitted through the facade. These
18
sensors are utilized to determine the optical fenestration characteristics of the facade.
Temperature probes, thermocouples, and heat flux sensors were required to measure the
temperature and heat flux throughout the facility. Primarily, heat gain through the façade
and walls of the unit are evaluated. These are all required to perform an energy balance of
the facility. Relative humidity and interior temperature data are also required
measurements.
Energy measurement sensors included a combination of Wattnodes® and current
transformers. Assessment of the energy consumption wass predominantly focused on the
AC unit. The data acquisition system consists of a datalogger and multiplexers placed in
an enclosure with a battery power supply for uninterrupted data. Data from all the sensors
previously mentioned are stored every minute and scanned every fifteen seconds. The
internal loads produced by the data acquisition equipment are considered negligible.
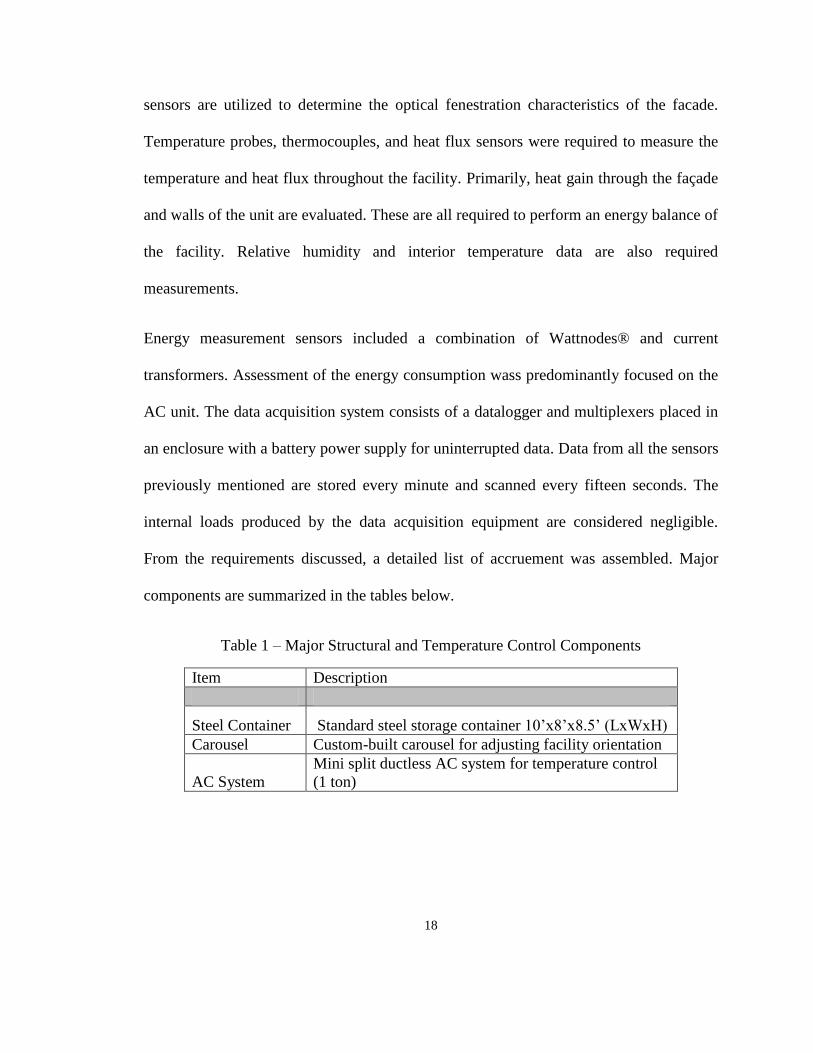
From the requirements discussed, a detailed list of accruement was assembled. Major
components are summarized in the tables below.
Table 1 – Major Structural and Temperature Control Components
Item Description
Steel Container Standard steel storage container 10’x8’x8.5’ (LxWxH)
Carousel Custom-built carousel for adjusting facility orientation
AC System
Mini split ductless AC system for temperature control
(1 ton)

19
Table 2 – Major Relevant Measurement Sensors
Item
Manufacturer
Part Description
Ambient
Temperature Probe
Campbell
Scientific 107-
L40
Temperature probe for outdoor ambient
temperature measurements (Range of -35°C to
+50°C)
Pyranometer
Campbell
Scientific
LI200X-L40
Pyranometer for global horizontal irradiance
measurements
Wind Sentry
R.M. Young
03002-LS12-
LD12
Wind speed sensor and wind direction sensor for
ambient wind conditions
Precision spectral
Pyranometer
Eppley
Laboratoy,
PSP
Precision spectral pyranometer and standard
pyranometers used for solar radiation
measurements on the façade
Wattnodes®
Continental
Control Syst.
WNB-3Y-208-
P
True RMS AC watt-hour transducer with pulse
output (solid state relay closure) proportional to
kWH consumed. Used to determine the energy
consumption of the AC unit
Current
Transformers
Continental
Control
Syst.CTS-
0750-yyy
Split core CTs with removable section, so that
they can be installed without interrupting the
circuit, used in conjunction with the wattnode.
Rated Amps 30
Temperature Probe
Campbell
Scientific 108-
L60
Temperature probe for interior temperature
measurements (-5°C to +95°C)
Thermocouples
Omega
Engineering
5TC-TT-K-20-
72
Thermocouples for interior surface wall
temperatures, type K calibration
Heat Flux Sensors
Omega
Engineering
HFS-4
Heat flux sensor for precise measurement of
heat loss or gain on any surface.

20
Table 3 – Major Data Acquisition Components
Item
Manufacturer
Part Description
Datalogger
Campbell Scientific
CR1000-ST-SW-NC
Measurement and control module
to acquire and log data from the
measurement devices. 16 single-
ended or 8 differential channels,
two pulse counters, three
excitation channels, and eight
control ports. 4 MB SRAM for
data storage, program storage and
CPU usage.
Analog Channel
Multiplexer
Campbell Scientific
AM16/32B-ST-SW
16 or 32 Channel Relay
Multiplexer. Provides additional
measurement ports for data
acquisition.
Switch Closure
Module
Campbell Scientific SDM-
SW8A-SW
8-Channel Switch Closure Input
Module. Provides additional
measurement ports for data
acquisition.
Enclosure
Campbell Scientific
ENC16/18-DC-NM
Weather resistant enclosure (16" x
18") with two conduit openings
Power Supply
Campbell Scientific
PS100-SW
12V power supply w/ charging
regulator and 7Ahr sealed
rechargeable battery
3.2 Preparation and Installation
Planning of the location and installation proceeded after the list of accruement was
prepared and each item was received.
21
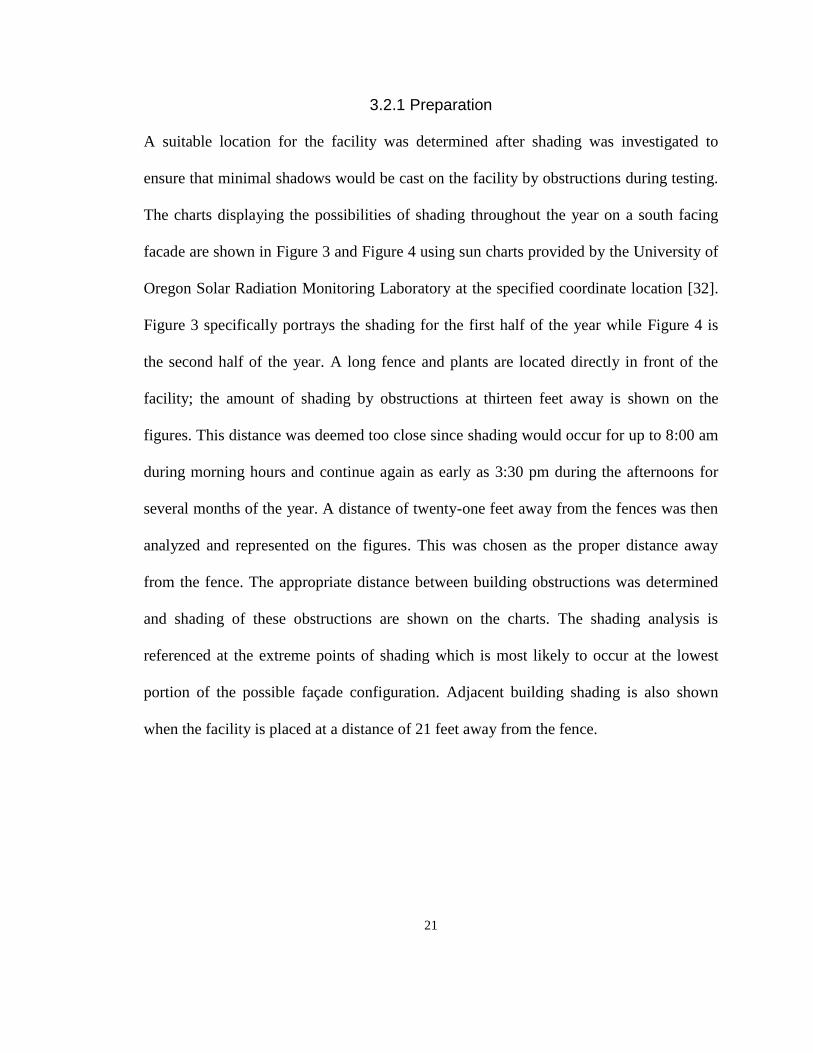
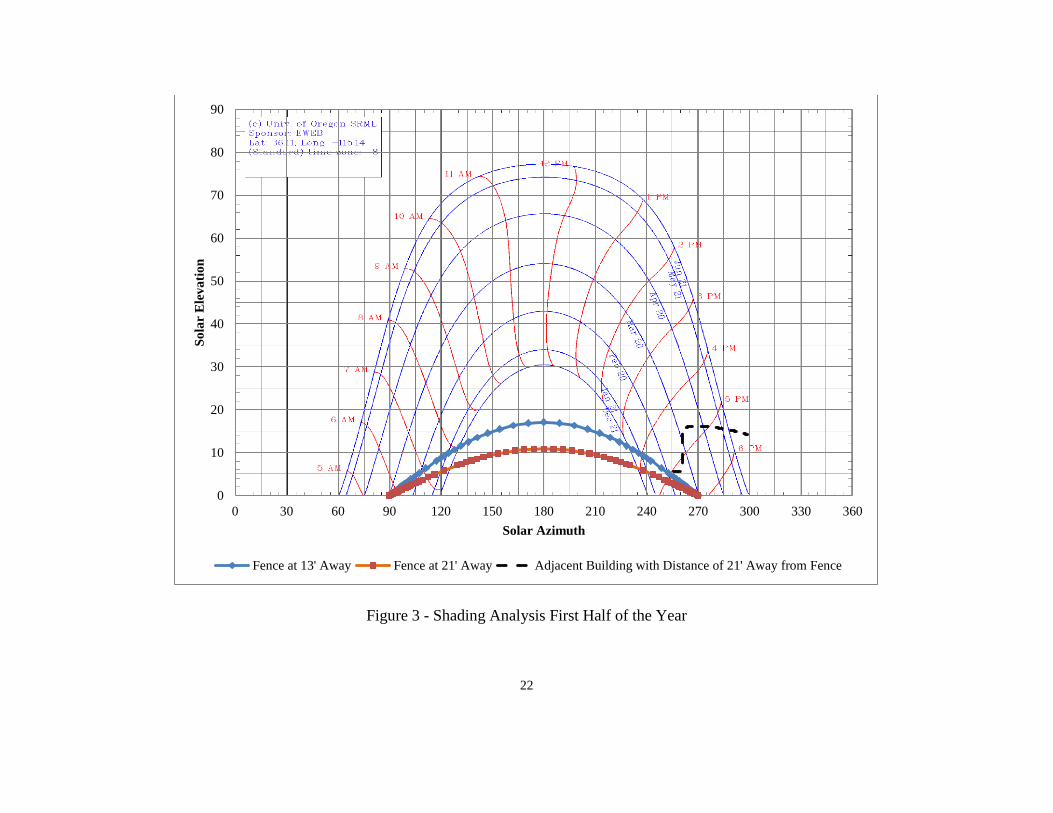
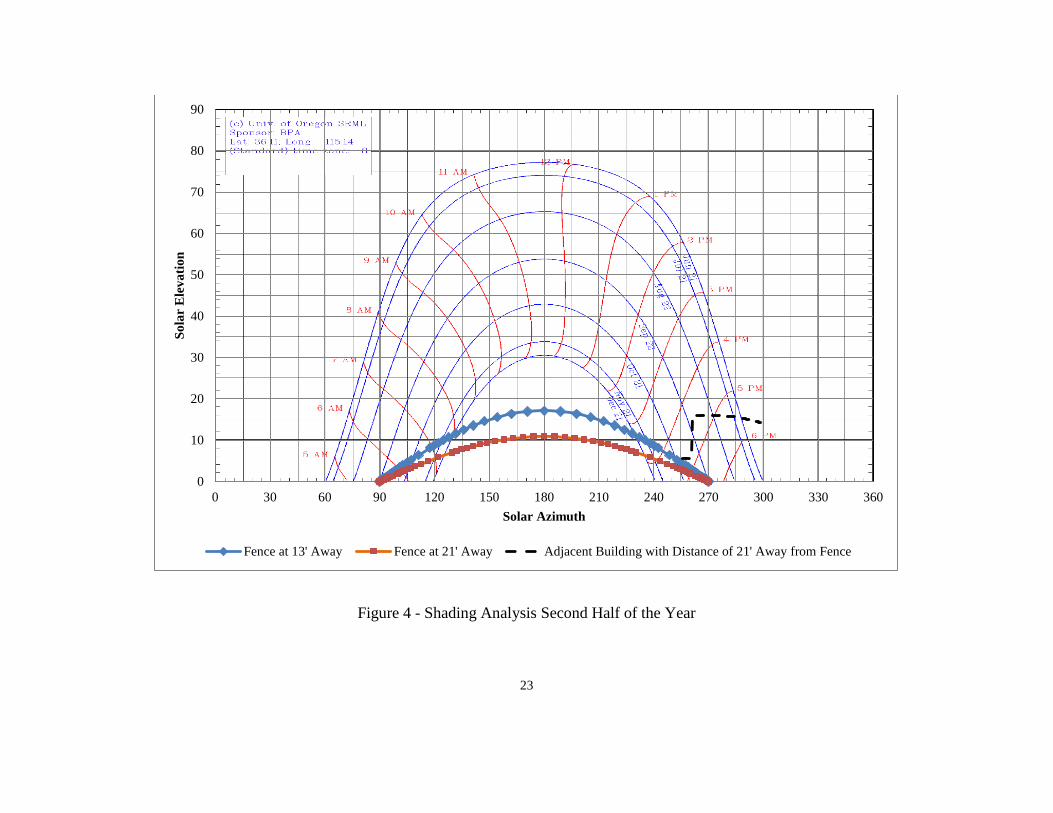
3.2.1 Preparation
A suitable location for the facility was determined after shading was investigated to
ensure that minimal shadows would be cast on the facility by obstructions during testing.
The charts displaying the possibilities of shading throughout the year on a south facing
facade are shown in Figure 3 and Figure 4 using sun charts provided by the University of
Oregon Solar Radiation Monitoring Laboratory at the specified coordinate location [32].
Figure 3 specifically portrays the shading for the first half of the year while Figure 4 is
the second half of the year. A long fence and plants are located directly in front of the
facility; the amount of shading by obstructions at thirteen feet away is shown on the
figures. This distance was deemed too close since shading would occur for up to 8:00 am
during morning hours and continue again as early as 3:30 pm during the afternoons for
several months of the year. A distance of twenty-one feet away from the fences was then
analyzed and represented on the figures. This was chosen as the proper distance away
from the fence. The appropriate distance between building obstructions was determined
and shading of these obstructions are shown on the charts. The shading analysis is
referenced at the extreme points of shading which is most likely to occur at the lowest
portion of the possible façade configuration. Adjacent building shading is also shown
when the facility is placed at a distance of 21 feet away from the fence.
22
Figure 3 - Shading Analysis First Half of the Year
0
10
20
30
40
50
60
70
80
90
0 30 60 90 120 150 180 210 240 270 300 330 360
So
lar
Ele
va
tio
n
Solar Azimuth
Fence at 13' Away Fence at 21' Away Adjacent Building with Distance of 21' Away from Fence
23
Figure 4 - Shading Analysis Second Half of the Year
0
10
20
30
40
50
60
70
80
90
0 30 60 90 120 150 180 210 240 270 300 330 360
So
lar
Ele
va
tio
n
Solar Azimuth
Fence at 13' Away Fence at 21' Away Adjacent Building with Distance of 21' Away from Fence

24
A weather station was setup on an adjacent building in close proximity to the FEF to collect
the meteorological data at the location. The weather station provides irradiance data in the
form of global horizontal, direct normal, diffuse horizontal summarized in Table 4.
Meteorological data include the ambient dry bulb temperature, wind speed and direction,
summarized in Table 5 [33,34].
Table 4 – Weather Station Irradiance Data
Irradiance
Measurement Unit Description
Global
Horizontal W/m
2
Total Hemispheric shortwave irradiance as measured
by an Kipp & Zonen Model CM3 Pyranometer with
calibration factor traceable to the World Radiometric
Reference (WRR).
Direct Normal W/m2
Direct (Beam) shortwave irradiance as measured by an
Eppley Laboratory, Inc. Model NIP (Normal Incidence
Pyrheliometer) mounted in an automatic sun-following
tracker, with calibration factor traceable to the WRR.
The estimated broadband Aerosol Optical Depth
(AOD) is also calculated using this instrument.
Diffuse Normal W/m2
Diffuse (Sky) shortwave irradiance is calculated using
the formula: Global = Direct * Cosine(Zenith) +
Diffuse.

25
Table 5 – Weather Station Meteorological Data
Meteorological
Measurement Unit Description
Dry Bulb
Temperature
oC
Ambient air temperature measured with an RM Young
1000 Ohm 4-Wire RTD inside in a naturally aspirated
radiation shield mounted on a pole at approximately 30
feet above ground. The wind chill temperature is also
calculated using the new National Weather Service
(NWS) method as described on the NOAA web site,
however the wind speed used is measured at approx.
30' instead of the 5' level required by the NWS
calculation.
Wind Speed and
Wind Direction m/s
Measured by an RM Young 4-blade propeller and
attached vane mounted on a pole at approximately 30
feet above ground. Peak Wind Speed is also recorded,
which is the maximum 1-sec anemometer reading
during the 1-minute interval.
The proper insulation thickness was determined after calculations were made, shown in
Figure 8, in order to reduce heat gain from each wall of the container. Insulation calculation
was conducted for the hottest day during the summer of previous years to present the most
extreme differences between the walls and windows. Summer sun altitudes in Las Vegas,
Nevada are very high so the amount of solar radiation transmitted through a south facing
window is less than that during winter when the sun is at lower angles. Methods and weather
information described by American Society of Heating Refrigerating and Air-Conditioning
Engineers (ASRHAE) and other widely available textbooks were used for the calculation
[35–37]. The approach was similar and more elementary to an analytical model discussed in
a later chapter. A plot of the wall insulation thickness vs. the heat gain factor (HGF) (defined

26
as the ratio between the heat gain through walls versus the windows) is shown in Figure 5.
As shown in the figure, as the insulation values increases the HGF decreases. However, the
decrease in HGF had reduced significance beyond an R-value of 40. Styrofoam insulation
sheets totaling a thickness of 10 inches and an R-value of 40 were used. The insulation
ensured in reducing heat gain experienced through the walls but in the extreme case, wall
heat gain plays a major role in overall energy transfer within the facility.
Figure 5 - R-Value Required for Given Heat Gain Fraction
0 10 20 30 40 50 60 70 80 90 1000
5
10
15
20
25
X: 40
Y: 0.6049
R-Values Required for Given Fraction
R-value Required
Heat
Gain
Fra
ction (
Walls
/Win
dow
s)

27
3.2.2 Installation
For the base structure, a steel shipping container shown in Figure 6 was used to handle the
outdoor weather conditions and for its durability. The container dimensions are 8.5ft (2.6m)
in height, 8ft (2.4m) wide, and 10ft (3m) long. The figure displays the facility at the chosen
outdoor location, which is at the Center for Energy Research at the University of Nevada,
Las Vegas [38]. The figure also shows the facility in its closed position, protecting the façade
and the equipment inside.
The carousel located underneath the facility was attached to the unit allowing the orientation
of the FEF to be set to desired testing conditions. The system is oriented to due south as the
default test setup since for vertical surfaces, the south orientation (for northern hemispheres)
experiences the most direct radiation over the course of entire day. Rotation of the shipping
container can be managed by a single person and can be locked into place to prevent
undesired rotation due to wind loads. Electrical power for the FEF is located outside of the
facility and is led into the facility through a single cable. The provided electricity is used for
the sensors, instrumentation, data logging, and most importantly the air conditioning system.

28
Figure 6 - Façade Evaluation Facility (Closed Position) Location and Setup
The next step of installation was insulating the facility. An optimal insulation thickness of 10
inches (0.254 m) of polystyrene insulation was concluded and applied inside the unit.
Eliminating infiltration was an important criterion; therefore air-tight fitting of the insulation
was essential. To accomplish this goal the insulation was staggered to eliminate the existence
of any continuous seams from the exterior into the interior. Insulation was installed inside the
shipping container as shown in Figure 7. From the figure, the staggered arrangement of the
insulation can be seen.
29
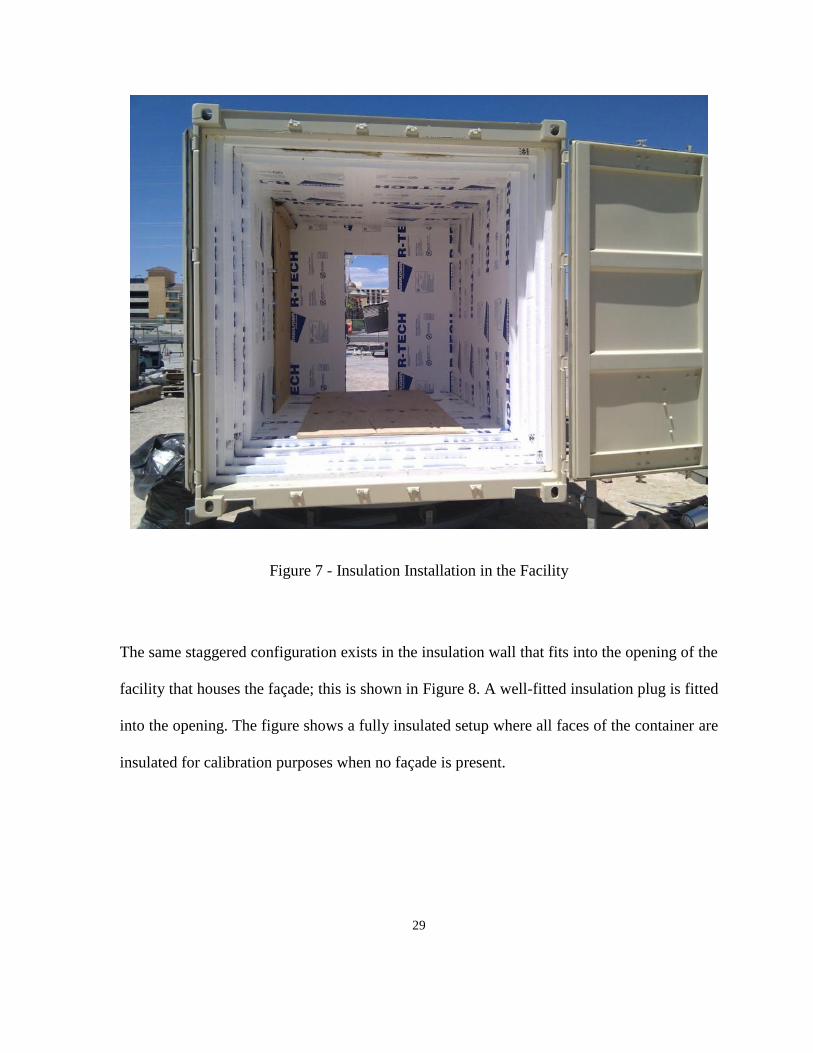
Figure 7 - Insulation Installation in the Facility
The same staggered configuration exists in the insulation wall that fits into the opening of the
facility that houses the façade; this is shown in Figure 8. A well-fitted insulation plug is fitted
into the opening. The figure shows a fully insulated setup where all faces of the container are
insulated for calibration purposes when no façade is present.

30
Figure 8 - Fully Insulated Test Setup
Since the main doors accommodated the façade, a secondary personnel door located on the
opposite side was installed. Access inside the facility is possible with the personnel door
depicted in Figure 9. The personnel door is sealed with an insulation plug similar to the main
door. Notice the staggered appearance of both the plug and the entry door. They are made to
fit together to prevent air infiltration as stated for the main doors.

31
Figure 9 - Personnel Door and Air-Tight Staggered Insulation Plug
Following the insulation installation, electrical and data logging equipment were installed.
Figure 10 displays the electrical source found outside of the facility on the left, with the
lighting, interior electrical components and data acquisition equipment shown on the right.

32
Figure 10 - Electrical and Data Logging Components
Interior climate control was achieved by installing a mini-split ductless air conditioning
system. Figure 11 displays the interior air handler on the top with the corresponding
condenser unit located outside of the container shown on the bottom of the figure. Separating
the outdoor compressor/condenser and indoor air-handling unit allows for reduced
infiltration. Only a small single penetration was required through the wall of the facility for
A/C purposes, thus reducing energy transfers from undesired sources.

33
Figure 11 - Mini Split Ductless A/C System
Temperature probes, relative humidity and heat flux sensors were installed within the facility.
Heat flux sensors were placed in various faces of the facility to properly determine the
amount of heat transfer that is experienced throughout. Ambient temperature as well as
relative humidity is recorded with the sensors located at the center of container, suspended in
air. These sensors are shown in Figure 12.

34
Figure 12 - RH, Temperature and Heat Flux Sensors (Pictured from left to right)
Figure 13 shows the installation of the precision spectral pyranometer located behind a
double pane window to measure transmitted solar radiation.
Figure 13 - Precision Spectral Pyranometer

35
Current transformers and Wattnodes® were installed to measure the energy the air
conditioning unit draws. Figure 14 displays the installation of the sensors into the datalogger.
The figure also shows how a computer interfaces with the data acquisition system. After the
data is collected, data analysis can begin.
Figure 14 - Sensors Connected to the Datalogger and Interfacing with a Computer

36
Facades that are transparent (windows) as well as opaque portions of the façade (exterior
wall/cladding) are primarily considered for evaluation in the FEF. The facility is a complete
standalone unit designed to represent a section of a building façade. Measured results can
include fenestration properties such as thermal and optical properties of the windows. The
data can show the influence the façade has on the building energy loads.
The ability to change the façade was the main goal of the facility to allow for evaluation of
numerous types and sizes of façade configurations. To allow for this, a method of
interchangeability was developed. For each type of facade element of interest, a structurally
supported slab of insulation was created to accommodate the placement of the item. This is
then inserted into the container and can be removed for other types at any given time as
depicted in Figure 15, which shows from left to right: no facade, a fully insulated test setup
for calibration purposes, and a double pane window setup for baseline testing.
Figure 15 - Facade Interchangeability

37
Chapter 4: Methodology
4.1 Test methodology
To summarize the description of experiment and methodology, temperature control within
the unit is fundamental in reproducing standard building conditions. This allows for a better
representation of façade element characteristics for its applicable purposes since varying
temperature difference between the indoor and outdoor conditions allows for enhanced
understanding of the data and characteristics. Ambient temperature, global horizontal, direct
normal solar radiation, wind speed and wind direction are measured at the location. The
interior walls, including the floor and ceiling, have heat flux sensors placed on each surface.
When a window is being evaluated, heat flux sensors are attached to the glazing and window
frame. Several pyranometers and a precision spectral pyranometer measured the transmitted
radiation through the window. Appropriate radiation shielding was used when considering
heat flux sensors exposed to solar radiation. Surface temperature is also measured with the
type-K thermocouples that are attached to the heat flux sensors. In order to observe potential
stratification of the environmental temperature inside the facility, three temperature probes at
evenly spaced heights are held in the air at the center of the unit. A relative humidity sensor
is also suspended at the center of the unit. These measurement sensors will examine changes
in the interior conditions of the facility.

38
Energy transfer within the building can be correlated with the amount of energy consumed by
the air conditioner. Accurate measurements of air conditioner energy usage and its
cooling/heating effect are vital. Energy usage by the air conditioner is measured by a
combination of Wattnodes® and current transformers. Data acquisition hardware is placed
inside of an enclosure with a dedicated power supply installed within the FEF. The data
acquisition system scans the sensors multiple times a minute and records averaged values of
the data onto a table every minute.
4.2 Analytical Model
A simplified analytical mathematical model was produced to validate the heat transfer
measurements in the experiment. Methods to produce the model were utilized with
procedures found in widely accepted literature [35,36,39]. During the summer, August 15
and 16, meteorological data were gathered as well as experimental data from the facility for a
fully insulated setup. Meteorological data collected were global horizontal irradiance, direct
normal irradiance, diffuse horizontal irradiance, and dry bulb temperature. Wind speed and
direction data were available but the convection heat transfer on the outside of the surface
was assumed to be constant for simplification. The coordinates of the facility were given as
36.11 latitude and -115.14 longitude. Tilt, azimuth and dimensions for each surface of the
facility were determined. Insulation properties such as the specific heat capacity, thermal
resistance, thermal conductivity, and density were obtained [40,41]. Interpolation and

39
extrapolation of the data were performed when necessary such as the thermal resistance
shown in Figure 16. The thermal conductivity of the steel container was also determined
[42].
Figure 16 – R-Value of Insulation at Given Temperature
Sun angles and properties were then determined. The declination of the sun is calculated for
each hour using equation (1) below.
0 20 40 60 80 100 1203.8
4
4.2
4.4
4.6
4.8
5
5.2
Temperature (deg F)
R-V
alu
e (
Therm
al R
esis
tance)
[hr*
ft2*F
/BT
U p
er
inch]

40
(1)
Where B is given as the nth day of the year in equation (2),
(2)
The equation of time is approximated with the following equation (3) expressed in minutes.
(3)
Local standard time (LST) and local standard meridian pacific (LSM) were required to
determine the apparent solar time (AST) shown in (4).
(4)
The hour angle (ω) was calculated using the apparent solar time and is shown in (5).
(5)
Solar altitude and zenith angle were calculated using equation (6) and (7). Where L is the
latitude, δ is the declination, and ω is the hour angle.
(6)
(7)
The solar azimuth angle, were then determined using equations (8) and (9).
(8)
41
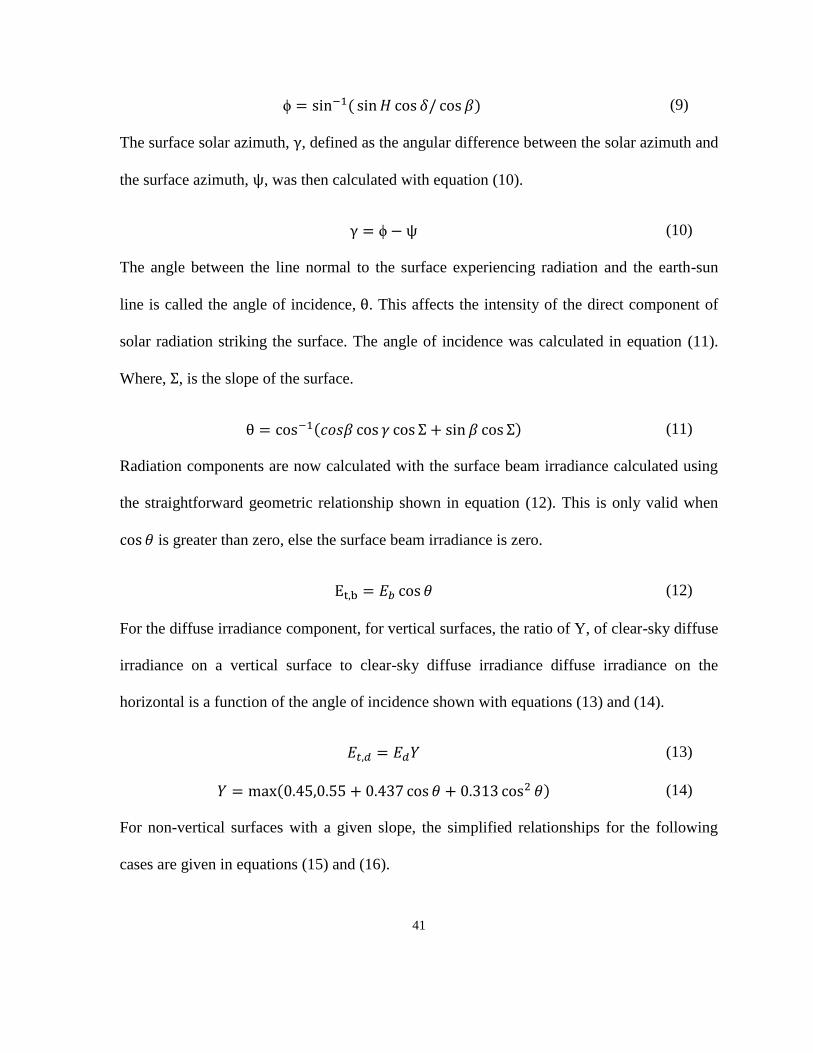
(9)
The surface solar azimuth, , defined as the angular difference between the solar azimuth and
the surface azimuth, , was then calculated with equation (10).
(10)
The angle between the line normal to the surface experiencing radiation and the earth-sun
line is called the angle of incidence, . This affects the intensity of the direct component of
solar radiation striking the surface. The angle of incidence was calculated in equation (11).
Where, , is the slope of the surface.
(11)
Radiation components are now calculated with the surface beam irradiance calculated using
the straightforward geometric relationship shown in equation (12). This is only valid when
is greater than zero, else the surface beam irradiance is zero.
(12)
For the diffuse irradiance component, for vertical surfaces, the ratio of Y, of clear-sky diffuse
irradiance on a vertical surface to clear-sky diffuse irradiance diffuse irradiance on the
horizontal is a function of the angle of incidence shown with equations (13) and (14).
(13)
(14)
For non-vertical surfaces with a given slope, the simplified relationships for the following
cases are given in equations (15) and (16).

42
(15)
(16)
For the ground reflected irradiance component for surfaces at any orientation is given by
equation (17). Where the ground reflectance is given as and was assumed to be constant at
0.3 for dry bare ground and desert.
(17)
The total surface irradiance is the sum of all these irradiance components. Irradiance on
every surface of the facility was calculated including the floor. The radiation properties of the
surface were then gathered such as the absorptivity of the surface, α, and the hemispherical
emittance of surface, ε. The interior properties were assumed to be constant at the desired
temperature condition of 25°C (77°F). Convective heat transfer coefficient for the outside
surface was assumed constant while the radiation heat transfer coefficient was a function of
the outside surface temperature. The convection and radiation heat transfer coefficients were
combined giving a heat transfer coefficient as h. The difference between the long wave
radiation incident on the surface from the sky and surroundings and radiation emitted by the
blackbody outdoor temperature was assumed to be zero for a vertical surface and a constant
for a horizontal surface. With the outside temperature given as to, this gives the heat flux into
an exterior sunlit surface to be equation (18). Surface temperature is given as ts.
(18)

43
Assuming the heat flux can be expressed in terms of sol-air temperature, te, the equation can
be given in the following equations for sol-air temperature and heat flux.
(19)
(20)
Using the flux and taking into account the thermal storage retained in the facility from the
thermal properties of the insulation, the total conduction heat transfer through the surfaces
was calculated. Each surface flux is multiplied by the corresponding surface area and
summed together to give the results shown in Figure 17. The model and the experimental
results show good agreement but since the model contains assumptions and simplifications
the accuracy cannot be exact. The purpose was to determine whether the experimental results
and mathematical model were of the same order and the figure more than represents that.

44
Figure 17 - Mathematical Model vs. Experimental Data Comparison for Fully Insulated
Calibration Setup
4.3 Calibration
During the summer climate, testing of the fully insulated setup was performed to calibrate the
experiment. The air conditioning unit maintained a desired temperature of 77°F. Results from
this setup will determine how much heat enters into the container without a window installed.
The approach of determining the overall heat gain was compared with the methods described
by the American Society of Heating, Refrigerating and Air-Conditioning Engineers
0
500
1000
1500
2000
2500
3000
3500
4000
0 5 10 15 20 25 30 35 40 45
En
erg
y T
ran
sfer
[B
TU
]
Time [hr]
Mathematical Model Experimental Data

45
(ASHRAE) [43]. The sensible and latent heat transfer conveyed by air on a volumetric basis
are shown in equations (21) and (22).
(21)
(22)
For the sensible heat transfer rate, is described as the air sensible heat factor, is the air
temperature difference across the process, and Q is the air volumetric flow rate. In the case of
the latent heat transfer rate, is described as the air latent heat factor, is the air humidity
ratio difference across the process. The estimated values required the air flow rate data from
the air conditioner. Inside and outside temperature measurements were used including the
humidity measurements. Using the equations, the energy transfer estimated was calculated
during a period of time in the summer. The estimated energy transfer was compared to the
measured values at the same time period. The measured values consisted of using the heat
flux sensors and the measured inside surface area. The measurements were conducted on a
summer day and are shown in Figure 18. The figure displays a good approximation of the
energy transfer.

46
Figure 18 - Energy Transfer Comparison between Estimated and Measured Values
4.4 EER Correlation
After comparing the measured heat gain within the facility with the mathematical model and
the sensible and latent heat transfer conveyed by air on a volumetric basis, analysis of the air
conditioner proceeded. Energy efficiency ratio (EER) is defined as the ratio of the cooling
capacity in Btu/h to the power input value in Watts at any given rating conditions expressed
in Btu/Wh according to the American National Standards Institute (ANSI). Seasonal energy
efficiency ratio (SEER) is the total heat removed from the conditioned space during the
6 8 10 12 14 16 182200
2400
2600
2800
3000
3200
3400
3600
Time (hr)
Energ
y T
ransfe
r (B
TU
per
hour)
Estimated
Measured

47
annual cooling season divided by the total electrical energy consumed by the air conditioner
during the same season [44].
The energy efficiency ratio of the air conditioner during the summer months was plotted
versus the temperature difference between the average interior temperature and the outside
air temperature as shown in Figure 19. The temperature difference is shown in degrees
Celsius. The EER of the air conditioning unit increased as the temperature difference
decreased. The overall seasonal energy efficiency ratio was about 16 for the particular unit
during the few months in the summer period while in the fully insulated setup. Higher values
of temperature difference show more consistency in EER values as would be expected. When
the temperature difference is low, other factors such as solar radiation and wind speed may
have influence which may cause the scattering.
After running the fully insulated setup for several months, data were gathered for the energy
efficiency ratio of the air conditioning unit. The following data were then plotted against the
temperature difference between the inside of the facility and the ambient temperature
conditions outside of the facility. This is shown in Figure 19.

48
Figure 19 - Energy Efficiency Ratio for given Temperature Difference (Δ°C)
With the usage of built-in functions in MATLAB, a polynomial curve fitting was employed
to determine the best curve fit for the data. After running different methods, it was found that
a fifth order polynomial curve fitting fit best with the data within the given ranges.
0 2 4 6 8 10 12 14 16 18 200
20
40
60
80
100
120
140
160
180
200
Temperature Difference (deg C)
EE
R o
f A
C

49
The coefficients of the polynomial given as p(x) of the degree given as n that fits the data
p(x(i)) to y(i) in a least squares sense. This gives the resulting p as a row vector of a length
n+1 that contains the polynomial coefficients in descending power shown in equation (23).
(23)
The coefficients of the polynomial curve fitting are given as 0.00029, -0.016, 0.31, -1.50, -
16.88, and 160.56. It is now possible to estimate the amount energy efficiency ratio at a given
temperature difference although due to the scattering of data it is not ideal. Figure 20 shows
the curve fitting at the fifth order polynomial with a temperature difference of zero to twenty
in small increments.

50
Figure 20 - Basic Fitting of the EER for given Temperature Difference Data
4.5 Uncertainty Analysis
Uncertainty analysis was performed for the instrumentation that measured the energy
transfers through the window. The heat flux and pyranometer sensors were mainly targeted.
Interpolation error, or zero-order uncertainty were accounted for the measurement of the
inside surface areas, the heat flux and pyranometer resolutions. Instrumentation uncertainty
was determined from the product specifications provided by the manufacture. Using methods
0 2 4 6 8 10 12 14 16 180
20
40
60
80
100
120
140
160
180
Temperature Difference (deg C)
EE
R o
f A
C
Basic Fitting of the EER vs. Temperature Difference Data

51
described in widely accepted literature, the uncertainty was determined using equation (24)
[45,46].
[(
)
(
)
(
)
]
(24)
Where,
uR = uncertainty in the experimental results
R = given function of the independent variables, x1, x2…xn
u1,u2,…un = uncertainty in the independent variables
Considering the uncertainty from each measurement of the devices and using the above
equation the overall measurement uncertainties were estimated and the results are plotted in
Figure 21. As shown in the figure the uncertainty decreased at higher heat transfer rates
through the window and is stabilized.

52
Figure 21 –Variation of Uncertainty for Heat Transfer through the Window
100 200 300 400 500 600 7003
3.5
4
4.5
5
5.5
6
Heat Transfer through the Window (BTU per hour)
Uncert
ain
ty %

53
Chapter 5: Results and Discussion
5.1 Fenestration Value Comparisons
Two window configurations were tested with one being a standard double paned window that
was easily accessible and another being a triple pane window requiring a special order to be
made. The double pane window is JELD-WEN 400 series and contains a clear pane and a
pane with low-e 366 glazing. The spacing between the panes is filled with argon gas. The
south facing window was tested for several weeks at a time during the summer months of
July through September with clear skies in Las Vegas (with latitude of 36.1°). The window
has an area of 4 ft. by 4 ft. and is a typical double glazed window commonly found in US
residential settings. Figure 22 shows the double-paned window testing configuration installed
onto the outside of the facility. The window had a manufacturer specified solar heat gain
coefficient of 0.23 and a U-Factor of 0.30 in U.S./I-P units provided by the manufacturer.

54
Figure 22- Double-Paned Window Setup
The triple-paned window was purchased and assembled from Davis glass (a local glass
company) and also had an area of 4 feet by 4 feet (1.49 sq. m). This window consisted of two
clear tempered glass panes and one single Sungate 500 glazing with low-e. Two air-gap
spaces exist within the glass panes. This configuration is shown in Figure 23. This window
was not a typical prebuilt window and as such did not come with a frame unless desired.

55
Figure 23 – Triple-Paned Window Setup
The experimental data for the window glazing were compared with a popular publically
available program used for heat transfer analysis using methods consistent with the updated
rating procedure developed by the National Fenestration Rating Council (NFRC) that is
consistent with the ISO 15099 standard is called WINDOW and was developed by the
Lawrence Berkeley National Laboratory (LBL). It is a widely accepted program and the
comparisons of the experimental data are shown in Table 6. Calculations made by the

56
program were determined at conditions where the inside air temperature was about 75°F
(24°C) and with an outside air temperature of about 90°F (32°C) for the summer period. The
condition for the amount of global solar radiation is given as 248 Btu/h-ft2 (783 W/m
2).
Averaged samples of the experimental data at these conditions were used to determine the
comparison values found in the table. The values for the triple-paned window are in good
agreement with the Window 6.3 evaluation. Testing during the double-paned window
presented larger errors in the U-factor. It was found that during testing water condensation
was found inside the gap in between the double-paned window suggesting that the argon
filled gap seal was compromised, thus releasing the argon within. This was changed in the
Window 6.3 program to represent the gap as filled with air. Values shown for the double
pane window were in good agreement when considering the air gap. It is worth noting that
the low-e glazing on the triple-paned unit performed worse than the glazing found on the
double-paned glazing while a slight increase in U-factor performance was seen.

57
Table 6 – Window 6.3 Fenestration Calculated Values Compared to FEF Fenestration
Experimental Values of Window Glazing
Window
Solar Heat
Gain
Coefficient
from Window
6.3
Solar Heat
Gain
Coefficient
from FEF
U-Factor
(Btu/h-ft2-F)
from
Window 6.3
U-Factor
(Btu/h-ft2-F)
from FEF
Jeld-Wen Series 400
Double-Paned Window
with Argon Gas
0.28 0.25 ±0.02 0.33 0.41 ±0.02
Jeld-Wen Series 400
Double-Paned Window
with Air Gap
0.28 0.25 ±0.02 0.41 0.41 ±0.02
Triple-Paned Window
with Sungate Low-e and
Air Gap
0.60 0.56 ±0.04 0.37 0.38 ±0.02
5.2 Building Energy Simulations
In an effort to quantify the results in the form of energy loads, building energy simulations
were performed. A building energy simulation program called Energy-10 developed by the
National Renewable Energy Laboratory (NREL) was used to run building energy simulations
of a typical code-standard home [47]. This also presents the results in a more practical and
applicable manner.
The 1,800 square feet floor area reference building was two stories. Construction of the wall
consisted of a standard 2x4 timber frame construction, softwood frame, sheathing, fiberglass
insulation, and drywall. Roof construction is similar to the wall construction but with
increased frame thickness and insulation. Several different sizes of double-paned windows

58
were used. There are a total of 19 windows evenly distributed around the reference home.
The total window gross area for the residential home is 300 square feet (27.9 sq. m) whereas
the total wall gross area is 2,762 square feet (256.6 sq. m).
A four-person household was assumed with occupancy profile set up for a typical residential
home provided by Energy-10. For comparison purposes a direct expansion cooling with gas
furnace HVAC system was selected and auto sized by the program with a continuous HVAC
schedule, and no setback temperatures. Other assumptions include the main entrance facing
south, no added thermal mass, and an unconditioned garage space. Remaining required
parameters were taken as default settings in the program. The cooling and heating
requirements were found from these simulations. Figure 24 shows the cooling demand load
for a building using JELD-WEN double-paned windows with the air gap. Other results
include the hourly solar gains, hourly envelope conduction gains, the total net zone cooling
load, which includes ventilation requirements (sensible and latent) were determined.

59
Figure 24 – Building Energy Simulation of Cooling Load Requirements for a Code Standard
Home in Las Vegas, NV
Comparison of the facility heat transfer through a 4x4 window to the building energy
simulation calculation of heat transfer through a 4x4 window for the summer months show
good agreement. For the yearly simulation, the building energy simulation utilizes typical
meteorological year (TMY) data and hence uses data from several different years to best
represent the meteorological conditions at the given time [48].
0 50 100 150 200 250 300 350 4000
0.5
1
1.5
2
2.5
3
3.5
Time (day)
Coolin
g L
oad (
kW
h)

60
Comparison between a standard double-paned window and the experimental values of the
JELD-WEN window has been performed using the fenestration data shown in Table 7. The
standard double-paned window in the building energy simulation has a U-factor of 0.65
Btu/h-ft2-F and a SHGC 0.40. The table shows the solar gains, conduction gains and overall
cooling electrical load for each building simulation. No shading apparatus was considered
and only summer months were evaluated. The overall benefits due to JELD-WEN compared
to standard double-paned window are shown. The benefits show the importance of choosing
the correct windows for the climate.
Table 7 – Influence of Window Fenestration Properties on Building Energy during the
Summer Period
Jeld-Wen Series 400
Double-Paned
Window with Air Gap
(U-Factor: 0.41 Btu/h-
ft2-F, SHGC:0.25)
Standard Double-
Paned Window with
Low-E Glazing in
Energy-10 Program
(U-Factor: 0.65 Btu/h-
ft2-F, SHGC:0.40)
Percent Reduced
Comparing Jeld-
Wen with
Standard
Window
Solar Heat Gain
(MMBTU) 5.91 11.86 50.15 %
Envelope
Conduction Gain
(MMBTU)
7.37 9.29 20.70 %
Cooling Load
(MWh) 4.33 5.06 14.48 %
Direct benefits of reduced solar heat gain coefficients are experienced during the summer
period, but this also equates to reduced heat gain during the winter months thus increasing
the space heating load. From the building energy simulation the JELD-WEN windows

61
required 45.92 MMBTU thermal heating energy when compared to the standard window
which only needed 44.22 MMBTU. This presents a 3.9% increase. To maximize the benefits
of each period, an active façade may be implemented to allow more solar heat gain during
the winter and reducing solar heat during the summer. For more accessible applications, the
fenestration properties will be analyzed to determine the optimal characteristics for this
climate.
Recommendations from Energy Star state that for the Las Vegas climate, a value of less than
or equal to 0.30 for both the U-Factor (Btu/h-ft2-F) and SHGC are ideal [49]. This value will
be used as the baseline. Adjusting the SHGC with the U-Factor fixed at 0.30, the effects of
SHGC on annual heating and cooling loads can be seen in Figure 25.
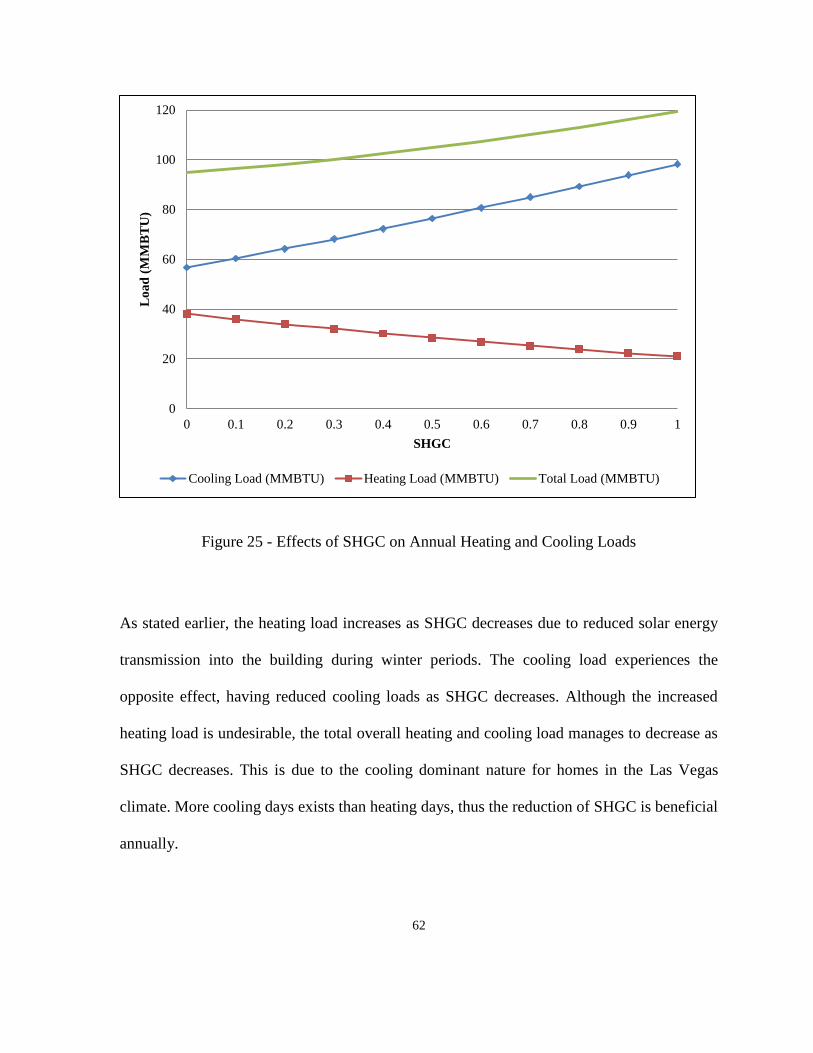
62
Figure 25 - Effects of SHGC on Annual Heating and Cooling Loads
As stated earlier, the heating load increases as SHGC decreases due to reduced solar energy
transmission into the building during winter periods. The cooling load experiences the
opposite effect, having reduced cooling loads as SHGC decreases. Although the increased
heating load is undesirable, the total overall heating and cooling load manages to decrease as
SHGC decreases. This is due to the cooling dominant nature for homes in the Las Vegas
climate. More cooling days exists than heating days, thus the reduction of SHGC is beneficial
annually.
0
20
40
60
80
100
120
0 0.1 0.2 0.3 0.4 0.5 0.6 0.7 0.8 0.9 1
Lo
ad
(M
MB
TU
)
SHGC
Cooling Load (MMBTU) Heating Load (MMBTU) Total Load (MMBTU)
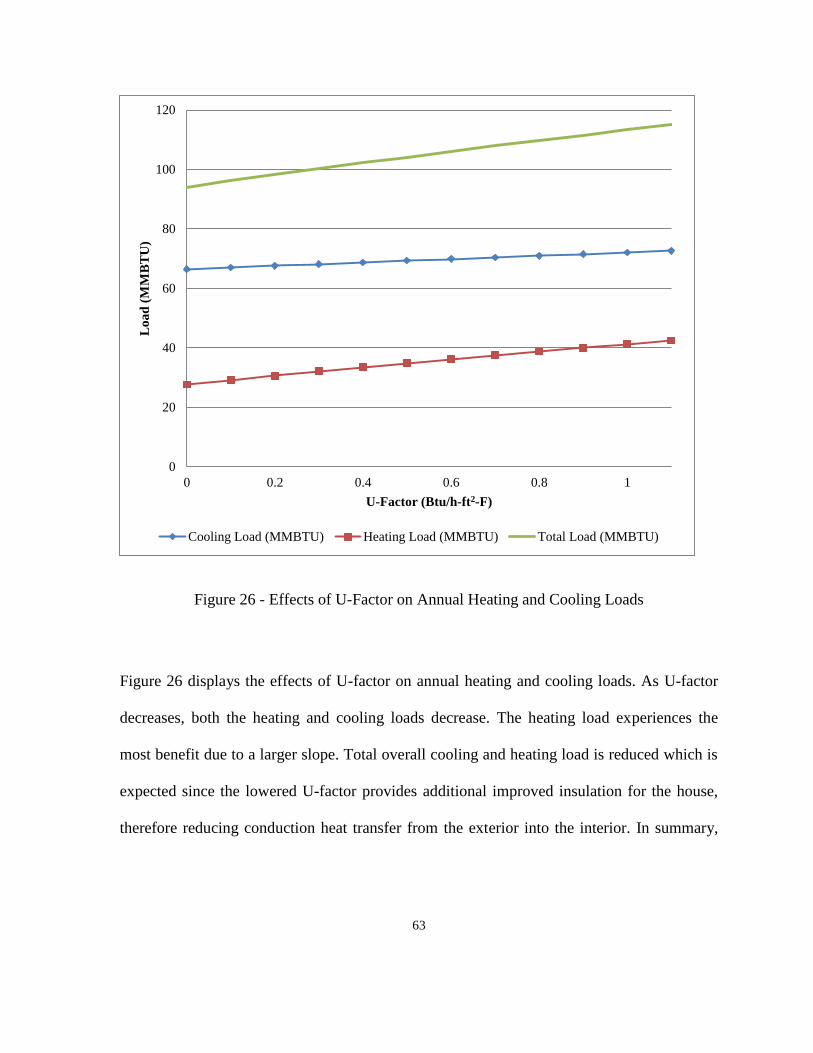
63
Figure 26 - Effects of U-Factor on Annual Heating and Cooling Loads
Figure 26 displays the effects of U-factor on annual heating and cooling loads. As U-factor
decreases, both the heating and cooling loads decrease. The heating load experiences the
most benefit due to a larger slope. Total overall cooling and heating load is reduced which is
expected since the lowered U-factor provides additional improved insulation for the house,
therefore reducing conduction heat transfer from the exterior into the interior. In summary,
0
20
40
60
80
100
120
0 0.2 0.4 0.6 0.8 1
Lo
ad
(M
MB
TU
)
U-Factor (Btu/h-ft2-F)
Cooling Load (MMBTU) Heating Load (MMBTU) Total Load (MMBTU)

64
reducing both the SHGC and the U-factor provides an annual reduction in total cooling and
heating loads.
From the building conditions given previously, a fitting of the data can provide an equation
that can be utilized to predict the total cooling loads with respect to either the U-factor or
SHGC. Dividing by the total window area presents the results in a per square feet basis.
When the SHGC is fixed at 0.30 and disregarding loads from other sources, equation (25)
can be used to estimate the effects of U-factor in regards to total annual loads.
(25)
Where L is the total annual cooling and heating loads through the window in kBTU/ft2 and U
is the U-factor given in Btu/h-ft2-F. Similarly, for the SHGC, an equation can be produced
from the fitting of the data with the U-factor fixed at 0.30 Btu/h-ft2-F. This is seen in
equation (26), and can be used to predict the effects of the SHGC on the total annual loads.
(26)
Where L is the total annual cooling and heating loads through the window in kBTU/ft2 and S
is the SHGC. These equations depend on window location and as such can only be used as a
general estimation.

65
5.3 Facility Improvements
System improvements include creating a secondary facility to test a reference case and run
experiments simultaneously in order to have a more direct relationship between different
facades and windows.

66
Chapter 6: Conclusion
The Façade Evaluation Facility was developed for testing various types of facades at any
given orientation. Removable façade configurations allow testing specimens to be changed
effortlessly. The fenestration properties have been evaluated for an energy efficient double-
paned window and a basic triple-paned window. Building energy simulations help
demonstrate the importance of fenestration characteristics affecting building energy use.
Further testing of different types of windows will continue and comparisons can be inferred
between specimens. The facility allows for testing of several types of glazing, exterior
cladding, building integrated photovoltaic cells and wall materials. Development of the data
will help provide valuable information for energy efficient building design and sustainability.
67
References
[1] Yilmaz Z., 2007, “Evaluation of energy efficient design strategies for different
climatic zones: Comparison of thermal performance of buildings in temperate-humid and
hot-dry climate,” Energy and Buildings, 39(3), pp. 306-316.
[2] Jacobsson S., and Lauber V., 2006, “The politics and policy of energy system
transformation—explaining the German diffusion of renewable energy technology,” Energy
Policy, 34(3), pp. 256-276.
[3] Environmental Information Administration, 2008, “International Energy Outlook
2008,” U.S. Department of Energy.
[4] Department of Energy (DOE) Energy Efficiency and Renewable Energy (EERE),
2004, Building America puts residential research results to work, National Renewable
Energy Lab., Golden, CO (US).
[5] Pérez-Lombard L., Ortiz J., and Pout C., 2008, “A review on buildings energy
consumption information,” Energy and Buildings, 40(3), pp. 394-398.
[6] Lee E., Selkowitz S., Bazjanac V., Inkarojrit V., and Kohler C., 2002, “High-
performance commercial building facades,” Building Technologies Program, Lawrence
Berkeley National Laboratory, June 2002.
[7] Carmody J., Selkowitz S., Lee E., Arasteh D., and Willmert T., 2004, Window
systems for high-performance buildings, WW Norton.

68
[8] Clarke J. A., Hand J. W., Johnstone C. M., Kelly N., and Strachan P. A., 1996,
“Photovoltaic-integrated building facades,” Renewable Energy, 8(1-4), pp. 475-479.
[9] Bazilian M. D., Leenders F., Van der Ree B. G. C., and Prasad D., 2001,
“Photovoltaic cogeneration in the built environment,” Solar Energy, 71(1), pp. 57-69.
[10] Krauter S., Araújo R. G., Schroer S., Hanitsch R., Salhi M. J., Triebel C., and
Lemoine R., 1999, “Combined photovoltaic and solar thermal systems for facade integration
and building insulation,” Solar Energy, 67(4-6), pp. 239-248.
[11] Yun G. Y., McEvoy M., and Steemers K., 2007, “Design and overall energy
performance of a ventilated photovoltaic façade,” Solar Energy, 81(3), pp. 383-394.
[12] McGraw-Hill Construction., 2008, “Key trends in the European and US construction
marketplace,” SmartMarket Report. New York City: McGraw-Hill Construction.
[13] Banfi S., Farsi M., Filippini M., and Jakob M., 2008, “Willingness to pay for energy-
saving measures in residential buildings,” Energy economics, 30(2), pp. 503–516.
[14] Lawrence Berkeley Laboratory, 2011, WINDOW (Version 6.3) [Software],
http://windows.lbl.gov/software/window/6/index.html.
[15] Baker J., Sullivan H., and Wright J., 1989, “A study of pane spacing in glazing
systems,” Proceedings of the Solar Energy Society of Canada, pp. 267–272.
69
[16] Kee M. S., Hughes D. R., Lee A. M., McMillan M., and Plewa J. E., 2010,
“Capstone Design: Energy Efficient Windows Triple Pane Window Analysis,” University of
Tennessee Honors Thesis Projects.
[17] Reilly S., Arasteh D., and Selkowitz S., 1991, “Thermal and optical analysis of
switchable window glazings,” Solar Energy Materials, 22(1), pp. 1-14.
[18] Arasteh D., Selkowitz S., and Wolfe J., 1989, “The design and testing of a highly
insulating glazing system for use with conventional window systems,” Transactions of the
ASME: Journal of Solar Energy Engineering, III, pp. 44-53.
[19] Arasteh D., 2008, “Highly insulating glazing systems using non-structural center
glazing layers,” 2008 Annual ASHRAE Meeting, Salt Lake City, UT, June 21-25, 2008.
[20] Klassen M. S., Sutula J. A., Holton M. M., Roby R. J., and Izbicki T., 2006,
“Transmission Through and Breakage of Multi-Pane Glazing Due to Radiant Exposure,” Fire
Technology, 42, pp. 79-107.
[21] Citherlet S., Di Guglielmo F., and Gay J.-B., 2000, “Window and advanced glazing
systems life cycle assessment,” Energy and Buildings, 32(3), pp. 225-234.
[22] Xian de F., 2000, “A Study of the U-Factor of the Window with a High-Reflectivity
Venetian Blind,” Solar Energy, 68(2), pp. 207-214.
[23] Xiande F., 2001, “A study of the U-factor of a window with a cloth curtain,” Applied
Thermal Engineering, 21(5), pp. 549-558.

70
[24] Klems J. H., 1988, U-values, solar heat gain, and thermal performance: Recent
studies using the MoWitt, Lawrence Berkeley Laboratory.
[25] Klems J. H., Selkowitz S., and Horowitz S., 1982, “A mobile facility for measuring
net energy performance of windows and skylights,” Proceedings of the CIB W.
[26] Klems J. H., 1988, “Measurement of fenestration net energy performance:
Considerations leading to development of the mobile window thermal test (MoWitt)
Facility,” J. Sol. Energy Eng., 110(3), pp. 208-216.
[27] Robinson P., and Littler J., 1993, “Advanced glazing: Outdoor test room
measurements, performance prediction and building thermal simulation,” Building and
Environment, 28(2), pp. 145-152.
[28] Baker P., and McEvoy M., 2000, “Test cell analysis of the use of a supply air
window as a passive solar component,” Solar Energy, 69(2), pp. 113-130.
[29] McEvoy M., Southall R., and Baker P., 2003, “Test cell evaluation of supply air
windows to characterise their optimum performance and its verification by the use of
modelling techniques,” Energy and Buildings, 35(10), pp. 1009-1020.
[30] Baker P. H., and McEvoy M. E., 1999, “An investigation into the use of a supply air
window as a heat reclaim device,” Building Services Engineering Research and Technology,
20(3), pp. 105 -112.

71
[31] Serra V., Zanghirella F., and Perino M., 2010, “Experimental evaluation of a climate
façade: Energy efficiency and thermal comfort performance,” Energy and Buildings, 42(1),
pp. 50-62.
[32] University of Oregon Solar Radiation Monitoring Laboratory, “Sun path chart
program,” http://solardat.uoregon.edu/SunChartProgram.html.
[33] The Center for Energy Research, “CER Data Collection,”
http://www.cer.unlv.edu/cer/CERData/tabid/252/Default.aspx.
[34] National Renewable Energy Laboratory (NREL), “Daily plots and raw data files,”
http://www.nrel.gov/midc/unlv/.
[35] Duffie J. A., and Beckman W. A., 2006, Solar Engineering of Thermal Processes,
Wiley.
[36] American Society of Heating Refrigerating and Air-Conditioning Engineers, 2009,
2009 ASHRAE Handbook - Fundamentals (I-P) (includes CD in dual units), American
Society of Heating, Refrigerating and Air-Conditioning Engineers.
[37] Incropera F. P., DeWitt D. P., Bergman T. L., and Lavine A. S., 2006, Introduction
to Heat Transfer, Wiley.
[38] Concina W., Sadineni, S. B., and Boehm R. F., 2011, “Development of a façade
evaluation facility for experimental study of building energy,” ASME 5th International
Conference on Energy Sustainability Washington D.C.

72
[39] Siegel R., and Howell J., 2001, Thermal Radiation Heat Transfer 4th Edition, Taylor
& Francis.
[40] Federation of European Rigid Polyurethane Foam Associations, 2006, “Thermal
insulation materials made of rigid polyurethane foam,” http://www.excellence-in-
insulation.eu/site/fileadmin/user_upload/PDF/Thermal_insulation_materials_made_of_rigid_
polyurethane_foam.pdf.
[41] Insulfoam LLC, 2008, “Insulfoam Roofing Manual, January 2008,”
http://www.insulfoam.com/images/stories/pdfs/Roofing_Manual/Roofing_Manual_full.pdf.
[42] The Engineering Toolbox, “Thermal Conductivity of some common Materials and
Gases,” http://www.engineeringtoolbox.com/thermal-conductivity-d_429.html.
[43] ASHRAE, 2009, Fundamentals Atlanta: American Society of Heating, Air-
Conditioning and Refrigeration Engineers, Inc.
[44] ANSI/AHRI, 2008, “ANSI/AHRI Standard 210-240-2008 with Addendum 1.”
[45] ASME PTC 19.1, 2004, “Test Uncertainty,” Test Uncertainty—Instruments and
Apparatus.
[46] Figliola R. S., and Beasley D. E., 2005, Theory and Design for Mechanical
Measurements, Wiley.

73
[47] National Renewable Energy Laboratory (NREL), Energy-10,
http://www.nrel.gov/buildings/energy10.html.
[48] National Renewable Energy Laboratory (NREL), “National Solar Radiation Data
Base 1961- 1990: Typical Meteorological Year 2,”
http://rredc.nrel.gov/solar/old_data/nsrdb/1961-1990/tmy2/.
[49] Department of Energy (DOE), Environmental Protection Agency (EPA), Center for
Sustainable Building Research, Alliance to Save Energy, and Lawrence Berkeley National
Laboratory, “ENERGY STAR® Windows,”
http://www.efficientwindows.org/energystar.cfm.

74
VITA
Graduate College
University of Nevada, Las Vegas
Wendell Concina
Degree:
Bachelor of Science, Mechanical Engineering, 2009
University of Nevada, Las Vegas
Thesis Title: Fenestration Studies on Building Energy Using the Façade Evaluation Facility
Publications:
Concina W., Sadineni, S. B., and Boehm R. F., 2012, “Development of an In-Situ Façade-
Evaluation Facility,” 35X-C8C3B7H3D6, 2nd
Asian-US-European Thermophysics
Conference, Hong Kong.
Concina W., Sadineni, S. B., and Boehm R. F., 2011, “Development of A Façade
Evaluation Facility for Experimental Study of Building Energy,” Proceedings of ASME
5th International Conference on Energy Sustainability, Washington, DC, 2011.
Concina W., Sadineni, S. B., and Boehm R. F., 2011, “Solar Assisted Desiccant Cooling
Simulations for Different Climate Zones,” Proceedings of ASME 5th
International
Conference on Energy Sustainability, Washington, DC, 2011.
Thesis Examination Committee:
Committee Chair, Robert Boehm, Ph. D.
Committee Member, Suresh Sadineni, Ph. D.
Committee Member, Yitung Chen, Ph. D.
Graduate Faculty Representative, Yahia Baghzouz, Ph. D.