Features of Coronary Plaque in Patients with Metabolic...
36
Features of Coronary Plaque in Patients with Metabolic Syndrome and Diabetes Mellitus Assessed by 3-vessel Optical Coherence Tomography Yonetsu et al: Plaque Characteristics in Metabolic Syndrome Taishi Yonetsu, MD 1 ; Koji Kato, MD, PhD 1 ; Shiro Uemura, MD, PhD 2 ; Byeong-Keuk Kim, MD, PhD 3 ; Yangsoo Jang, MD, PhD 3 ; Soo-Jin Kang, MD, PhD 4 ; Seung-Jung Park, MD, PhD 4 ; Stephen Lee, MD, FRCP 5 ; Soo-Joong Kim, MD, PhD 1,6 ; Haibo Jia, MD, PhD 1,7 ; Rocco Vergallo, MD 1 ; Farhad Abtahian, MD, PhD 1 ; Jinwei Tian, MD, PhD 1,7 ; Sining Hu, MD, PhD 1,7 ; Robert W. Yeh, MD, MSc 1 ; Rahul Sakhuja, MD, MPP, MSc 8 ; Iris McNulty, RN 1 ; Hang Lee, PhD 9 ; Shaosong Zhang, MD, PhD 10 ; Bo Yu, MD, PhD 7 ; Tsunekazu Kakuta, MD, PhD 11 ; Ik-Kyung Jang, MD, PhD 1 1) Cardiology Division, Massachusetts General Hospital and Harvard Medical School, Boston, MA, USA 2) First Department of Medicine, Nara Medical University, Nara, Japan 3) Severance Cardiovascular Hospital, Yonsei University, Seoul, Republic of Korea 4) Asan Medical Center, Seoul, Republic of Korea 5) Queen Mary Hospital, Hong Kong University, Hong Kong, China 6) Division of Cardiology, College of Medicine, Kyung Hee University, Seoul, Republic of Korea 7) Department of Cardiology, The 2nd Affiliated Hospital of Harbin Medical University; Key Laboratory of Myocardial Ischemia, Chinese Ministry of Education, Harbin, P. R. China. 8) Cardiovascular Medicine/Intervention and Structural Heart Disease, Wellmont CVA Heart Institute, Kingsport, TN, USA 9) Biostatistics Center, Massachusetts General Hospital, Harvard Medical School, Boston, MA, USA 10) LightLab Imaging Inc. Westford, MA. USA; Visiting professor of Harbin Medical University 11) Tsuchiura Kyodo Hospital, Tsuchiura, Japan Correspondence to Bo Yu, MD, PhD Department of Cardiology, The 2nd Affiliated Hospital of Harbin Medical University Key Laboratory of Myocardial Ischemia (Harbin Medical University) Chinese Ministry of Education, Harbin, P.R.China, 150086 E-mail: [email protected] Tel: (+86) 451-86605359 Fax: (+86) 451-86605180 DOI: 10.1161/CIRCIMAGING.113.000345 Journal Subject Codes: Diagnostic testing:[29] Coronary imaging: angiography/ultrasound/Doppler/CC, Atherosclerosis:[134] Pathophysiology ion, Massachusetts General Ho ital and Harvard Medical School, Bos o o n p ology, College of Medicine, Kyung Hee University, Seoul, Republic ardiology, The 2nd Affiliated Hospital of Harbin Medical University; Ke ion on on on on, Mass s sac ac ac achu hu hu hu huse e e e ett tt tt tt tts s s s Ge Ge Ge Ge Gene ne n ne nera ra ra ra ral Ho Ho Ho Ho H sp sp sp sp pit it t ital an nd nd H H H H Har ar ar ar arva va va a vard rd rd rd rd M M M M Med ed ed ed e ical al al al al S S S S Sch ch ch ch choo oo o oo ool, l, l, l B B B Bos o o o o to of of of of Medicine, N N Na a ara a a Me Me Me Me Medical l l Un Un niv ver rsity ty y, Na Na Na Na Nara ra ra ra ra, Ja ap pan ov v v vas as as as ascu cu cu cu cular r r r r Ho Ho Ho Ho Hosp p p p pital al al, , , Yo o o o ons ns ns ns nsei ei ei i i U U U U Uni ni ni ni nive ve ve ve vers rs rs rs sity y, y Seo eo eo eo eoul ul ul ul ul, , Re Re Re R R pu pu pu pu publ bl bl bl blic c c c c o o o o of f f f f Ko Ko K Ko Kore re re re rea nter, Seoul, R R R Rep ep ep ep epublic of of of of of Korea pital, Hong K K K K Kon on on on ong g g g g Un Un Un Un Univ iv i i iver er er er ersi si si si sity ty ty ty ty, , , Ho Ho Ho Ho Hong ng ng ng ng K K K Kon on on on ong, g g g g C C C Chi hi hi hi hina na na na na ol ol olog og ogy y y, C C Col ol ol o le le lege ge ge o o of f f Me Me Medi di dici ci cine ne ne, Ky Ky Ky un un ung g g He He Hee e e Un Un Un U U iv iv iver er ersi si sity ty ty , Se Se Seou ou oul, l, l, R R Rep ep ep ub ub ubli li lic c c of of of ar ar ardi di diol ol olog og ogy y y, T T T The he he h h 2 2 2 2 2nd nd nd A A A A Aff ff ffil il ilia ia iate te ted d d d d Ho Ho Ho H H sp sp spit it ital al al l l o o of f f Ha Ha Ha H H rb rb rb b bin in in i M M M Med ed ed d dic ic ic i i al al al l l U U U Uni ni ni ive ve vers rs rsit it ity; y; y; K K Ke e e by guest on June 10, 2018 http://circimaging.ahajournals.org/ Downloaded from by guest on June 10, 2018 http://circimaging.ahajournals.org/ Downloaded from by guest on June 10, 2018 http://circimaging.ahajournals.org/ Downloaded from by guest on June 10, 2018 http://circimaging.ahajournals.org/ Downloaded from
Transcript of Features of Coronary Plaque in Patients with Metabolic...
Features of Coronary Plaque in Patients with Metabolic Syndrome and
Diabetes Mellitus Assessed by 3-vessel Optical Coherence Tomography Yonetsu et al: Plaque Characteristics in Metabolic Syndrome
Taishi Yonetsu, MD1; Koji Kato, MD, PhD1; Shiro Uemura, MD, PhD2;
Byeong-Keuk Kim, MD, PhD3; Yangsoo Jang, MD, PhD3; Soo-Jin Kang, MD, PhD4;
Seung-Jung Park, MD, PhD4; Stephen Lee, MD, FRCP5; Soo-Joong Kim, MD, PhD1,6;
Haibo Jia, MD, PhD1,7; Rocco Vergallo, MD1; Farhad Abtahian, MD, PhD1;
Jinwei Tian, MD, PhD1,7; Sining Hu, MD, PhD1,7; Robert W. Yeh, MD, MSc1;
Rahul Sakhuja, MD, MPP, MSc8; Iris McNulty, RN1; Hang Lee, PhD9;
Shaosong Zhang, MD, PhD10; Bo Yu, MD, PhD7; Tsunekazu Kakuta, MD, PhD11;
Ik-Kyung Jang, MD, PhD1
1) Cardiology Division, Massachusetts General Hospital and Harvard Medical School, Boston, MA, USA 2) First Department of Medicine, Nara Medical University, Nara, Japan 3) Severance Cardiovascular Hospital, Yonsei University, Seoul, Republic of Korea 4) Asan Medical Center, Seoul, Republic of Korea 5) Queen Mary Hospital, Hong Kong University, Hong Kong, China 6) Division of Cardiology, College of Medicine, Kyung Hee University, Seoul, Republic of Korea 7) Department of Cardiology, The 2nd Affiliated Hospital of Harbin Medical University; Key Laboratory
of Myocardial Ischemia, Chinese Ministry of Education, Harbin, P. R. China. 8) Cardiovascular Medicine/Intervention and Structural Heart Disease, Wellmont CVA Heart Institute,
Kingsport, TN, USA 9) Biostatistics Center, Massachusetts General Hospital, Harvard Medical School, Boston, MA, USA 10) LightLab Imaging Inc. Westford, MA. USA; Visiting professor of Harbin Medical University 11) Tsuchiura Kyodo Hospital, Tsuchiura, Japan
Correspondence to Bo Yu, MD, PhD Department of Cardiology, The 2nd Affiliated Hospital of Harbin Medical University Key Laboratory of Myocardial Ischemia (Harbin Medical University) Chinese Ministry of Education, Harbin, P.R.China, 150086 E-mail: [email protected] Tel: (+86) 451-86605359 Fax: (+86) 451-86605180
DOI: 10.1161/CIRCIMAGING.113.000345
Journal Subject Codes: Diagnostic testing:[29] Coronary imaging:
angiography/ultrasound/Doppler/CC, Atherosclerosis:[134] Pathophysiology
ion, Massachusetts General Ho ital and Harvard Medical School, Bos o
onpology, College of Medicine, Kyung Hee University, Seoul, Republic
ardiology, The 2nd Affiliated Hospital of Harbin Medical University; Ke
iononononon, Massssacacacachuhuhuhuhuseeeeetttttttttts ss s GeGeGeGeGenenennenerararararal HoHoHoHoH spspspsppitittital anndnd HHHHHarararararvavavaavardrdrdrdrd MMMMMedededede icalalalalal SSSSSchchchchchoooooooool,l,l,l, BBBBosoooo toofofofof Medicine, NNNaaaraaa MeMeMeMeMedicall l UnUnnivverrsitytyy, NaNaNaNaNararararara, Jaappan
ovvvvasasasasascucucucucular r r r r HoHoHoHoHospppppitalalal,,, ,, Yooooonsnsnsnsnseieieiii UUUUUnininininiveveveveversrsrsrssityy,yyy Seoeoeoeoeoululululul, ,, ReReReRR pupupupupublblblblbliccccc ooooof f f f f KoKoKKoKorererererea nter, Seoul, RRRRepepepepepublic ofofofofof Korea pital, Hong KKKKKononononong gg gg UnUnUnUnUniviviiivererererersisisisisitytytytyty, , , HoHoHoHoHongngngngng KKKKononononong,gggg CCCChihihihihinanananana ololologogogyyy, CCColololo lelelegegegeg ooofff MeMeMedididicicicinenene, KyKyKyyyununung g g gg HeHeHeeee UnUnUnUU ivivivererersisisitytytyyy, ,,, SeSeSeouououl,l,l,,, RRRepepepppububublililiccc ofofof
ararardididiololologogogyyy, TTTThehehehh 22222ndndnd AAAAAffffffilililiaiaiateteteddddd HoHoHoHH spspspitititalalalll ooofff HaHaHaHH rbrbrbbbininini MMMMedededddicicicii alalalll UUUUnininiiveveversrsrsititity;y;y; KKKeee
by guest on June 10, 2018http://circim
aging.ahajournals.org/D
ownloaded from
by guest on June 10, 2018
http://circimaging.ahajournals.org/
Dow
nloaded from
by guest on June 10, 2018http://circim
aging.ahajournals.org/D
ownloaded from
by guest on June 10, 2018
http://circimaging.ahajournals.org/
Dow
nloaded from
Abstract
Background—The pathophysiologic basis for the association between metabolic
syndrome (MetS) and coronary artery disease is not well understood. We sought to
characterize coronary plaques in patients with MetS using optical coherence tomography
(OCT).
Methods and Results—We identified 451 coronary plaques from 171 subjects who
underwent OCT imaging in three coronary arteries. Subjects were divided into 3 groups:
diabetes mellitus (DM, n=77), MetS (n=35), and a control group (C group, n=59) without
DM or MetS. OCT analysis included the presence of lipid-rich plaque, maximum lipid
arc, lipid-core length (LL), lipid index (LI), fibrous cap thickness (FCT) and thin-cap
fibroatheroma (TCFA). We defined LI as mean lipid arc multiplied by LL. LL and LI
were significantly greater in DM and MetS than in C (LL: 7.7±4.0mm and 7.0±3.8mm vs.
5.5±2.4mm, p<0.001 and p=0.012; and LI: 1164±716 and 1086±693 vs. 796±417,
p<0.001 and p=0.008). Maximum lipid arc was significantly greater in DM than in C,
whereas no significant difference was observed between MetS and C (196±45°, 187±42°,
vs. 176±52°, p=0.002 and p=0.182). FCT and TCFA showed no significant difference
among the three groups. In multivariate analysis, DM and MetS were independently
associated with LI, whereas only acute coronary syndrome was the independent predictor
for TCFA.
Conclusions—Compared to control subjects, coronary plaques in MetS contain larger
lipid. However, the MetS criteria utilized in this study could not distinguish the
vulnerable features such as TCFA, suggesting the necessity of complementary
information to identify patients at high risk for cardiovascular events.
Key Words: plaque; optical coherence tomography; metabolic syndrome; diabetes
mellitus
7±7±7±7±7±7±7±4.4.4.4.4.4.4.0m0m0m0m0m0m0mm m m m m m m ananananananand dd d dd d 7777777
86±±696969696969693333333 vsvsvsvsvsvsvs..... 797979797979796±6
0
4
0 d
groups. In multivariate analysis, DM and MetS were indep
0.000000000088)888 . MMaMaMaMaxxixixix mum lipipp d arc was sssignificantnnnn ly ggggreater in DM t
fifififficccacc nt diffeerrrencncnce wawwww s obbssserveved bbbetwtwtwtwtweeeeeee n MMMetStSS aaaanndn CCCC (196±6±±4rr
0.002 and p=0=0=0=0=0.1.. 8282822).).).).). FCTCC anddddd TTTTCFCCC A ssshoooowewewww d ddd nonononono ssssignificant d
grgrgrouououpspsps. . InInIn mmmululultititivavavariririatatateee anananalalalysysysyy isisis, ,, DMDMDMMM aaandndnd MMMMetetetSSS wewewererere iiindndndepepepeee
by guest on June 10, 2018http://circim
aging.ahajournals.org/D
ownloaded from
Metabolic syndrome (MetS) is defined by a set of inter-related clinical features that
includes obesity, hypertension, dyslipidemia, and hyperglycemia1, 2. The association and
clustering of these factors have been extensively studied and previous studies have
revealed an association between MetS and a higher incidence of cardiovascular events3, 4.
Despite many clinical and epidemiologic studies that have reported an elevated risk for
cardiovascular disease in patients with MetS, unique coronary plaque characteristics in
MetS patients have not been identified. A further understanding of the pathophysiology
of coronary artery atherosclerosis in MetS may enable us to better understand and treat
ischemic heart disease in this population.
Optical coherence tomography (OCT) is an intravascular imaging technique which allows
for high resolution visualization of the coronary arteries5, 6. OCT can provide detailed
structural information on intracoronary pathology including atherosclerotic plaques in
vivo. As such, it provides a unique platform to evaluate the association between MetS
and coronary artery pathology. The purpose of this study was to determine the coronary
plaque characteristics of MetS subjects in comparison with diabetic and normoglycemic
subjects using OCT.
Methods
Study population
The Massachusetts General Hospital (MGH) OCT Registry is an ongoing multi-center
registry of patients undergoing OCT of the coronary arteries and includes 20 sites across
6 countries. Patient selection for the present study is summarized in Figure 1. In a total of
1406 subjects who were enrolled in the registry between August 2010 and May 2012, 255
aging g g g g g g tttttttecececececece hnhnhnhnhnhnhniqiqiqiqiqiqiqueueueuueuu
o e
m p
w
onn nnn visualllllizzzzzataataa iononononon ooooof ff thththththeeeee cocococoororororonanananan ryy aarttttterererererieieieieiess5, 5, 5,5,5, 666. OCOCOCOCOCTTTT cacacacacan nnnn prprprprprovovovovovididididide
matitititiiononononon ooooonnnnn inininnntrtrtrtt acacacaacorororoo onnnnnarararrryy yyy papapapaathththththololololologogogoggyy yyy inininininclclclclcludududududinininininggg gg atatatttheheheheherororororoscscscscscleeeeerororoootititititiccc ppppp
ppprororovivividededesss aaa unununiqiqiqueueue ppplalalatftftfororormmm tototo eeevavavalululuuuatatateee thththe ee asasassososociciciatatatioioionnn bebebetwtwtw
by guest on June 10, 2018http://circim
aging.ahajournals.org/D
ownloaded from
subjects underwent OCT imaging of all three major epicardial coronary arteries during
the same procedure. Only patients with complete information on clinical history,
laboratory data, and physical status and those with sufficient image quality for all 3
vessels were selected. Therefore, 198 subjects with complete demographic data and
sufficient 3-vessel OCT images were identified. From this cohort, we selected the
patients who had non-culprit or non-target coronary plaques with area stenosis greater
than 50% as measured by OCT. Patients without any non-culprit plaques were also
excluded. In-stent restenosis, and lesions which required balloon angioplasty prior to
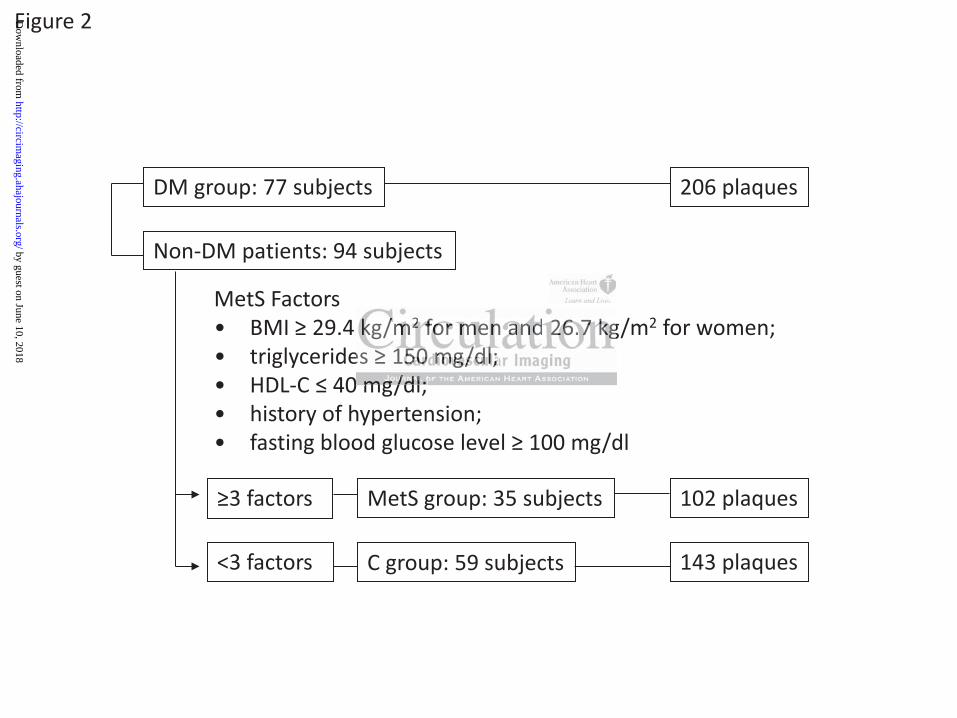
OCT imaging were excluded. The final data set was comprised of 451 plaques from 171
subjects. Subjects were divided into 3 groups: those with diabetes mellitus (DM) (DM
group, 206 plaques in 77 subjects), non-DM subjects with MetS (MetS group, 102
plaques in 35 subjects), and subjects without DM or MetS (C group, 143 plaques in 59
subjects) (Figure 2). The registry was approved by institutional review board in each
participating site, and all subjects provided informed consent.
Metabolic syndrome factors
DM was diagnosed in the participating site based on the American Diabetes Association
(ADA) definition if the patient had at least one of the following criteria; fasting glucose
126 mg/dl, 2-hours plasma glucose level 200 mg/dl in the oral glucose tolerance test,
classic symptom with casual plasma glucose level 200 mg/dl or A1c 6.5%7. Patients
who were taking hypoglycemic agents were also diagnosed as DM in the present study.
MetS was based on the definition established in the Joint Scientific Statement as a subject
with 3 or more of the following: waist circumference 102 cm for men or 88 cm for
ed of 451 plaququququququque
beteesssssss memememememem llllllllllllllitititititititususususususus ((((((DD
u p
b q
d
uesesesees in 777777 sssssubububububjeeeeectctctctcts)s)s)s)s), , , , , nononononon-n-n-n-n DMDMDMDMDM ssssubbjjjectctctctcts ssss wiwiwiwwiththththth MMMMMeteeee S (M(M(M(M(Meteeee S S SS S grgrgrgrgrouououououp
bjecececcctststststs),)))) aaaaandndndndnd sssubububububjejejejj ctctcttctssss s wwwwwithohohohohoututututut DDDDDM MMMM orororoo MMMMMeteteete SSSSS (C(C(C(C(C gggroooooupupupupup, 141414141433333 plplplplplaqaaaa
2)2)2). ThThThe e e rereregigigistststryryryyy wwwasasas aaapppppppprororoveveveddd bybybyy iiinsnsnsnn titititutututititionononalalal rrrevevevieieiewww boboboarararddd
by guest on June 10, 2018http://circim
aging.ahajournals.org/D
ownloaded from
women; triglycerides 150 mg/dl; high-density lipoprotein cholesterol (HDL-C) 40
mg/dl; blood pressure 135/85 mmHg; and fasting blood glucose level 100 mg/dl1. In
the present study, we used body mass index (BMI) as a substitute for waist circumference
because data on waist circumference was not obtained in our registry. We used a BMI
cut-off of 29.4 kg/m2 for men and 26.7kg/m2 for women as previously reported8, 9. In
addition, history of hypertension was used as an alternative for the presence of
documented blood pressure 135/85 mmHg because the majority of subjects had been
treated with anti-hypertensive agents. Therefore, MetS was defined by the presence of 3
or more MetS factors of (1) BMI 29.4 kg/m2 for men and 26.7 kg/m2 for women; (2)
triglycerides 150 mg/dl; (3) HDL-C 40 mg/dl; (4) history of hypertension; and (5)
fasting blood glucose (FBG) level 100 mg/dl, as shown in Figure 2.
Coronary angiography
Coronary angiograms were analyzed by off-line quantitative coronary angiography
(CAAS 5.10.1, Pie Medical Imaging BV. Maastricht, Netherlands). Reference diameter,
minimum lumen diameter, diameter stenosis, and lesion length were measured.
OCT image acquisition
Either the time-domain (M2/M3 Cardiology Imaging System, LightLab Imaging, Inc.,
Westford, MA) or frequency-domain OCT system (C7-XRTM OCT Intravascular Imaging
System, St. Jude Medical, St. Paul, Minnesota) was used in the study. The intracoronary
OCT imaging technique has been previously described 10. In brief, with the M2/M3
system, an occlusion balloon (Helios, LightLab Imaging Inc. Westford, MA) is advanced
6.7 kg/m forr wwwwwww
y of f hyhyhyhyhyhyhypepepepepepepertrtrtrtrtrtrtenenenenenenensisisisisisisiono
uucccccooosoo e (FBGBGBGBGBG))))) lelelelelevevevevevel llll 111110000000000 mmmmg/gg/gg dldd , aaas ssssshohohohohownwnwnwnwn iiin nnnn FiFFFF gugugugugurerererere 22222.
grgrgrapapaphyhyhyy
by guest on June 10, 2018http://circim
aging.ahajournals.org/D
ownloaded from
proximal to the lesion and inflated up to 0.4 - 0.6 atm during image acquisition. The
imaging wire is automatically pulled back from distal to proximal at 1.0 to 3.0 mm/s and
saline is continuously infused from the tip of occlusion balloon. With the C7 system, a
2.7-F OCT imaging catheter (Dragonfly, LightLab Imaging Inc. Westford, MA) is
advanced distal to the lesion and automatic pullback is started as soon as the blood is
cleared. All images were digitally stored, de-identified, and submitted to the
Massachusetts General Hospital (Boston, MA) for analysis.
OCT image analysis
Each plaque was classified as lipid-rich or fibrous plaque. We defined lipid as a diffusely
bordered signal-poor region with signal attenuation by the overlying signal-rich layer,
and lipid-rich plaque as a plaque with lipid > 90 degrees5. For lipid-rich plaque, we
determined lipid arc, lipid core length, thinnest fibrous cap thickness (FCT), as well as
the presence of thin-cap fibroatheroma (TCFA), macrophage accumulation, cholesterol
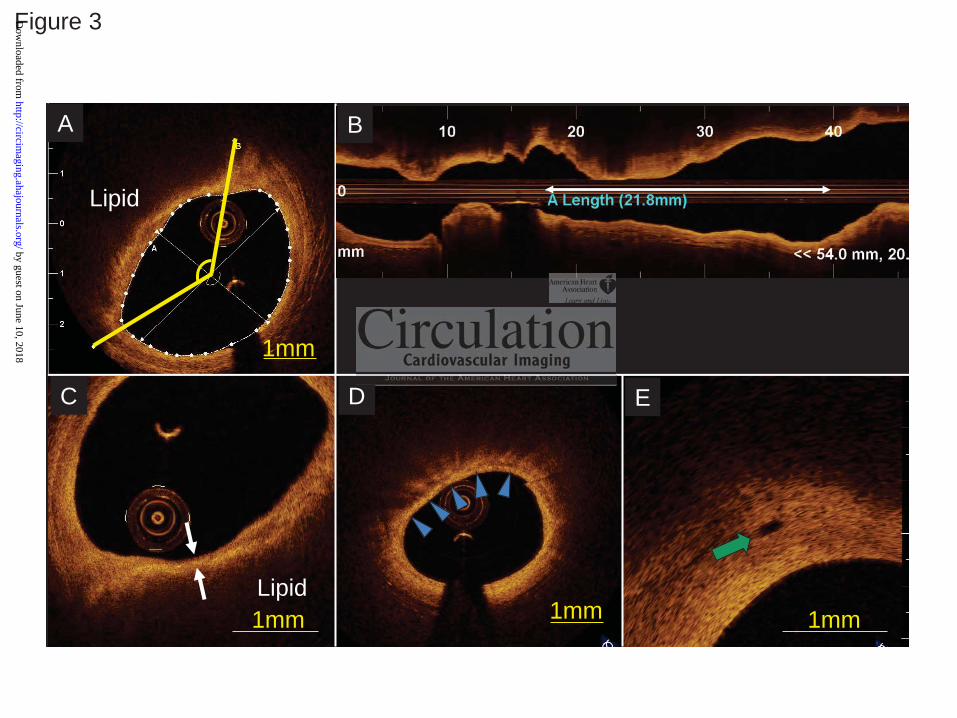
crystal, and microvessels (Figure 3). Lipid arc was measured every 1 mm within a lipid-
rich plaque, and mean and maximum values were recorded (Figure 3A). Lipid core length
was defined as the length of plaque with >90 degrees of lipid, and measured on the
longitudinal view (Figure 3B). We also calculated the lipid index, which was defined as
the mean lipid arc multiplied by lipid core length10. The thinnest fibrous cap thickness of
a lipid-rich plaque was measured at the thinnest part 3 times, and the values were then
averaged (Figure 3C). TCFA was defined as a lipid-rich plaque with a maximum lipid arc
>90 degrees and FCT 65μm11. Macrophage accumulation on the OCT images was
defined as increased signal intensity within the plaque, accompanied by heterogeneous
e defeffffffininininininneeeeeeed d d d d d d lililililililipipipipipipipid d ddddd a
p r
a q
popopopopooooroo regioioioioon nnn n wiwiwiwiwiththththth sssssigigigigignananananal atatatata teeeeenunununun attiiion n n n n bybybybyby thehehehhe ooooovvvvvereee lylylylylyinininining g gg g sisisisiigngngngngnalalalalal-r
aquuuuuee eee asasasaa aaaa ppppllaqaqaqqueueueueue wwwwititititith hhhh lllill pipipipipidd ddd >>>>> 9090909090 dddddegegegegegrerererereeseseseses55555. FoFoFoFoForr r lilililil pipipipipid-d-d-d-d-rrrirr chchchchch pppplalalalalaqqq
aaarcrcrc, lililipipipiddd cococorerere lllenenengtgtgtgg h,h,h,, ttthihihinnnnnnesesesttt fififibrbrbrouououoo sss cacacap p p pp thththhicicicknknknesesessss (F(F(F( CTCTCT))),
by guest on June 10, 2018http://circim
aging.ahajournals.org/D
ownloaded from
backward shadows 12, 13 (Figure 3D). Cholesterol crystals were characterized as thin and
linear regions of high intensity existing beside lipid core14. Microvessels were defined as
small vesicular or tubular structures with diameters 50 - 300 m and differentiated from
any other branch15 (Figure 3E). Plaque disruption was defined as a discontinuity of the
fibrous cap with communication between the vessel lumen and the cavity. Calcification
was also recorded when an area with low backscatter and a sharp border was identified
inside a plaque16. OCT images were analyzed by two investigators who were blinded to
the subject’s information. When there was discordance between the readers, a consensus
reading was obtained from a third independent investigator.
Statistical analysis
Categorical data were presented as counts and proportions and were compared using
either a chi-square test or Fisher exact test, depending on the data. Continuous
measurements were presented as mean ± standard deviation, and analyzed with the
Analysis of Variance (ANOVA) and Bonferroni correction for multiple comparisons.
For comparisons between groups, analysis was carried out by means of the Generalized
Estimating Equations (GEE) approach in order to take into account the within-subject
correlation due to multiple plaques analyzed within a single subject. Multiple linear
regression and logistic regression analyses were performed to assess the independent
predictors for lipid index and the presence of TCFA. Multiple regression models included
the parameters which showed statistical significance with the p value less than 0.05 in the
univariate analysis. The correlation between OCT parameters and the number of MetS
factors was analyzed with Spearman’s rank correlation coefficients. Inter- and intra-
y
e
r u
ysssssisisisss
werererereree eee prprprprpresssenenene teteteeeddd dd as cccccououououountttttsss ss anananananddd dd prprprprpropopopopopororrorortititititionononononsss s anananananddd dd wewewewewererereere comomomomompapapapap rerrrr
rrreee teteteststst ooorrr FiFiFishshshererer eeexxxacacacttt teteteststst,,,,, dededepepepepp ndndndinininnng g g gg ononon tttheheheh dddatatataaa. CCCononontititinununuououou
by guest on June 10, 2018http://circim
aging.ahajournals.org/D
ownloaded from

observer reliabilities were estimated by means of Kappa coefficient (k) for binary
outcomes and intra-class correlation coefficient (ICC) for continuous measurements. All
statistical analysis was performed with SPSS 17.0. A p value <0.05 was considered
statistically significant.
Results
Clinical characteristics
Patient characteristics are summarized in Table 1. As expected, there were significant
differences between the three groups. A history of hypertension was significantly more
frequent in the DM and MetS groups than in the C group. Body weight, BMI, and
triglyceride level were significantly greater in the MetS group than in the C group. HDL-
C was significantly lower in MetS than in C. Fasting blood glucose level was
significantly different among the 3 groups, and the highest in the DM group. The number
of factors for MetS was significantly higher in the MetS group (3.4±0.5) as compared to
the DM (2.8±1.0) and C (1.5±0.6) groups (p=0.002 and p<0.001). Patient characteristics
of DM group or MetS group in the study cohort (3-vessel imaging cohort) were compared
with those in the subjects of the registry who underwent OCT imaging for 1 or 2 coronary
vessels in Supplemental Table 1 and 2. As compared to the 1- or 2-vessel OCT imaging
cohort, DM patients in 3-vessel imaging cohort had lower HbA1c level, possibly due to
aggressive treatment including more frequent use of insulin.
ion was signiffffffficiciiiii
dy weweweweweweweigigigigigigighththththththt,,,,,,, BMBMBMBMBMBMBMI
l g
t s
f
l wwwwwere siiiigngngngnniiiiifififficacacacacantntntntntlylylylyly gggggrerererereataatata erererer iiiiin nnn thheee MeMeMeMeMetStStStStS grggrgrouououuuppppp thhhhhananananan iiiiin nnn thththththe ee e e C CCCC g
tly yyyy lololololowewewewewer inininini MMMMMetetetee S thththththananananan innnnn CCCCC. FaFaFaFaFastststttininininingggg g blblblblbloooooooooodd ddd glglglgg uucu ososososose eee lllell vevevevevel llll wawawawawas
ffferererenenenttt amamamononong g g g thththeee 333 grgrgrouououpspspspp ,,,,, aaandndnd ttthehehe hhhhhigigigggheheheststst iiiinnn thththeee DMDMDDM gggrororoupupup.
by guest on June 10, 2018http://circim
aging.ahajournals.org/D
ownloaded from
Three vessel OCT imaging and angiographic findings
The mean total length of coronary arteries imaged by OCT was 221±45 mm; 94±25mm
in the right coronary artery (RCA), 72±23mm in the left anterodescending coronary
artery (LAD), and 55±18mm in the circumflex (Cx). There was no significant difference
in total imaged length among the DM, MetS and C groups (205±41mm, 215±42mm, and
215±43mm, p=0.302). Plaque location and angiographic data are shown in Table 2. There
was no significant difference in plaque location and angiographic data among the 3
groups.
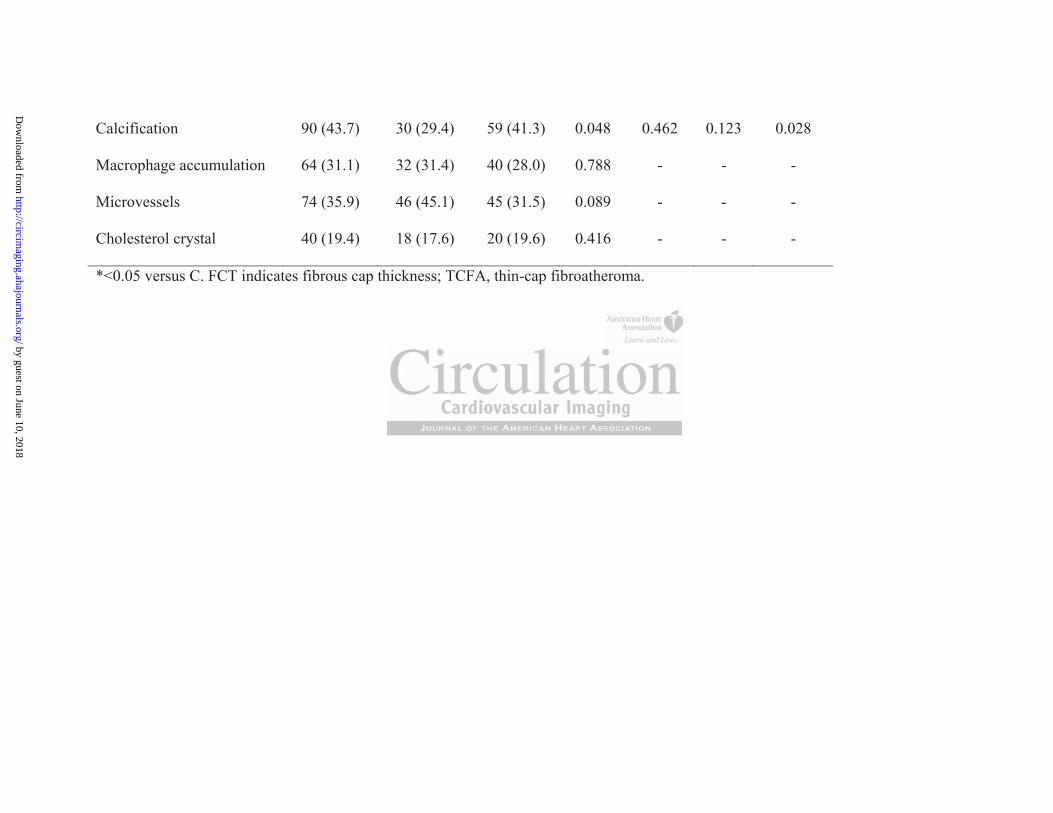
OCT findings
The OCT findings from each group are summarized in Table 3. There were no significant
differences in the number of plaques per subject and the prevalence of lipid-rich plaque
among the 3 groups. Maximum lipid arc, lipid core length, and lipid index were
significantly greater in the DM group than those in the C group. MetS subjects showed a
significantly longer lipid length and a greater lipid index as compared to those in C group.
No significant difference was observed between DM and MetS in maximum lipid arc,
lipid core length, and lipid index. Fibrous cap thickness only showed a trend towards
smaller value in the DM and MetS groups as compared to C group. There were no
significant differences in the prevalence and number of TCFA across the 3 groups.
Calcification was more frequent in plaques of DM subjects than in those of MetS. The
prevalence of other microstructures, such as macrophage accumulation, microvessels, or
cholesterol crystals, was not statistically different among the 3 groups.
g n
e r
u w
gsssss fffffrom eaeaeaeaachchchchch gggggrororororoupupupupup aaaaarerererere sssssumumumummmammm rrizezezeed d d dd ininininin TTTTTabababa lelelelee 3333. ThThThThThererererereeee wewewewewererererere n
e nnnnnumumumumumbebebebeber ofofofofof pppplalalalalaquqq esesesese ppppper sssssubububububjjjjjececececect tt ananananandd ddd thththththeeeee prprprprprevevevevevalalalalalennnnncecececece of ffff liliiiipipipipipid-dd-dd r
uuupspsps. MaMaMaxixiximumumummm lililipipipipp ddd arararc,c,c,,, lllipipipppiiiddd cococorerere lllllenenengtgtgtgg h,h,h,,, aaandndnd lllipipipippididid iiindndndexexex www
by guest on June 10, 2018http://circim
aging.ahajournals.org/D
ownloaded from
Correlation between the number of MetS factors and lipid-rich plaque
Maximum lipid arc, lipid core length, and lipid index increased linearly as the number of
MetS factors increased. Although the linear trends with positive slopes were statistically
significant, their magnitudes of the explained variations by the number of MetS factors
were not large (maximum lipid arc: rho=0.182, p=0.005, lipid core length: rho=0.202,
p=0.002, and lipid index: rho=0.225, p<0.001). No significant correlation was observed
for FCT (rho=-0.116, p=0.075) (Figure 4).
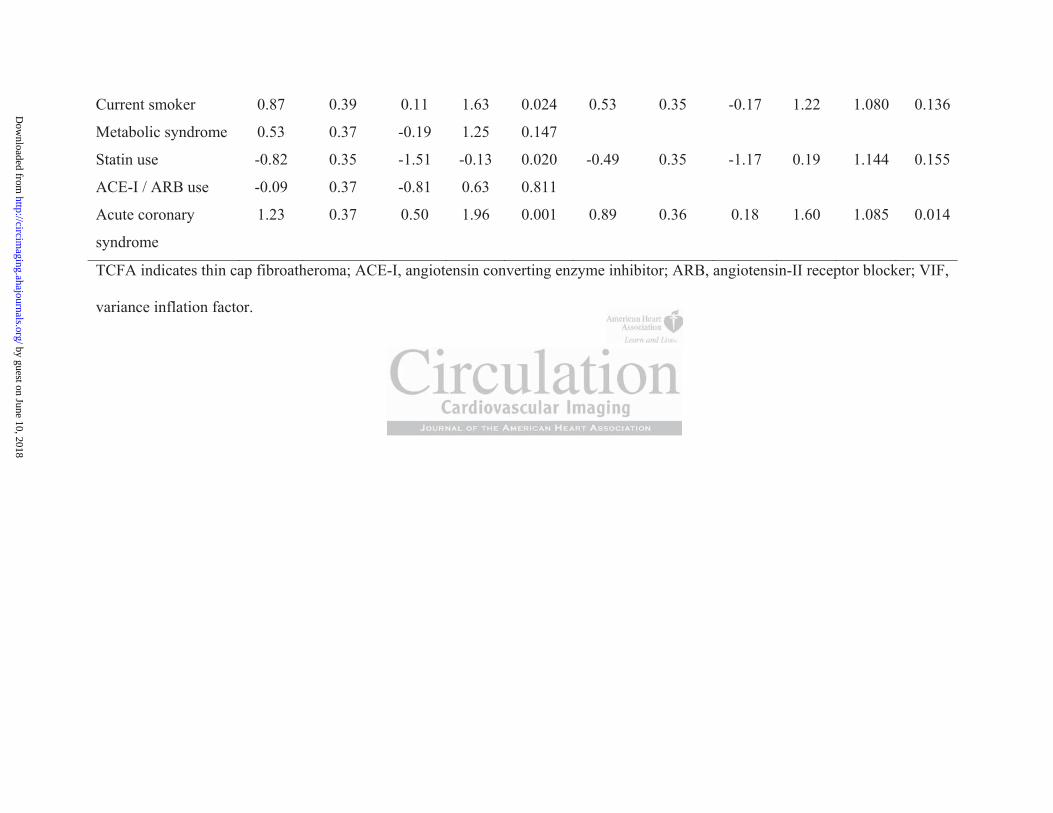
Multiple regression analyses for lipid index and TCFA
Multiple linear regression and logistic regression analyses were performed to assess the
determinants of lipid index and the presence of TCFA. As shown in Table 4, DM and
MetS were independently associated with greater lipid index. However, only ACS
presentation was independently associated with TCFA, although DM and MetS did not
show significant trend.
Observer Variabilities
The estimated inter- and intra-observer Kappa coefficients were 0.90 and 0.93 for the
presence of lipid-rich plaque and 0.84 and 0.84 for the presence of microvessels. Intra-
class correlations were 0.87 and 0.97 for mean lipid arc and 0.86 and 0.90 for lipid core
length, respectively.
e o
lipid index and the presence of TCFA. As shown in Table 4,
p y
eeeeegrgrgrgrgressionnnn aaaaandndndndnd lllllogogogogogisisisisistititititic c ccc rererereregrggg eeeeessssssioonnn anananananalalalalalysysysysysesesesees wwwwwereerere e pepepepp rfrfrfrfrfororororormememememed d dd d to
lipipipipiidd ddd ininininindededededex xxx ananand dddd ththtthe prprprprpreeseee ennnnncecececece ooooof ffff TCTCTCTCTCFAFAFAFAFA. AsAsAsAsAs ssssshohohohohownwnnnwn iiiiin nnnn TaTaTaTaTablblblblble eeee 444,44
pepependndndenenentltltly y y yy asasassososociciciatatatededed wwwititithhh gggggrerereatatatererer lllipipipppididid iiindndndexexex. HoHoHoweweweveveverrr, ooonlnlnlyyy
by guest on June 10, 2018http://circim
aging.ahajournals.org/D
ownloaded from
Discussion
To our knowledge, this is the first OCT study investigating in detail the plaque
characteristics of patients with MetS in comparison with DM patients and those without
DM or MetS. Our OCT data demonstrated that (1) subjects with MetS had larger lipid
burden compared with those without MetS, (2) frequency of TCFA did not differ among
subjects with DM, those with MetS, and those without DM or MetS, (3) the prevalence of
microstructure, such as macrophage accumulation, microvessels, and cholesterol crystals,
did not show any significant differences among the 3 groups.
Lipid-rich plaque
One of the important components of rupture-prone plaque is a large necrotic core, which
may physically increase the tension of fibrous cap covering the lipid core and lead to
disruption17. Several pathological and virtual histology-intravascular ultrasound (VH-
IVUS) studies have shown that coronary plaques in non-culprit lesions of DM patients
had larger plaque burdens and a larger necrotic core than in those of the patients without
DM 11, 18, 19, which is consistent with our data. On the other hands, a recent OCT study by
Niccoli et al. demonstrated smaller lipid arc, larger calcium, and comparable fibrous cap
thickness in the culprit lesions of DM at the first ACS manifestations as compared to
non-DM patients20. Their results suggest that even small amount of lipid may be able to
cause an acute coronary syndrome in DM patients, which supports the importance of
aggressive lipid lowering therapy in DM patients for primary or secondary prevention.
Although the pathophysiological features of atherosclerosis in DM have been
substantially explored, those in MetS have not been elucidated. The present study
r
n d
u
rtatatattannntn commmmpopopopoponeeneenentntntntntsssss ofofofofof rrrrrupupupupu tutututut rerereree-p-pp-pronoone plplplplplaqaqaqaqaqueueueuue iiisssss a aaaa laaaaargrgrgrgrge e e e e nenenenenecrcrcrcrcrotototototiciiii
ncrerererereasasasasaseeeee thththththe eee tetetensnsnsnsnsioii n nnnn ofofofofof fibbbbbrororoooususususu cccccapapapapap cccccovovovovoverererererinininininggg gg thththththe ee lililililipipipipipiddddd cccororororore eee ananannndddd
eeerararalll papapathththololologogoggicicicalalal aaandndnd vvviririrtututualalal hihihistststololologogogogogy-y-y-yy ininintrtrtravavavasasascucuculalalarrr ululultrtrtrasasasououou
by guest on June 10, 2018http://circim
aging.ahajournals.org/D
ownloaded from

demonstrates a greater amount of lipid in non-culprit/non-target plaques in subjects with
MetS as compared to plaques in subjects without MetS or DM. These results support the
previous VH-IVUS studies reporting a greater percent necrotic core in patients with MetS
than in those without MetS19, 21.
TCFA and fibrous cap thickness
Although the variability and heterogeneity of fibrous cap thickness at the time of plaque
rupture have been reported in vivo 22, 23, thin fibrous cap (<65μm) defined by
pathological study11 has been recognized as the most critical feature of vulnerable plaque.
However, there was no significant trend in the frequency of TCFA and fibrous cap
thickness across the three groups in the present study, while the extent of lipid expressed
by lipid index was greater in DM and MetS,. A previous VH-IVUS study showed a high
prevalence of TCFA in DM and MetS patients19. However, a larger cohort of sub-
analysis in PROSPECT trial showed insignificant association of MetS with the presence
of VH-derived TCFA21. These inconsistent results may reflect the ambiguous effect of
MetS on plaque instability. In a previous IVUS and OCT study 24, Takarada et al.
reported that fibrous cap thickness was significantly correlated with high-sensitive C
reactive protein (hs-CRP) rather than with lipid profiles, whereas atheroma volume
showed a significant correlation only with cholesterol profiles. Their results suggested
different mechanisms of regulation between lipid volume and fibrous cap thickness.
Although several formal definitions of MetS have been proposed so far, the traditional
definition which served as the basis for the present study does not include biomarkers of
inflammation. These markers are likely to correlate more strongly with structural features
feature of vulnlnnnnnnee
TCFAFAAAAAA aaaaaaandndndndndndd fffffffibibibibibibibrorororrrr u
i
a o
C f
ttttthehehehehe threeeee gggggrorrrr upupupupupsssss ininininin ttttthehehehehe ppppprerereresesseses ntnnn stutudydydydydy,, ,,, whwhwhwhwhililili eeeee thththththe exexexexextetetetetentntntntnt ooooof f f f f lililililipipppp
as gggggrerererereatatattterereree iiiiinnn DMDMDMDMDM aandndndndnd MMMMMetetetetetSSSSS,. AAAAA ppppprererereeviviviviviouououououss sss VHVHVHVHVH-II-IIIVUVUVUVUVUS SSSS ssstss udududududy yyy shshshshsho
CCCFAFAFA iiinnn DMDMDM aaandndnd MMMetetetSSS papapatititienenentststs19. HoHoHooowewewevevever,r,r,,, aaa lllararargegegegg rrr cococohohohortrtrt ooofff
by guest on June 10, 2018http://circim
aging.ahajournals.org/D
ownloaded from
of plaque vulnerability, including the development of thin fibrous cap. Indeed, only the
independent predictor for TCFA in the present study was the clinical presentation of ACS
which is related to systemic inflammation. Previous studies demonstrated that
stratification by inflammatory status indicated by hs-CRP adds prognostic information to
the diagnosis of MetS8, 25. The lack of a significant association between MetS and fibrous
cap thickness or TCFA in the present study likely results from the incompleteness of
traditional MetS criteria. Additional information including inflammatory markers might
be helpful for better differentiation of plaque vulnerability in addition to the diagnosis of
MetS and DM.
Number of factors and lipid
Although each factor of MetS is known separately to be a cardiovascular risk factor, it is
generally accepted that the combination of those components and their inter-relationship
lead to the progression of atherosclerosis26. On the other hand, some studies have cast
doubt on the association between MetS and cardiovascular events27, 28. In the present
study, multiple linear regression analysis demonstrated that MetS is an independent
predictor for large amount of lipid. However, caution should be exercised when
interpreting these data. As shown in Figure 4, correlations between the number of MetS
factors and OCT findings including lipid index and FCT were mild, and significant
overlaps were found across the number of MetS factors (Figure 4). In other words, MetS
does not provide additive predictive values beyond its individual components.
Furthermore, these OCT parameters are just surrogates of the extent of lipid, which may
not be necessarily associated with the risk of future cardiovascular events.
o
a k
e
orororororsss ss and lilililipipipipipid dd d
acttttororororor ooooof ffff MeMeMeMeMetStStStStS iisssss knnnnnowowowowown sesesesesepapapapap rararararatetetettelylylylyy tttttooo oo bebebebebe aaaaa cccccarararaa didididd ovovovvovasasassascucucucuc lalalalalarrrr rrrrrississskr
ededed ttthahahattt thththeee cococombmbmbinininatatatioioionnn ofofof ttthohohosesese cccomomommmpopopop nenenentntntsss ananandd dd thththeieieirrr inininteteterrr-
by guest on June 10, 2018http://circim
aging.ahajournals.org/D
ownloaded from
Microstructures observed in OCT
OCT is a unique in vivo intravascular imaging modality which allows for visualization of
microstructures such as macrophage accumulation, microvessels, and cholesterol crystals
12, 13, 29, 30. These microscopic changes are affected by multiple factors such as systemic
inflammation, hypoxia, oxidative stress, and statin therapy31, 32. Although DM and MetS
were expected to have impacts on these factors, our data showed only a weak trend
towards more frequent microvessels in DM and MetS groups (p=0.091). The statin use
and LDL cholesterol levels were not different among the groups at the time of OCT
imaging (p=0.496 and p=0.545, respectively). Unfortunately, we do not have information
on the previous LDL cholesterol levels and duration of statin therapy. A prospective
systemic study may elucidate this relationship.
Calcification in DM and MetS
The present study showed higher prevalence of calcification in plaques of DM subjects as
compared to those of MetS subjects in non-culprit or non-target lesions. Our data is
consistent with a previous computed tomographic (CT) study that revealed an
intermediate association between MetS and Agatston score by multi-detector CT,
whereas DM patients showed remarkable association with greater calcium scores
regardless of MetS33. A recent OCT study also demonstrated more frequent superficial
calcium and larger calcium amount in the culprit vessels of ACS in DM patients as
compared to non-DM patients20, which is also consistent with our data. One of the
advantages of OCT imaging for the evaluation of calcium is potentials to detect a small
ups at the timmee e e ee e oo
we dododododododo nnnnnnototototototot hhhhhhhavavavavavavave
L s
m
LDLDLDLDLDLL cholololo esesesesesteteteterororororolllll lelelelelevevevevevelslslslsls aaaaandndnddd dududdd raatttiononononon ooooof ffff stststststatatata ininninn tttheeeeerararararapypypypypy. A A AA A prprprprprosoooo
mayyyyy eeeeelululululucicicicicidddddatatattate ee thththththisiii rrrrelelelelelatatatatatiiioii nsnsnsnsnshihihihihippp.pp
by guest on June 10, 2018http://circim
aging.ahajournals.org/D
ownloaded from
calcification in the plaque and to determine the morphological characteristics of calcium
such as nodular calcium. As of now, the nature and process of coronary calcification
have not been well studied in vivo. Further study with use of serial OCT imaging would
be warranted to understand the pathophysiology of coronary calcification.
Limitations
The present study has several limitations. First, this study is a retrospective observational
study from a registry database; therefore, selection bias may have influenced the results.
In addition, we selected the patients who underwent 3-vessel OCT investigation to
diminish the bias from the studied vessel. However, there still might have been a
selection bias as shown in Supplemental Table 1 and 2. Second, our OCT registry data
did not include information on waist circumference, so we used BMI as a substitute for
the determination of obesity. Moreover, the presence of high blood pressure was
substituted with the history of hypertension. Our modified definition of MetS may have
affected the results. Third, we included only plaques with area stenosis more than 50% as
indicated by OCT. Although this criterion is accepted in the consensus documents34, it is
the criteria for a stenosis rather than the definition of a plaque. Early stages of
atherosclerosis with expansive remodeling may have been excluded. Fourth, no
inflammatory markers such as hs-CRP were assessed in this study. Fifth, the duration and
type of DM were not available in the registry, which might have influenced plaque
characteristics. Sixth, we used lipid index calculated from OCT parameters. However,
this value is a surrogate of the necrotic core burden. Finally, a lack of longitudinal follow
OCT investigagagagagagagatt
ll mimiiiiighghghghghghght t t t ttt hahahahahahahaveveveveveveve bbbbbbbe
g
n b
n
shshshshshowo n inininin SSSSSupupupuppplplplplplemememememenenenenentatatatatal llll TaTaTaTablblblbb e 1 annnnnd d d dd 2.2222 SSSSSececece ononononond,,,,, oooooururururur OOOOOCTCTCTCTCT rrrrregaaa
nfofofofoormrmrmrmrmatatatatatioioioioi n nnn onononnn wwwwwaiiiiiststststst ccccciriiii cuuuuumfmfmfmfmfererereereeeeencncncnnce,eeee sssssooooo wewewewew uuuuusesesed dddd BMBMBMBMBMIII II asasasaa aaaa sssuuubuu
nnn ofofof ooobebebesisisitytytyy. MoMoMorerereovovovererer, thththeee prprprpp esesesenenencececeee ooofff hihihighghghghg bbblololoododod ppppprereressssssururureee
by guest on June 10, 2018http://circim
aging.ahajournals.org/D
ownloaded from

up data did not allow for the assessment of the clinical impact of OCT findings on the
future events.
Conclusions
Plaques in MetS subjects contain larger lipid content than those in subjects without MetS
whereas fibrous cap thickness was not significantly associated with the diagnosis of MetS.
Sources of Funding
This study was supported by research grants from St. Jude Medical, the Cardiology
Division of Massachusetts General Hospital, and the Dr. John Nam Fellowship Grant.
Disclosures
Dr. IK Jang received a research grant and consulting fee from LightLab Imaging/St. Jude
Medical and Dr. S. Zhang is an employee of LightLab Imaging/St. Jude Medical. R.
Vergallo received a grant from the “Enrico ed Enrica Sovena” Foundation, Rome, Italy.
Dr. Jia has received a grant from the National Natural Science Foundation of China
(grant contract number: 81200076). Dr. Yu received a grant from the National Natural
Science Foundation of China (grant contract number: 30871064/C140401).
References
1. Alberti KG, Eckel RH, Grundy SM, Zimmet PZ, Cleeman JI, Donato KA, Fruchart JC, James WP, Loria CM, Smith SC, Jr. Harmonizing the metabolic syndrome: a joint interim statement of the International Diabetes Federation Task Force on Epidemiology and Prevention; National Heart, Lung, and Blood Institute; American Heart Association; World Heart Federation; International Atherosclerosis Society;
Medical, the Cararararararardd
n NaNaaaaaam mmmm mm FeFeFeFeFeFeFellllllllllllllowowowowowowowsshshs
i g
DiDiDiDiiscscscscsclololololosususususurerererresssss
ivivivededed aaa rrreseseseaeaearcrcrchhh grgrgrgg anananttt ananand d d ccconononsususultltltinining g g gg fefefeeee frfrfromomom LLLigigigigghththtLaLaLabbb ImImImagagag
by guest on June 10, 2018http://circim
aging.ahajournals.org/D
ownloaded from
and International Association for the Study of Obesity. Circulation. 2009;120:1640-1645.
2. Executive Summary of The Third Report of The National Cholesterol Education Program (NCEP) Expert Panel on Detection, Evaluation, And Treatment of High Blood Cholesterol In Adults (Adult Treatment Panel III). JAMA. 2001;285:2486-2497.
3. Deedwania P, Barter P, Carmena R, Fruchart JC, Grundy SM, Haffner S, Kastelein JJ, LaRosa JC, Schachner H, Shepherd J, Waters DD. Reduction of low-density lipoprotein cholesterol in patients with coronary heart disease and metabolic syndrome: analysis of the Treating to New Targets study. Lancet. 2006;368:919-928.
4. Gami AS, Witt BJ, Howard DE, Erwin PJ, Gami LA, Somers VK, Montori VM. Metabolic syndrome and risk of incident cardiovascular events and death: a systematic review and meta-analysis of longitudinal studies. J Am Coll Cardiol. 2007;49:403-414.
5. Jang IK, Tearney GJ, MacNeill B, Takano M, Moselewski F, Iftima N, Shishkov M, Houser S, Aretz HT, Halpern EF, Bouma BE. In vivo characterization of coronary atherosclerotic plaque by use of optical coherence tomography. Circulation. 2005;111:1551-1555.
6. Kume T, Akasaka T, Kawamoto T, Watanabe N, Toyota E, Neishi Y, Sukmawan R, Sadahira Y, Yoshida K. Assessment of coronary arterial plaque by optical coherence tomography. Am J Cardiol. 2006;97:1172-1175.
7. Diagnosis and classification of diabetes mellitus. Diabetes Care.36 Suppl 1:S67-74. 8. Conen D, Rexrode KM, Creager MA, Ridker PM, Pradhan AD. Metabolic
syndrome, inflammation, and risk of symptomatic peripheral artery disease in women: a prospective study. Circulation. 2009;120:1041-1047.
9. Arnlov J, Ingelsson E, Sundstrom J, Lind L. Impact of body mass index and the metabolic syndrome on the risk of cardiovascular disease and death in middle-aged men. Circulation. 2010;121:230-236.
10. Kato K, Yonetsu T, Kim SJ, Xing L, Lee H, McNulty I, Yeh RW, Sakhuja R, Zhang S, Uemura S, Yu B, Mizuno K, Jang IK. Non-Culprit Plaques in Patients with Acute Coronary Syndromes (ACS) Have More Vulnerable Features Compared to Those with Non-ACS: A 3-Vessel Optical Coherence Tomography Study. Circ Cardiovasc Imaging. 2012;5:660-666
11. Burke AP, Farb A, Malcom GT, Liang YH, Smialek J, Virmani R. Coronary risk factors and plaque morphology in men with coronary disease who died suddenly. N Engl J Med. 1997;336:1276-1282.
12. Tearney GJ, Yabushita H, Houser SL, Aretz HT, Jang IK, Schlendorf KH, Kauffman CR, Shishkov M, Halpern EF, Bouma BE. Quantification of macrophage content in atherosclerotic plaques by optical coherence tomography. Circulation. 2003;107:113-119.
13. MacNeill BD, Jang IK, Bouma BE, Iftimia N, Takano M, Yabushita H, Shishkov M, Kauffman CR, Houser SL, Aretz HT, DeJoseph D, Halpern EF, Tearney GJ. Focal and multi-focal plaque macrophage distributions in patients with acute and stable presentations of coronary artery disease. J Am Coll Cardiol. 2004;44:972-979.
haracterizationonnnnnn oogogogogoggogrararararararaphphphphphphphy.y.y.y.y.y.y. CCCCCCCiriririririrircucucucucucuculalalalalalala
Akasaka T, Kawamoto T, Watanabe N, Toyota E, Neishi Y, Si
ta pR oi e
prospective study Circulation 2009;120:1041-1047
Akaaaaasasasasasakakakakaka TTTTT, KaKKKK wamoto T, Wataaaaanananananabe N, Toyoooootatatatata E, Neishi Y, S, YoYYYY shiddddda aaaa K.KKKK AAAAAssssssssssesesesesessmsmsmsmsmenenenenent ttt ofofofofof corooonananananaryryryryry aartrtrtrtrtererere iaiaiaiaial llll plllllaqaqaqaqaqueueueueue bbbbby y y y y opopopopoptitooooommmomm graphyhyy. AmAmA JJJ Carddioool. 222006066;999997:7:7:7:7:11111 72722-1175.5.5.5 andndndndd ccccclalalalalassssss ifififfficiciciccatatatttiooiooon nn ofofofofof dddddiiiaii bebebebebetetetetetess sss mememememelllllllllitititititususususus. DDDDDiaiaiaiaiabebebebb tetetes sss CaCaCaCaCarerererr .3366666 SuSuSuSuSupRexrode KMMMMM, ,,, CrCrCrCrCreaeaeaeaagegegegeer rrr r MAMAMAMAMA,,,, RiRiRiRRidkdkdkdkkereerere PPPM,M,M,MM PPPPPrararararadhdhdhdhdhananananan AAAAAD. Metaboinininflflflamamammamamatititiononon, ,,,, anananddd riririsksksk ooofff sysysyyympmpmppptototomamamamm tititiccc pepeperiririphphphphp erereralalal aaartrtrterereryyy dididisesese
ppprororospspspececectiitiiiveveve ssstututudyddydd CiCiCiC rcrcrc lulullatatatioiioii nnn 2222200000000 9;9;999 1212121220:0:00 101010101041414144 -11111040404004777
by guest on June 10, 2018http://circim
aging.ahajournals.org/D
ownloaded from
14. Tearney GJ, Waxman S, Shishkov M, Vakoc BJ, Suter MJ, Freilich MI, Desjardins AE, Oh WY, Bartlett LA, Rosenberg M, Bouma BE. Three-dimensional coronary artery microscopy by intracoronary optical frequency domain imaging. J Am Coll Cardiol Img. 2008;1:752-761.
15. Takano M, Yamamoto M, Inami S, Murakami D, Ohba T, Seino Y, Mizuno K. Appearance of lipid-laden intima and neovascularization after implantation of bare-metal stents extended late-phase observation by intracoronary optical coherence tomography. J Am Coll Cardiol. 2009;55:26-32.
16. Yabushita H, Bouma BE, Houser SL, Aretz HT, Jang IK, Schlendorf KH, Kauffman CR, Shishkov M, Kang DH, Halpern EF, Tearney GJ. Characterization of human atherosclerosis by optical coherence tomography. Circulation. 2002;106:1640-1645.
17. Falk E, Shah PK, Fuster V. Coronary plaque disruption. Circulation. 1995;92:657-671.
18. Hong YJ, Jeong MH, Choi YH, Ko JS, Lee MG, Kang WY, Lee SE, Kim SH, Park KH, Sim DS, Yoon NS, Yoon HJ, Kim KH, Park HW, Kim JH, Ahn Y, Cho JG, Park JC, Kang JC. Plaque characteristics in culprit lesions and inflammatory status in diabetic acute coronary syndrome patients. J Am Coll Cardiol Img. 2009;2:339-349.
19. Zheng M, Choi SY, Tahk SJ, Lim HS, Yang HM, Choi BJ, Yoon MH, Park JS, Hwang GS, Shin JH. The relationship between volumetric plaque components and classical cardiovascular risk factors and the metabolic syndrome a 3-vessel coronary artery virtual histology-intravascular ultrasound analysis. J Am Coll Cardiol Intv. 2011;4:503-510.
20. Niccoli G, Giubilato S, Di Vito L, Leo A, Cosentino N, Pitocco D, Marco V, Ghirlanda G, Prati F, Crea F. Severity of coronary atherosclerosis in patients with a first acute coronary event: a diabetes paradox. Eur Heart J. 2012;34:729-741.
21. Marso SP, Mercado N, Maehara A, Weisz G, Mintz GS, McPherson J, Schiele F, Dudek D, Fahy M, Xu K, Lansky A, Templin B, Zhang Z, de Bruyne B, Serruys PW, Stone GW. Plaque composition and clinical outcomes in acute coronary syndrome patients with metabolic syndrome or diabetes. J Am Coll Cardiol Img. 2012;5(3 Suppl):S42-52.
22. Tanaka A, Imanishi T, Kitabata H, Kubo T, Takarada S, Tanimoto T, Kuroi A, Tsujioka H, Ikejima H, Ueno S, Kataiwa H, Okouchi K, Kashiwaghi M, Matsumoto H, Takemoto K, Nakamura N, Hirata K, Mizukoshi M, Akasaka T. Morphology of exertion-triggered plaque rupture in patients with acute coronary syndrome: an optical coherence tomography study. Circulation. 2008;118:2368-2373.
23. Yonetsu T, Kakuta T, Lee T, Takahashi K, Kawaguchi N, Yamamoto G, Koura K, Hishikari K, Iesaka Y, Fujiwara H, Isobe M. In vivo critical fibrous cap thickness for rupture-prone coronary plaques assessed by optical coherence tomography. Eur Heart J. 2011;32:1251-1259.
24. Takarada S, Imanishi T, Ishibashi K, Tanimoto T, Komukai K, Ino Y, Kitabata H, Kubo T, Tanaka A, Kimura K, Mizukoshi M, Akasaka T. The effect of lipid and inflammatory profiles on the morphological changes of lipid-rich plaques in patients with non-ST-segment elevated acute coronary syndrome: follow-up study
ons and inflammmmmmmmmmmmmmlllllll lllll CaCaCaCaCaCaCardrdrdrdrdrdrdioioioioioioiol l l l l l l ImImImImImImImg.g.g.g.gg.g. 2222222
Choi SY, Tahk SJ, Lim HS, Yang HM, Choi BJ, Yoon MH,, Shin JH. The relationship between volumetric plaque co p
a er mvGiubilato S, Di Vito L, Leo A, Cosentino N, Pitocco D, MarG Prati F Crea F Severity of coronary atherosclerosis in pa
Chohohohohoi i i i i SYSYSYSYSY,,,, , TaTaTaTaTahk SJ, Lim HS, Yaaaaangnnnn HM, Choi iii i BJBBBB , Yoon MH,, ShShShShS in JH.HHH.H. TTTTThehehehehe rrrrrelelellelatatatatatioioioioionsnsnsnsn hihihihh p ppp bebb twwweeeeeen n n nn vovovovovolululululumemememeetrtrtrtrt ic ppppplalalaaaququququque e e ee cococococompmmmm
ardrdrdrdrdioiiii vascullaaar rrrisk fafafaf ctorss annnddd thheee mememememetatatatatabobolic sysyyndndndn romememee aa 3-v-vverterrrrryy yyy vivivivivirtrtrtrtrtuauauaall hihihihihistststttoloo ogogogogo y-y-y-y-y innnntrtrtrtrtravavavavavasasasaascucucucuculalalalalarrrr r ululululultrtrtrtrtrasasasasasouououououndndndndd aaaaanananannalylylylylysisisisisisss. JJJJJ AAAAAmv. 2011;4:5550303030303-5-5-5-5-5101010100.. GGGiuiuiubibibilalalatototo SSS, ,, DiDiDi VVVitititooo L,L,L, LLLeoeoeo AAA, ,, CoCoCoseseseeentntntinininooo N,N,N,N,, PPPitititocococcococo DDD, MaMaMarrrGG PPPrararatiitiii FFF CrCrCCC eaeaea FFF SeSeSS veveveriiriiitytyty ooofffff cococorororonananaryryry aaaththhherererosososcllcllerererosososisisiii iinnn papapa
by guest on June 10, 2018http://circim
aging.ahajournals.org/D
ownloaded from
by optical coherence tomography and intravascular ultrasound. J Am Coll Cardiol Intv. 2010;3:766-772.
25. Sattar N, Gaw A, Scherbakova O, Ford I, O'Reilly DS, Haffner SM, Isles C, Macfarlane PW, Packard CJ, Cobbe SM, Shepherd J. Metabolic syndrome with and without C-reactive protein as a predictor of coronary heart disease and diabetes in the West of Scotland Coronary Prevention Study. Circulation. 2003;108:414-419.
26. Huang PL. eNOS, metabolic syndrome and cardiovascular disease. Trends Endocrinol Metab. 2009;20:295-302.
27. Sattar N, McConnachie A, Shaper AG, Blauw GJ, Buckley BM, de Craen AJ, Ford I, Forouhi NG, Freeman DJ, Jukema JW, Lennon L, Macfarlane PW, Murphy MB, Packard CJ, Stott DJ, Westendorp RG, Whincup PH, Shepherd J, Wannamethee SG. Can metabolic syndrome usefully predict cardiovascular disease and diabetes? Outcome data from two prospective studies. Lancet. 2008;371:1927-1935.
28. Kahn R. Metabolic syndrome: Is it a syndrome? Does it matter? Circulation. 2007;115:1806-1810; discussion 1811.
29. Prati F, Regar E, Mintz GS, Arbustini E, Di Mario C, Jang IK, Akasaka T, Costa M, Guagliumi G, Grube E, Ozaki Y, Pinto F, Serruys PW. Expert review document on methodology, terminology, and clinical applications of optical coherence tomography: physical principles, methodology of image acquisition, and clinical application for assessment of coronary arteries and atherosclerosis. Eur Heart J. 2010;31:401-415.
30. Tearney G, Jang IK, Bouma B. Evidence of Cholesterol Crystals in Atherosclerotic Plaque by Optical Coherence Tomographic (OCT) Imaging. Eur Heart J. 2003;24:1.
31. Doyle B, Caplice N. Plaque neovascularization and antiangiogenic therapy for atherosclerosis. J Am Coll Cardiol. 2007;49:2073-2080.
32. Khurana R, Simons M, Martin JF, Zachary IC. Role of angiogenesis in cardiovascular disease: a critical appraisal. Circulation. 2005;112:1813-1824.
33. Wong ND, Nelson JC, Granston T, Bertoni AG, Blumenthal RS, Carr JJ, Guerci A, Jacobs DR, Jr., Kronmal R, Liu K, Saad M, Selvin E, Tracy R, Detrano R. Metabolic syndrome, diabetes, and incidence and progression of coronary calcium: the Multiethnic Study of Atherosclerosis study. J Am Coll Cardiol Img. 2012;5:358-366.
34. Tearney GJ, Regar E, Akasaka T, Adriaenssens T, Barlis P, Bezerra HG, Bouma B, Bruining N, Cho JM, Chowdhary S, Costa MA, de Silva R, Dijkstra J, Di Mario C, Dudek D, Falk E, Feldman MD, Fitzgerald P, Garcia-Garcia HM, Gonzalo N, Granada JF, Guagliumi G, Holm NR, Honda Y, Ikeno F, Kawasaki M, Kochman J, Koltowski L, Kubo T, Kume T, Kyono H, Lam CC, Lamouche G, Lee DP, Leon MB, Maehara A, Manfrini O, Mintz GS, Mizuno K, Morel MA, Nadkarni S, Okura H, Otake H, Pietrasik A, Prati F, Raber L, Radu MD, Rieber J, Riga M, Rollins A, Rosenberg M, Sirbu V, Serruys PW, Shimada K, Shinke T, Shite J, Siegel E, Sonoda S, Suter M, Takarada S, Tanaka A, Terashima M, Thim T, Uemura S, Ughi GJ, van Beusekom HM, van der Steen AF, van Es GA, van Soest G, Virmani R, Waxman S, Weissman NJ, Weisz G. Consensus standards for acquisition, measurement, and reporting of intravascular optical coherence tomography studies: a report from the International Working Group for Intravascular Optical Coherence
Expert review w ww ww w ddopopopopopopoptititititititicacacacacacacal l ll lll cococococococoheheheheheheherereeeeeenncncncncnnce acqqqqqqquiuiuiuiuiuiuisisisisisisis tititititititiononononononon, , , , , ,, anaaaaa
for assessment of coronary arteries and atherosclerosis. Eur0
hO
C roSimons M Martin JF Zachary IC Role of angiogenesis in
fooooor r r r r asasasasassesesesesessssssssssmemmmm nt of coronary arrrrteteteteterirr es and atherererererosclerosis. Eur01-1-1-1-1-444144 5.
JJJJJaaanaa g IK, BoBB umumuma BBB.B Eviidddencncce ofof ChChChChCholooloo essteerool CrCrCrC ysyyy taaallslll inn AtAA hOppppptititititicacacacacalllll CoCoCoCoCohehehehehererererr nnncnn e ToToToToTomomoomomogrgrgrgrgrapapapapaphihihihih cc ccc (O(O(OOOCTCTCTCTCT) )))) ImImImImImagagagaa inininini g.gggg EEEEEururururu HHHHHeaeaeaae rtrtrtrr
Caplice N. PlPlPlPlPlaqaqaqaqaqueueueueue nnnnneoeoeooovavavavavascscscscscululululularaaraariziziizatatatatatioioioioionn ananannd dddd ananananantitititit anananangggggioioioii genic therooosisisisss. JJJ AAAmmm CoCoCollllll CCCararardididiololol.. 202020070707;4;4;4; 9:9:9:20202000737373 22-208080880.000 SSimimonononsss MMM MMMararartiitiinnn JFJFJF ZZZacacachahhah ryryry IIICCC RRRolollleee ofoffff aaangngngioioii gegegenenenesisisss inin
by guest on June 10, 2018http://circim
aging.ahajournals.org/D
ownloaded from

Tomography Standardization and Validation. J Am Coll Cardiol. 2012;59:1058-1072.
by guest on June 10, 2018http://circim
aging.ahajournals.org/D
ownloaded from
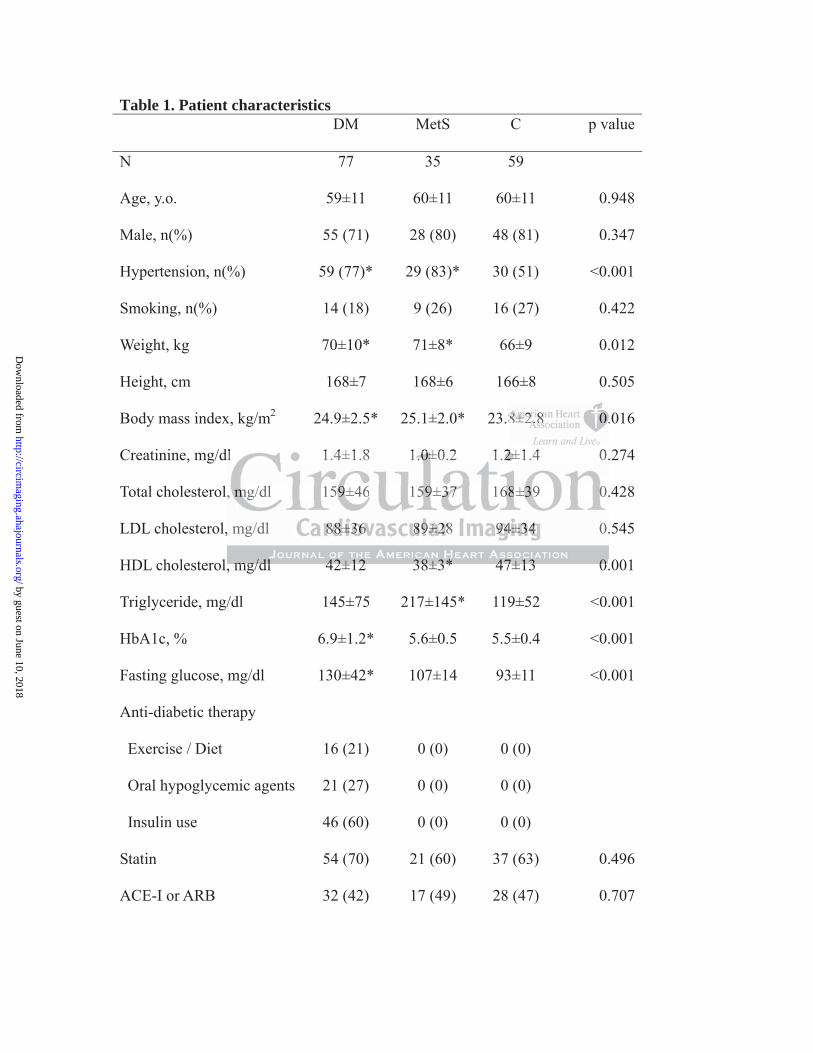
Table 1. Patient characteristics DM MetS C p value
N 77 35 59
Age, y.o. 59±11 60±11 60±11 0.948
Male, n(%) 55 (71) 28 (80) 48 (81) 0.347
Hypertension, n(%) 59 (77)* 29 (83)* 30 (51) <0.001
Smoking, n(%) 14 (18) 9 (26) 16 (27) 0.422
Weight, kg 70±10* 71±8* 66±9 0.012
Height, cm 168±7 168±6 166±8 0.505
Body mass index, kg/m2 24.9±2.5* 25.1±2.0* 23.8±2.8 0.016
Creatinine, mg/dl 1.4±1.8 1.0±0.2 1.2±1.4 0.274
Total cholesterol, mg/dl 159±46 159±37 168±39 0.428
LDL cholesterol, mg/dl 88±36 89±28 94±34 0.545
HDL cholesterol, mg/dl 42±12 38±3* 47±13 0.001
Triglyceride, mg/dl 145±75 217±145* 119±52 <0.001
HbA1c, % 6.9±1.2* 5.6±0.5 5.5±0.4 <0.001
Fasting glucose, mg/dl 130±42* 107±14 93±11 <0.001
Anti-diabetic therapy
Exercise / Diet 16 (21) 0 (0) 0 (0)
Oral hypoglycemic agents 21 (27) 0 (0) 0 (0)
Insulin use 46 (60) 0 (0) 0 (0)
Statin 54 (70) 21 (60) 37 (63) 0.496
ACE-I or ARB 32 (42) 17 (49) 28 (47) 0.707
8±8±8±8±8±8±8±2.2.2.2.2.2.2.8888888 0.0.0.0.0.0.0.
dl 1.4±1.8 1.0±0.2 1.2±1.4 0.
, mg/dl 159±46 159±37 168±39 .
, mg/dl 88±36 89±28 94±34 0.
mg/dl 42±12 38±3* 47±13 0
dl 1.4±1.8 1.0±0±0±0±0±0.2 1.2±2±2±2±2±1.4 0.
, mmmmmg/dl 159999±4666 155999±3737373737 168688±3±3±3± 9 0.
, mg/dl 888888±8±8±8±8 3636363636 888889±9±±±±282828288 999994±4±4±4±4±3434343434 0.
mmmg/g/dldl 442±2±1212 338±8±3*3* 447±7±7±1313 00
by guest on June 10, 2018http://circim
aging.ahajournals.org/D
ownloaded from

Acute coronary syndrome 26 (34) 15 (43) 15 (24) 0.155
STEMI 7 (9) 4 (11) 7 (12) 0.856
NSTEMI / UAP 19 (25) 11 (31) 8 (14) 0.103
* p<0.05 vs. C. LDL indicates low density lipoprotein; HDL, high density lipoprotein;
ACE-I, angiotensin converting enzyme inhibitor; ARB, angiotensin-II receptor blocker;
STEMI, ST-elevation myocardial infarction; NSTEMI, non-ST-elevation myocardial
infarction; UAP, unstable angina.
by guest on June 10, 2018http://circim
aging.ahajournals.org/D
ownloaded from
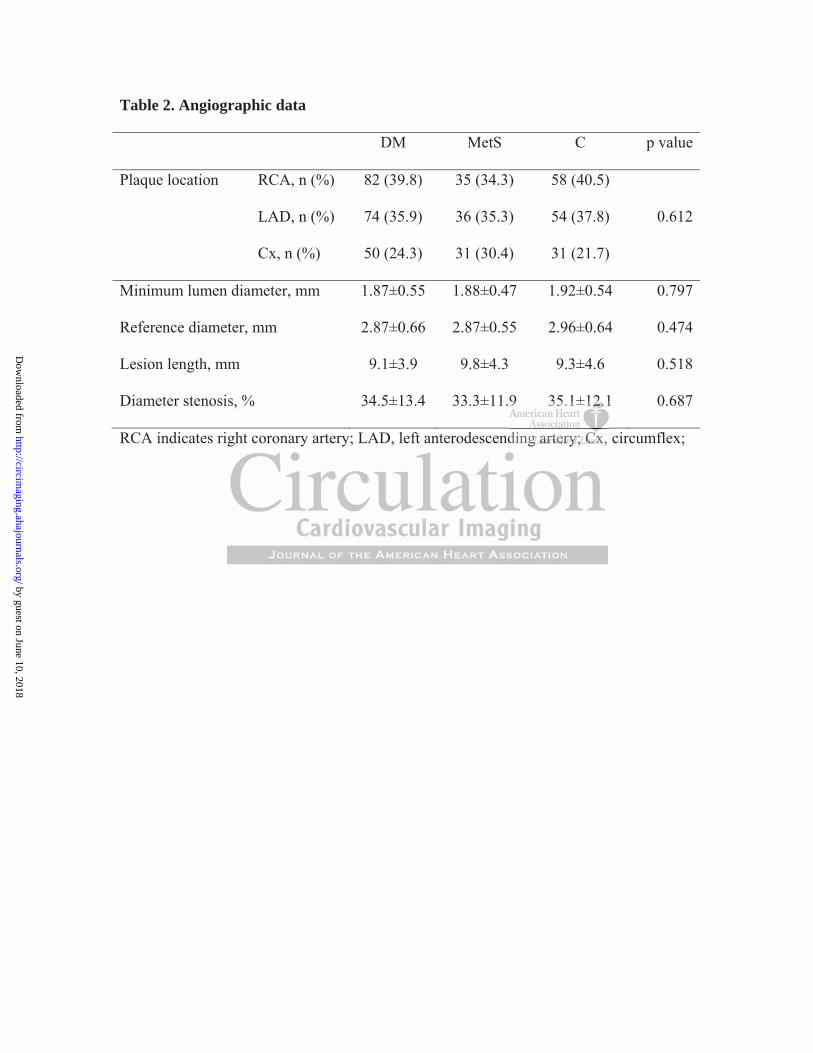
Table 2. Angiographic data
DM MetS C p value
Plaque location RCA, n (%) 82 (39.8) 35 (34.3) 58 (40.5)
LAD, n (%) 74 (35.9) 36 (35.3) 54 (37.8) 0.612
Cx, n (%) 50 (24.3) 31 (30.4) 31 (21.7)
Minimum lumen diameter, mm 1.87±0.55 1.88±0.47 1.92±0.54 0.797
Reference diameter, mm 2.87±0.66 2.87±0.55 2.96±0.64 0.474
Lesion length, mm 9.1±3.9 9.8±4.3 9.3±4.6 0.518
Diameter stenosis, % 34.5±13.4 33.3±11.9 35.1±12.1 0.687
RCA indicates right coronary artery; LAD, left anterodescending artery; Cx, circumflex;
9 35.1±112.2.2.2.2.2.2.1
ding g g g g g g arararararararteteteteteteteryryryryryryry; ; ; ; ; ; CxCxCxCxCxCxCx,
by guest on June 10, 2018http://circim
aging.ahajournals.org/D
ownloaded from
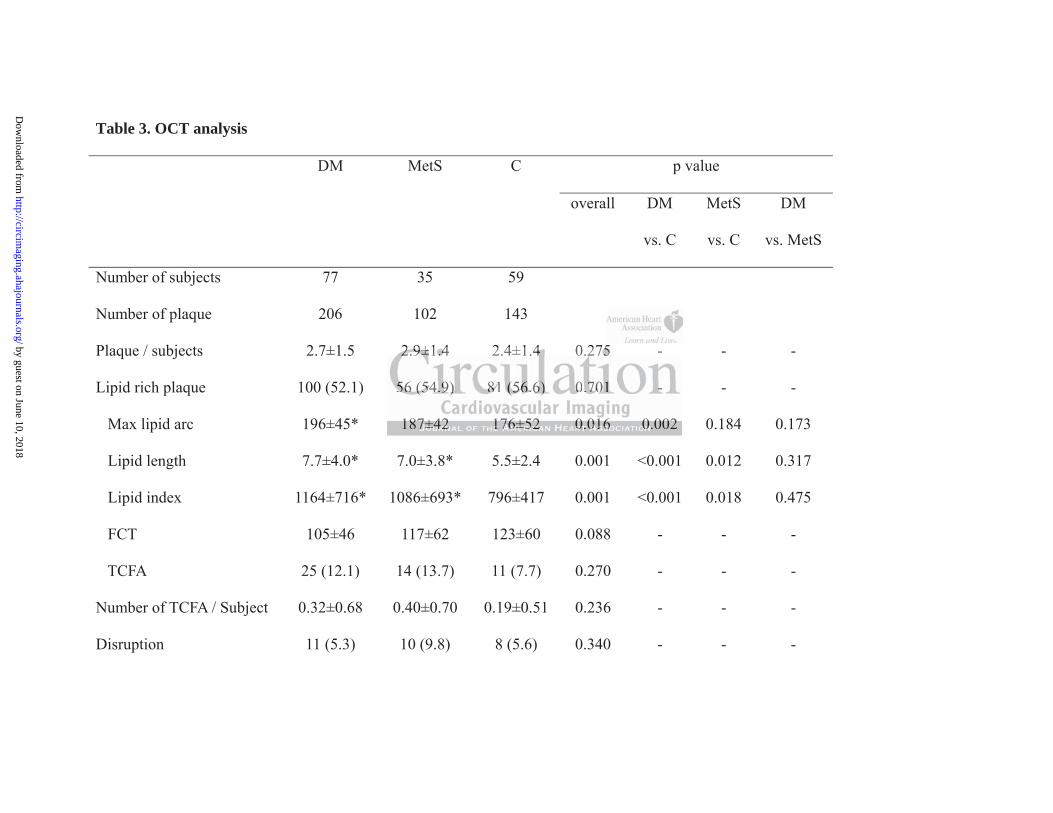
Table 3. OCT analysis
DM MetS C p value
overall DM
vs. C
MetS
vs. C
DM
vs. MetS
Number of subjects 77 35 59
Number of plaque 206 102 143
Plaque / subjects 2.7±1.5 2.9±1.4 2.4±1.4 0.275 - - -
Lipid rich plaque 100 (52.1) 56 (54.9) 81 (56.6) 0.701 - - -
Max lipid arc 196±45* 187±42 176±52 0.016 0.002 0.184 0.173
Lipid length 7.7±4.0* 7.0±3.8* 5.5±2.4 0.001 <0.001 0.012 0.317
Lipid index 1164±716* 1086±693* 796±417 0.001 <0.001 0.018 0.475
FCT 105±46 117±62 123±60 0.088 - - -
TCFA 25 (12.1) 14 (13.7) 11 (7.7) 0.270 - - -
Number of TCFA / Subject 0.32±0.68 0.40±0.70 0.19±0.51 0.236 - - -
Disruption 11 (5.3) 10 (9.8) 8 (5.6) 0.340 - - -
2.9±1.4 2.4±1.4 0.275 -
56 (54.9) 81 (56.6) 0.701 -
187±42 176±52 0.016 0.002
2.2.2.2.2.9±9±9±9±9±1....4 4444 2.4±1.4 44 44 0.27272772755555 -
55555666 66 (5(5(5(5(54.4.4.44 9)9)9)9)9) 8888811111 (5(5(5(5(56.6.6.6.6.6)6)6)6)6) 00000.7.7.7.7.70101010101 --
1818187±7±7±7±7±4242424242 11117676767676±5±5±5±5±522222 0.0.0.0.0 010101010166666 0.0.0.00 000000222
by guest on June 10, 2018http://circim
aging.ahajournals.org/D
ownloaded from
Calcification 90 (43.7) 30 (29.4) 59 (41.3) 0.048 0.462 0.123 0.028
Macrophage accumulation 64 (31.1) 32 (31.4) 40 (28.0) 0.788 - - -
Microvessels 74 (35.9) 46 (45.1) 45 (31.5) 0.089 - - -
Cholesterol crystal 40 (19.4) 18 (17.6) 20 (19.6) 0.416 - - -
*<0.05 versus C. FCT indicates fibrous cap thickness; TCFA, thin-cap fibroatheroma.
by guest on June 10, 2018http://circim
aging.ahajournals.org/D
ownloaded from
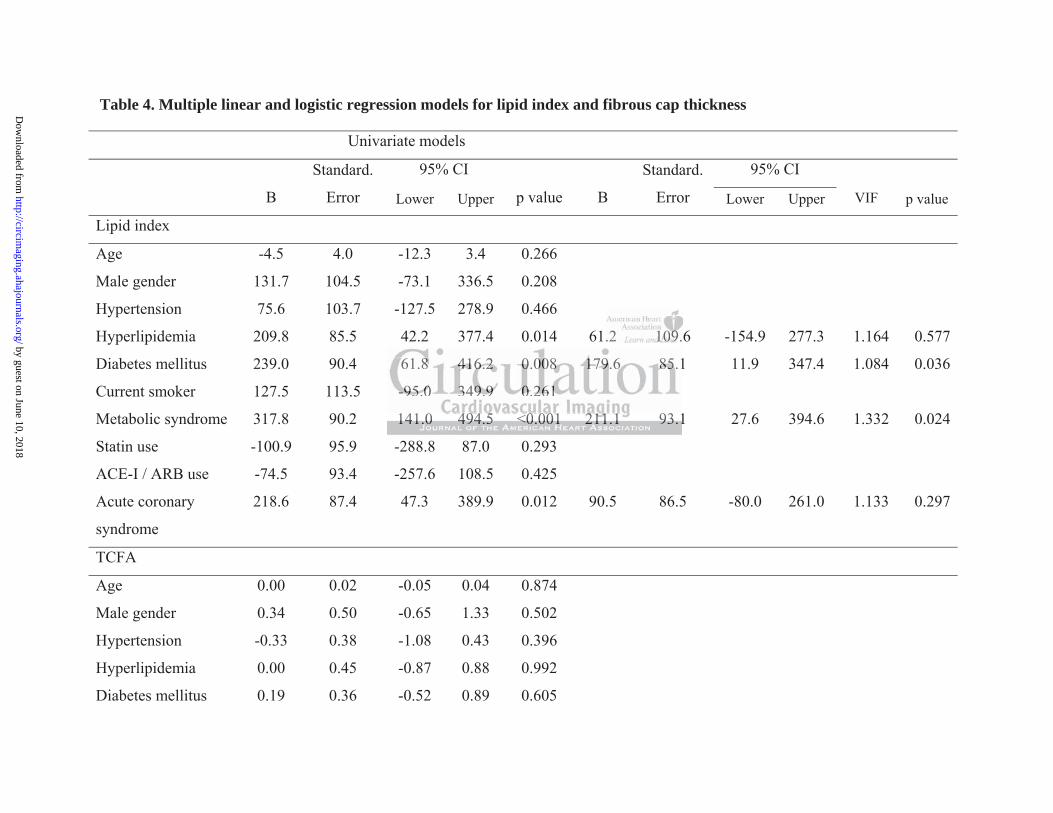
Table 4. Multiple linear and logistic regression models for lipid index and fibrous cap thickness
Univariate models
B
Standard.
Error
95% CI
B
Standard.
Error
95% CI
Lower Upper p value Lower Upper VIF p value
Lipid index
Age -4.5 4.0 -12.3 3.4 0.266
Male gender 131.7 104.5 -73.1 336.5 0.208
Hypertension 75.6 103.7 -127.5 278.9 0.466
Hyperlipidemia 209.8 85.5 42.2 377.4 0.014 61.2 109.6 -154.9 277.3 1.164 0.577
Diabetes mellitus 239.0 90.4 61.8 416.2 0.008 179.6 85.1 11.9 347.4 1.084 0.036
Current smoker 127.5 113.5 -95.0 349.9 0.261
Metabolic syndrome 317.8 90.2 141.0 494.5 <0.001 211.1 93.1 27.6 394.6 1.332 0.024
Statin use -100.9 95.9 -288.8 87.0 0.293
ACE-I / ARB use -74.5 93.4 -257.6 108.5 0.425
Acute coronary
syndrome
218.6 87.4 47.3 389.9 0.012 90.5 86.5 -80.0 261.0 1.133 0.297
TCFA
Age 0.00 0.02 -0.05 0.04 0.874
Male gender 0.34 0.50 -0.65 1.33 0.502
Hypertension -0.33 0.38 -1.08 0.43 0.396
Hyperlipidemia 0.00 0.45 -0.87 0.88 0.992
Diabetes mellitus 0.19 0.36 -0.52 0.89 0.605
.2 101010101010109.9.99999
1
-95.0 349.9 0.261
141.0 494.5 <0.001 211.1 93.1
661.88888 41414141416.6.6.6.6.22222 0.00 000008 88 88 17171717179.9999 6 66 6 6 8585858585.1
-----9595959595.00000 3333349499499.99999 00000 22.2226161616161
141414111.000 4949494949444.4 55555 <0<0<000.00000010101010 222221111111111 111.11 999333.111
by guest on June 10, 2018http://circim
aging.ahajournals.org/D
ownloaded from
TCFA indicates thin cap fibroatheroma; ACE-I, angiotensin converting enzyme inhibitor; ARB, angiotensin-II receptor blocker; VIF,
variance inflation factor.
Current smoker 0.87 0.39 0.11 1.63 0.024 0.53 0.35 -0.17 1.22 1.080 0.136
Metabolic syndrome 0.53 0.37 -0.19 1.25 0.147
Statin use -0.82 0.35 -1.51 -0.13 0.020 -0.49 0.35 -1.17 0.19 1.144 0.155
ACE-I / ARB use -0.09 0.37 -0.81 0.63 0.811
Acute coronary
syndrome
1.23 0.37 0.50 1.96 0.001 0.89 0.36 0.18 1.60 1.085 0.014
by guest on June 10, 2018http://circim
aging.ahajournals.org/D
ownloaded from
Figure Legends
Figure 1. Study population
From the subjects who were enrolled in the MGH OCT registry, we selected those who
underwent OCT investigations for 3 coronary vessels in the same procedure. After exclusion of
the subjects who had insufficient image quality and incomplete demographic data, a total of 198
subjects were analyzed and 451 plaques from 171 subjects were identified in the final dataset.
Figure 2. Categorization of subjects.
Subjects were divided into 3 groups: Subjects with diabetes mellitus (DM group), non-diabetic
subjects with metabolic syndrome (MetS group), and subjects without diabetes mellitus or
metabolic syndrome (C group). Subjects with 3 MetS factors were diagnosed as MetS.
Figure 3. Representative images for optical coherence tomography (OCT) analyses. A:
Measurement of lipid arc for a lipid-rich plaque. Lipid arc was measured every 1mm within a
lipid-rich plaque (yellow lines). B: Lipid core length, defined as the length of plaque with >90
degrees of lipid, was measured in the longitudinal view (white arrow). C: Measurement of
fibrous cap thickness. Fibrous cap thickness was measured at the thinnest part 3 times and the
values were averaged (white arrows). D: Macrophage accumulation on the OCT images was
defined as increased signal intensity within the fibrous cap, accompanied by heterogeneous
backward shadows (arrow heads). E: Microvessels were defined as small vesicular or tubular
structures with diameters 50 - 300 m and differentiated from any other branch (green arrow).
itus (D(D(D(D(D(D(DMMMMMMM grgrgrgrgrgrgrouououououououp)ppp
o molllill ccccc syndddddroooroomememememe (((((MeMeMeMeMetStStStStS gggggrorororooupupupup),),),)) annddd sususususubjbjbjbjbjececececectstststts wwwwwititititithoooooutututuu dddddiaiaiaiai bebebebebetetetetetes ssss m
(C CCCC grgrgrgrgrouououououp)p)p)p)p). SuSuSuSuSubjbjbjbjb ecccctstststst wwwwwitth hhhh 333 33 MeMeMeMeM tStStStStS fffffacacacacactototototorsrsrsrrs wwwwwererere dididididiagagagagagnononoon sesesessed dddd aaaa
by guest on June 10, 2018http://circim
aging.ahajournals.org/D
ownloaded from
Figure 4. Correlation between the number of MetS factors and plaque characteristics as
represented by lipid index and fibrous cap thickness.
A: Correlation between the number of MetS factors and maximum lipid arc (rho=0.182,
p=0.005). B: Correlation between the number of MetS factors and lipid core length (rho=0.202,
p=0.002). C: Correlation between the number of MetS factors and lipid index (rho=0.225,
p<0.001). D: Correlation between the number of factors and thinnest FCT. (rho=-0.116,
p=0.075).
by guest on June 10, 2018http://circim
aging.ahajournals.org/D
ownloaded from

1406 SubjectsEnrolled between Aug 2010 to May 2012
198 Subjects with 3 vessels imaging
451 Non-culprit / Non-target plaques from 171 Subjects
2 vessel imagingN=332
1 vessel imagingN=819
3 vessel imagingN=255
Exclusion Insufficient image quality (n=27)Incomplete demographic data (n=30)
Figure 1
Non-culprit / Non-target plaques >50% area stenosis
iinngggggggN 332
ality (n=27)
N 332
aaallliiitttttyyyyy (((((nnnnn=====2222277777)))))
by guest on June 10, 2018http://circim
aging.ahajournals.org/D
ownloaded from
DM group: 77 subjects
Non-DM patients: 94 subjects
206 plaques
MetS group: 35 subjects
MetS Factors 2 2
HDL-C
<3 factors C group: 59 subjects
Figure 2
22222
by guest on June 10, 2018http://circim
aging.ahajournals.org/D
ownloaded from
Lipid
1mm
1mm 1mm1mm
Figure 3
A
C ED
B
Lipid
B
by guest on June 10, 2018http://circim
aging.ahajournals.org/D
ownloaded from
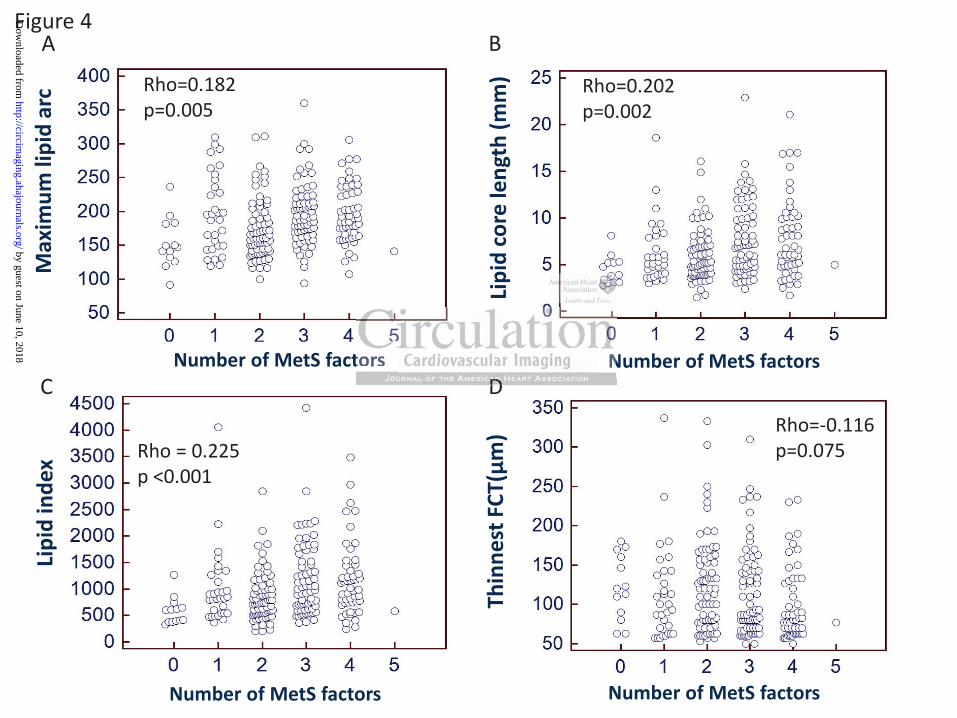
Figure 4 Li
pid
inde
x
Number of MetS factors
Number of MetS factors
Rho = 0.225 p <0.001
A B M
axim
um li
pid
arc
Lipi
d co
re le
ngth
(mm
) Th
inne
st F
CT(μ
m)
Number of MetS factors
Number of MetS factors
C D Rho=-0.116 p=0.075
Rho=0.202 p=0.002
Rho=0.182 p=0.005
t ND
tors NDDDDD
by guest on June 10, 2018http://circim
aging.ahajournals.org/D
ownloaded from
Tsunekazu Kakuta and Ik-Kyung JangTian, Sining Hu, Robert W. Yeh, Rahul Sakhuja, Iris McNulty, Hang Lee, Shaosong Zhang, Bo Yu,Seung-Jung Park, Stephen Lee, Soo-Joong Kim, Haibo Jia, Rocco Vergallo, Farhad Abtahian, Jinwei
Taishi Yonetsu, Koji Kato, Shiro Uemura, Byeong-Keuk Kim, Yangsoo Jang, Soo-Jin Kang,Assessed by 3-vessel Optical Coherence Tomography
Features of Coronary Plaque in Patients with Metabolic Syndrome and Diabetes Mellitus
Print ISSN: 1941-9651. Online ISSN: 1942-0080 Copyright © 2013 American Heart Association, Inc. All rights reserved.
TX 75231is published by the American Heart Association, 7272 Greenville Avenue, Dallas,Circulation: Cardiovascular Imaging
published online August 6, 2013;Circ Cardiovasc Imaging.
http://circimaging.ahajournals.org/content/early/2013/08/06/CIRCIMAGING.113.000345World Wide Web at:
The online version of this article, along with updated information and services, is located on the
http://circimaging.ahajournals.org/content/suppl/2013/08/06/CIRCIMAGING.113.000345.DC1Data Supplement (unedited) at:
http://circimaging.ahajournals.org//subscriptions/
is online at: Circulation: Cardiovascular Imaging Information about subscribing to Subscriptions:
http://www.lww.com/reprints Information about reprints can be found online at: Reprints:
document. Permissions and Rights Question and Answer this process is available in the
located, click Request Permissions in the middle column of the Web page under Services. Further information aboutnot the Editorial Office. Once the online version of the published article for which permission is being requested is
can be obtained via RightsLink, a service of the Copyright Clearance Center,Circulation: Cardiovascular Imaging Requests for permissions to reproduce figures, tables, or portions of articles originally published inPermissions:
by guest on June 10, 2018http://circim
aging.ahajournals.org/D
ownloaded from
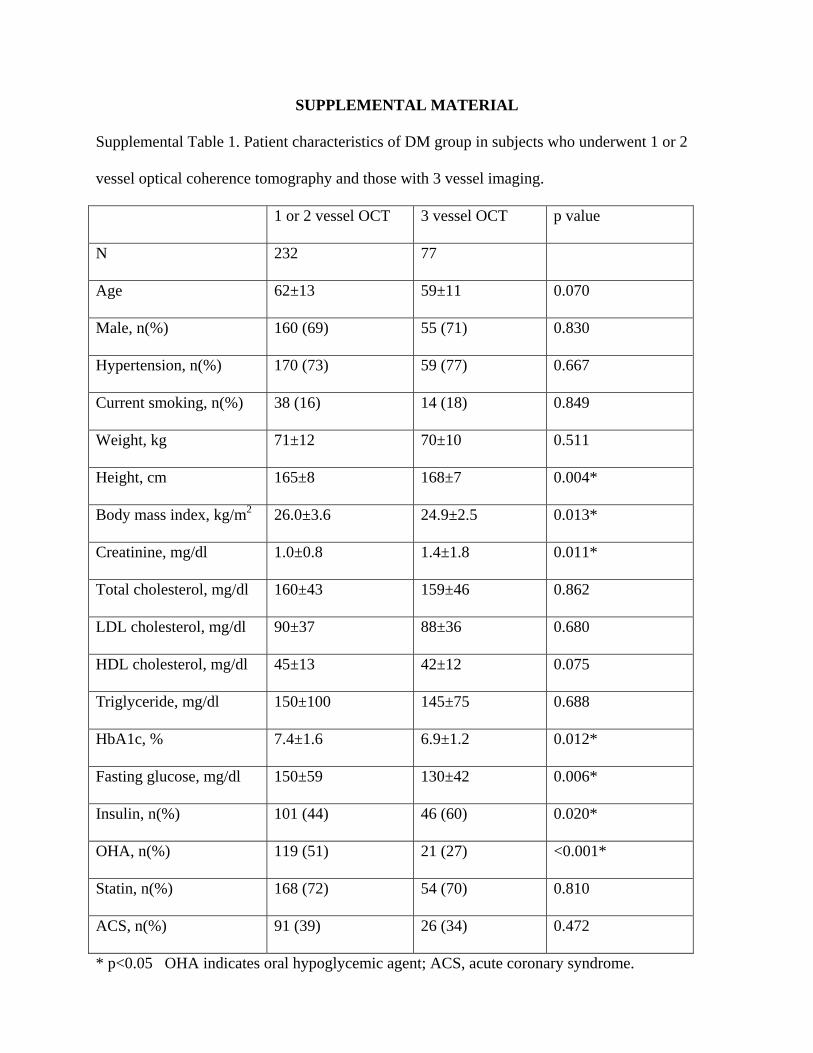
SUPPLEMENTAL MATERIAL
Supplemental Table 1. Patient characteristics of DM group in subjects who underwent 1 or 2
vessel optical coherence tomography and those with 3 vessel imaging.
1 or 2 vessel OCT 3 vessel OCT p value
N 232 77
Age 62±13 59±11 0.070
Male, n(%) 160 (69) 55 (71) 0.830
Hypertension, n(%) 170 (73) 59 (77) 0.667
Current smoking, n(%) 38 (16) 14 (18) 0.849
Weight, kg 71±12 70±10 0.511
Height, cm 165±8 168±7 0.004*
Body mass index, kg/m2 26.0±3.6 24.9±2.5 0.013*
Creatinine, mg/dl 1.0±0.8 1.4±1.8 0.011*
Total cholesterol, mg/dl 160±43 159±46 0.862
LDL cholesterol, mg/dl 90±37 88±36 0.680
HDL cholesterol, mg/dl 45±13 42±12 0.075
Triglyceride, mg/dl 150±100 145±75 0.688
HbA1c, % 7.4±1.6 6.9±1.2 0.012*
Fasting glucose, mg/dl 150±59 130±42 0.006*
Insulin, n(%) 101 (44) 46 (60) 0.020*
OHA, n(%) 119 (51) 21 (27) <0.001*
Statin, n(%) 168 (72) 54 (70) 0.810
ACS, n(%) 91 (39) 26 (34) 0.472
* p<0.05 OHA indicates oral hypoglycemic agent; ACS, acute coronary syndrome.
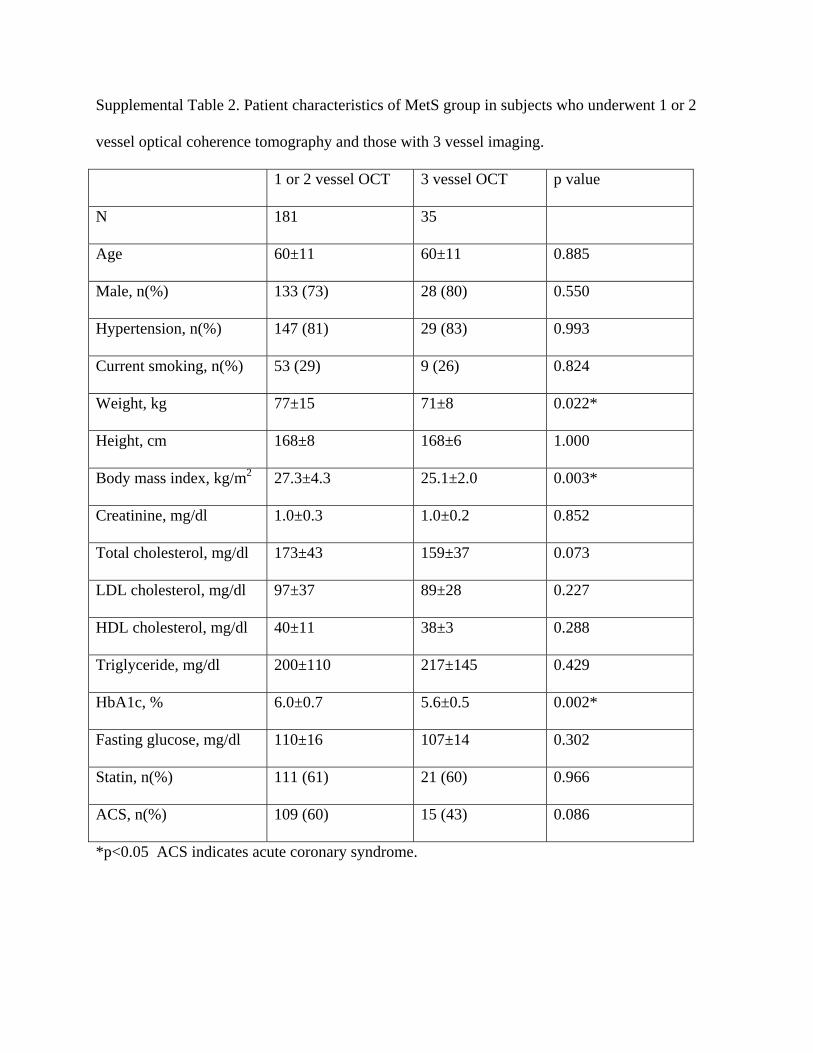
Supplemental Table 2. Patient characteristics of MetS group in subjects who underwent 1 or 2
vessel optical coherence tomography and those with 3 vessel imaging.
1 or 2 vessel OCT 3 vessel OCT p value
N 181 35
Age 60±11 60±11 0.885
Male, n(%) 133 (73) 28 (80) 0.550
Hypertension, n(%) 147 (81) 29 (83) 0.993
Current smoking, n(%) 53 (29) 9 (26) 0.824
Weight, kg 77±15 71±8 0.022*
Height, cm 168±8 168±6 1.000
Body mass index, kg/m2 27.3±4.3 25.1±2.0 0.003*
Creatinine, mg/dl 1.0±0.3 1.0±0.2 0.852
Total cholesterol, mg/dl 173±43 159±37 0.073
LDL cholesterol, mg/dl 97±37 89±28 0.227
HDL cholesterol, mg/dl 40±11 38±3 0.288
Triglyceride, mg/dl 200±110 217±145 0.429
HbA1c, % 6.0±0.7 5.6±0.5 0.002*
Fasting glucose, mg/dl 110±16 107±14 0.302
Statin, n(%) 111 (61) 21 (60) 0.966
ACS, n(%) 109 (60) 15 (43) 0.086
*p<0.05 ACS indicates acute coronary syndrome.