Fashion Catagory - Ted Baker/media/Files/T/Ted-Baker/results-and-reports/... · Fashion Catagory...
45
Transcript of Fashion Catagory - Ted Baker/media/Files/T/Ted-Baker/results-and-reports/... · Fashion Catagory...
Fashion Catagory
Weather
Menswear
Womenswear
Socks
Google Plus
Music
Angry Lobster
Cotton Crush
Camera
Chairman’s Statement
Ted’s advisers
Registered Office: The Ugly Brown Building, 6a St Pancras Way, London NW1 OTB
Secretary: Charles Anderson ACMA
Financial Advisers and Stockbrokers: Liberum Capital Limited, 25 Ropemaker St, London EC2Y 9LY
Solicitors: Jones Day, 21 Tudor Street, London EC4Y ODJ
Auditors: KPMG Audit Plc, 15 Canada Square, Canary Wharf, London E14 5GL
Bankers: Barclays Bank Plc, 1 Churchill Place, London E14 5HP
The Royal Bank of Scotland Plc, 62–63 Threadneedle Street, London EC2R 8LA
Registrars: Capita Asset Services, 34 Beckenham Road, Beckenham, Kent BR3 4TU
OPEN
Financial Statements
OPEN
Directors’ Report: Other Statutory Disclosures
OPEN
Directors’ Report: Governance
OPEN
Strategic Report
OPEN
Description
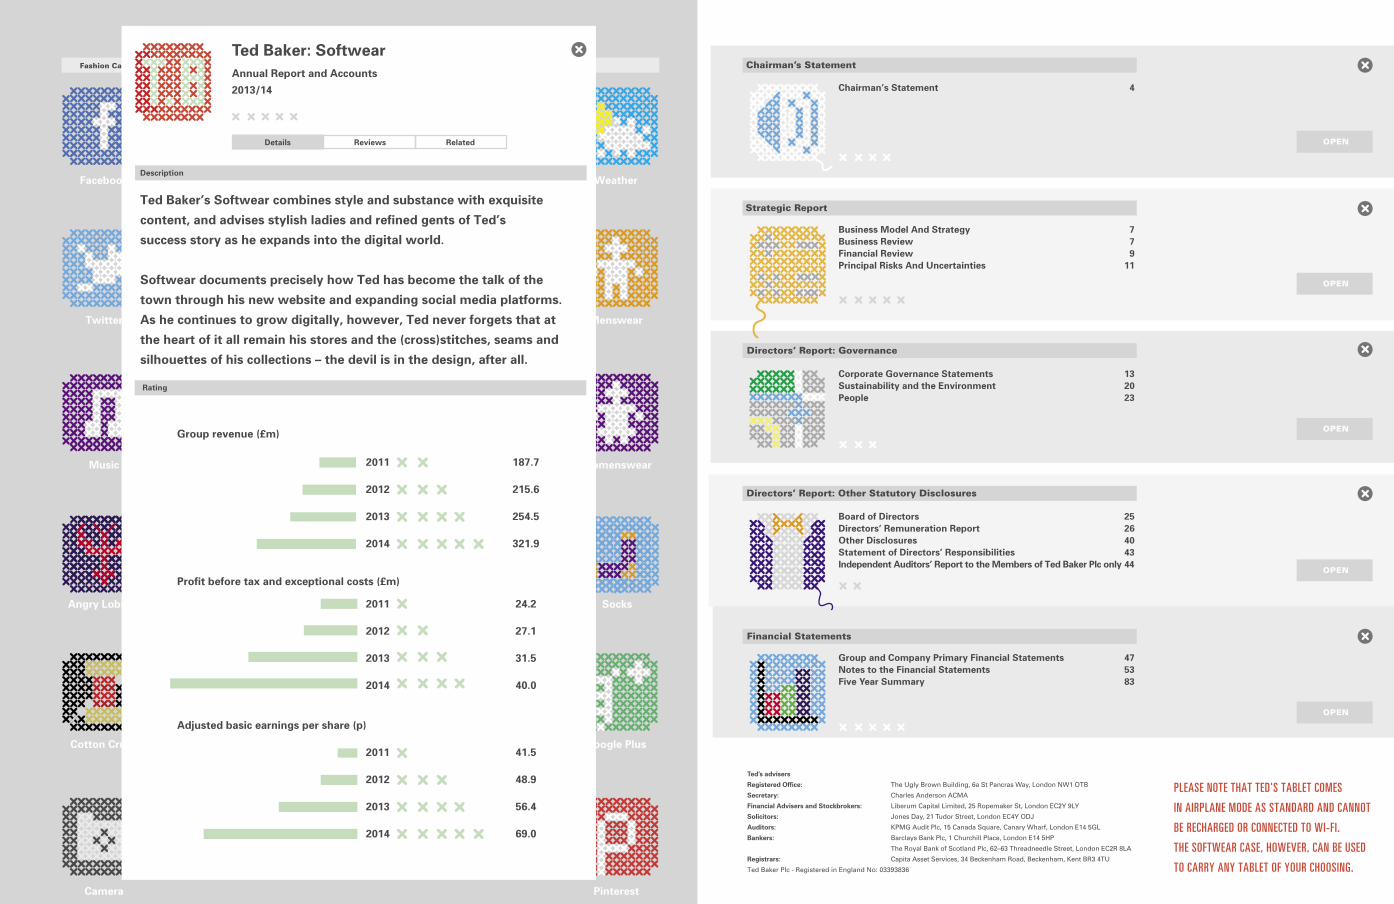
Ted Baker’s Softwear combines style and substance with exquisite
content, and advises stylish ladies and refined gents of Ted’s
success story as he expands into the digital world.
Softwear documents precisely how Ted has become the talk of the
town through his new website and expanding social media platforms.
As he continues to grow digitally, however, Ted never forgets that at
the heart of it all remain his stores and the (cross)stitches, seams and
silhouettes of his collections – the devil is in the design, after all.
Ted Baker: SoftwearAnnual Report and Accounts
2013/14
Details Reviews Related
Rating
Group revenue (£m)
2011
2012
2013
2014
2011
2012
2013
2014
2011
2012
2013
2014
187.7
215.6
254.5
321.9
24.2
27.1
31.5
40.0
41.5
48.9
56.4
69.0
Profit before tax and exceptional costs (£m)
Adjusted basic earnings per share (p)
PLEASE NOTE THAT TED'S TABLET COMES
IN AIRPLANE MODE AS STANDARD AND CANNOT
BE RECHARGED OR CONNECTED TO WI-FI.
THE SOFTWEAR CASE, HOWEVER, CAN BE USED
TO CARRY ANY TABLET OF YOUR CHOOSING. Ted Baker Plc - Registered in England No: 03393836
Chairman’s Statement 4
Business Model And Strategy 7Business Review 7Financial Review 9Principal Risks And Uncertainties 11
Board of Directors 25Directors’ Remuneration Report 26Other Disclosures 40Statement of Directors’ Responsibilities 43Independent Auditors’ Report to the Members of Ted Baker Plc only 44
Group and Company Primary Financial Statements 47Notes to the Financial Statements 53Five Year Summary 83
Corporate Governance Statements 13Sustainability and the Environment 20People 23
Fashion Catagory
Weather
Menswear
Womenswear
Socks
Google Plus
Music
Angry Lobster
Cotton Crush
Camera
Chairman’s Statement
Ted’s advisers
Registered Office: The Ugly Brown Building, 6a St Pancras Way, London NW1 OTB
Secretary: Charles Anderson ACMA
Financial Advisers and Stockbrokers: Liberum Capital Limited, 25 Ropemaker St, London EC2Y 9LY
Solicitors: Jones Day, 21 Tudor Street, London EC4Y ODJ
Auditors: KPMG Audit Plc, 15 Canada Square, Canary Wharf, London E14 5GL
Bankers: Barclays Bank Plc, 1 Churchill Place, London E14 5HP
The Royal Bank of Scotland Plc, 62–63 Threadneedle Street, London EC2R 8LA
Registrars: Capita Asset Services, 34 Beckenham Road, Beckenham, Kent BR3 4TU
OPEN
Financial Statements
OPEN
Directors’ Report: Other Statutory Disclosures
OPEN
Directors’ Report: Governance
OPEN
Strategic Report
OPEN
Description
Ted Baker’s Softwear combines style and substance with exquisite
content, and advises stylish ladies and refined gents of Ted’s
success story as he expands into the digital world.
Softwear documents precisely how Ted has become the talk of the
town through his new website and expanding social media platforms.
As he continues to grow digitally, however, Ted never forgets that at
the heart of it all remain his stores and the (cross)stitches, seams and
silhouettes of his collections – the devil is in the design, after all.
Ted Baker: SoftwearAnnual Report and Accounts
2013/14
Details Reviews Related
Rating
Group revenue (£m)
2011
2012
2013
2014
2011
2012
2013
2014
2011
2012
2013
2014
187.7
215.6
254.5
321.9
24.2
27.1
31.5
40.0
41.5
48.9
56.4
69.0
Profit before tax and exceptional costs (£m)
Adjusted basic earnings per share (p)
PLEASE NOTE THAT TED'S TABLET COMES
IN AIRPLANE MODE AS STANDARD AND CANNOT
BE RECHARGED OR CONNECTED TO WI-FI.
THE SOFTWEAR CASE, HOWEVER, CAN BE USED
TO CARRY ANY TABLET OF YOUR CHOOSING. Ted Baker Plc - Registered in England No: 03393836
Chairman’s Statement 4
Business Model And Strategy 7Business Review 7Financial Review 9Principal Risks And Uncertainties 11
Board of Directors 25Directors’ Remuneration Report 26Other Disclosures 40Statement of Directors’ Responsibilities 43Independent Auditors’ Report to the Members of Ted Baker Plc only 44
Group and Company Primary Financial Statements 47Notes to the Financial Statements 53Five Year Summary 83
Corporate Governance Statements 13Sustainability and the Environment 20People 23

UK AND EUROPE37 STORES
203 CONCESSIONS 11 OUTLETS ASIA22 STORES
7 CONCESSIONS 1 OUTLET
MIDDLE EAST13 STORES
DIRECTIONS SAVE TO MAP MORE
AUSTRALIA AND NEW ZEALAND5 STORES
DIRECTIONS SAVE TO MAP MORE
US AND CANADA 16 STORES
42 CONCESSIONS 5 OUTLETS
Established in 1988 as a shirting specialist of some repute, Ted Baker London is a global lifestyle brand offering menswear, womenswear, accessories and everything in between. A quintessentially British brand, Ted Baker is famed for its quirky yet commercial fashion offering, high quality design detailing and distinctive use of pattern and colour. The brand’s unconventional approach to fashion, irreverent sense of humour and, above all, unswerving attention to detail appeals to style-conscious men and women who trust Ted to deliver that certain something out of the ordinary. In order to protect the ethos and persona for which we have gained an enviable reputation, we always ask ourselves the question…
“Would Ted do it that way?”
With 110 stores/outlets and 252 concessions in a total of 24 countries (as at 25 January 2014), we continue to develop our presence in new and existing markets and focus on the long-term development of Ted Baker as a global lifestyle brand.
THREE CHANNELSTed carefully manages distribution through three main channels:
RETAIL:
£259.1M(24.6% INCREASE – 2013: £208.0M)
WHOLESALE:
£62.8M(35.0% INCREASE – 2013: £46.5M)
LICENSING:
£8.9M(18.4% INCREASE – 2013: £7.5M)
Details on the performance of each can be found in our Business Review, starting on page 7.
OUR GROUP REVENUE INCREASED 26.5% FROM £254.5M TO £321.9M
WORLDWIDE TEDNO ORDINARy DESIGNER LAbEL
1 2

4 Ted Baker Plc Annual Report and Accounts 2013/14
I am pleased to report that the Group has delivered a strong performance across all channels during the 52 weeks to 25 January 2014 (“the period”), resulting in a 26.5% increase in Group revenue to £321.9m (2013: £254.5m) and a 26.7% increase in profit before tax and exceptional costs to £40.0m (2013: £31.5m).
The retail division performed very well in what remained a competitive trading environment, delivering an increase in revenue of 24.6% to £259.1m (2013: £208.0m), on an increase in average square footage of 10.7%. Gross margins were largely in line with last year at 66.1% (2013: 66.2%). Performance in our established territories was strong and we continue to invest in newer markets where we see long-term opportunities for the brand.
Wholesale sales for the Group increased by 35.0% to £62.8m (2013: £46.5m), which reflects a strong performance from our UK wholesale business, which includes the supply of goods to our licensed stores and our export business and a very good performance from our US wholesale business.
Licence income from our territorial and product licences increased by 18.4% to £8.9m (2013: £7.5m).
We continue to focus on the long-term development of Ted Baker as a global lifestyle brand. We developed our presence in both new and existing markets and have further invested in people and infrastructure to support our long-term growth opportunities. This included the development of a new e-commerce platform, which was successfully launched in November 2013 and is a key part of our growth strategy. I am also pleased to announce that we have recently agreed with Microsoft to deploy and support Microsoft Dynamics AX business systems globally across the Group. These new systems will enable us to enhance the efficiency of the business, streamline our operations and provide a solid platform as we continue to grow and develop our business globally.
ResultsGroup revenue for the period rose by 26.5% to £321.9m (2013: £254.5m). The composite gross margin decreased to 61.7% (2013: 62.4%), reflecting an increase in wholesale sales as a proportion of total sales and a decrease in the wholesale margin. This decrease in wholesale margin was a result of a greater proportion of sales to our territorial licence partners, which carry a lower margin and a slight reduction in the underlying wholesale margin due to product mix in the first half of the year.
Profit before tax and exceptional costs increased by 26.7% to £40.0m (2013: £31.5m) and profit before tax increased by 34.6% to £38.9m (2013: £28.9m).
Exceptional costs incurred during the year of £1.0m (2013: £2.6m) include £0.7m of impairment charges in respect of some retail assets and £0.3m due to an onerous lease on a store where we are no longer trading.
Adjusted basic earnings per share, which exclude exceptional costs, increased by 22.3% to 69.0p (2013: 56.4p) and basic earnings per share increased by 30.5% to 67.2p (2013: 51.5p).
The Group’s net borrowing position at the end of the year was £8.8m (2013: £10.0m). This reflected the on going significant investment in capital expenditure during the year, increased inventory to support future growth and the earlier receipt of inventory into the business at the year end to meet demand.
DividendsThe Board is recommending a final dividend of 24.2p per share (2013: 18.7p), making a total for the year of 33.7p per share (2013: 26.6p per share), an increase of 26.7% on the prior year. Subject to approval by shareholders at the Annual General Meeting to be held on 10 June 2014, the final dividend will be paid on 20 June 2014 to shareholders on the register on 9 May 2014.
Financial ReportingThis year’s Annual Report incorporates a number of new features in line with the revised UK Corporate Governance Code. These include the Board’s confirmation that the report presents a fair, balanced and understandable assessment of the Group’s position and prospects, and an enhanced audit report.
PeopleThis strong performance is testament to the skill, passion and commitment of the Ted Baker team and I would like to take this opportunity to thank all of my colleagues around the world for their hard work.
On 9 January 2014, we were delighted to announce the appointment of Andrew Jennings to the Board as an independent Non-Executive Director, effective from 1 February 2014. Andrew brings a wealth of international retail experience gained over 40 years at some of the world’s most respected high-end department stores. His experience will be invaluable and we are very much looking forward to his contribution as the brand grows and develops. Andrew has recently been appointed to the Audit Committee and will join the Nomination and Remuneration Committees after a suitable period of induction, in accordance with the provisions of the UK Corporate Governance Code applying to larger companies.
CHAIRMAN’S STATEMENT
t
t
5
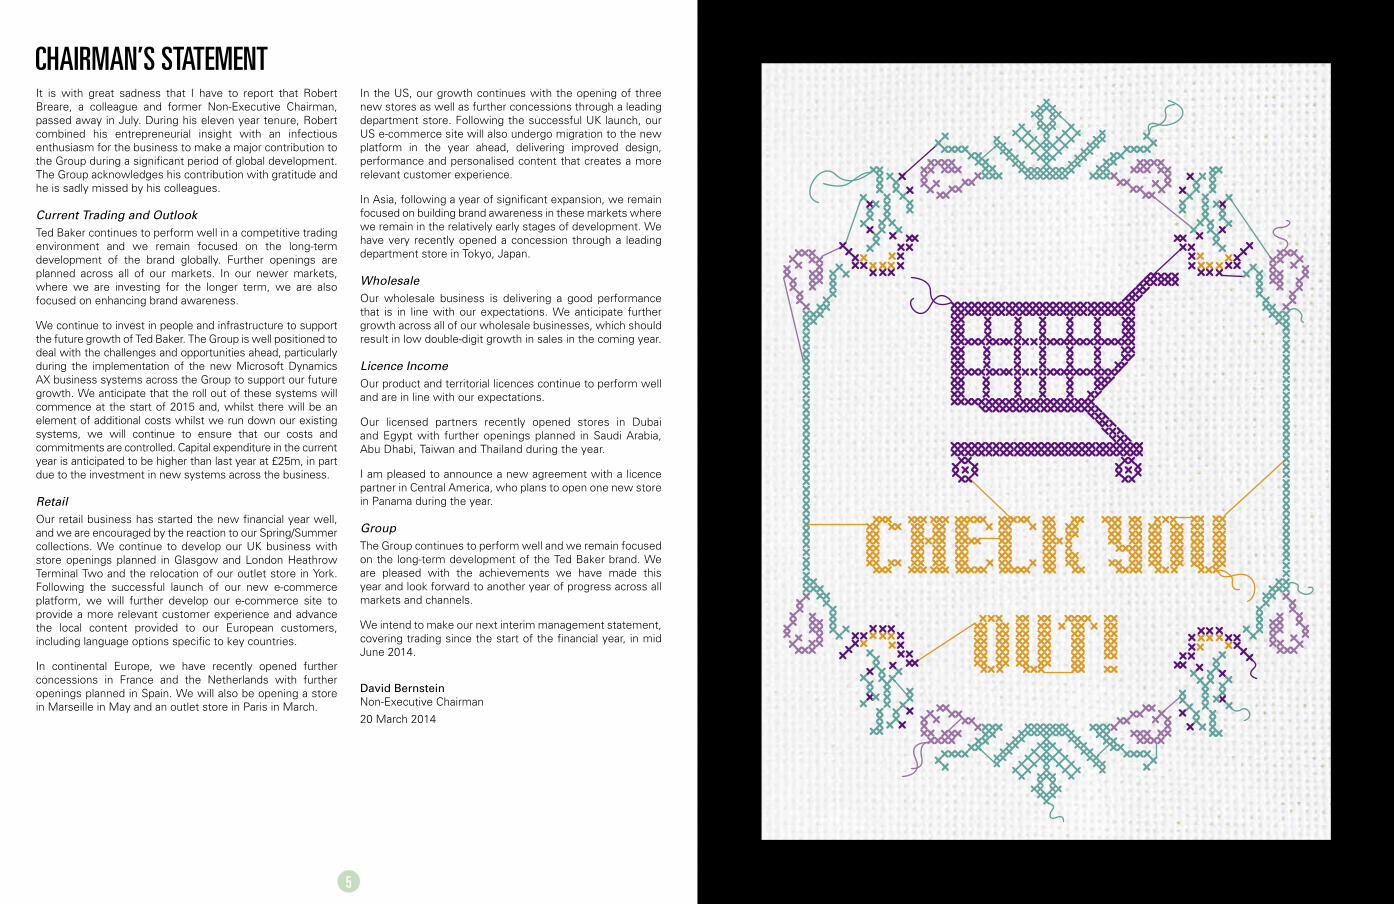
It is with great sadness that I have to report that Robert Breare, a colleague and former Non-Executive Chairman, passed away in July. During his eleven year tenure, Robert combined his entrepreneurial insight with an infectious enthusiasm for the business to make a major contribution to the Group during a significant period of global development. The Group acknowledges his contribution with gratitude and he is sadly missed by his colleagues.
Current Trading and OutlookTed Baker continues to perform well in a competitive trading environment and we remain focused on the long-term development of the brand globally. Further openings are planned across all of our markets. In our newer markets, where we are investing for the longer term, we are also focused on enhancing brand awareness.
We continue to invest in people and infrastructure to support the future growth of Ted Baker. The Group is well positioned to deal with the challenges and opportunities ahead, particularly during the implementation of the new Microsoft Dynamics AX business systems across the Group to support our future growth. We anticipate that the roll out of these systems will commence at the start of 2015 and, whilst there will be an element of additional costs whilst we run down our existing systems, we will continue to ensure that our costs and commitments are controlled. Capital expenditure in the current year is anticipated to be higher than last year at £25m, in part due to the investment in new systems across the business.
RetailOur retail business has started the new financial year well, and we are encouraged by the reaction to our Spring/Summer collections. We continue to develop our UK business with store openings planned in Glasgow and London Heathrow Terminal Two and the relocation of our outlet store in York. Following the successful launch of our new e-commerce platform, we will further develop our e-commerce site to provide a more relevant customer experience and advance the local content provided to our European customers, including language options specific to key countries.
In continental Europe, we have recently opened further concessions in France and the Netherlands with further openings planned in Spain. We will also be opening a store in Marseille in May and an outlet store in Paris in March.
In the US, our growth continues with the opening of three new stores as well as further concessions through a leading department store. Following the successful UK launch, our US e-commerce site will also undergo migration to the new platform in the year ahead, delivering improved design, performance and personalised content that creates a more relevant customer experience.
In Asia, following a year of significant expansion, we remain focused on building brand awareness in these markets where we remain in the relatively early stages of development. We have very recently opened a concession through a leading department store in Tokyo, Japan.
WholesaleOur wholesale business is delivering a good performance that is in line with our expectations. We anticipate further growth across all of our wholesale businesses, which should result in low double-digit growth in sales in the coming year.
Licence IncomeOur product and territorial licences continue to perform well and are in line with our expectations.
Our licensed partners recently opened stores in Dubai and Egypt with further openings planned in Saudi Arabia, Abu Dhabi, Taiwan and Thailand during the year.
I am pleased to announce a new agreement with a licence partner in Central America, who plans to open one new store in Panama during the year.
GroupThe Group continues to perform well and we remain focused on the long-term development of the Ted Baker brand. We are pleased with the achievements we have made this year and look forward to another year of progress across all markets and channels.
We intend to make our next interim management statement, covering trading since the start of the financial year, in mid June 2014.
David Bernstein Non-Executive Chairman
20 March 2014
CHAIRMAN’S STATEMENT
7 8 Ted Baker Plc Annual Report and Accounts 2013/14
Licence IncomeWe operate both territorial and product licences. Our territorial licences cover the Middle East, Asia, and Australasia, through which we operate licensed retail stores and, in some territories, wholesale operations. Our product licences cover lingerie and sleepwear, fragrance, watches, footwear, eyewear, suiting, neckwear, skinwear, and childrenswear.
Licence income was up 18.4% to £8.9m (2013: £7.5m). We have seen particularly good performances from our footwear collection with our licenced partner, Pentland Group and our suiting business in North America with licence partner Jack Victor. Our licensed stores in the Middle East and Asia performed well during the period.
CollectionsTed Baker Womenswear delivered a good performance with sales up 30.5% to £178.9m (2013: £137.1m). Womenswear benefited from a greater proportion of new space added during the period and as a result represented 55.6% of total sales (2013: 53.9%).
Ted Baker Menswear performed well with sales increasing by 21.9% to £143.0m (2013: £117.4m). Menswear represented 44.4% of total sales in the period (2013: 46.1%).
Geographic Performance
United Kingdom and EuropeSales in our UK and Europe retail division were up 20.3% to £198.6m (2013: £165.1m). This strong performance was delivered in what remained a competitive trading environment.
Average retail square footage rose by 4.1% over the period to 212,745 sq ft (2013: 204,331 sq ft). At 25 January 2014 total retail square footage was 218,622 sq ft (2013: 210,768 sq ft), representing an increase of 3.7%. Retail sales per square foot increased by 13.0% from £738 to £834.
During the year, we opened a new store in Gatwick South, further concessions with leading department stores in France, Spain, Germany and the Netherlands and an outlet store in Belgium. We are pleased with their performances and positive about growth in these markets.
Our first two stores in Turkey were opened with a licence partner during the year and we are encouraged by their performance.
At 25 January 2014, we operated 35 stores (2013: 35), 203 concessions (2013: 183), 11 outlet stores (2013: 10) and 2 stores through a licence partner (2013: nil).
Our e-commerce business performed very well during the period with sales increasing by 51.0% to £21.6m (2013: £14.3m), with the UK site benefiting from the launch of a new platform in November 2013.
Sales from our UK wholesale division increased by 32.5% to £51.8m (2013: £39.1m), reflecting a good performance from our UK wholesale business and continued growth in our wholesale export business.
US and CanadaSales from our US and Canadian retail division increased by 38.1% to £50.7m (2013: £36.7m), which includes sales from our US e-commerce business which is in its early stage of development.
Following a year of significant expansion, we have continued to develop the brand in this market through the opening of nine concessions in the US with a leading department store and an outlet store in Toronto, Canada. We are pleased with our performance as the brand gains increasing traction and recognition and are positive about the impact of our store on Fifth Avenue, New York, in raising brand awareness and supporting the development of Ted Baker both in the US and indeed globally.
Average square footage rose by 21.8% to 72,326 sq ft (2013: 59,384 sq ft) and retail sales per square foot increased 13.2% from £607 to £687. This reflects both higher sales densities in the concessions opened during the year and an improvement in brand awareness in this market. As at 25 January 2014, we had 16 stores (2013: 16), 42 concessions (2013: 33) and 5 outlet stores (2013: 4).
Sales from our US wholesale business increased by 46.7% to £11.0m (2013: £7.5m), reflecting the continued growth of our business.
Middle East, Asia and AustralasiaWe are developing the Ted Baker brand across the Middle East, Asia and Australasia. As at 25 January 2014, we, together with our licence partners, operated a total of 40 (2013: 31) stores, 7 concessions (2013: 4) and 1 outlet (2013: nil) across these territories.
In Asia, we are investing in newer markets to support the long-term growth of the business. Sales from our retail division increased 59.7% to £9.9m (2013: £6.2m).
Average retail square footage rose by 74.6% to 18,880 sq ft (2013: 10,816 sq ft), whilst retail sales per square foot decreased 8.2% from £572 to £525, reflecting the opening of new space.
Business MoDel anD sTraTeGyTed Baker is a global lifestyle brand that operates through three main distribution channels: retail, which includes e-commerce; wholesale; and licensing, which includes territorial and product licences.
The brand has grown steadily from its origins as a single shirt specialist store in Glasgow to the global lifestyle brand it is today. We distribute through our own and licensed retail outlets, leading department stores and selected independent stores in Europe, North America, the Middle East, Asia and Australasia.
We offer a wide range of collections including: Menswear; Womenswear; Global; Phormal; Endurance; Born by Ted Baker; Accessories; Lingerie and Sleepwear; Childrenswear; Fragrance and Skinwear; Footwear; Neckwear; Eyewear; and Watches.
Our strategy is to become a leading global lifestyle brand, based on three main elements:
• considered expansion of the Ted Baker collections. We review our collections continually to ensure we anticipate and react to trends and meet our customers’ expectations. In addition, we look for opportunities to extend the breadth of collections and enhance our offer;
• controlled distribution through three main channels: retail; wholesale; and licensing. We consider each new opportunity to ensure it is right for the brand and will deliver margin led growth; and
• carefully managed development of overseas markets. We continue to manage growth in existing territories while considering new territories for expansion.
Underlying our strategy is an emphasis on design, product quality and attention to detail, which is delivered by the passion, commitment and skill of our teams, licence partners and wholesale customers (“trustees”).
Key Performance IndicatorsWe review the on-going performance of the business using key performance indicators for each of our distribution channels. Performance measures for our retail business include total sales, average and closing square foot, sales per square foot and gross retail margins. Wholesale performance measures include total sales and gross wholesale margins, and licence income is measured through year on year revenue growth.
Business revieW
Global Group Performance
RetailWe operate stores and concessions across the UK, continental Europe, North America and Asia and an e-commerce business based in the UK, primarily serving the UK and Europe, with a separate transactional website dedicated to the Americas and e-commerce businesses with some of our concession partners.
The retail division delivered a strong performance with sales up 24.6% to £259.1m (2013: £208.0m). Average retail square footage rose by 10.7% over the year to 303,951 sq ft (2013: 274,531 sq ft). Total retail square footage at 25 January 2014 was 316,648 sq ft (2013: 294,329 sq ft), an increase of 7.6% on the prior year. Retail sales per square foot rose 11.0% from £703 to £780.
Sales through our e-commerce business increased by 55.7% to £23.2m (2013: £14.9m). In November 2013, we launched a new e-commerce platform for our UK site, providing increased personalisation, local content for our overseas customers and opportunities for future growth and multi-channel developments.
The retail gross margins were largely in line with last year at 66.1% (2013: 66.2%).
Retail operating costs increased in line with our expectations to £122.2m (2013: £100.1m) and as a percentage of retail sales decreased to 47.1% (2013: 48.1%). This resulted in an increase in retail operating contribution to 18.9% (2013: 18.1%) of sales, following significant expansion and store openings in the previous year.
WholesaleWe currently operate a wholesale business in the UK serving countries across the world, particularly in Europe, and a wholesale business in the US.
Group wholesale sales increased by 35.0% to £62.8m (2013: £46.5m), reflecting a strong performance from our UK wholesale business, which includes the supply of goods to our licensed stores and our export business and a very good performance from our US wholesale business. Gross margins declined to 43.4% (2013: 45.2%), which was the result of a greater proportion of wholesale sales to our licensed stores, which carry a lower margin, and a slight reduction in the underlying wholesale margin due to the product mix in the first half of the year.
STRATEGIC REPORT STRATEGIC REPORT
9 10 Ted Baker Plc Annual Report and Accounts 2013/14
Cash FlowThe net increase in cash and cash equivalents was £1.7m (2013: £11.9m decrease). An increase in net cash generated from operating activities of £14.1m (2013: £6.2m) was offset by an increase in financing and investing activities.
Total Group working capital, which comprises inventories, trade and other receivables and trade and other payables, increased by £8.9m to £69.9m (2013: £61.0m), principally as a result of an increase in year-end inventory levels reflecting the underlying growth of our business and the earlier phasing of deliveries into the business to ensure smooth transition to the Spring/Summer season across all our markets following strong trading.
Group capital expenditure amounted to £18.1m (2013: £19.8m) and reflected the opening and refurbishment of stores, concessions and outlets, investment in business wide systems to support our future growth and a new e-commerce platform for the UK site.
Post Balance Sheet EventsIn February 2014, we mutually terminated an agreement with a licence partner earlier than anticipated. Under the terms of our licence agreement we received a payment of £2.7m for compensation of royalties that would be due to us had the agreement continued to its original completion date. In line with accounting standards this will be accounted for in the 2014/15 Financial Statements as exceptional income.
Shareholder ReturnBasic earnings per share increased by 30.5% to 67.2p (2013: 51.5p). Adjusted earnings per share, which exclude exceptional costs of £1.0m (2013: £2.6m), increased by 22.3% to 69.0p (2013: 56.4p).
The proposed final dividend of 24.2p per share will make a total for the year of 33.7p per share (2013: 26.6p per share), an increase of 26.7% on the previous year.
Free cash flow per share, which is calculated using the net cash generated from operating activities, was 73.1p (2013: 41.0p) and reflected an increase in cash generated from operating activities.
Currency ManagementThe most significant exposure to foreign exchange fluctuation relates to purchases made in foreign currencies, principally the US Dollar and the Euro.
A proportion of the Group’s purchases are hedged in accordance with the Group’s risk management policy, typically 12 months in advance. The balance of purchases is hedged naturally as the business operates internationally and income is generated in the local currencies.
At the balance sheet date, the Group had hedged its projected commitments in respect of the year ending January 2015.
Borrowing FacilitiesIn July 2013, the Group increased its three year committed borrowing facility to £50.0m (2013: £40.0m). The facility is a multi-currency revolving credit facility with The Royal Bank of Scotland and Barclays, which is due to expire on 1 March 2015. The increase is a function of the growth in our business and is necessary to fund capital expenditure to support the Group’s long-term strategy. The Group is in discussions with The Royal Bank of Scotland and Barclays to arrange the renewal of the facility from 1 March 2015 and is confident that this will be agreed.
The facilities contain appropriate financial covenants and are tested on a quarterly basis. The Group monitors actual and prospective compliance with these on a regular basis.
Cautionary Statement Regarding Forward-Looking StatementsThis document contains certain forward-looking statements. These forward-looking statements include matters that are not historical facts or are statements regarding the Company’s intentions, beliefs or current expectations concerning, among other things, the Company’s results of operations, financial condition, liquidity, prospects, growth, strategies, and the industries in which the Company operates. Forward-looking statements are based on the information available to the directors at the time of preparation of this document, and will not be updated during the year. The directors can give no assurance that these expectations will prove to be correct. Due to inherent uncertainties, including both economic and business risk factors underlying such forward-looking information, actual results may differ materially from those expressed or implied by these forward-looking statements.
In China we opened two further stores in Shanghai and three concessions through leading department stores. We also opened an outlet store in Shanghai. In Japan we opened our first concession in Tokyo through a leading department store and closed one concession in South Korea. As at 25 January 2014, we operated 7 stores (2013: 5), 7 concessions (2013: 4) and 1 outlet (2013: nil) across Asia. We are encouraged by reactions to the brand and whilst we remain in the relatively early stages of development, we are positive about the long-term opportunities in this territory.
We operate with licence partners across Asia and the Middle East. During the period, our Asia licence partners opened concessions in Indonesia and Singapore, and three stores were closed. Our licensed stores across the Middle East performed very well with openings in Lebanon, Kuwait, Abu Dhabi and Dubai during the period and one closure in Dubai. As at 25 January 2014, our licence partners operated 28 stores and concessions across the Middle East and Asia (2013: 22).
The joint venture with our Australasian licence partner continues to perform well and in March 2013 we opened a new store with our partner in Adelaide, Australia. As at 25 January 2014, we operated 5 stores in Australasia (2013: 4 stores).
Financial revieW
Revenue and Gross MarginGroup revenue increased by 26.5% to £321.9m (2013: £254.5m), driven by a 24.6% increase in retail sales to £259.1m (2013: £208.0m) and a 35.0% increase in wholesale sales to £62.8m (2013: £46.5m).
The composite gross margin for the Group decreased to 61.7% (2013: 62.4%), reflecting an increase in the proportion of total sales attributable to our wholesale business. While retail margins were in line, wholesale margins were lower due to a greater proportion of wholesale sales to our territorial licence partners, which carry a lower margin, and a slight reduction in the underlying wholesale margin due to the product mix in the first half of the year.
Operating Expenses Pre-Exceptional CostsDistribution costs increased in line with our expectations to £123.2m (2013: £101.4m) and as a percentage of sales decreased to 38.3% (2013: 39.8%).
Administration expenses increased by 31.5% to £43.4m (2013: £33.0m). Excluding the employee performance related bonus of £3.9m (2013: £nil), administration expenses rose by 19.7% due to our growth in central functions, both in the UK and overseas and the continued deployment of our distribution and information technology infrastructures to support our growth.
Exceptional CostsThe exceptional costs incurred during the year of £1.0m (2013: £2.6m) include £0.7m of impairment charges in respect of a retail store in the Meatpacking District, New York, and a retail store in Paris, both locations of which have failed to deliver on their potential. The balance of £0.3m relates to an onerous lease for our retail store in Liverpool, where we are no longer trading following the expansion of our Liverpool One Store in Merseyside.
The prior year figure included £1.6m of rental costs for our stores on Fifth Avenue, New York, and in Tokyo, Japan, for the periods before they commenced trading. The balance of £1.0m included an impairment charge of £0.8m in respect of some retail assets, notably a retail development in the UK that failed to deliver on its potential, and the remaining £0.2m was primarily set-up costs incurred for our expansion into China.
Profit Before TaxProfit before tax and exceptional costs increased by 26.7% to £40.0m (2013: £31.5m) and profit before tax increased by 34.6% to £38.9m (2013: £28.9m).
Finance Income and ExpensesNet interest payable during the year was £1,133,000 (2013: £612,000). This increase reflects higher Group borrowing compared to the prior year as a result of the on-going significant investment in capital expenditure and increased working capital to support the Group’s expansion.
The net foreign exchange gain during the year of £137,000 (2013: loss of £178,000) was due to the retranslation of monetary assets and liabilities denominated in foreign currencies.
TaxationThe Group tax charge for the year was £10.1m (2013: £7.3m), an effective tax rate of 25.9% (2012: 25.3%). This effective tax rate is higher than the UK tax rate for the period of 23.16%, largely due to higher overseas tax rates and the non-recognition of losses in overseas territories where the businesses are still in their development phase. On 1 April 2013, the UK corporation tax rate fell from 24% to 23% and will fall to 21% from 1 April 2014. A further reduction to 20% (from 1 April 2015) has been substantively enacted and therefore our closing deferred tax assets and liabilities have been re-measured at this rate.
Our future effective tax rate is expected to be higher than the UK tax rate as a result of overseas profits arising in jurisdictions with higher tax rates than the UK.
STRATEGIC REPORT STRATEGIC REPORT
11 12 Ted Baker Plc Annual Report and Accounts 2013/14
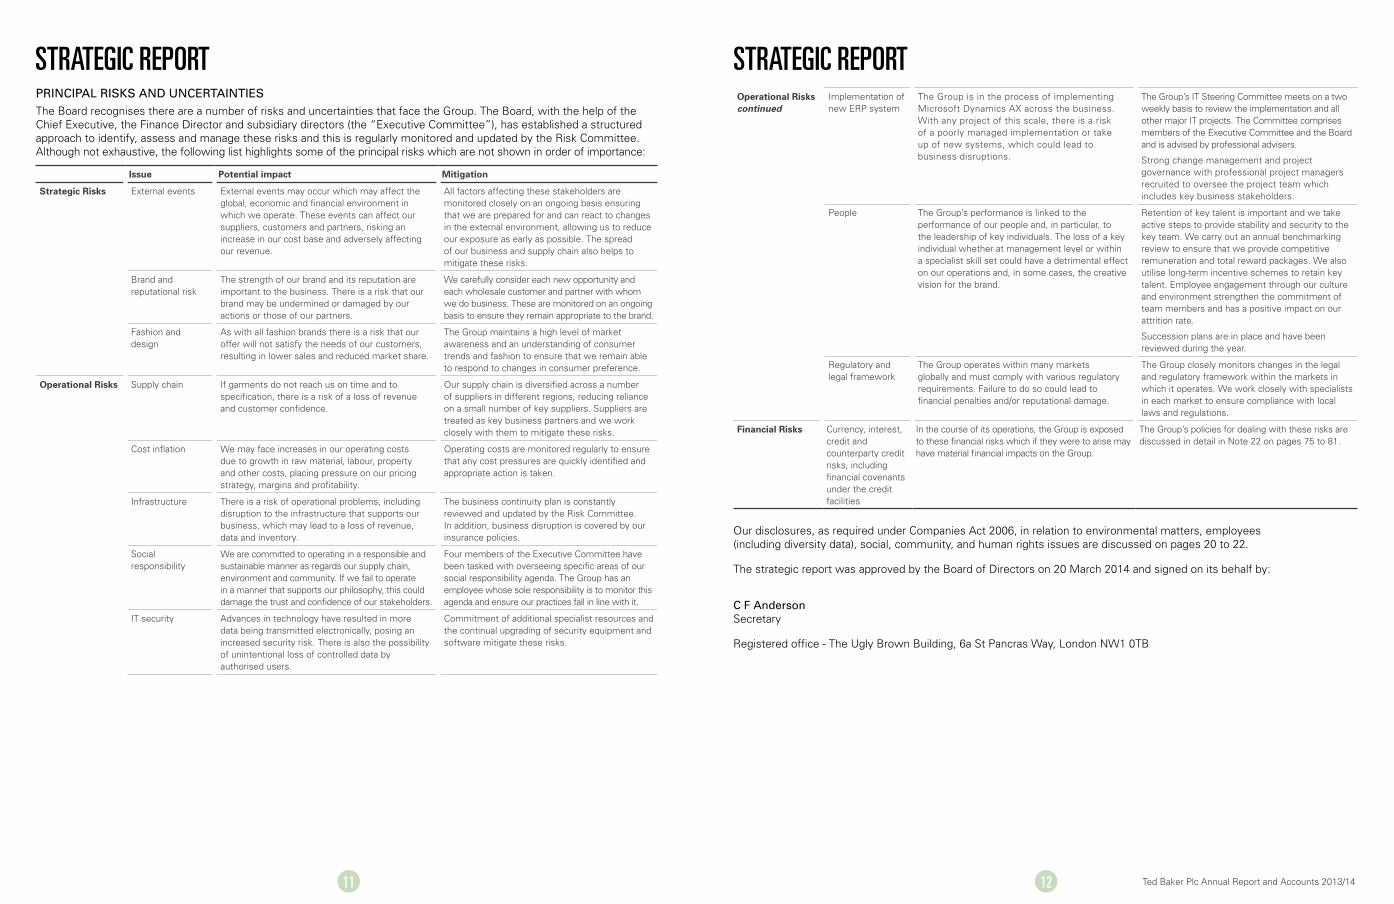
PrinciPal risks anD uncerTainTiesThe Board recognises there are a number of risks and uncertainties that face the Group. The Board, with the help of the Chief Executive, the Finance Director and subsidiary directors (the “Executive Committee”), has established a structured approach to identify, assess and manage these risks and this is regularly monitored and updated by the Risk Committee. Although not exhaustive, the following list highlights some of the principal risks which are not shown in order of importance:
Issue Potential impact Mitigation
Strategic Risks External events External events may occur which may affect the global, economic and financial environment in which we operate. These events can affect our suppliers, customers and partners, risking an increase in our cost base and adversely affecting our revenue.
All factors affecting these stakeholders are monitored closely on an ongoing basis ensuring that we are prepared for and can react to changes in the external environment, allowing us to reduce our exposure as early as possible. The spread of our business and supply chain also helps to mitigate these risks.
Brand and reputational risk
The strength of our brand and its reputation are important to the business. There is a risk that our brand may be undermined or damaged by our actions or those of our partners.
We carefully consider each new opportunity and each wholesale customer and partner with whom we do business. These are monitored on an ongoing basis to ensure they remain appropriate to the brand.
Fashion and design
As with all fashion brands there is a risk that our offer will not satisfy the needs of our customers, resulting in lower sales and reduced market share.
The Group maintains a high level of market awareness and an understanding of consumer trends and fashion to ensure that we remain able to respond to changes in consumer preference.
Operational Risks Supply chain If garments do not reach us on time and to specification, there is a risk of a loss of revenue and customer confidence.
Our supply chain is diversified across a number of suppliers in different regions, reducing reliance on a small number of key suppliers. Suppliers are treated as key business partners and we work closely with them to mitigate these risks.
Cost inflation We may face increases in our operating costs due to growth in raw material, labour, property and other costs, placing pressure on our pricing strategy, margins and profitability.
Operating costs are monitored regularly to ensure that any cost pressures are quickly identified and appropriate action is taken.
Infrastructure There is a risk of operational problems, including disruption to the infrastructure that supports our business, which may lead to a loss of revenue, data and inventory.
The business continuity plan is constantly reviewed and updated by the Risk Committee. In addition, business disruption is covered by our insurance policies.
Social responsibility
We are committed to operating in a responsible and sustainable manner as regards our supply chain, environment and community. If we fail to operate in a manner that supports our philosophy, this could damage the trust and confidence of our stakeholders.
Four members of the Executive Committee have been tasked with overseeing specific areas of our social responsibility agenda. The Group has an employee whose sole responsibility is to monitor this agenda and ensure our practices fall in line with it.
IT security Advances in technology have resulted in more data being transmitted electronically, posing an increased security risk. There is also the possibility of unintentional loss of controlled data by authorised users.
Commitment of additional specialist resources and the continual upgrading of security equipment and software mitigate these risks.
Operational Risks continued
Implementation of new ERP system
The Group is in the process of implementing Microsoft Dynamics AX across the business. With any project of this scale, there is a risk of a poorly managed implementation or take up of new systems, which could lead to business disruptions.
The Group’s IT Steering Committee meets on a two weekly basis to review the implementation and all other major IT projects. The Committee comprises members of the Executive Committee and the Board and is advised by professional advisers.
Strong change management and project governance with professional project managers recruited to oversee the project team which includes key business stakeholders.
People The Group’s performance is linked to the performance of our people and, in particular, to the leadership of key individuals. The loss of a key individual whether at management level or within a specialist skill set could have a detrimental effect on our operations and, in some cases, the creative vision for the brand.
Retention of key talent is important and we take active steps to provide stability and security to the key team. We carry out an annual benchmarking review to ensure that we provide competitive remuneration and total reward packages. We also utilise long-term incentive schemes to retain key talent. Employee engagement through our culture and environment strengthen the commitment of team members and has a positive impact on our attrition rate.
Succession plans are in place and have been reviewed during the year.
Regulatory and legal framework
The Group operates within many markets globally and must comply with various regulatory requirements. Failure to do so could lead to financial penalties and/or reputational damage.
The Group closely monitors changes in the legal and regulatory framework within the markets in which it operates. We work closely with specialists in each market to ensure compliance with local laws and regulations.
Financial Risks Currency, interest, credit and counterparty credit risks, including financial covenants under the credit facilities
In the course of its operations, the Group is exposed to these financial risks which if they were to arise may have material financial impacts on the Group.
The Group’s policies for dealing with these risks are discussed in detail in Note 22 on pages 75 to 81.
Our disclosures, as required under Companies Act 2006, in relation to environmental matters, employees (including diversity data), social, community, and human rights issues are discussed on pages 20 to 22.
The strategic report was approved by the Board of Directors on 20 March 2014 and signed on its behalf by:
c F anderson Secretary
Registered office - The Ugly Brown Building, 6a St Pancras Way, London NW1 0TB
STRATEGIC REPORT STRATEGIC REPORT
13 14 Ted Baker Plc Annual Report and Accounts 2013/14
DIRECTORS’ REPORT: GOVERNANCE DIRECTORS’ REPORT: GOVERNANCEcorPoraTe Governance sTaTeMenTs
Statement of Compliance with the CodeFollowing the Company’s entry into the FTSE 250 index during the year ended January 2013, the Company became subject to additional requirements of the UK Corporate Governance Code (the “Code”). The Code is issued by the Financial Reporting Council and is available for review on the Financial Reporting Council’s website www.frc.org.uk. The Board confirms that the Company has complied with the provisions set out in the Code throughout the year, except in respect of Code Provisions C.3.1 and D.2.1 (audit and remuneration committees to have at least three independent non-executive directors). Provision A.3.1 of the Code requires that the chairman should on appointment meet the independence criteria prescribed by the Code. The Company considers Chairman David Bernstein to be independent notwithstanding that, prior to his appointment as Chairman in January 2013, he had served on the Board for more than nine years from the date of his first election and therefore did not satisfy the independence criteria under Provision B.1.1 of the Code. The Board considers David Bernstein to be independent in character and judgement due to his extensive experience, and to be a valuable member of the Board.
Statement about applying the Main Principles of the CodeThe Company has applied the Main Principles set out in the Code. Further explanation of how the principles have been applied is set out in this section of the Directors’ Report and, in connection with directors’ remuneration, in the Directors’ Remuneration Report on pages 26 to 39.
The BoardThe Board currently comprises a non-executive Chairman, the Chief Executive, one other executive director and three independent non-executive directors. Biographies of these directors appear on page 25. The Board is of the view that its current membership provides an appropriate balance of skills, experience, independence and knowledge, which enables it to discharge its responsibilities effectively.
The Board considers Non-Executive Directors Ronald Stewart, Anne Sheinfield and Andrew Jennings to be independent for the purposes of the Code. Further, as referred to above, the Board considers Chairman David Bernstein to be independent notwithstanding that he has served on the Board for more than nine years from the date of his first election.
The Board meets regularly throughout the year. It considers all issues relating to the strategy, direction and future development of the Group. The Board has a schedule of matters reserved to it for decision that is regularly updated. The requirement for Board approval on these matters is understood and communicated widely throughout the Group. The non-executive directors meet with the Chairman separately during the year. In addition the non-executive directors meet without the Chairman present to appraise the Chairman’s performance.
Operational decision making, operational performance and the formulation of strategic proposals to the Board are controlled by the Executive Committee. The Executive Committee meets regularly throughout the year.
To enable the Board to function effectively and the directors to discharge their responsibilities, full and timely access is provided to all relevant information. There is an agreed procedure for directors to take independent professional advice, if necessary, at the Company’s expense. This is in addition to the access every director has to the Company Secretary.
The Company maintains an appropriate level of director and officer liability insurance cover in place and, through the Articles of Association and directors’ terms of appointment, has agreed to indemnify the directors against certain liabilities to third parties and costs and expenses incurred as a result of holding office as a director. Save for such indemnity provisions in the Company’s Articles of Association and in the directors’ terms of appointment, there are no qualifying third-party indemnity provisions in force.
The Code requires that the Board provides a fair, balanced and understandable assessment of the Company’s position and prospects in its external reporting. The Directors were responsible for the preparation and approval of the Annual Report and Accounts and consider them, taken as a whole, to be fair, balanced and understandable and believe that this provides the information necessary for shareholders to assess the Company’s performance, business model and strategy.
The Board undertook an informal evaluation of its own performance, its committees’ performance and the performance of its directors, with continuing assessment undertaken throughout the year in review. Informal evaluations and assessments conducted by the Board and its committees covered a range of issues around Board and committee membership, Board and committee roles and responsibilities and Board and committee processes. As referred to above, the Board intends to review the process around a formal externally facilitated evaluation of performance for the year ending January 2015, in light of the provisions of the Code.
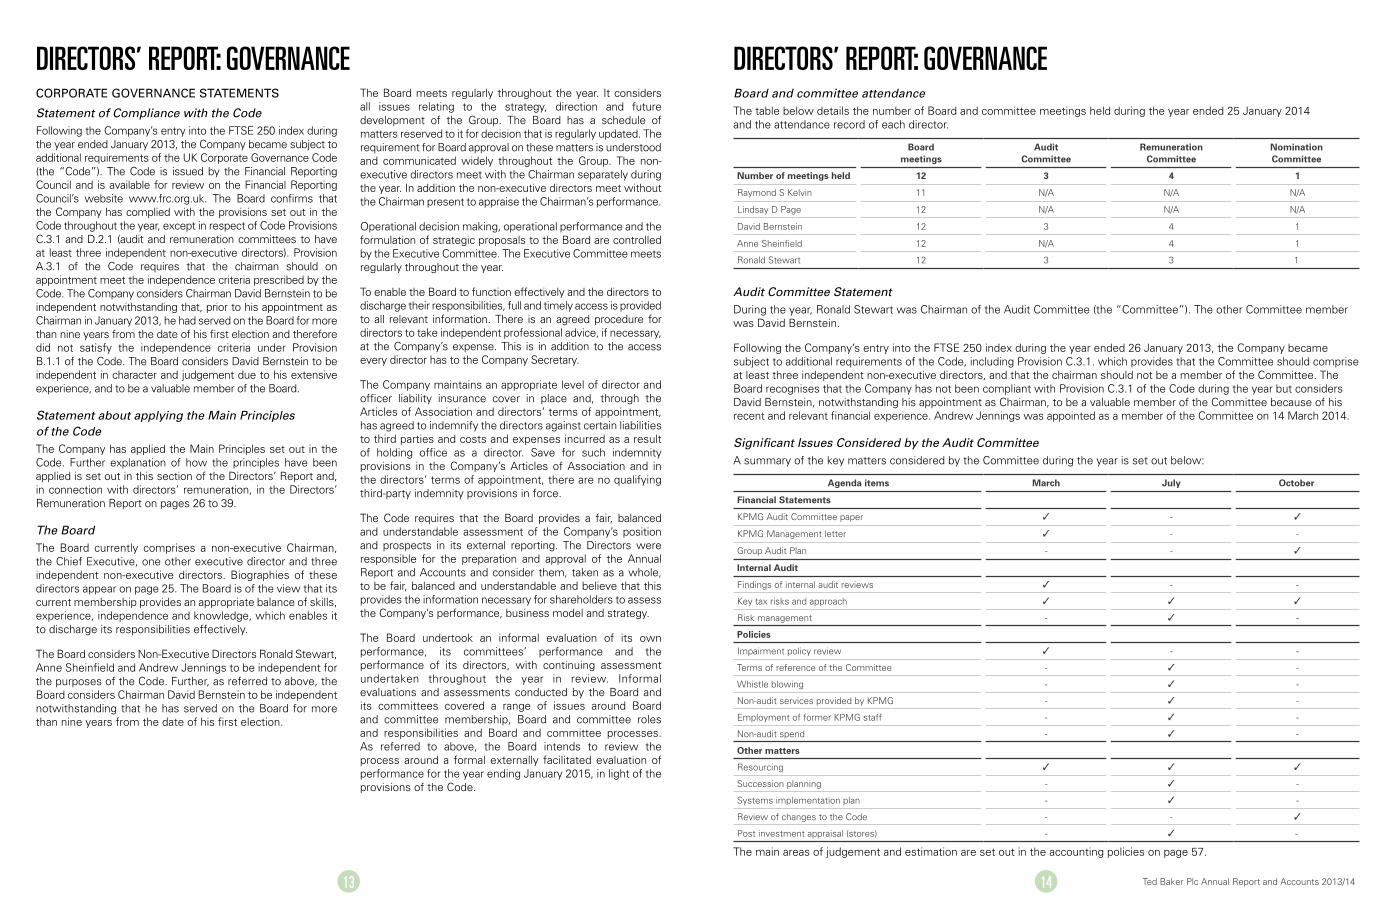
Board and committee attendanceThe table below details the number of Board and committee meetings held during the year ended 25 January 2014 and the attendance record of each director.
Board meetings
Audit Committee
Remuneration Committee
Nomination Committee
Number of meetings held 12 3 4 1
Raymond S Kelvin 11 N/A N/A N/A
Lindsay D Page 12 N/A N/A N/A
David Bernstein 12 3 4 1
Anne Sheinfield 12 N/A 4 1
Ronald Stewart 12 3 3 1
Audit Committee StatementDuring the year, Ronald Stewart was Chairman of the Audit Committee (the “Committee”). The other Committee member was David Bernstein.
Following the Company’s entry into the FTSE 250 index during the year ended 26 January 2013, the Company became subject to additional requirements of the Code, including Provision C.3.1. which provides that the Committee should comprise at least three independent non-executive directors, and that the chairman should not be a member of the Committee. The Board recognises that the Company has not been compliant with Provision C.3.1 of the Code during the year but considers David Bernstein, notwithstanding his appointment as Chairman, to be a valuable member of the Committee because of his recent and relevant financial experience. Andrew Jennings was appointed as a member of the Committee on 14 March 2014.
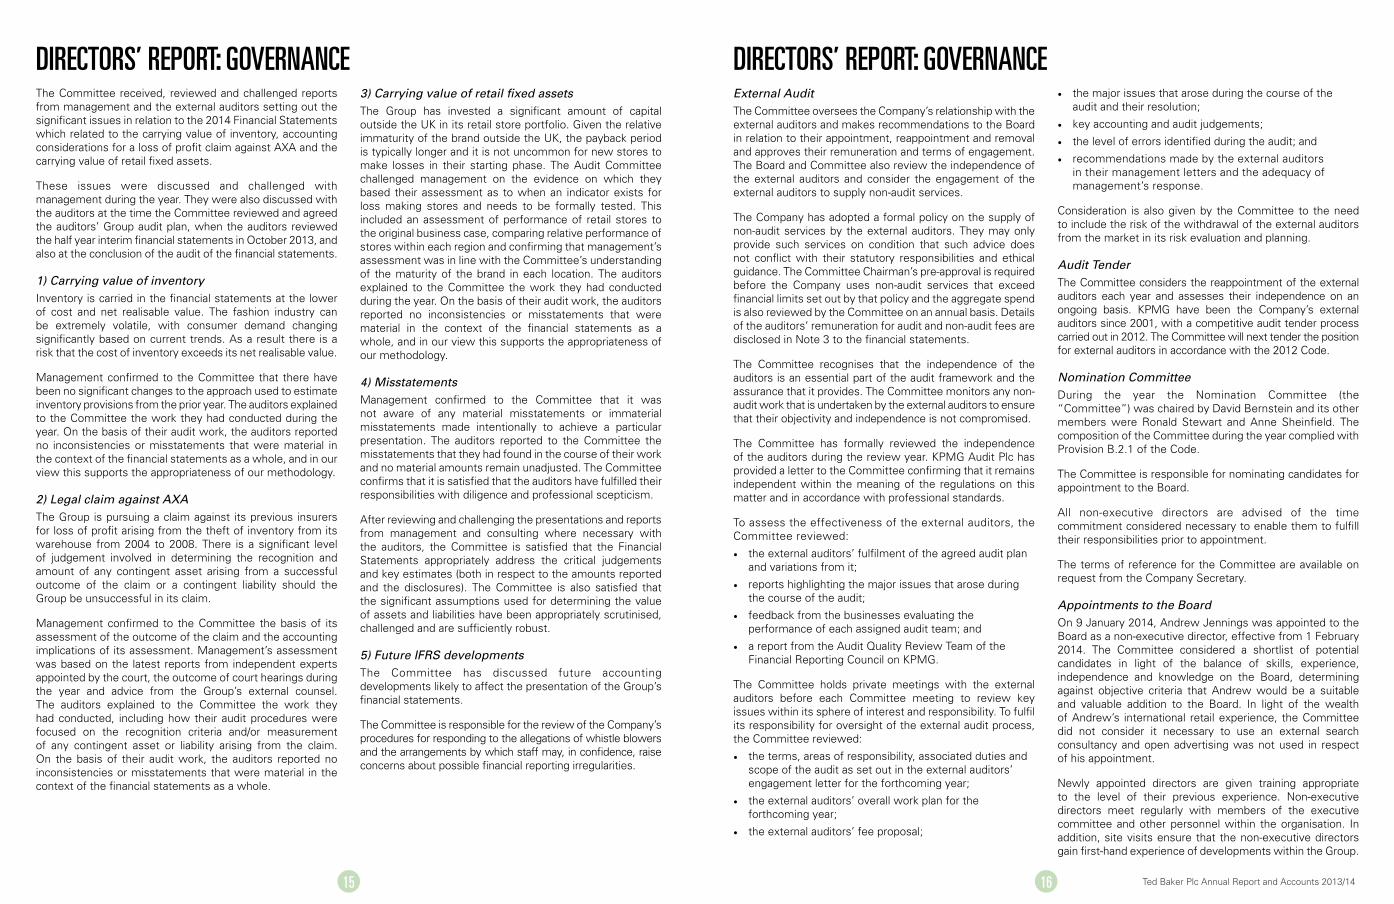
Significant Issues Considered by the Audit CommitteeA summary of the key matters considered by the Committee during the year is set out below:
Agenda items March July October
Financial Statements
KPMG Audit Committee paper ✓ - ✓
KPMG Management letter ✓ - -
Group Audit Plan - - ✓
Internal Audit
Findings of internal audit reviews ✓ - -
Key tax risks and approach ✓ ✓ ✓
Risk management - ✓ -
Policies
Impairment policy review ✓ - -
Terms of reference of the Committee - ✓ -
Whistle blowing - ✓ -
Non-audit services provided by KPMG - ✓ -
Employment of former KPMG staff - ✓ -
Non-audit spend - ✓ -
Other matters
Resourcing ✓ ✓ ✓
Succession planning - ✓ -
Systems implementation plan - ✓ -
Review of changes to the Code - - ✓
Post investment appraisal (stores) - ✓ -
The main areas of judgement and estimation are set out in the accounting policies on page 57.
15 16 Ted Baker Plc Annual Report and Accounts 2013/14
The Committee received, reviewed and challenged reports from management and the external auditors setting out the significant issues in relation to the 2014 Financial Statements which related to the carrying value of inventory, accounting considerations for a loss of profit claim against AXA and the carrying value of retail fixed assets.
These issues were discussed and challenged with management during the year. They were also discussed with the auditors at the time the Committee reviewed and agreed the auditors’ Group audit plan, when the auditors reviewed the half year interim financial statements in October 2013, and also at the conclusion of the audit of the financial statements.
1) Carrying value of inventoryInventory is carried in the financial statements at the lower of cost and net realisable value. The fashion industry can be extremely volatile, with consumer demand changing significantly based on current trends. As a result there is a risk that the cost of inventory exceeds its net realisable value.
Management confirmed to the Committee that there have been no significant changes to the approach used to estimate inventory provisions from the prior year. The auditors explained to the Committee the work they had conducted during the year. On the basis of their audit work, the auditors reported no inconsistencies or misstatements that were material in the context of the financial statements as a whole, and in our view this supports the appropriateness of our methodology.
2) Legal claim against AXA The Group is pursuing a claim against its previous insurers for loss of profit arising from the theft of inventory from its warehouse from 2004 to 2008. There is a significant level of judgement involved in determining the recognition and amount of any contingent asset arising from a successful outcome of the claim or a contingent liability should the Group be unsuccessful in its claim.
Management confirmed to the Committee the basis of its assessment of the outcome of the claim and the accounting implications of its assessment. Management’s assessment was based on the latest reports from independent experts appointed by the court, the outcome of court hearings during the year and advice from the Group’s external counsel. The auditors explained to the Committee the work they had conducted, including how their audit procedures were focused on the recognition criteria and/or measurement of any contingent asset or liability arising from the claim. On the basis of their audit work, the auditors reported no inconsistencies or misstatements that were material in the context of the financial statements as a whole.
3) Carrying value of retail fixed assetsThe Group has invested a significant amount of capital outside the UK in its retail store portfolio. Given the relative immaturity of the brand outside the UK, the payback period is typically longer and it is not uncommon for new stores to make losses in their starting phase. The Audit Committee challenged management on the evidence on which they based their assessment as to when an indicator exists for loss making stores and needs to be formally tested. This included an assessment of performance of retail stores to the original business case, comparing relative performance of stores within each region and confirming that management’s assessment was in line with the Committee’s understanding of the maturity of the brand in each location. The auditors explained to the Committee the work they had conducted during the year. On the basis of their audit work, the auditors reported no inconsistencies or misstatements that were material in the context of the financial statements as a whole, and in our view this supports the appropriateness of our methodology.
4) Misstatements Management confirmed to the Committee that it was not aware of any material misstatements or immaterial misstatements made intentionally to achieve a particular presentation. The auditors reported to the Committee the misstatements that they had found in the course of their work and no material amounts remain unadjusted. The Committee confirms that it is satisfied that the auditors have fulfilled their responsibilities with diligence and professional scepticism.
After reviewing and challenging the presentations and reports from management and consulting where necessary with the auditors, the Committee is satisfied that the Financial Statements appropriately address the critical judgements and key estimates (both in respect to the amounts reported and the disclosures). The Committee is also satisfied that the significant assumptions used for determining the value of assets and liabilities have been appropriately scrutinised, challenged and are sufficiently robust.
5) Future IFRS developmentsThe Committee has discussed future accounting developments likely to affect the presentation of the Group’s financial statements.
The Committee is responsible for the review of the Company’s procedures for responding to the allegations of whistle blowers and the arrangements by which staff may, in confidence, raise concerns about possible financial reporting irregularities.
External AuditThe Committee oversees the Company’s relationship with the external auditors and makes recommendations to the Board in relation to their appointment, reappointment and removal and approves their remuneration and terms of engagement. The Board and Committee also review the independence of the external auditors and consider the engagement of the external auditors to supply non-audit services.
The Company has adopted a formal policy on the supply of non-audit services by the external auditors. They may only provide such services on condition that such advice does not conflict with their statutory responsibilities and ethical guidance. The Committee Chairman’s pre-approval is required before the Company uses non-audit services that exceed financial limits set out by that policy and the aggregate spend is also reviewed by the Committee on an annual basis. Details of the auditors’ remuneration for audit and non-audit fees are disclosed in Note 3 to the financial statements.
The Committee recognises that the independence of the auditors is an essential part of the audit framework and the assurance that it provides. The Committee monitors any non-audit work that is undertaken by the external auditors to ensure that their objectivity and independence is not compromised.
The Committee has formally reviewed the independence of the auditors during the review year. KPMG Audit Plc has provided a letter to the Committee confirming that it remains independent within the meaning of the regulations on this matter and in accordance with professional standards.
To assess the effectiveness of the external auditors, the Committee reviewed:
• the external auditors’ fulfilment of the agreed audit plan and variations from it;
• reports highlighting the major issues that arose during the course of the audit;
• feedback from the businesses evaluating the performance of each assigned audit team; and
• a report from the Audit Quality Review Team of the Financial Reporting Council on KPMG.
The Committee holds private meetings with the external auditors before each Committee meeting to review key issues within its sphere of interest and responsibility. To fulfil its responsibility for oversight of the external audit process, the Committee reviewed:
• the terms, areas of responsibility, associated duties and scope of the audit as set out in the external auditors’ engagement letter for the forthcoming year;
• the external auditors’ overall work plan for the forthcoming year;
• the external auditors’ fee proposal;
• the major issues that arose during the course of the audit and their resolution;
• key accounting and audit judgements;
• the level of errors identified during the audit; and
• recommendations made by the external auditors in their management letters and the adequacy of management’s response.
Consideration is also given by the Committee to the need to include the risk of the withdrawal of the external auditors from the market in its risk evaluation and planning.
Audit TenderThe Committee considers the reappointment of the external auditors each year and assesses their independence on an ongoing basis. KPMG have been the Company’s external auditors since 2001, with a competitive audit tender process carried out in 2012. The Committee will next tender the position for external auditors in accordance with the 2012 Code.
Nomination CommitteeDuring the year the Nomination Committee (the “Committee”) was chaired by David Bernstein and its other members were Ronald Stewart and Anne Sheinfield. The composition of the Committee during the year complied with Provision B.2.1 of the Code.
The Committee is responsible for nominating candidates for appointment to the Board.
All non-executive directors are advised of the time commitment considered necessary to enable them to fulfill their responsibilities prior to appointment.
The terms of reference for the Committee are available on request from the Company Secretary.
Appointments to the BoardOn 9 January 2014, Andrew Jennings was appointed to the Board as a non-executive director, effective from 1 February 2014. The Committee considered a shortlist of potential candidates in light of the balance of skills, experience, independence and knowledge on the Board, determining against objective criteria that Andrew would be a suitable and valuable addition to the Board. In light of the wealth of Andrew’s international retail experience, the Committee did not consider it necessary to use an external search consultancy and open advertising was not used in respect of his appointment.
Newly appointed directors are given training appropriate to the level of their previous experience. Non-executive directors meet regularly with members of the executive committee and other personnel within the organisation. In addition, site visits ensure that the non-executive directors gain first-hand experience of developments within the Group.
DIRECTORS’ REPORT: GOVERNANCE DIRECTORS’ REPORT: GOVERNANCE

17
Any director appointed during the year is required, under the provisions of the Company’s Articles of Association, to retire and seek re-election by the shareholders at the next Annual General Meeting.
The Company’s Articles of Association require one third of the Directors for the time being to retire, and each Director to retire from office at least once every three years. However, in line with Provision B.7.1 of the Code, the Board has determined that all Directors would retire and stand for re-election on an annual basis.
DiversityWe strongly support the principle of boardroom diversity, of which gender is one element and Anne Sheinfield has been on the Board since June 2010 and the Board is very pleased to benefit from her valuable contribution.
Boardroom diversity, including gender, is an important consideration when assessing a candidate’s ability to contribute to, and complement the abilities of, a balanced Board.
Our Board appointments will always be made on merit against objective criteria, and this will continue to be the priority rather than aiming to achieve an externally prescribed diversity target.
As noted in the People report on page 23, the continued expansion of the Company means that Ted Baker’s workforce is becoming increasingly more diverse. The Company will continue to support the development and progression of all employees, with the aim of maintaining and achieving diversity throughout all levels of the organisation.
Communication with ShareholdersThe Group attaches considerable importance to the effectiveness of its communication with its shareholders. The full report and accounts are sent to all shareholders and further copies are distributed to others with potential interest in the Group’s performance.
The directors seek to build on a mutual understanding of objectives between the Company and its institutional shareholders by making general presentations after the interim and preliminary results; meeting shareholders to discuss long-term issues and gather feedback; and communicating regularly throughout the year. All shareholders have access to these presentations, as well as to the Annual Report and Accounts and to other information about the Company, through the website at www.tedbakerplc.com. They may also attend the Company’s Annual General Meeting at which they have the opportunity to ask questions.
Non-executive directors are kept informed of the views of shareholders by the executive directors and are provided with independent feedback from investor meetings.
Conflicts of interestsThe Company’s Articles of Association take account of certain provisions of the Companies Act 2006 relating to directors’ conflicts of interest. These provisions permit the Board to consider, and if thought fit, to authorise situations where a director has an interest that conflicts, or may possibly conflict, with the interests of the Company. The Board has adopted procedures for the approval of such conflicts. The Board’s powers to authorise conflicts are operating effectively and the procedures are being followed.
Internal ControlThe Board is ultimately responsible for the Group’s system of internal control and for reviewing its effectiveness. However, such a system is designed to manage rather than eliminate the risk of failure to achieve business objectives and can provide only reasonable and not absolute assurance against material misstatement or loss.
The Board confirms that there is an ongoing process for identifying, evaluating and managing the significant risks faced by the Group, which has been in place for the year under review and up to the date of approval of the Annual Report and Accounts, and that this process is regularly reviewed by the Board and accords with “Internal Control: Guidance for Directors on the Code” (the “Turnbull guidance”).
The Board has reviewed the effectiveness of the system of internal control. In particular, it has reviewed and updated the process for identifying and evaluating the significant risks affecting the business and the policies and procedures by which these risks are managed. Management is responsible for the identification and evaluation of significant risks applicable to their areas of the business together with the design and operation of suitable internal controls. These risks are assessed on a continual basis and may be associated with a variety of internal or external sources including control breakdowns, disruption in information systems, competition, natural catastrophe and regulatory requirements.
The Group has an independent internal audit function whose findings are regularly reviewed by the Executive Committee and the Board. The Audit Committee monitors and reviews the effectiveness of the internal audit activities.
Management reports regularly on its review of risks and how they are managed to the Risk Committee, whose main role is to review, on behalf of the Board, the key risks inherent in the business and the system of control necessary to manage such risks, and to present their findings to the Board. The Chief Executive reports to the Board on behalf of the Executive Committee on significant changes in the business and the external environment which affect significant risks.
DIRECTORS’ REPORT: GOVERNANCE

20 Ted Baker Plc Annual Report and Accounts 2013/14
The Finance Director provides the Board with monthly financial information which includes key performance indicators. Where areas for improvement in the system are identified, the Board considers the recommendations made by the Risk Committee and the Audit Committee.
The Risk Committee includes the Finance Director and various heads of department. It reviews, on a twice yearly basis, the risk management and control process and considers:
• the authority, resources and co-ordination of those involved in the identification, assessment and management of significant risks faced by the Group;
• the response to the significant risks which have been identified by management and others;
• the maintenance of a controlled environment directed towards the proper management of risk; and
• the annual reporting procedures.
Additionally, the Risk Committee keeps abreast of all changes made to the systems and follows up on areas that require improvement. It reports to the Board at twice yearly intervals or more frequently should the need arise.
The Bribery Act 2010The Board continues to proactively review the Group’s procedures to ensure they are sufficiently robust to prevent corruption.
susTainaBiliTy anD The environMenTAt Ted Baker we believe in being open and honest in the way we do business; this includes doing the right thing by all of our stakeholders throughout our supply chain and operating in a fair and sustainable manner. We approach our social, environmental and ethical commitments (SEE) with the same focus and attention to detail that permeates the rest of the business. To ensure that we continue to meet our responsibilities in these important areas we designed a three pronged plan, named Ted3, in 2012.
How we workLindsay Page has been given specific responsibility for overseeing the formulation of the Group’s policies and procedures for managing risks arising from social, environmental and ethical matters. In addition, the Board has tasked four members of the Executive Committee to oversee specific areas of our SEE agenda for the Group. These Executive Committee members participate because of the relevance of their departments to our ongoing commitment in these areas – Brand Communication, Product Design, Production and Special Projects (Interior Design). Our full time Green Guardian coordinates these areas and the Group’s cross-functional team which is responsible for addressing SEE concerns of the Group (the “Ted’s Conscience Team”).
Our Sustainability FocusWe believe in three very important areas of sustainability:
1. Protect: The Group is committed to protecting the environment within our properties and throughout our entire supply chain by reducing the use of resources and increasing efficiencies wherever possible.
2. Product: The Group is committed to purchasing the best possible products for use and sale within and throughout Ted and associated businesses at the same time as ensuring that the people and environment within the supply chain are treated well.
3. Practise: The Group is committed to practising what it preaches by implementing a robust strategy to achieve our goals and targets by educating and inspiring our teams.
Environmental ImpactsAs part of our commitment to “Protect”, the Group has engaged in a number of environmental projects during the course of the year:
• We continue to participate in the Carbon Disclosure Project to measure and disclose our greenhouse gas emissions and climate change strategies. Our score increased from 66% in the previous year to 71%.
• All of our business travel within Scopes 1 and 3 is CarbonNeutral®. This means that the unavoidable emissions generated by air, road and rail journeys, required to visit our stores, trustees and suppliers, have been offset in full through the purchase of carbon credits from Voluntary Carbon Standard (VCS) validated projects.
• We are constantly reviewing the waste our business generates in an effort to achieve our overall aim of sending no waste to landfill. We participate in the Wastepack Compliance Scheme as part of the Producer Responsibility Obligations (Packaging Waste) Regulations 1997, and continue to reduce unnecessary packaging.
• We work with the National Industrial Symbiosis Programme (“NISP”) to recycle as much waste from head office as we can through their network of charities, such as Scrapstores.
• We have been working with charity Newlife to ensure that all faulty garments returned to store do not end up in landfill. From the end of March 2014 all faulty returned garments will be sent to Newlife for resale as second-hand garments.
• Through relationships with charities Oxfam, Newlife and World Jewish Relief we have been able to ensure that our end of life garments are utilised in the best way, raising over £100,000 and diverting 12 tonnes of waste from landfill.
DIRECTORS’ REPORT: GOVERNANCE
21 22 Ted Baker Plc Annual Report and Accounts 2013/14
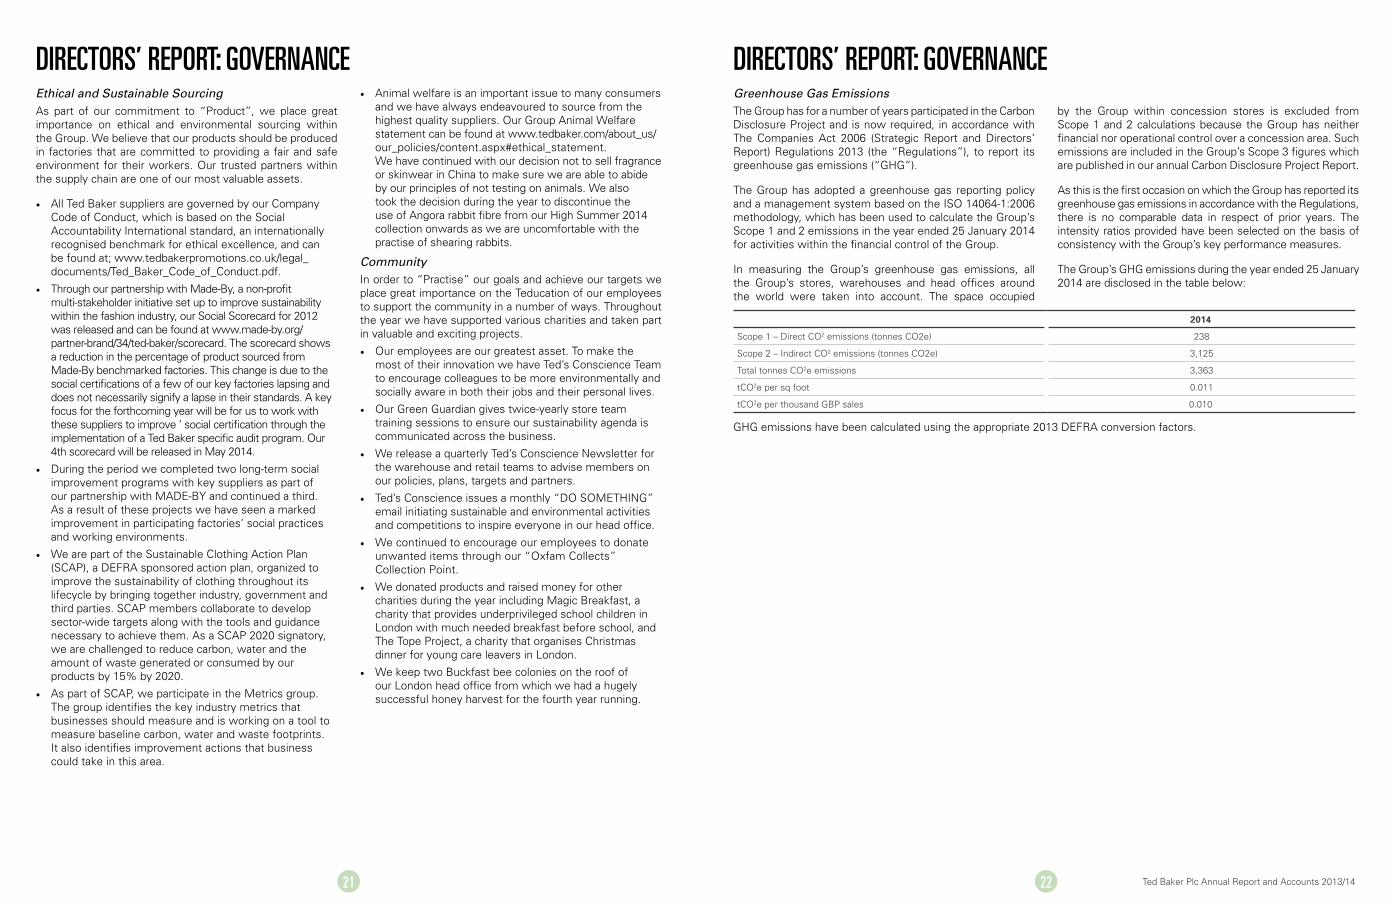
2014
Scope 1 – Direct CO2 emissions (tonnes CO2e) 238
Scope 2 – Indirect CO2 emissions (tonnes CO2e) 3,125
Total tonnes CO2e emissions 3,363
tCO2e per sq foot 0.011
tCO2e per thousand GBP sales 0.010
GHG emissions have been calculated using the appropriate 2013 DEFRA conversion factors.
Ethical and Sustainable SourcingAs part of our commitment to “Product”, we place great importance on ethical and environmental sourcing within the Group. We believe that our products should be produced in factories that are committed to providing a fair and safe environment for their workers. Our trusted partners within the supply chain are one of our most valuable assets.
• All Ted Baker suppliers are governed by our Company Code of Conduct, which is based on the Social Accountability International standard, an internationally recognised benchmark for ethical excellence, and can be found at; www.tedbakerpromotions.co.uk/legal_documents/Ted_Baker_Code_of_Conduct.pdf.
• Through our partnership with Made-By, a non-profit multi-stakeholder initiative set up to improve sustainability within the fashion industry, our Social Scorecard for 2012 was released and can be found at www.made-by.org/partner-brand/34/ted-baker/scorecard. The scorecard shows a reduction in the percentage of product sourced from Made-By benchmarked factories. This change is due to the social certifications of a few of our key factories lapsing and does not necessarily signify a lapse in their standards. A key focus for the forthcoming year will be for us to work with these suppliers to improve ’ social certification through the implementation of a Ted Baker specific audit program. Our 4th scorecard will be released in May 2014.
• During the period we completed two long-term social improvement programs with key suppliers as part of our partnership with MADE-BY and continued a third. As a result of these projects we have seen a marked improvement in participating factories’ social practices and working environments.
• We are part of the Sustainable Clothing Action Plan (SCAP), a DEFRA sponsored action plan, organized to improve the sustainability of clothing throughout its lifecycle by bringing together industry, government and third parties. SCAP members collaborate to develop sector-wide targets along with the tools and guidance necessary to achieve them. As a SCAP 2020 signatory, we are challenged to reduce carbon, water and the amount of waste generated or consumed by our products by 15% by 2020.
• As part of SCAP, we participate in the Metrics group. The group identifies the key industry metrics that businesses should measure and is working on a tool to measure baseline carbon, water and waste footprints. It also identifies improvement actions that business could take in this area.
• Animal welfare is an important issue to many consumers and we have always endeavoured to source from the highest quality suppliers. Our Group Animal Welfare statement can be found at www.tedbaker.com/about_us/our_policies/content.aspx#ethical_statement. We have continued with our decision not to sell fragrance or skinwear in China to make sure we are able to abide by our principles of not testing on animals. We also took the decision during the year to discontinue the use of Angora rabbit fibre from our High Summer 2014 collection onwards as we are uncomfortable with the practise of shearing rabbits.
CommunityIn order to “Practise” our goals and achieve our targets we place great importance on the Teducation of our employees to support the community in a number of ways. Throughout the year we have supported various charities and taken part in valuable and exciting projects.
• Our employees are our greatest asset. To make the most of their innovation we have Ted’s Conscience Team to encourage colleagues to be more environmentally and socially aware in both their jobs and their personal lives.
• Our Green Guardian gives twice-yearly store team training sessions to ensure our sustainability agenda is communicated across the business.
• We release a quarterly Ted’s Conscience Newsletter for the warehouse and retail teams to advise members on our policies, plans, targets and partners.
• Ted’s Conscience issues a monthly “DO SOMETHING” email initiating sustainable and environmental activities and competitions to inspire everyone in our head office.
• We continued to encourage our employees to donate unwanted items through our “Oxfam Collects” Collection Point.
• We donated products and raised money for other charities during the year including Magic Breakfast, a charity that provides underprivileged school children in London with much needed breakfast before school, and The Tope Project, a charity that organises Christmas dinner for young care leavers in London.
• We keep two Buckfast bee colonies on the roof of our London head office from which we had a hugely successful honey harvest for the fourth year running.
DIRECTORS’ REPORT: GOVERNANCE DIRECTORS’ REPORT: GOVERNANCEGreenhouse Gas EmissionsThe Group has for a number of years participated in the Carbon Disclosure Project and is now required, in accordance with The Companies Act 2006 (Strategic Report and Directors’ Report) Regulations 2013 (the “Regulations”), to report its greenhouse gas emissions (“GHG”).
The Group has adopted a greenhouse gas reporting policy and a management system based on the ISO 14064-1:2006 methodology, which has been used to calculate the Group’s Scope 1 and 2 emissions in the year ended 25 January 2014 for activities within the financial control of the Group.
In measuring the Group’s greenhouse gas emissions, all the Group’s stores, warehouses and head offices around the world were taken into account. The space occupied
by the Group within concession stores is excluded from Scope 1 and 2 calculations because the Group has neither financial nor operational control over a concession area. Such emissions are included in the Group’s Scope 3 figures which are published in our annual Carbon Disclosure Project Report.
As this is the first occasion on which the Group has reported its greenhouse gas emissions in accordance with the Regulations, there is no comparable data in respect of prior years. The intensity ratios provided have been selected on the basis of consistency with the Group’s key performance measures.
The Group’s GHG emissions during the year ended 25 January 2014 are disclosed in the table below:

23
PeoPleThe talent, commitment and passion of the Ted Baker team are key factors in the success of our business and brand. The value we place on our team is shown in the way we motivate them, encourage learning and development, nurture their growth and potential, and recognise and reward their contributions.
Reward and RecognitionRemuneration is reviewed annually and a benchmarking review is undertaken to ensure we remain competitive and fair across all areas of the business. Our rewards include bonus schemes linked to sales targets and individual and corporate performance. We encourage our people to join our Save As You Earn (SAYE) schemes. This year we celebrated our third year of Wisdom Awards; recognition for the longer serving members of the team and a chance for them to celebrate and share their stories with the rest of the team.
Learning and DevelopmentPerformance is reviewed bi-annually with each team member to discuss personal and career development. Within this process, goals and objectives are set and linked to personal growth and business development as well as Ted’s environmental and social commitments. We allow our people to broaden their abilities and knowledge by exposing them to new experiences. We invest in training which ranges from specialist and technical skills training, to in-house developed courses focusing on management skills, leadership skills, brand awareness and self-awareness. Firm career paths exist across the Group and inter-departmental and international moves play a large part in retaining and growing talent.
DiversityThe Group believes in respecting individuals and their rights in the workplace. With this in mind, specific policies are in place covering harassment and bullying, whistle blowing and equal opportunities. Our team represents a wide and diverse workforce from all backgrounds, sexual orientations, nationalities and ethnic and religious groups. We support sponsorship of visa applications, where appropriate, to retain specific talent within the business. With continued overseas expansion our workforce is becoming more diverse and we respect cultural difference and actively seek to learn about them in each territory we operate. As at 25 January 2014, of our 2,524 global workforce, 882 employees were male and 1,642 female. Of these, 50 were senior managers (25 male, 25 female), which include members of our leadership team and individuals who are statutory directors of the corporate entities whose financial information is included in the Group’s 2014 consolidated accounts in this Annual Report. In terms of the Company’s Board of Directors, there were 5 directors, 4 of whom were male and 1 female. Prior to any appointment to the Board, the Nomination Committee gives due regard to diversity and gender with a view to appointing the best placed individual for the role (see page 25 to view biographies of the members of the Board).
Health, Safety and WelfareOur duty and commitment to the well-being of our team is supported by activity such as private healthcare, occupational health, health seminars and funding for flu jabs. During the period, we conducted a Wellness health assessment day and we offer health and fitness classes to our team members at our head office. We also run a Childcare Voucher Scheme. We launched an Employee Assistance Programme during the year that further supports our genuine concern for the well-being of our team.
The prevention and identification of risks and accidents is supported by an external health and safety service provider and ongoing training of management teams. A dedicated health and safety focused team member has been appointed and will strengthen our knowledge and commitment in this area of our business.
Disabled EmployeesApplications for employment by disabled persons are always fully and fairly considered, bearing in mind the aptitudes of the applicant concerned. In the event of members of the team becoming disabled every effort is made to ensure that their employment with the Group continues and that where appropriate reasonable adjustments are made and relevant training is arranged. It is the policy of the Group that the training, career development and promotion of disabled persons should, as far as possible, be identical with that of other employees.
CultureThe spirit in which we conduct our business and interact with our team always takes into consideration “Would Ted do it that way?” We regularly host internal events, including Teducation sessions with the Chief Executive telling the story behind the brand and also family days where we open our doors to family and friends.
Employer BrandThe culture sets the tone for how our ‘employer brand’ speaks to our teams. Aligned to the business brand, our Ted tone of voice is translated through every employee touch point throughout the employee lifecycle. Our Coach Station department leads the way in communicating a unique approach to all people and team orientated activity.
Employee EngagementThe Group places considerable value on the involvement of its employees and continues to keep them informed on matters affecting them and on the significant factors affecting the performance of the Group. This is achieved through formal and informal meetings and employee representatives are consulted regularly on a wide range of matters affecting employees current and future interests. Employees are regularly informed of the Group’s performance and the factors affecting its performance during the year.
DIRECTORS’ REPORT: GOVERNANCE
25 26 Ted Baker Plc Annual Report and Accounts 2013/14
DIRECTORS’ REPORT: OTHER STATUTORy DISCLOSURESreMuneraTion rePorT
Annual StatementDear Shareholder,
The Directors’ Remuneration Report has been prepared on behalf of the Board by the Remuneration Committee (the “Committee”) in accordance with the requirements of the Companies Act 2006 and Schedule 8 of the Large and Medium-sized Companies and Groups (Accounts and Reports) Regulations 2008, as amended, and meets the relevant requirements of the Listing Rules of the Financial Conduct Authority and the UK Corporate Governance Code.
The Remuneration Report is split into two parts:
• The directors’ remuneration policy which sets out the Company’s proposed policy on directors’ remuneration which will apply with effect from this year’s Annual General Meeting (AGM) and the key factors that were taken into account in setting the policy. The directors’ remuneration policy is subject to a binding shareholder vote at this year’s AGM and after that at least every third year.
• The annual report on remuneration sets out payments and awards made to executive directors and non-executive directors and details the synergy between Company performance and remuneration for the 2013/2014 financial year. The annual report on remuneration together with this letter is subject to an advisory shareholder vote at the 2014 AGM.
2013/14 – A Year in Review2013/14 has delivered a strong performance for the Group. Unique and talented teams have exceeded expectations in a competitive trading environment as the Group continues to expand in new and existing markets. In doing so, I am pleased to announce that 90% of the maximum potential annual bonus has been achieved and will be paid to executive directors and eligible employees across the Group.
Following the success of the Value Creation Plan (VCP), which has now run its course, the Committee consulted with remuneration advisers and certain key shareholders on a replacement for the VCP that will incentivise executives to build on the Company’s performance to date. As a result, the Ted Baker Plc Long-Term Incentive Plan 2013 (the “2013 LTIP”) was approved at the General meeting on 20 June 2013.
This scheme was introduced in July 2013 for executive directors and other senior executives across the Group. The criteria used to measure performance are growth targets based on profit before tax per share over the performance period and share price growth over the award period. The Committee felt that these criteria were appropriate for the Group in view of its recent investment in expansion and should encourage management to focus on longer term profitable growth. The share price growth target has been favoured over a TSR based measure because the unique profile of the Group’s business means that a readily comparable TSR benchmark was not available. A commitment has, however, been made to apply the existing dividend policy consistently.
The Committee would like to thank shareholders for their support in establishing scheme rules and performance conditions for this scheme that are acceptable to all shareholders.
Last year’s remuneration report was approved by 99.02% of shareholders and the Ted Baker Plc Long-Term Incentive Plan 2013 was approved by 94.40% of shareholders. This demonstrates our prudent approach to remuneration.
2014/15 – The Year AheadThe Committee undertook a review of base salaries in 2013/14, taking into account general economic and market conditions. The resulting proposal for base salaries payable to executive directors in the year ahead is for a pay increase of broadly 3% which is in line with employees across the Group.
The Committee also undertook a review of the consistency of remuneration policy across the Group and is satisfied that an appropriate reward structure exists below Board level to recognise and retain our top talent, particularly while we go through a period of change management with the implementation of business systems to support our future growth.
In ConclusionThe annual report on remuneration provides further details and the directors’ remuneration policy sets out how we are continuously building for the future.
I hope that we can rely on your vote in favour of the annual report on remuneration and our directors’ remuneration policy for future years at this year’s AGM.
anne sheinfieldChairman
BoarD oF DirecTorsDavid alan Bernstein, cBe – non-executive chairman (70)
David is Chairman of the British Red Cross. Previously he was joint Managing Director of Pentland Group Plc, Chairman of Blacks Leisure Plc, Manchester City Plc and the Football Association. He is Chairman of the Nomination Committee and a member of the Audit and Remuneration Committees. David is an independent director. In the New Year Honours’ List of 2014 David was appointed Commander of the Order of the British Empire (CBE) for services to football.
raymond stuart kelvin, cBe – chief executive (58) (“closest Man To Ted”)
Ray, the founder of Ted Baker, has worked in the fashion industry for over 40 years. In 1973 he founded PC Clothing Limited, a supplier of womenswear to high street retailers. In 1987 Ray developed the Ted Baker brand and has been Chief Executive of Ted Baker since its launch in 1988. In the New Year Honours’ List of 2011 Ray was appointed Commander of the Order of the British Empire (CBE) for services to the fashion industry.
lindsay Dennis Page, Ma, aca – Finance Director (55)
Lindsay joined Ted Baker as Finance Director in February 1997. He joined Binder Hamlyn in 1981, became a founder member of the corporate finance department in 1986 and a partner in 1990. Binder Hamlyn subsequently merged with Arthur Andersen in 1994.
ronald stewart – non-executive Director (66)
Ron spent all his 39 year banking career at The Royal Bank of Scotland Plc, retiring in 2003 as Deputy Managing Director of its Corporate Banking Department in London. He is a Trustee of several Christian charities and a Governor of Reeds School in Surrey. He is Chairman of the Audit Committee and a member of the Nomination and Remuneration Committees. Ron is an independent director and the senior non-executive director.
anne sheinfield – non-executive Director (48)
Anne was appointed as a non-executive director on 15 June 2010. Anne is a commercial lawyer with more than two decades of post qualification experience in the theatre, TV and music areas of entertainment and has a wealth of intellectual property and commercial legal experience. She is Chairman of the Remuneration Committee. Anne is an independent director.
andrew Jennings – non-executive Director (65)
Andrew was appointed as a non-executive director on 1 February 2014. He has worked in the international retail industry for over 40 years at some of the world’s most respected high-end department stores. Previously he was Chief Executive Officer of the Karstadt Group in Germany and prior to this has held a number of senior executive positions at leading UK and international retailers including Saks Fifth Avenue in the USA; Holt Renfrew in Canada; Harrods and House of Fraser in the UK; and Brown Thomas in Ireland. He is a member of the Audit Committee. Andrew is an independent director.
DIRECTORS’ REPORT: OTHER STATUTORy DISCLOSURES
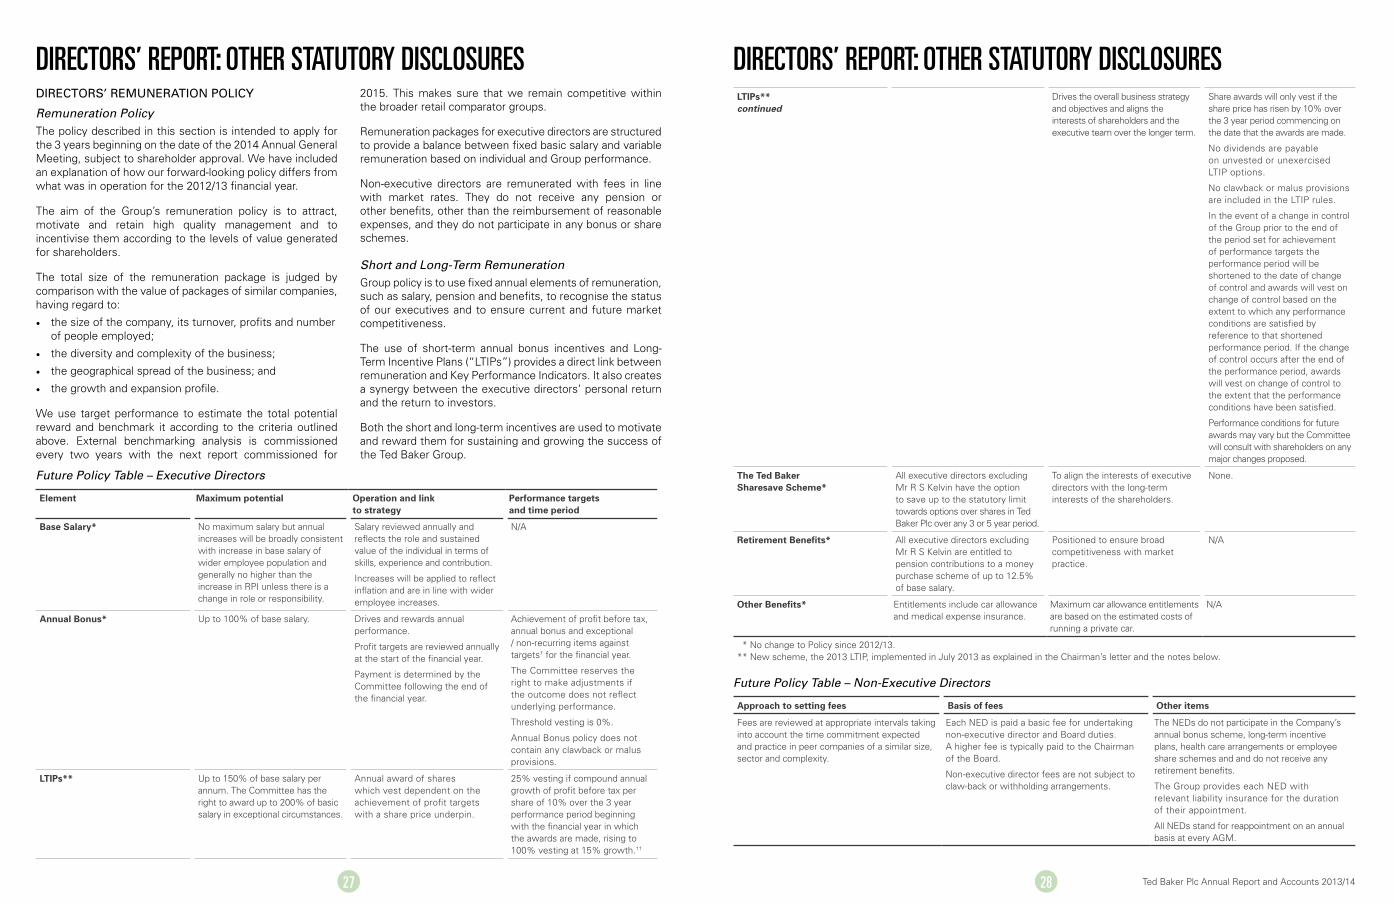
27 28 Ted Baker Plc Annual Report and Accounts 2013/14
DIRECTORS’ REPORT: OTHER STATUTORy DISCLOSURES DIRECTORS’ REPORT: OTHER STATUTORy DISCLOSURESLTIPs** continued
Drives the overall business strategy and objectives and aligns the interests of shareholders and the executive team over the longer term.
Share awards will only vest if the share price has risen by 10% over the 3 year period commencing on the date that the awards are made.
No dividends are payable on unvested or unexercised LTIP options.
No clawback or malus provisions are included in the LTIP rules.
In the event of a change in control of the Group prior to the end of the period set for achievement of performance targets the performance period will be shortened to the date of change of control and awards will vest on change of control based on the extent to which any performance conditions are satisfied by reference to that shortened performance period. If the change of control occurs after the end of the performance period, awards will vest on change of control to the extent that the performance conditions have been satisfied.
Performance conditions for future awards may vary but the Committee will consult with shareholders on any major changes proposed.
The Ted Baker Sharesave Scheme*
All executive directors excluding Mr R S Kelvin have the option to save up to the statutory limit towards options over shares in Ted Baker Plc over any 3 or 5 year period.
To align the interests of executive directors with the long-term interests of the shareholders.
None.
Retirement Benefits* All executive directors excluding Mr R S Kelvin are entitled to pension contributions to a money purchase scheme of up to 12.5% of base salary.
Positioned to ensure broad competitiveness with market practice.
N/A
Other Benefits* Entitlements include car allowance and medical expense insurance.
Maximum car allowance entitlements are based on the estimated costs of running a private car.
N/A
* No change to Policy since 2012/13.** New scheme, the 2013 LTIP, implemented in July 2013 as explained in the Chairman’s letter and the notes below.
Future Policy Table – Non-Executive Directors
Approach to setting fees Basis of fees Other items
Fees are reviewed at appropriate intervals taking into account the time commitment expected and practice in peer companies of a similar size, sector and complexity.
Each NED is paid a basic fee for undertaking non-executive director and Board duties. A higher fee is typically paid to the Chairman of the Board.
Non-executive director fees are not subject to claw-back or withholding arrangements.
The NEDs do not participate in the Company’s annual bonus scheme, long-term incentive plans, health care arrangements or employee share schemes and and do not receive any retirement benefits.
The Group provides each NED with relevant liability insurance for the duration of their appointment.
All NEDs stand for reappointment on an annual basis at every AGM.
Element Maximum potential Operation and link to strategy
Performance targets and time period
Base Salary* No maximum salary but annual increases will be broadly consistent with increase in base salary of wider employee population and generally no higher than the increase in RPI unless there is a change in role or responsibility.
Salary reviewed annually and reflects the role and sustained value of the individual in terms of skills, experience and contribution.
Increases will be applied to reflect inflation and are in line with wider employee increases.
N/A
Annual Bonus* Up to 100% of base salary. Drives and rewards annual performance.
Profit targets are reviewed annually at the start of the financial year.
Payment is determined by the Committee following the end of the financial year.
Achievement of profit before tax, annual bonus and exceptional / non-recurring items against targets† for the financial year.
The Committee reserves the right to make adjustments if the outcome does not reflect underlying performance.
Threshold vesting is 0%.
Annual Bonus policy does not contain any clawback or malus provisions.
LTIPs** Up to 150% of base salary per annum. The Committee has the right to award up to 200% of basic salary in exceptional circumstances.
Annual award of shares which vest dependent on the achievement of profit targets with a share price underpin.
25% vesting if compound annual growth of profit before tax per share of 10% over the 3 year performance period beginning with the financial year in which the awards are made, rising to 100% vesting at 15% growth.††
DirecTors’ reMuneraTion Policy
Remuneration PolicyThe policy described in this section is intended to apply for the 3 years beginning on the date of the 2014 Annual General Meeting, subject to shareholder approval. We have included an explanation of how our forward-looking policy differs from what was in operation for the 2012/13 financial year.
The aim of the Group’s remuneration policy is to attract, motivate and retain high quality management and to incentivise them according to the levels of value generated for shareholders.
The total size of the remuneration package is judged by comparison with the value of packages of similar companies, having regard to:
• the size of the company, its turnover, profits and number of people employed;
• the diversity and complexity of the business;
• the geographical spread of the business; and
• the growth and expansion profile.
We use target performance to estimate the total potential reward and benchmark it according to the criteria outlined above. External benchmarking analysis is commissioned every two years with the next report commissioned for
2015. This makes sure that we remain competitive within the broader retail comparator groups.
Remuneration packages for executive directors are structured to provide a balance between fixed basic salary and variable remuneration based on individual and Group performance.
Non-executive directors are remunerated with fees in line with market rates. They do not receive any pension or other benefits, other than the reimbursement of reasonable expenses, and they do not participate in any bonus or share schemes.
Short and Long-Term RemunerationGroup policy is to use fixed annual elements of remuneration, such as salary, pension and benefits, to recognise the status of our executives and to ensure current and future market competitiveness.
The use of short-term annual bonus incentives and Long-Term Incentive Plans (“LTIPs”) provides a direct link between remuneration and Key Performance Indicators. It also creates a synergy between the executive directors’ personal return and the return to investors.
Both the short and long-term incentives are used to motivate and reward them for sustaining and growing the success of the Ted Baker Group.
Future Policy Table – Executive Directors

29 30 Ted Baker Plc Annual Report and Accounts 2013/14
Differences in Remuneration Policy for All Employees A consistent remuneration approach is applied at all levels throughout the Group, except as outlined below, to make sure that business strategy and performance are aligned and that the total reward is sufficient to attract and retain high -performing and talented individuals.
All employees of Ted Baker Plc are entitled to a base salary, annual or periodic bonus and benefits dependent upon their role within the Group. The maximum opportunity available for a base salary increase is consistent across all employees. The maximum opportunity for bonus and benefits is based on seniority, responsibility and function of the role.
Conditional long-term share awards are only available to executive directors and other members of senior management across the Group. Share option grants under the Save As You Earn scheme are available to all UK employees.
Service Contracts and Policy of Payments for Loss of Office
Standard provision Policy Details Other provisions in service contracts
Notice periods in executive director service contracts
12 months’ notice from the Company.
12 months’ notice from the executive director.
Executive directors may be required to work during their notice period, be placed on gardening leave for all or part of the notice period or be provided with pay in lieu of notice if not required to work the full period of notice.
Executive directors’ service contracts include non-compete and non-poaching provisions.
Compensation for loss of office in service contracts
No more than 12 months’ salary, pension and benefits (excluding bonus).
Payable monthly and adjusted if the executive director obtains alternative employment.
N/A
Treatment of annual bonus on termination
No payment unless employed on the date of payment of bonus except for “good leavers”. The Committee retains discretion to determine whether an executive director is a “good leaver” taking account of circumstances including in particular death, disability and redundancy.
“Good leavers” are entitled to a bonus pro-rated to the period of service during the year provided the financial targets have been achieved and all necessary conditions have been met.
The Committee has discretion to reduce the entitlement of a “good leaver” in line with performance and the circumstances of the termination.
N/A
Treatment of unvested and deferred share awards on termination under plan rules
All awards lapse except for “good leavers” (e.g. on death, disability, ill health, injury, retirement, redundancy). The Committee retains discretion to treat an executive director as a “good leaver” in other circumstances.
For “good leavers,” the extent of vesting of awards is at the discretion of the Committee taking account of performance to date of leaving and pro-rated for period of employment in the vesting period for the award.
The Committee’s discretion to treat an executive director as a “good leaver” will take into account the particular circumstances of the executive director’s departure.
N/A
Outside appointments Executive directors may accept one Board appointment in another listed company.
The Committee Chairman’s approval must be sought before accepting appointment. Fees may be retained by the executive director.
N/A
Non-executive directors NEDs have service contracts with the Company which provide:
3 - 6 months’ notice from the Company.
3 - 6 months’ notice from the NED.
NEDs may be required to work during the notice period, be placed on gardening leave for all or part of the notice period or may be provided with pay in lieu of notice if not required to work the full period of notice.
N/A
Notes to the Executive Directors’ Policy Table
†Annual bonusProfit targets are set by the Committee at the start of the financial year by reference to internal budgets and taking account of consensus market expectations for profit before tax and exceptional/non-recurring items. Market expectations for profit are considered a key measure of business performance for our shareholders; in considering these, the highest and lowest expectations from the range are excluded to help reduce the risk of distortion. The funds available for payment of the annual bonus are determined by the achievement of profit before tax, annual bonus and exceptional/non-recurring items in a financial year in excess of the target. The maximum bonus payable to staff is capped as a percentage of base salary which varies according to individual contracts. The maximum annual bonus payable to an executive director is capped at 100% of base salary.
††LTIPsIn arriving at the performance criteria for the 2013 LTIP, the comparator group used for benchmarking purposes consisted of listed companies with similar enterprise value to Ted Baker Plc. The group included retail and other service sector businesses and was approved by the Committee.
This scheme was introduced in July 2013 for executive directors and other senior executives across the Group. The criteria used to measure performance are growth targets based on profit before tax per share over the performance period and share price growth over the award period. The profit per share growth targets were set following consideration of consensus market analyst expectations and the share price growth target was agreed in consultation between the Committee and shareholders.
The Committee felt that these criteria were appropriate for the Group in view of its recent investment in expansion and should encourage management to focus on longer term profitable growth. The share price growth target has been favoured over a TSR based measure because the unique profile of the Group’s business means that a readily comparable TSR benchmark was not available. A commitment has, however, been made to apply the existing dividend policy consistently.
Future Policy Table – Non-Executive DirectorsThe Board aims to recruit high-calibre non-executive directors (“NEDs”) with broad commercial, international or other relevant experience. The remuneration policy for NEDs is set by the Board having taken account of the fees paid by other companies of a similar size and complexity.
When recruiting NEDs, the remuneration arrangements offered will generally be in line with those set out in the Non-Executive Directors’ Future Policy Table (page 28).
Statement of Consideration of Employment Conditions Elsewhere in the Company The Group Head of Human Resources presents to the Committee at its meeting in February each year on proposed salary increases for the general employee population and on any changes to remuneration policy within the Company. The Committee limits any increases in base salary for executive directors so that they are broadly in line with the inflationary increase to be applied across the general employee population unless there has been a change in role, or if the salary and total reward falls below the targeted median range.
Proposed remuneration arrangements are discussed with employee communication groups and senior management. The Committee does not specifically invite employees to comment on the executive directors’ remuneration policy but any comments made by employees are taken into account.
As well as benchmarking the remuneration packages of an executive director peer group, the benchmarking exercise performed during the year ended January 2013 included a separate analysis of salaries paid to other senior executives. The findings of this report were taken into consideration in arriving at current remuneration policy.
The Committee’s conclusion following the external benchmark report was that the Group should commit to target total remuneration levels for senior management across the Group within the median range in order to retain and reward key individuals. The next benchmarking report will be performed in the 53 weeks ending January 2015.
DIRECTORS’ REPORT: OTHER STATUTORy DISCLOSURES DIRECTORS’ REPORT: OTHER STATUTORy DISCLOSURES

382
410
1,369
771
1,413
772
44%
26%
30%
20%
27%
53%100%
100% 50% 27%
21%
29%
46%
27%
LTIP variable
Annual variable
Fixed
LTIP variable
Annual variable
Fixed
31 32 Ted Baker Plc Annual Report and Accounts 2013/14
Fixed Pay Target Maximum
Fixed Pay Target Maximum
Total Remuneration Opportunity The total remuneration for each of the executive directors that could result from the proposed remuneration policy in 2014/15 under three different performance scenarios is shown below:
Raymond S Kelvin
Notes:Fixed pay is base salary plus pension and benefits for 2014/15.
Target performance is the level of performance required to deliver 60% of the maximum bonus and 25% of the full LTIP award and the scenario assumes that the share price growth target of 10% is met at the vesting date. The LTIP variable amount relates to awards granted in July 2013 which will not vest until July 2016.
Maximum performance would result in the maximum bonus payment of 100% of salary and 100% vesting of the LTIP award. Again, this assumes that the share price growth target is also met.
For the purpose of the scenarios illustrated above the share price used in calculating the value of the LTIP variable is the average of the Company’s share price over the last quarter of the year ended 25 January 2014.
Mr R S Kelvin has the right to receive £15,000 by way of car allowance during the year ended 31 January 2015. At the date of signing the Company’s accounts, he has chosen to claim only £5,400. This position is reflected in the illustration above; however, Mr R S Kelvin has the right to claim the full value of the allowance at a future date prior to the year end if he chooses.
Statement of Consideration of Shareholder ViewsThe Committee consults with key shareholders and seeks feedback on any major changes to executive remuneration, including the level of awards to be made and the performance targets in respect of the Company’s long-term incentive schemes.
In May 2013 the Committee consulted with key shareholders on the design of the Ted Baker Plc Long-Term Incentive Plan 2013. The consultation included consideration of the move from a single performance period spanning three years to rolling annual awards, performance metrics and conditions, and the level of awards. A number of meetings were held with key shareholders to discuss their comments and feedback before the scheme was finalised and approved at the General Meeting on 20 June 2013.
Contracts of ServiceEach Executive Director has a service contract with a notice period of 12 months. Service contracts and letters of appointment are available for inspection at the registered office. The Board sets NEDs’ fees.
Date of service contract
Unexpired term
Notice period Provision for compensation
D A Bernstein
R S Kelvin
L D Page
R Stewart
A Sheinfield
A Jennings
24 January 2003
17 July 1997
17 July 1997
25 February 2009
15 June 2010
1 February 2014
6 months
12 months
12 months
3 months
3 months
3 months
6 months
12 months
12 months
3 months
3 months
3 months
None
None
None
None
None
None
Recruitment RemunerationThe Group’s strong brand identity, cultural and family ethos attract a high calibre of candidate. If needed, external recruitment agencies are engaged to recruit for specialist roles.
The Committee’s approach to recruitment remuneration is to pay at the comparable internal rate and no more than is necessary to attract candidates with the appropriate level of skill and experience to the role. The Committee retains the principle of a median level total remuneration package when benchmarking for new and senior roles.
In order to attract key talent to Ted Baker Plc, the Committee will, in exceptional circumstances, consider compensating a candidate for losses incurred by leaving a previous employer to join the Group. This will not be considered as regular practice and nor will the Committee commit to matching any expected value of awards.
A relocation package within HMRC guidelines will be offered to executive directors who are required to relocate to take up their appointment within the Group.
The remuneration package for any new executive directors would be made up of the same or broadly similar components to those used to reward existing executive directors of the Group as described in the Future Policy Table for executive directors above. The remuneration package would comprise an appropriate mixture of fixed and variable remuneration as was required to attract a candidate of appropriate skill and level of qualification.
DIRECTORS’ REPORT: OTHER STATUTORy DISCLOSURESDIRECTORS’ REPORT: OTHER STATUTORy DISCLOSURES
Lindsay D Page
1600
1000
1400
800
1200
600
400
200
0
1600
1000
1400
800
1200
600
400
200
0
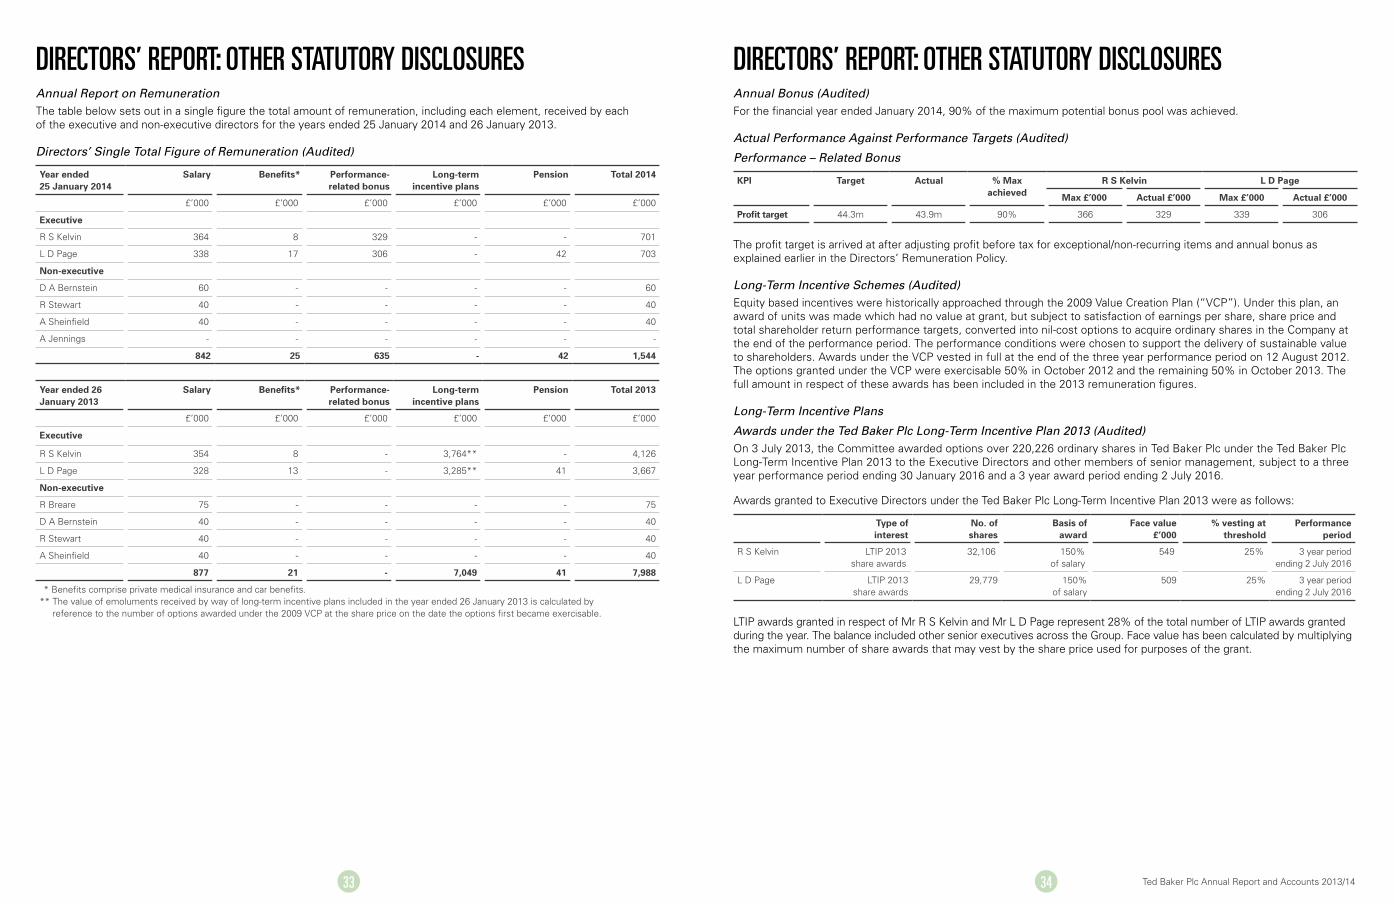
33 34 Ted Baker Plc Annual Report and Accounts 2013/14
DIRECTORS’ REPORT: OTHER STATUTORy DISCLOSURES DIRECTORS’ REPORT: OTHER STATUTORy DISCLOSURESAnnual Report on RemunerationThe table below sets out in a single figure the total amount of remuneration, including each element, received by each of the executive and non-executive directors for the years ended 25 January 2014 and 26 January 2013.
Directors’ Single Total Figure of Remuneration (Audited)
Year ended 25 January 2014
Salary Benefits* Performance-related bonus
Long-term incentive plans
Pension Total 2014
£’000 £’000 £’000 £’000 £’000 £’000
Executive
R S Kelvin 364 8 329 - - 701
L D Page 338 17 306 - 42 703
Non-executive
D A Bernstein 60 - - - - 60
R Stewart 40 - - - - 40
A Sheinfield 40 - - - - 40
A Jennings - - - - - -
842 25 635 - 42 1,544
Year ended 26 January 2013
Salary Benefits* Performance-related bonus
Long-term incentive plans
Pension Total 2013
£’000 £’000 £’000 £’000 £’000 £’000
Executive
R S Kelvin 354 8 - 3,764** - 4,126
L D Page 328 13 - 3,285** 41 3,667
Non-executive
R Breare 75 - - - - 75
D A Bernstein 40 - - - - 40
R Stewart 40 - - - - 40
A Sheinfield 40 - - - - 40
877 21 - 7,049 41 7,988
* Benefits comprise private medical insurance and car benefits.** The value of emoluments received by way of long-term incentive plans included in the year ended 26 January 2013 is calculated by
reference to the number of options awarded under the 2009 VCP at the share price on the date the options first became exercisable.
Annual Bonus (Audited)For the financial year ended January 2014, 90% of the maximum potential bonus pool was achieved.
Actual Performance Against Performance Targets (Audited)
Performance – Related Bonus
KPI Target Actual % Max achieved
R S Kelvin L D Page
Max £’000 Actual £’000 Max £’000 Actual £’000
Profit target 44.3m 43.9m 90% 366 329 339 306
The profit target is arrived at after adjusting profit before tax for exceptional/non-recurring items and annual bonus as explained earlier in the Directors’ Remuneration Policy.
Long-Term Incentive Schemes (Audited)Equity based incentives were historically approached through the 2009 Value Creation Plan (“VCP”). Under this plan, an award of units was made which had no value at grant, but subject to satisfaction of earnings per share, share price and total shareholder return performance targets, converted into nil-cost options to acquire ordinary shares in the Company at the end of the performance period. The performance conditions were chosen to support the delivery of sustainable value to shareholders. Awards under the VCP vested in full at the end of the three year performance period on 12 August 2012. The options granted under the VCP were exercisable 50% in October 2012 and the remaining 50% in October 2013. The full amount in respect of these awards has been included in the 2013 remuneration figures.
Long-Term Incentive Plans
Awards under the Ted Baker Plc Long-Term Incentive Plan 2013 (Audited)On 3 July 2013, the Committee awarded options over 220,226 ordinary shares in Ted Baker Plc under the Ted Baker Plc Long-Term Incentive Plan 2013 to the Executive Directors and other members of senior management, subject to a three year performance period ending 30 January 2016 and a 3 year award period ending 2 July 2016.
Awards granted to Executive Directors under the Ted Baker Plc Long-Term Incentive Plan 2013 were as follows:
Type of interest
No. of shares
Basis of award
Face value £’000
% vesting at threshold
Performance period
R S Kelvin LTIP 2013 share awards
32,106 150% of salary
549 25% 3 year period ending 2 July 2016
L D Page LTIP 2013 share awards
29,779 150% of salary
509 25% 3 year period ending 2 July 2016
LTIP awards granted in respect of Mr R S Kelvin and Mr L D Page represent 28% of the total number of LTIP awards granted during the year. The balance included other senior executives across the Group. Face value has been calculated by multiplying the maximum number of share awards that may vest by the share price used for purposes of the grant.
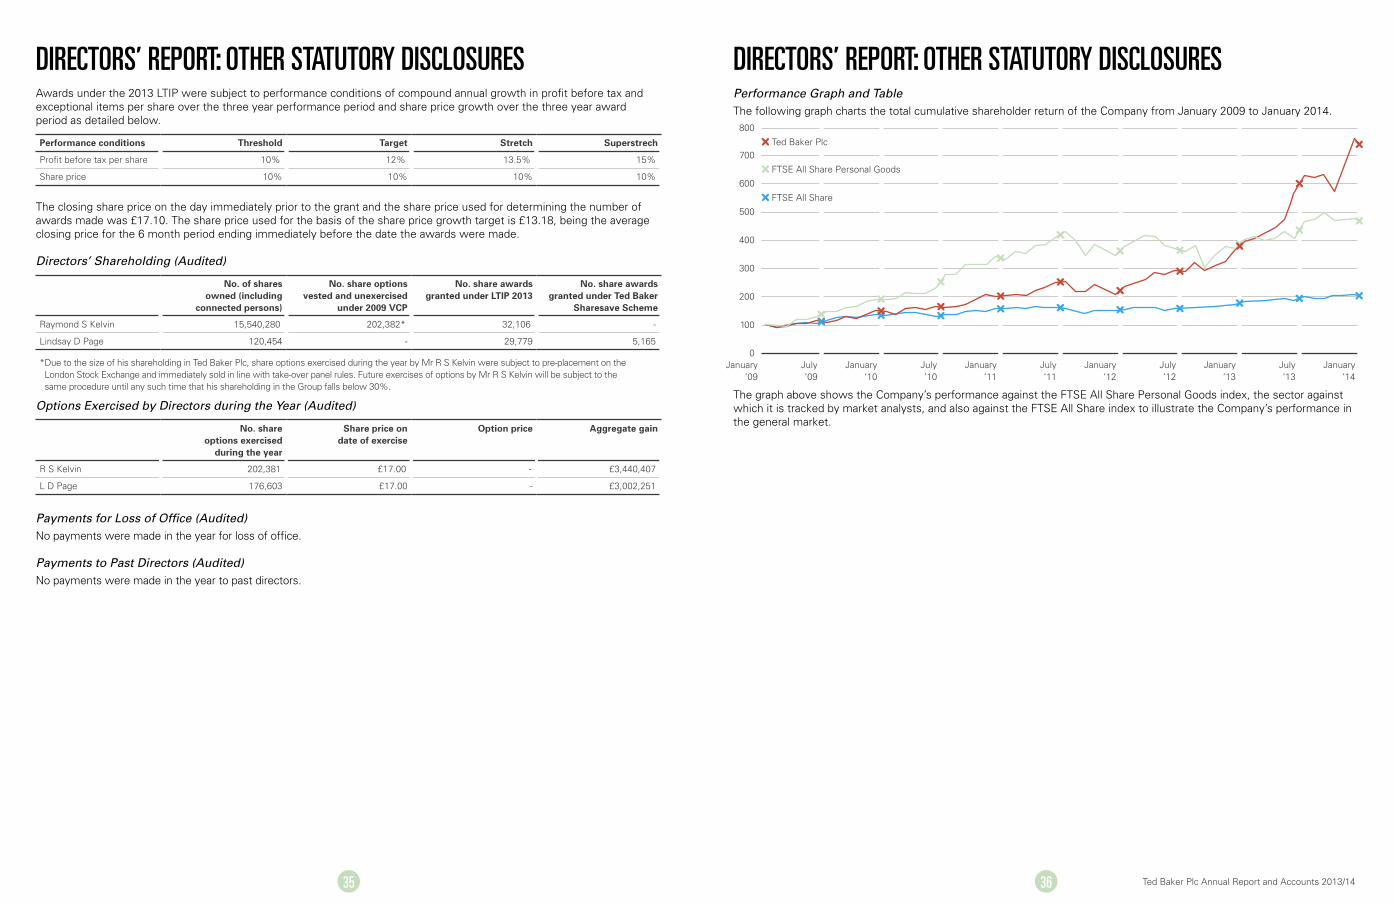
800
500
700
400
600
300
200
100
0
Ted Baker Plc
FTSE All Share Personal Goods
FTSE All Share
January ‘09
January ‘10
January ‘11
January ‘12
January ‘13
January ‘14
July ‘09
July ‘10
July ‘11
July ‘12
July ‘13
35 36 Ted Baker Plc Annual Report and Accounts 2013/14
Awards under the 2013 LTIP were subject to performance conditions of compound annual growth in profit before tax and exceptional items per share over the three year performance period and share price growth over the three year award period as detailed below.
Performance conditions Threshold Target Stretch Superstrech
Profit before tax per share 10% 12% 13.5% 15%
Share price 10% 10% 10% 10%
The closing share price on the day immediately prior to the grant and the share price used for determining the number of awards made was £17.10. The share price used for the basis of the share price growth target is £13.18, being the average closing price for the 6 month period ending immediately before the date the awards were made.
Directors’ Shareholding (Audited)
No. of shares owned (including
connected persons)
No. share options vested and unexercised
under 2009 VCP
No. share awards granted under LTIP 2013
No. share awards granted under Ted Baker
Sharesave Scheme
Raymond S Kelvin 15,540,280 202,382* 32,106 -
Lindsay D Page 120,454 - 29,779 5,165
* Due to the size of his shareholding in Ted Baker Plc, share options exercised during the year by Mr R S Kelvin were subject to pre-placement on the London Stock Exchange and immediately sold in line with take-over panel rules. Future exercises of options by Mr R S Kelvin will be subject to the same procedure until any such time that his shareholding in the Group falls below 30%.
Options Exercised by Directors during the Year (Audited)
No. share options exercised
during the year
Share price on date of exercise
Option price Aggregate gain
R S Kelvin 202,381 £17.00 - £3,440,407
L D Page 176,603 £17.00 - £3,002,251
Payments for Loss of Office (Audited) No payments were made in the year for loss of office.
Payments to Past Directors (Audited) No payments were made in the year to past directors.
DIRECTORS’ REPORT: OTHER STATUTORy DISCLOSURESDIRECTORS’ REPORT: OTHER STATUTORy DISCLOSURESPerformance Graph and TableThe following graph charts the total cumulative shareholder return of the Company from January 2009 to January 2014.
The graph above shows the Company’s performance against the FTSE All Share Personal Goods index, the sector against which it is tracked by market analysts, and also against the FTSE All Share index to illustrate the Company’s performance in the general market.
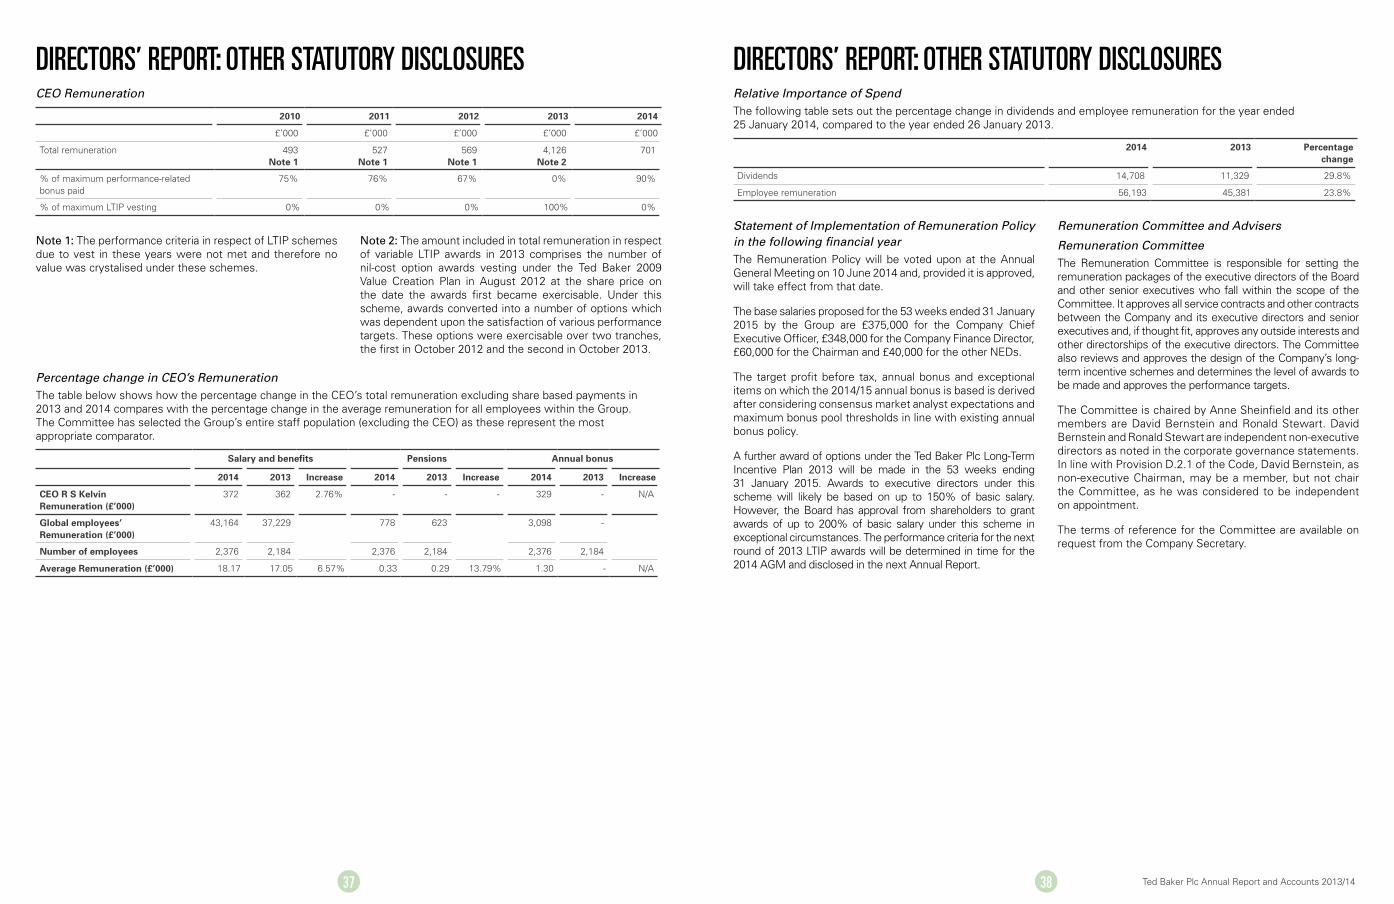
37 38 Ted Baker Plc Annual Report and Accounts 2013/14
CEO Remuneration
2010 2011 2012 2013 2014
£’000 £’000 £’000 £’000 £’000
Total remuneration 493 Note 1
527 Note 1
569 Note 1
4,126 Note 2
701
% of maximum performance-related bonus paid
75% 76% 67% 0% 90%
% of maximum LTIP vesting 0% 0% 0% 100% 0%
note 1: The performance criteria in respect of LTIP schemes due to vest in these years were not met and therefore no value was crystalised under these schemes.
note 2: The amount included in total remuneration in respect of variable LTIP awards in 2013 comprises the number of nil-cost option awards vesting under the Ted Baker 2009 Value Creation Plan in August 2012 at the share price on the date the awards first became exercisable. Under this scheme, awards converted into a number of options which was dependent upon the satisfaction of various performance targets. These options were exercisable over two tranches, the first in October 2012 and the second in October 2013.
Percentage change in CEO’s RemunerationThe table below shows how the percentage change in the CEO’s total remuneration excluding share based payments in 2013 and 2014 compares with the percentage change in the average remuneration for all employees within the Group. The Committee has selected the Group’s entire staff population (excluding the CEO) as these represent the most appropriate comparator.
Salary and benefits Pensions Annual bonus
2014 2013 Increase 2014 2013 Increase 2014 2013 Increase
CEO R S Kelvin Remuneration (£’000)
372 362 2.76% - - - 329 - N/A
Global employees’ Remuneration (£’000)
43,164 37,229 778 623 3,098 -
Number of employees 2,376 2,184 2,376 2,184 2,376 2,184
Average Remuneration (£’000) 18.17 17.05 6.57% 0.33 0.29 13.79% 1.30 - N/A
Statement of Implementation of Remuneration Policy in the following financial yearThe Remuneration Policy will be voted upon at the Annual General Meeting on 10 June 2014 and, provided it is approved, will take effect from that date.
The base salaries proposed for the 53 weeks ended 31 January 2015 by the Group are £375,000 for the Company Chief Executive Officer, £348,000 for the Company Finance Director, £60,000 for the Chairman and £40,000 for the other NEDs.
The target profit before tax, annual bonus and exceptional items on which the 2014/15 annual bonus is based is derived after considering consensus market analyst expectations and maximum bonus pool thresholds in line with existing annual bonus policy.
A further award of options under the Ted Baker Plc Long-Term Incentive Plan 2013 will be made in the 53 weeks ending 31 January 2015. Awards to executive directors under this scheme will likely be based on up to 150% of basic salary. However, the Board has approval from shareholders to grant awards of up to 200% of basic salary under this scheme in exceptional circumstances. The performance criteria for the next round of 2013 LTIP awards will be determined in time for the 2014 AGM and disclosed in the next Annual Report.
Remuneration Committee and Advisers
Remuneration CommitteeThe Remuneration Committee is responsible for setting the remuneration packages of the executive directors of the Board and other senior executives who fall within the scope of the Committee. It approves all service contracts and other contracts between the Company and its executive directors and senior executives and, if thought fit, approves any outside interests and other directorships of the executive directors. The Committee also reviews and approves the design of the Company’s long-term incentive schemes and determines the level of awards to be made and approves the performance targets.
The Committee is chaired by Anne Sheinfield and its other members are David Bernstein and Ronald Stewart. David Bernstein and Ronald Stewart are independent non-executive directors as noted in the corporate governance statements. In line with Provision D.2.1 of the Code, David Bernstein, as non-executive Chairman, may be a member, but not chair the Committee, as he was considered to be independent on appointment.
The terms of reference for the Committee are available on request from the Company Secretary.
DIRECTORS’ REPORT: OTHER STATUTORy DISCLOSURESDIRECTORS’ REPORT: OTHER STATUTORy DISCLOSURESRelative Importance of SpendThe following table sets out the percentage change in dividends and employee remuneration for the year ended 25 January 2014, compared to the year ended 26 January 2013.
2014 2013 Percentage change
Dividends 14,708 11,329 29.8%
Employee remuneration 56,193 45,381 23.8%

39 40 Ted Baker Plc Annual Report and Accounts 2013/14
AdvisersDuring the period, the Committee was assisted in its work by Jones Day and PricewaterhouseCoopers LLP (“PwC”), both of whom were appointed by the Company in consultation with the Committee. PwC is retained by the Committee as its independent executive remuneration advisers. The Committee assesses advice provided by PwC and Jones Day from time to time to consider whether it is independent. Comfort is obtained from PwC’s adherence to the Remuneration Consultants Groups Code of Conduct.
Adviser Appointed by Service provided to the Committee
Fees Other services provided to the Company
PricewaterhouseCoopers LLP
Company Advice on share scheme design and implementation.
Attendance at Remuneration Committee meetings.
Review of Directors’ Remuneration Report.
£73,550 Tax, legal and accounting services to the Group.
Jones Day Company Advice on share schemes. £8,600 General legal advice.
Statement of voting at General MeetingAt the last Annual General Meeting, votes on the remuneration report were cast as follows.
For %
Number
Against %
Number
Withheld %
Number
Reasons for votes against,
if applicable
Action taken by Committee
Approval of the 2013 Remuneration Report
99.02%
36,878,966
0.24%
88,964
0.74%
276,561
The number of votes against the
Remuneration Report was not
considered to be significant.
N/A
Approval of Ted Baker Plc Long-Term Incentive Plan 2013
94.40%
35,155,981
5.58%
2,078,085
0.02%
6,514
The number of votes against
the LTIP was not considered to be
significant.
N/A
The disclosure in the 2015 remuneration report will include details of the binding shareholder vote on directors’ remuneration policy.
The Directors’ Remuneration Report was approved on behalf of the Board on 26 February 2014 and signed on its behalf by:
anne sheinfield Chairman of the Remuneration Committee
oTher DisclosuresThe directors present their annual report on the affairs of the Group, together with the accounts and Auditors’ Report, for the 52 weeks ended 25 January 2014. The comparative period is for the 52 weeks ended 26 January 2013.
Principal ActivitiesTed Baker is a leading designer brand and the principal activities of the Group comprise the design, wholesale and retail of menswear, womenswear and related accessories. The subsidiary undertakings principally affecting the profits and net assets of the Group in the period are listed in Note 12 to the accounts. The Group also has branches operating in Eire and Portugal.
Business Review and Future ProspectsA commentary on the Group’s progress during the period and its future prospects are set out in the Chairman’s Statement and Business Review on pages 4 to 9.
The contents of this Directors’ Report together with:
• the Chairman’s Statement on pages 4 to 5;
• the Business Review on pages 7 to 9;
• the Principal Risks and Uncertainties on pages 11 to 12;
• the Sustainability and the Environment report on page 20 to 22; and
• the People report on page 23 constitute the Business Review and are incorporated into this report by reference.
Results and DividendsThe audited accounts for the 52 weeks ended 25 January 2014 are set out on pages 47 to 82. The Group profit for the 52 weeks, after taxation, was £28,852,000 (2013: £21,597,000). The directors recommend a final dividend of 24.2p per ordinary share (2013: 18.7p) payable on 20 June 2014 to ordinary shareholders on the register on 9 May 2014 which, together with the interim dividend of 9.5p per share (2013: 7.9p per share) paid on 22 November 2013, makes a total of 33.7p per share for the period (2013: 26.6p per share).
DirectorsThe directors during the financial year were those listed on page 25. Details of the directors’ beneficial interests in the shares of the Company are shown on page 35. Details of their options are given in the Directors’ Remuneration Report on page 35. Brief details of the career of each director are set out on page 25.
Substantial ShareholdingsOn 21 March 2013, the Company had been notified, in accordance with the Disclosure Rules and Transparency Rules (DTR5), of substantial interests in the ordinary share capital of the Company. For details see the table below.
Name of holder Number % held
R S Kelvin 15,540,280 35.60
Capital Research and Management 3,440,155 7.79
Standard Life Investments 2,994,204 6.86
BlackRock 2,639,710 6.05
DIRECTORS’ REPORT: OTHER STATUTORy DISCLOSURESDIRECTORS’ REPORT: OTHER STATUTORy DISCLOSURES

41 42 Ted Baker Plc Annual Report and Accounts 2013/14
Risk ManagementThe Company’s policies on currency and interest rate risk are outlined in Note 22 of the Financial Statements on pages 75 to 81.
Directors’ Statement Regarding Disclosure of Information to AuditorsThe directors who held office at the date of approval of this Directors’ Report confirm that, so far as they are aware, there is no relevant audit information of which the Company’s auditors are unaware. Further, each director has taken all the steps that he ought to have taken as a director to ensure the Board is aware of any relevant audit information and to establish that the Company’s auditors are aware of any such information.
AuditorsKPMG have expressed their willingness to continue in office as auditors. The Audit Committee has recommended to the Board that KPMG LLP be appointed as the Company’s external auditors for 2014/15. KPMG Audit Plc (a fellow KPMG Group company) has instigated an orderly wind-down of business.
The report was approved by the Board of Directors on 20 March 2014 and signed on its behalf by:
c F anderson Secretary
Registered office - The Ugly Brown Building 6a St Pancras Way, London NW1 0TB
Directors’ InterestsThe directors who held office at 25 January 2014 had interests in the shares of Ted Baker Plc as shown in the table below.
% of share capital
25 January 2014 Beneficial
26 January 2013 Beneficial
R S Kelvin 35.6 15,540,280 16,537,899
L D Page 0.3 120,454 43,851
R Stewart - 313 300
Share Capital and ControlAs at 25 January 2014, the Company’s authorised share capital was 80,000,000 ordinary shares of 5p each (in nominal value). Details of the Company’s share capital are shown in Note 19 to the consolidated Financial Statements on page 71. On 25 January 2014 there were 43,880,588 ordinary shares in issue of which the Company holds 231,495 ordinary shares in treasury. The rights and obligations attaching to the Company’s shares, in addition to those conferred on their holders by law, are set out in the Articles of Association. The holders of ordinary shares are entitled to receive all shareholder documents, attend and speak at general meetings of the Company, exercise all voting rights and to receive dividends and participate in other distributions of assets. The Company may not exercise any rights (such as voting rights) in respect of the treasury shares and the treasury shares carry no right to receive dividends or other distributions of assets. The Company is not aware of any agreements between shareholders restricting the voting rights or the right to transfer shares in the Company.
The rules about the appointment and replacement of directors are contained in the Company’s Articles of Association.
Changes to the Articles of Association must be approved by the shareholders in accordance with the legislation in force from time to time. The powers of the directors are determined by legislation and the Articles of Association of the Company in force from time to time. Powers relating to the issuing and buying back of shares are included in the Company’s Articles of Association and shareholder approval of such authorities may be sought, if considered appropriate by directors, at the Annual General Meeting.
There are a number of agreements that take effect, alter or terminate upon a change of control of the Company following a takeover bid, such as commercial contracts, bank loan agreements and employee share schemes. None of these is deemed to be significant in terms of its potential impact on the business of the Company.
The Company does not have agreements with any director or employee that would provide compensation for loss of office or employment resulting from a takeover, save that the Company’s share schemes contain provisions which may cause options and awards granted to employees to vest on a takeover.
Going ConcernThe directors have reviewed the Group’s budgets and long-term projections. After making enquiries, the directors have a reasonable expectation that the Company and the Group have adequate resources to continue in operational existence for the foreseeable future. For this reason, they continue to adopt the going concern basis in preparing the Financial Statements.
Creditor Payment PolicyThe Company’s policy, in relation to all of its suppliers, is to settle the terms of payment when agreeing the terms of the transaction and to abide by those terms provided that it is satisfied that the supplier has provided the goods or services in accordance with the agreed terms and conditions. The Company does not follow any code or statement on payment practice. The number of days’ purchases outstanding for payment by the Group at the end of the year was 35 days (2013: 44 days). At the year end the Company had no trade creditors.
DonationsThe value of charitable donations made during the period was £30,072 (2013: £30,266).
Social ResponsibilityDetails of the Group’s social, ethical and environmental responsibility initiatives are set out in the Sustainability and the Environment report on pages 20 to 22.
PeopleDetails of the Group’s policies with respect to people and employees are set out in the People report on page 23.
Health and SafetyThe Group remains committed to providing a safe place to work and shop for all employees and customers. Annual risk assessments are carried out at all locations and a committee, comprised of representatives within the business and an external adviser, reviews and resolves any health and safety issues.
DIRECTORS’ REPORT: OTHER STATUTORy DISCLOSURESDIRECTORS’ REPORT: OTHER STATUTORy DISCLOSURES

43 44 Ted Baker Plc Annual Report and Accounts 2013/14
sTaTeMenT oF DirecTors’ resPonsiBiliTies in resPecT oF The annual rePorT anD The Financial sTaTeMenTsThe directors are responsible for preparing the Annual Report and the Group and Parent company Financial Statements in accordance with applicable law and regulations.
Company law requires the directors to prepare Group and Parent company Financial Statements for each financial year. Under that law they are required to prepare the Group Financial Statements in accordance with IFRSs as adopted by the EU and applicable law and have elected to prepare the parent company Financial Statements on the same basis.
Under company law the directors must not approve the Financial Statements unless they are satisfied that they give a true and fair view of the state of affairs of the Group and Parent company and of their profit or loss for that period. In preparing each of the Group and parent company Financial Statements, the directors are required to:
• select suitable accounting policies and then apply them consistently;
• make judgements and estimates that are reasonable and prudent;
• state whether they have been prepared in accordance with IFRSs as adopted by the EU; and
• prepare the Financial Statements on the going concern basis unless it is inappropriate to presume that the Group and the Parent company will continue in business.
The directors are responsible for keeping adequate accounting records that are sufficient to show and explain the parent company’s transactions and disclose with reasonable accuracy at any time the financial position of the parent company and enable them to ensure that its Financial Statements comply with the Companies Act 2006. They have general responsibility for taking such steps as are reasonably open to them to safeguard the assets of the Group and to prevent and detect fraud and other irregularities.
Under applicable law and regulations, the directors are also responsible for preparing a Strategic Report, Directors’ Report, Directors’ Remuneration Report and Corporate Governance Statement that complies with that law and those regulations.
The directors are responsible for the maintenance and integrity of the corporate and financial information included on the company’s website. Legislation in the UK governing the preparation and dissemination of Financial Statements may differ from legislation in other jurisdictions.
Each of the persons who is a director at the date of approval of this report confirms that to the best of his or her knowledge:
• each of the Group and Parent company Financial Statements, prepared in accordance with IFRS gives a true and fair view of the assets, liabilities, financial position and profit or loss of the issuer and the undertakings included in the consolidation taken as a whole; and
• the management report on pages 7 to 12 includes a fair review of the development and performance of the business and the position of the company and the undertakings included in the consolidation taken as a whole, together with a description of the principal risks and uncertainties that they face.
In addition, all directors consider that the Annual Report, taken as a whole, is fair, balanced and understandable and provides the information necessary for shareholders to assess the company’s performance, business model and strategy.
On behalf of the Board
r s kelvin l D Page Chief Executive Finance Director
20 March 2014 20 March 2014
INDEPENDENT AUDITORS’ REPORT TO THE MEMbERS OF TED bAkER PLC ONLyDIRECTORS’ REPORT: OTHER STATUTORy DISCLOSURESoPinions anD conclusions arisinG FroM our auDiT
1. Our opinion on the Financial Statements is unmodified We have audited the Financial Statements of Ted Baker Plc for the 52 weeks ended 25 January 2014 set out on pages 47 to 82. In our opinion:
• the Financial Statements give a true and fair view of the state of the Group’s and of the Parent company’s affairs as at 25 January 2014 and of the Group’s profit for the year then ended;
• the Group Financial Statements have been properly prepared in accordance with International Financial Reporting Standards as adopted by the European Union (IFRSs as adopted by the EU);
• the Parent company Financial Statements have been properly prepared in accordance with IFRSs as adopted by the EU and as applied in accordance with the provisions of the Companies Act 2006; and
• the Financial Statements have been prepared in accordance with the requirements of the Companies Act 2006 and, as regards the Group Financial Statements, Article 4 of the IAS Regulation.
2. Our assessment of risks of material misstatementIn arriving at our audit opinion above on the Financial Statements the risks of material misstatement that had the greatest effect on our Group audit were as follows:
Valuation of inventory Refer to page 15 (Audit Committee statement), page 57 (accounting policy note) and page 69 (financial disclosures).
The risk: Inventory is carried in the Financial Statements at the lower of cost and net realisable value. Sales in the fashion industry can be extremely volatile with consumer demand changing significantly based on current trends. As a result there is a risk that the carrying value of inventory exceeds its net realisable value.
our response: Our audit procedures included, among others, challenging the adequacy of the Group’s provisions against inventory by seasonal collection which we corroborated on a sample basis by testing that items on the stock ageing listing by season were classified in the appropriate ageing bracket. We assessed the appropriateness of the provision percentages applied to each season and challenged the assumptions made by the Directors on the extent to which old inventory can be sold through various channels. We considered the historical accuracy of provisioning and used the information obtained as evidence for evaluating the appropriateness of the assumptions made in the current year including how these compare to the experience in previous years. We have also considered the adequacy of the Group’s disclosures in respect of the levels of provisions against inventory.
Valuation of retail fixed assets Refer to page 15 (Audit Committee statement), page 57 (accounting policy note) and page 66 (financial disclosures).
The risk: The Group has invested a significant amount of capital outside the UK in its retail store portfolio. Given the relative immaturity of the brand outside the UK, the payback period is typically longer than for UK stores and it is not uncommon for new stores in overseas territories - as is anticipated in the original business case - to make losses in their start up phase. The level of judgment involved in assessing impairment indicators on recently opened retail stores in foreign markets is one of the key judgemental areas that our audit is concentrated on.
our response: Our audit procedures included, among others, challenging the Directors on the evidence on which they based their assessment as to when an impairment indicator exists for loss making stores and therefore a need for impairment testing arises. This included comparing the performance of retail stores to the original business case, comparing relative performance of stores within each region and considering whether the Directors’ assessment was in line with our overall understanding of the maturity of the brand in each location. We have also considered the adequacy of the Group’s disclosures in respect of impairment of retail fixed assets.
Legal claim Refer to page 15 (Audit Committee statement), page 57 (accounting policy note) and page 82 (financial disclosures).
The risk: The Group is pursuing a claim against its previous insurers for loss of profit arising from the theft of inventory from its warehouse from 2004 to 2008. The level of judgment involved in determining the recognition and amount of any contingent asset arising from a successful outcome of the claim or any unrecognised contingent liability should the Group be unsuccessful in its claim is one of the key judgemental areas that our audit is concentrated on.
our response: Our audit procedures included, among others, challenging the Directors on the evidence on which they based their assessment of the outcome of the claim. We inspected the latest reports from forensic expert witnesses for both parties, inspected relevant correspondence from the courts. We also assessed the experience and professional standing of the Group’s external counsel.
We have also considered the adequacy of the Group’s disclosures in respect of the claim.
3. Our application of materiality and an overview of the scope of our auditThe materiality for the Group Financial Statements as a whole was set at £2.3 million. This has been determined with reference to a benchmark of Group profit before taxation, which we consider to be one of the principal considerations for members of the company in assessing the financial performance of the Group. Materiality represents 5.91% of Group profit before tax and 5.75% adjusted for exceptional items as disclosed on the face of the income statement.
45
We agreed with the Audit Committee to report to it all corrected and uncorrected misstatements we identified through our audit with a value in excess of £0.1 million impacting the income statement and £0.2 million for balance sheet reclassifications only, in addition to other audit misstatements below that threshold that we believe warranted reporting on qualitative grounds.
Audits for Group reporting purposes were performed by the Group audit team in the UK and specified audit procedures were performed by component auditors in the USA. In addition the Group audit team undertook a review of the financial information of the Components in Japan, China, France, Germany, South Korea, Belgium, Spain, Portugal, the Netherlands and Ireland. These Group procedures covered 98.3% of total Group revenue; 98.9% of the total profits and losses that made up Group profit before taxation; and 99.7% of total Group assets.
The audit undertaken for Group reporting purposes at the key reporting components of the company (the USA and the UK) were performed to materiality levels set by, or agreed with, the Group audit team. Materiality levels were set individually for each component and agreed with the Group audit team and ranged from £1.0 million to £2.0 million.
Detailed audit instructions were sent to component auditors in the USA. These instructions covered the significant audit areas that should be covered by these audits (which included the relevant risks of material misstatement detailed above) and set out the information required to be reported back to the Group audit team. The Group audit team held telephone meetings with the auditors in the USA.
4. Our opinion on other matters prescribed by the Companies Act 2006 is unmodified
In our opinion:
• the part of the Directors’ Remuneration Report to be audited has been properly prepared in accordance with the Companies Act 2006; and
• the information given in the Strategic Report and Directors’ Report for the financial year for which the Financial Statements are prepared is consistent with the Financial Statements.
5. We have nothing to report in respect of the matters on which we are required to report by exception Under ISAs (UK and Ireland) we are required to report to you if, based on the knowledge we acquired during our audit, we have identified other information in the annual report that contains a material inconsistency with either that knowledge or the Financial Statements, a material misstatement of fact, or that is otherwise misleading.
In particular, we are required to report to you if:
• we have identified material inconsistencies between the knowledge we acquired during our audit and the directors’ statement that they consider that the annual report and Financial Statements taken as a whole is fair, balanced and understandable and provides the information necessary for shareholders to assess the Group’s performance, business model and strategy; or
• the Corporate Governance section of the annual report describing the work of the Group Audit and Risk Committee does not appropriately address matters communicated by us to the Audit and Risk Committee.
Under the Companies Act 2006 we are required to report to you if, in our opinion:
• adequate accounting records have not been kept by the parent company, or returns adequate for our audit have not been received from branches not visited by us; or
• the parent company Financial Statements and the part of the Directors’ Remuneration Report to be audited are not in agreement with the accounting records and returns; or
• certain disclosures of directors’ remuneration specified by law are not made; or
• we have not received all the information and explanations we require for our audit.
Under the Listing Rules we are required to review:
• the directors’ statement, set out on page 43, in relation to going concern;
• the part of the Corporate Governance Statement on page 13 relating to the company’s compliance with the nine provisions of the 2010 UK Corporate Governance Code specified for our review.
We have nothing to report in respect of the above responsibilities.
Scope of report and responsibilitiesAs explained more fully in the Directors’ Responsibilities Statement set out on page 43, the directors are responsible for the preparation of the Financial Statements and for being satisfied that they give a true and fair view. A description of the scope of an audit of Financial Statements is provided on the Financial Reporting Council’s website at www.frc.org.uk/auditscopeukprivate. This report is made solely to the company’s members as a body and is subject to important explanations and disclaimers regarding our responsibilities, published on our website at www.kpmg.com/uk/auditscopeukco2013a which are incorporated into this report as if set out in full and should be read to provide an understanding of the purpose of this report, the work we have undertaken and the basis of our opinions.
Mike Barradell (Senior Statutory Auditor) for and on behalf of KPMG Audit Plc, Statutory Auditor Chartered Accountants, 15 Canada Square, London, E14 5GL
20 March 2014
INDEPENDENT AUDITORS’ REPORT TO THE MEMbERS OF TED bAkER PLC ONLy

47 48 Ted Baker Plc Annual Report and Accounts 2013/14
Group Statement of Changes in Equity
For the 52 weeks ended 25 January 2014 Share capital
Share premium
Cash flow
hedging reserve
Translation reserve
Retained earnings
Total equity attributable to
equity shareholders of the parent
£’000 £’000 £’000 £’000 £’000 £’000
Balance at 26 January 2013 2,160 9,137 91 296 87,209 98,893
Comprehensive income for the period
Profit for the period - - - - 28,852 28,852
Exchange differences on translation of foreign operations - - - (4,391) - (4,391)
Current tax on foreign currency translation - - - 1,115 - 1,115
Effective portion of changes in fair value of cash flow hedges - - (2,976) - - (2,976)
Net change in fair value of cash flow hedges transferred to profit or loss - - 545 - - 545
Deferred tax associated with movement in hedging reserve - - 490 - - 490
Total comprehensive income for the period - - (1,941) (3,276) 28,852 23,635
Transactions with owners recorded directly in equity
Increase in issued share capital 34 2 - - (34) 2
Share based payments charges - - - - 606 606
Movement on current and deferred tax on share based payments - - - - 967 967
Disposal of own/treasury shares - - - - 71 71
Dividends paid - - - - (12,110) (12,110)
Total transactions with owners 34 2 - - (10,500) (10,464)
Balance at 25 January 2014 2,194 9,139 (1,850) (2,980) 105,561 112,064
Group Income Statement
For the 52 weeks ended 25 January 2014 Note 52 weeks ended 25 January 2014
52 weeks ended 26 January 2013
£’000 £’000
Revenue 2 321,921 254,466
Cost of sales (123,451) (95,740)
Gross profit 198,470 158,726
Distribution costs (123,211) (101,357)
Administrative expenses (43,381) (32,984)
Exceptional costs 3 (1,046) (2,614)
Licence income 8,888 7,509
Other operating (expense) / income (132) 234
Operating profit 39,588 29,514
Finance income 4 316 34
Finance expenses 4 (1,312) (824)
Share of profit of jointly controlled entity, net of tax 12 331 198
Profit before tax 3,6 38,923 28,922
Income tax expense 6 (10,071) (7,325)
Profit for the period 28,852 21,597
Earnings per share 9 - -
Basic 67.2 51.5
Diluted 66.3 49.9
Group Statement of Comprehensive Income
For the 52 weeks ended 25 January 2014 52 weeks ended 25 January 2014
52 weeks ended 26 January 2013
£‘000 £‘000
Profit for the period 28,852 21,597
Other comprehensive income
Items that may be reclassified to the Income Statement
Net effective portion of changes in fair value of cash flow hedges (2,486) (320)
Net change in fair value of cash flow hedges transferred to profit or loss 545 723
Exchange differences on translation of foreign operations net of tax (3,276) 152
Other comprehensive income for the period (5,217) 555
Total comprehensive income for the period 23,635 22,152
GROUP AND COMPANy PRIMARy FINANCIAL STATEMENTS GROUP AND COMPANy PRIMARy FINANCIAL STATEMENTS
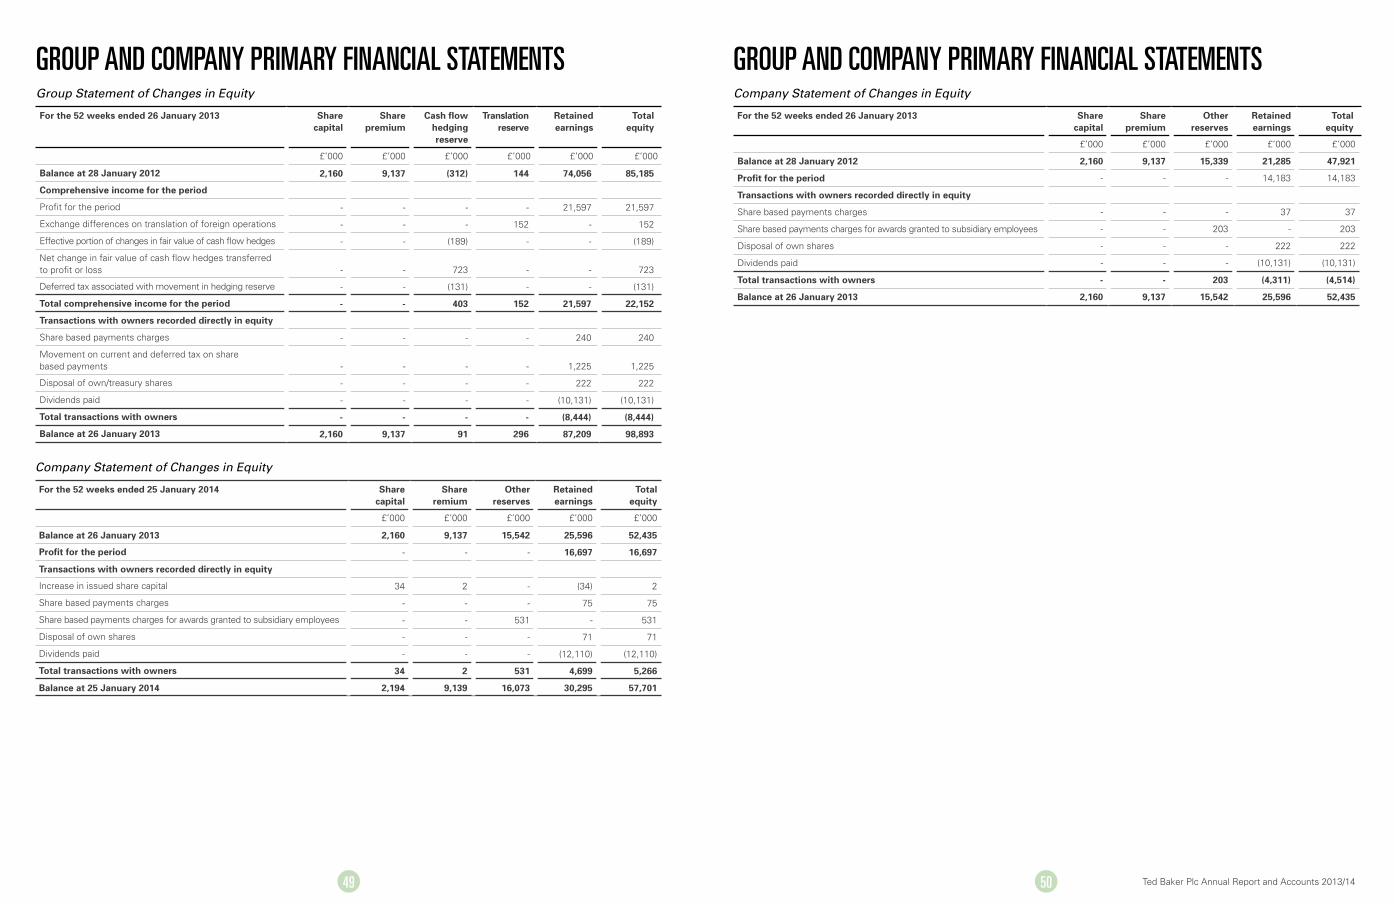
49 50 Ted Baker Plc Annual Report and Accounts 2013/14
GROUP AND COMPANy PRIMARy FINANCIAL STATEMENTS GROUP AND COMPANy PRIMARy FINANCIAL STATEMENTSGroup Statement of Changes in Equity
For the 52 weeks ended 26 January 2013 Share capital
Share premium
Cash flow hedging reserve
Translation reserve
Retained earnings
Total equity
£’000 £’000 £’000 £’000 £’000 £’000
Balance at 28 January 2012 2,160 9,137 (312) 144 74,056 85,185
Comprehensive income for the period
Profit for the period - - - - 21,597 21,597
Exchange differences on translation of foreign operations - - - 152 - 152
Effective portion of changes in fair value of cash flow hedges - - (189) - - (189)
Net change in fair value of cash flow hedges transferred to profit or loss - - 723 - - 723
Deferred tax associated with movement in hedging reserve - - (131) - - (131)
Total comprehensive income for the period - - 403 152 21,597 22,152
Transactions with owners recorded directly in equity
Share based payments charges - - - - 240 240
Movement on current and deferred tax on share based payments - - - - 1,225 1,225
Disposal of own/treasury shares - - - - 222 222
Dividends paid - - - - (10,131) (10,131)
Total transactions with owners - - - - (8,444) (8,444)
Balance at 26 January 2013 2,160 9,137 91 296 87,209 98,893
Company Statement of Changes in Equity
For the 52 weeks ended 25 January 2014 Share capital
Share remium
Other reserves
Retained earnings
Total equity
£’000 £’000 £’000 £’000 £’000
Balance at 26 January 2013 2,160 9,137 15,542 25,596 52,435
Profit for the period - - - 16,697 16,697
Transactions with owners recorded directly in equity
Increase in issued share capital 34 2 - (34) 2
Share based payments charges - - - 75 75
Share based payments charges for awards granted to subsidiary employees - - 531 - 531
Disposal of own shares - - - 71 71
Dividends paid - - - (12,110) (12,110)
Total transactions with owners 34 2 531 4,699 5,266
Balance at 25 January 2014 2,194 9,139 16,073 30,295 57,701
Company Statement of Changes in Equity
For the 52 weeks ended 26 January 2013 Share capital
Share premium
Other reserves
Retained earnings
Total equity
£’000 £’000 £’000 £’000 £’000
Balance at 28 January 2012 2,160 9,137 15,339 21,285 47,921
Profit for the period - - - 14,183 14,183
Transactions with owners recorded directly in equity
Share based payments charges - - - 37 37
Share based payments charges for awards granted to subsidiary employees - - 203 - 203
Disposal of own shares - - - 222 222
Dividends paid - - - (10,131) (10,131)
Total transactions with owners - - 203 (4,311) (4,514)
Balance at 26 January 2013 2,160 9,137 15,542 25,596 52,435
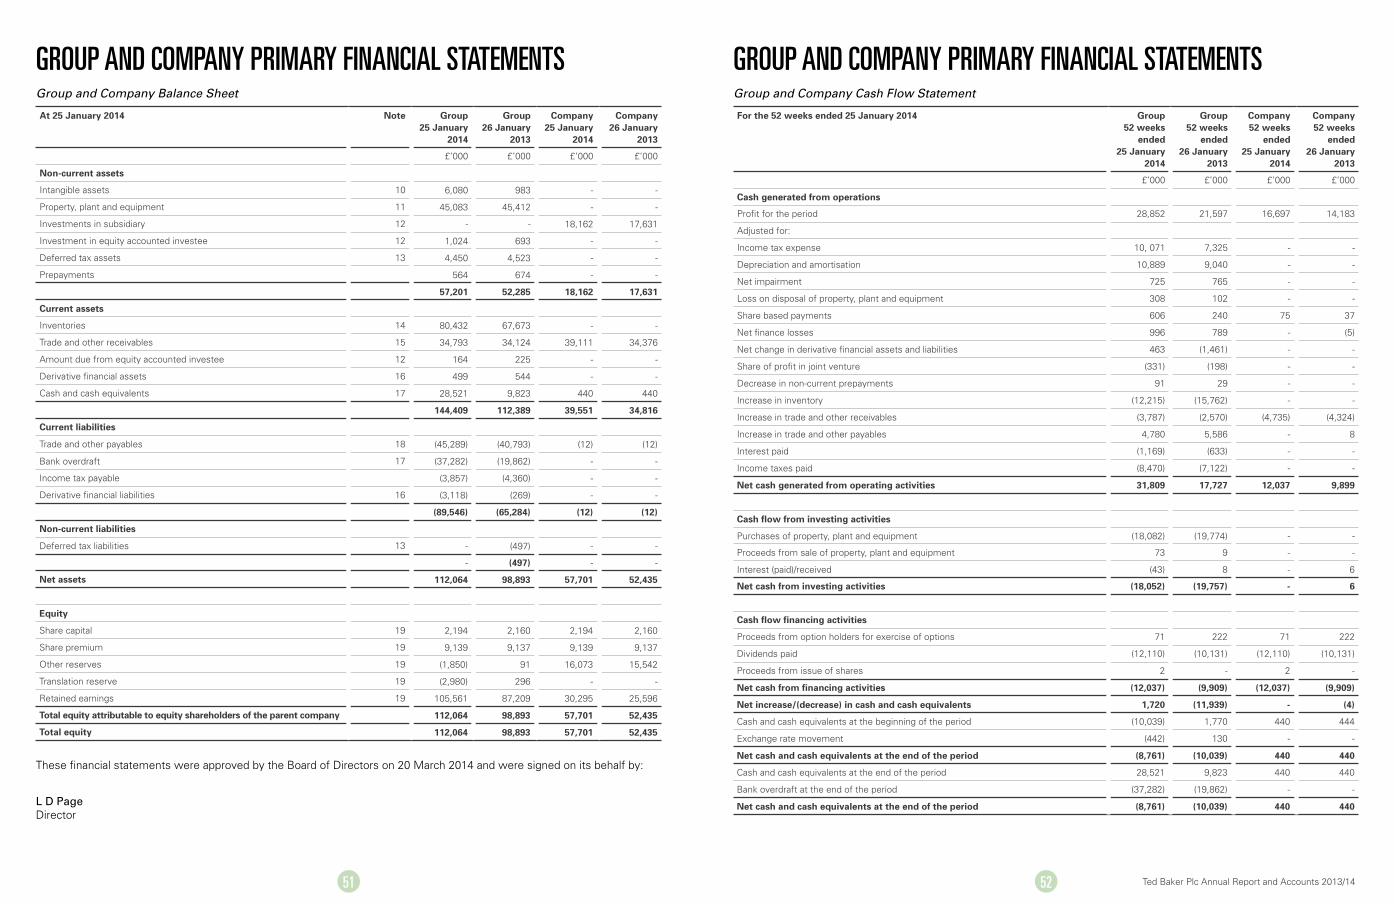
51 52 Ted Baker Plc Annual Report and Accounts 2013/14
Group and Company Balance Sheet
At 25 January 2014 Note Group 25 January
2014
Group 26 January
2013
Company 25 January
2014
Company 26 January
2013
£’000 £’000 £’000 £’000
Non-current assets
Intangible assets 10 6,080 983 - -
Property, plant and equipment 11 45,083 45,412 - -
Investments in subsidiary 12 - - 18,162 17,631
Investment in equity accounted investee 12 1,024 693 - -
Deferred tax assets 13 4,450 4,523 - -
Prepayments 564 674 - -
57,201 52,285 18,162 17,631
Current assets
Inventories 14 80,432 67,673 - -
Trade and other receivables 15 34,793 34,124 39,111 34,376
Amount due from equity accounted investee 12 164 225 - -
Derivative financial assets 16 499 544 - -
Cash and cash equivalents 17 28,521 9,823 440 440
144,409 112,389 39,551 34,816
Current liabilities
Trade and other payables 18 (45,289) (40,793) (12) (12)
Bank overdraft 17 (37,282) (19,862) - -
Income tax payable (3,857) (4,360) - -
Derivative financial liabilities 16 (3,118) (269) - -
(89,546) (65,284) (12) (12)
Non-current liabilities
Deferred tax liabilities 13 - (497) - -
- (497) - -
Net assets 112,064 98,893 57,701 52,435
Equity
Share capital 19 2,194 2,160 2,194 2,160
Share premium 19 9,139 9,137 9,139 9,137
Other reserves 19 (1,850) 91 16,073 15,542
Translation reserve 19 (2,980) 296 - -
Retained earnings 19 105,561 87,209 30,295 25,596
Total equity attributable to equity shareholders of the parent company 112,064 98,893 57,701 52,435
Total equity 112,064 98,893 57,701 52,435
Group and Company Cash Flow Statement
For the 52 weeks ended 25 January 2014 Group 52 weeks
ended 25 January
2014
Group 52 weeks
ended 26 January
2013
Company 52 weeks
ended 25 January
2014
Company 52 weeks
ended 26 January
2013
£’000 £’000 £’000 £’000
Cash generated from operations
Profit for the period 28,852 21,597 16,697 14,183
Adjusted for:
Income tax expense 10, 071 7,325 - -
Depreciation and amortisation 10,889 9,040 - -
Net impairment 725 765 - -
Loss on disposal of property, plant and equipment 308 102 - -
Share based payments 606 240 75 37
Net finance losses 996 789 - (5)
Net change in derivative financial assets and liabilities 463 (1,461) - -
Share of profit in joint venture (331) (198) - -
Decrease in non-current prepayments 91 29 - -
Increase in inventory (12,215) (15,762) - -
Increase in trade and other receivables (3,787) (2,570) (4,735) (4,324)
Increase in trade and other payables 4,780 5,586 - 8
Interest paid (1,169) (633) - -
Income taxes paid (8,470) (7,122) - -
Net cash generated from operating activities 31,809 17,727 12,037 9,899
Cash flow from investing activities
Purchases of property, plant and equipment (18,082) (19,774) - -
Proceeds from sale of property, plant and equipment 73 9 - -
Interest (paid)/received (43) 8 - 6
Net cash from investing activities (18,052) (19,757) - 6
Cash flow financing activities
Proceeds from option holders for exercise of options 71 222 71 222
Dividends paid (12,110) (10,131) (12,110) (10,131)
Proceeds from issue of shares 2 - 2 -
Net cash from financing activities (12,037) (9,909) (12,037) (9,909)
Net increase/(decrease) in cash and cash equivalents 1,720 (11,939) - (4)
Cash and cash equivalents at the beginning of the period (10,039) 1,770 440 444
Exchange rate movement (442) 130 - -
Net cash and cash equivalents at the end of the period (8,761) (10,039) 440 440
Cash and cash equivalents at the end of the period 28,521 9,823 440 440
Bank overdraft at the end of the period (37,282) (19,862) - -
Net cash and cash equivalents at the end of the period (8,761) (10,039) 440 440
These financial statements were approved by the Board of Directors on 20 March 2014 and were signed on its behalf by:
l D Page Director
GROUP AND COMPANy PRIMARy FINANCIAL STATEMENTS GROUP AND COMPANy PRIMARy FINANCIAL STATEMENTS
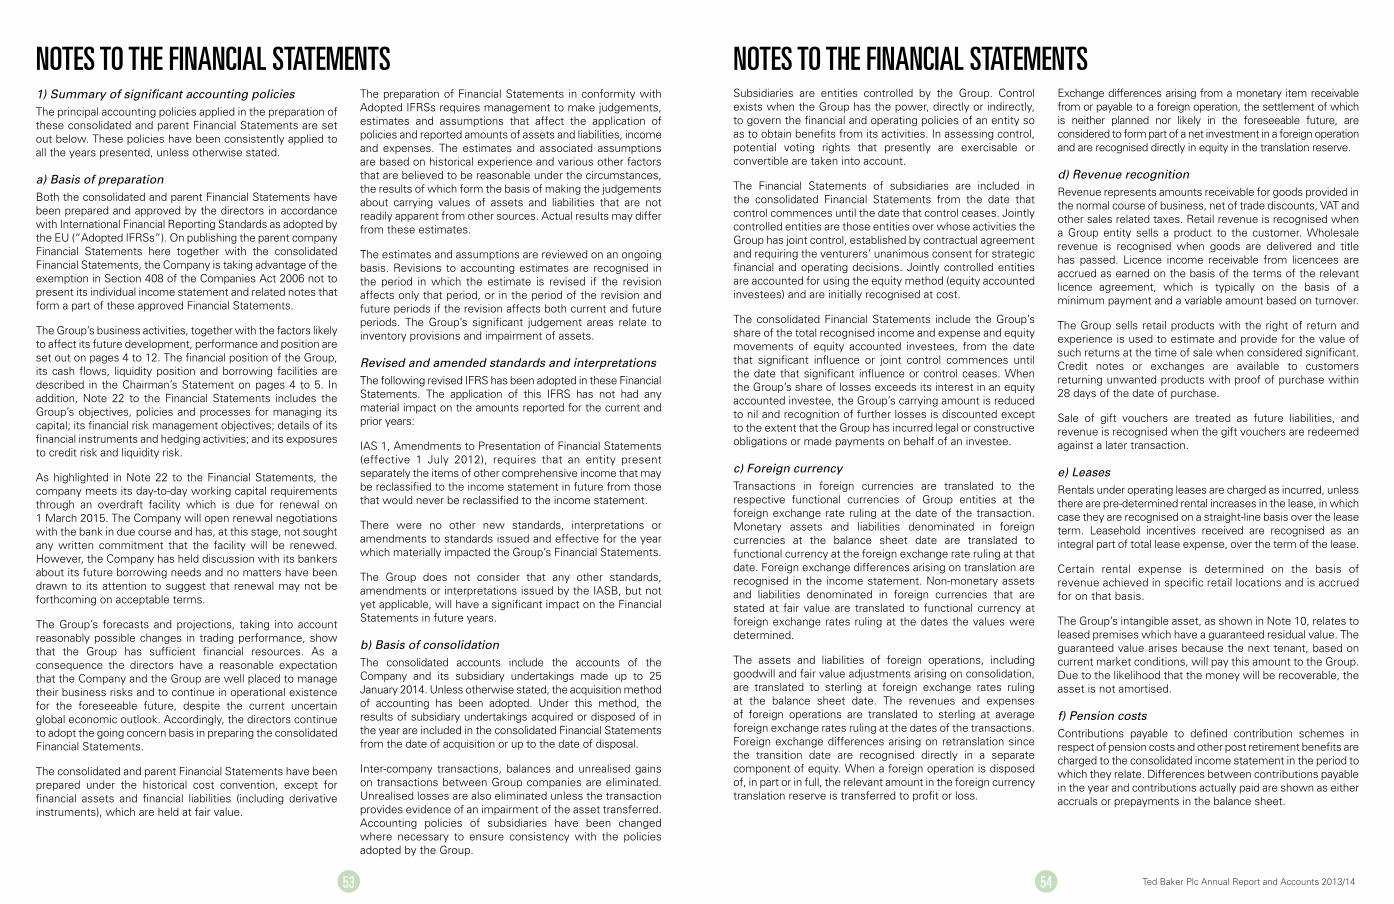
53 54 Ted Baker Plc Annual Report and Accounts 2013/14
Subsidiaries are entities controlled by the Group. Control exists when the Group has the power, directly or indirectly, to govern the financial and operating policies of an entity so as to obtain benefits from its activities. In assessing control, potential voting rights that presently are exercisable or convertible are taken into account.
The Financial Statements of subsidiaries are included in the consolidated Financial Statements from the date that control commences until the date that control ceases. Jointly controlled entities are those entities over whose activities the Group has joint control, established by contractual agreement and requiring the venturers’ unanimous consent for strategic financial and operating decisions. Jointly controlled entities are accounted for using the equity method (equity accounted investees) and are initially recognised at cost.
The consolidated Financial Statements include the Group’s share of the total recognised income and expense and equity movements of equity accounted investees, from the date that significant influence or joint control commences until the date that significant influence or control ceases. When the Group’s share of losses exceeds its interest in an equity accounted investee, the Group’s carrying amount is reduced to nil and recognition of further losses is discounted except to the extent that the Group has incurred legal or constructive obligations or made payments on behalf of an investee.
c) Foreign currencyTransactions in foreign currencies are translated to the respective functional currencies of Group entities at the foreign exchange rate ruling at the date of the transaction. Monetary assets and liabilities denominated in foreign currencies at the balance sheet date are translated to functional currency at the foreign exchange rate ruling at that date. Foreign exchange differences arising on translation are recognised in the income statement. Non-monetary assets and liabilities denominated in foreign currencies that are stated at fair value are translated to functional currency at foreign exchange rates ruling at the dates the values were determined.
The assets and liabilities of foreign operations, including goodwill and fair value adjustments arising on consolidation, are translated to sterling at foreign exchange rates ruling at the balance sheet date. The revenues and expenses of foreign operations are translated to sterling at average foreign exchange rates ruling at the dates of the transactions. Foreign exchange differences arising on retranslation since the transition date are recognised directly in a separate component of equity. When a foreign operation is disposed of, in part or in full, the relevant amount in the foreign currency translation reserve is transferred to profit or loss.
Exchange differences arising from a monetary item receivable from or payable to a foreign operation, the settlement of which is neither planned nor likely in the foreseeable future, are considered to form part of a net investment in a foreign operation and are recognised directly in equity in the translation reserve.
d) Revenue recognitionRevenue represents amounts receivable for goods provided in the normal course of business, net of trade discounts, VAT and other sales related taxes. Retail revenue is recognised when a Group entity sells a product to the customer. Wholesale revenue is recognised when goods are delivered and title has passed. Licence income receivable from licencees are accrued as earned on the basis of the terms of the relevant licence agreement, which is typically on the basis of a minimum payment and a variable amount based on turnover.
The Group sells retail products with the right of return and experience is used to estimate and provide for the value of such returns at the time of sale when considered significant. Credit notes or exchanges are available to customers returning unwanted products with proof of purchase within 28 days of the date of purchase.
Sale of gift vouchers are treated as future liabilities, and revenue is recognised when the gift vouchers are redeemed against a later transaction.
e) LeasesRentals under operating leases are charged as incurred, unless there are pre-determined rental increases in the lease, in which case they are recognised on a straight-line basis over the lease term. Leasehold incentives received are recognised as an integral part of total lease expense, over the term of the lease.
Certain rental expense is determined on the basis of revenue achieved in specific retail locations and is accrued for on that basis.
The Group’s intangible asset, as shown in Note 10, relates to leased premises which have a guaranteed residual value. The guaranteed value arises because the next tenant, based on current market conditions, will pay this amount to the Group. Due to the likelihood that the money will be recoverable, the asset is not amortised.
f) Pension costsContributions payable to defined contribution schemes in respect of pension costs and other post retirement benefits are charged to the consolidated income statement in the period to which they relate. Differences between contributions payable in the year and contributions actually paid are shown as either accruals or prepayments in the balance sheet.
NOTES TO THE FINANCIAL STATEMENTS NOTES TO THE FINANCIAL STATEMENTS1) Summary of significant accounting policiesThe principal accounting policies applied in the preparation of these consolidated and parent Financial Statements are set out below. These policies have been consistently applied to all the years presented, unless otherwise stated.
a) Basis of preparationBoth the consolidated and parent Financial Statements have been prepared and approved by the directors in accordance with International Financial Reporting Standards as adopted by the EU (“Adopted IFRSs”). On publishing the parent company Financial Statements here together with the consolidated Financial Statements, the Company is taking advantage of the exemption in Section 408 of the Companies Act 2006 not to present its individual income statement and related notes that form a part of these approved Financial Statements.
The Group’s business activities, together with the factors likely to affect its future development, performance and position are set out on pages 4 to 12. The financial position of the Group, its cash flows, liquidity position and borrowing facilities are described in the Chairman’s Statement on pages 4 to 5. In addition, Note 22 to the Financial Statements includes the Group’s objectives, policies and processes for managing its capital; its financial risk management objectives; details of its financial instruments and hedging activities; and its exposures to credit risk and liquidity risk.
As highlighted in Note 22 to the Financial Statements, the company meets its day-to-day working capital requirements through an overdraft facility which is due for renewal on 1 March 2015. The Company will open renewal negotiations with the bank in due course and has, at this stage, not sought any written commitment that the facility will be renewed. However, the Company has held discussion with its bankers about its future borrowing needs and no matters have been drawn to its attention to suggest that renewal may not be forthcoming on acceptable terms.
The Group’s forecasts and projections, taking into account reasonably possible changes in trading performance, show that the Group has sufficient financial resources. As a consequence the directors have a reasonable expectation that the Company and the Group are well placed to manage their business risks and to continue in operational existence for the foreseeable future, despite the current uncertain global economic outlook. Accordingly, the directors continue to adopt the going concern basis in preparing the consolidated Financial Statements.
The consolidated and parent Financial Statements have been prepared under the historical cost convention, except for financial assets and financial liabilities (including derivative instruments), which are held at fair value.
The preparation of Financial Statements in conformity with Adopted IFRSs requires management to make judgements, estimates and assumptions that affect the application of policies and reported amounts of assets and liabilities, income and expenses. The estimates and associated assumptions are based on historical experience and various other factors that are believed to be reasonable under the circumstances, the results of which form the basis of making the judgements about carrying values of assets and liabilities that are not readily apparent from other sources. Actual results may differ from these estimates.
The estimates and assumptions are reviewed on an ongoing basis. Revisions to accounting estimates are recognised in the period in which the estimate is revised if the revision affects only that period, or in the period of the revision and future periods if the revision affects both current and future periods. The Group’s significant judgement areas relate to inventory provisions and impairment of assets.
Revised and amended standards and interpretationsThe following revised IFRS has been adopted in these Financial Statements. The application of this IFRS has not had any material impact on the amounts reported for the current and prior years:
IAS 1, Amendments to Presentation of Financial Statements (effective 1 July 2012), requires that an entity present separately the items of other comprehensive income that may be reclassified to the income statement in future from those that would never be reclassified to the income statement.
There were no other new standards, interpretations or amendments to standards issued and effective for the year which materially impacted the Group’s Financial Statements.
The Group does not consider that any other standards, amendments or interpretations issued by the IASB, but not yet applicable, will have a significant impact on the Financial Statements in future years.
b) Basis of consolidationThe consolidated accounts include the accounts of the Company and its subsidiary undertakings made up to 25 January 2014. Unless otherwise stated, the acquisition method of accounting has been adopted. Under this method, the results of subsidiary undertakings acquired or disposed of in the year are included in the consolidated Financial Statements from the date of acquisition or up to the date of disposal.
Inter-company transactions, balances and unrealised gains on transactions between Group companies are eliminated. Unrealised losses are also eliminated unless the transaction provides evidence of an impairment of the asset transferred. Accounting policies of subsidiaries have been changed where necessary to ensure consistency with the policies adopted by the Group.

55 56 Ted Baker Plc Annual Report and Accounts 2013/14
Amortisation is charged to the income statement on a straight-line basis over the estimated useful lives of intangible assets unless such lives are indefinite. Intangible assets with an indefinite useful life are systematically tested for impairment at each balance sheet date. Other intangible assets are amortised from the date they are available for use. The estimated useful lives are as follows:
• Key money: Indefinite
• Computer Software: 4 years
• Computer Software under development: 5–7.5 years.
l) Property, plant and equipmentProperty, plant and equipment are stated at cost, net of accumulated depreciation and impairment losses. Depreciation is provided on all property, plant and equipment at rates calculated to write off the cost, less estimated residual value, of each asset over its expected useful life, on the following bases:
• Leasehold improvements: straight line over the period of the lease;
• Fixtures, fittings and office equipment: 20% to 25% per annum on a straight-line basis apart from computer equipment, which is 33% per annum on a straight-line basis;
• Motor vehicles: 25% per annum on a straight-line basis;
• Assets under construction: assets in the course of construction are stated at cost less any provision for impairment and transferred to completed assets when substantially all of the activities necessary for the asset to be ready for use have occurred.
The assets’ residual values and useful lives are reviewed, and adjusted if appropriate, at each balance sheet date. An asset’s carrying amount is written down immediately to its recoverable amount if the asset’s carrying amount is greater than its estimated recoverable amount.
Gains and losses on disposals are determined by comparing the disposal proceeds with the carrying amount and are included in the income statement.
m) InvestmentsInvestments in subsidiaries by the Company are shown at cost less accumulated impairment losses which are recognised in the income statement.
n) Impairment of property, plant and equipment and indefinite life intangible assetsAssets that are subject to amortisation are reviewed for impairment whenever events or changes in circumstances indicate that the carrying amount may not be recoverable. An impairment loss is recognised for the amount by which the asset’s carrying amount exceeds its estimated recoverable amount. The recoverable amount is the higher of an asset’s fair value less costs to sell and value in use. Recoverable amounts for cash-generating units are based on value in use, which is calculated from cash flow projections using data from the Group’s latest internal forecasts, the results of which are reviewed by the Board.
The key assumptions for the value in use calculations are those regarding discount rates, growth rates and expected changes in margins. Management use a pre-tax discount rate derived from the Group’s weighted average cost of capital. Internal forecasts reflect the current market assessment and risks specific to the cash-generating units. Changes in selling prices and direct costs are based on past experience and expectations of future changes in the market.
Impairment losses are recognised in the income statement. For the purposes of assessing impairment, assets are grouped at the lowest levels for which there are separately identifiable cash flows (cash-generating units). Where an impairment loss subsequently reverses, the carrying amount of the asset is increased to the revised estimate of the recoverable amount, but so that the increased carrying value does not exceed the carrying value that would have been determined if no impairment loss had been recognised for the asset in prior years. A reversal of an impairment loss is recognised in income immediately.
o) InventoriesInventories and work in progress are stated at the lower of cost and net realisable value. Cost includes materials, direct labour and inward transportation costs. Net realisable value is based on estimated selling price, less further costs expected to be incurred to completion and disposal. Provision is made for obsolete, slow moving or defective items where appropriate.
p) Cash and cash equivalentsCash and cash equivalents comprises cash balances and money market deposits. Bank overdrafts that are repayable on demand and form an integral part of the Group’s cash management are included as a component of cash and cash equivalents for the purpose of the statement of cash flows.
q) Interest-bearing borrowingsInterest-bearing borrowings are recognised initially at fair value less attributable transaction costs. Subsequent to initial recognition, interest bearing borrowings are stated at amortised cost with any difference between cost and redemption value being recognised in the income statement over the period of the borrowings on an effective interest basis.
r) Finance income and expensesNet financing costs comprise interest payable on borrowings calculated using the effective interest rate method, interest receivable on funds invested, dividend income, foreign exchange gains and losses, and gains and losses on hedging instruments that are recognised in the income statement.
Interest income is recognised in the income statement as it accrues, using the effective interest method. Dividend income is recognised in the income statement on the date the entity’s right to receive payments is established which in the case of quoted securities is usually the ex-dividend date.
g) Share based paymentsThe Group operates an equity settled share based compensation plan.
Share options and conditional share awardsShare options granted under the Sharesave scheme and the Ted Baker Plc Long-Term Incentive Plan are measured at fair value at the date of grant using the Black-Scholes and Monte Carlo pricing models respectively. The pricing models take into account the terms and conditions of the options/awards vesting. The grant date fair value is expensed on a straight line basis over the vesting period (i.e. the period in which the employees become unconditionally entitled to share options/awards) based on an estimate of shares that will eventually vest.
Value Creation PlanThe Group operated a Value Creation Plan (VCP) which vested in full in the year ended 26 January 2013. The VCP awarded entitlements to certain employees and directors of the Group. In August 2012 these entitlements converted into options over ordinary shares subject to the Group’s share price reaching certain targets. The fair value of the amount payable to the employee was recognised as an expense with a corresponding increase in equity. The fair value was initially recognised at the date of the award of the entitlements and spread over the period during which the entitlements were convertible into ordinary shares. The fair value of those entitlements was based on a Monte Carlo valuation model, taking into account the terms and conditions upon which the instruments were granted.
Shares of Ted Baker Plc held by the Company for the purpose of filling obligations in respect of employee share plans are deducted from equity in the balance sheet. Any surplus or deficit arising on the sale of the Ted Baker Plc shares held by the Company is included as an adjustment to reserves.
Transactions of the Company-sponsored Employee Benefit Trust (EBT) are treated as being those of the Company and are therefore reflected in the Parent Company and Group Financial Statements. In particular, the EBT’s purchases and sales of shares in the Company are debited and credited directly to equity.
Where the Company grants options over its own shares to the employees of its subsidiaries, it recognises, in its individual Financial Statements, an increase in the cost of investment in its subsidiaries equivalent to the equity-settled share-based payment charge recognised in its consolidated Financial Statements with the corresponding credit being recognised directly in equity.
h) DerivativesThe Group holds derivative financial instruments to hedge its foreign currency exposure. Derivatives are recognised initially at fair value; attributable transaction costs are recognised in profit or loss when incurred. Subsequent to initial recognition, derivatives are measured at fair value, and changes therein are accounted for as described below.
Cash flow hedgesChanges in the fair value of the derivative hedging instrument designated as a cash flow hedge are recognised directly in other comprehensive income to the extent that the hedge is effective. To the extent that the hedge is ineffective, changes in fair value are recognised in profit or loss.
If the hedging instrument no longer meets the criteria for hedge accounting, expires or is sold, terminated or exercised, then hedge accounting is discontinued prospectively. The cumulative gain or loss previously recognised in other comprehensive income remains there until the forecast transaction occurs. When the hedged item is a non-financial asset, the amount recognised in other comprehensive income is transferred to the carrying amount of the asset when it is recognised. In other cases the amount recognised in other comprehensive income is transferred to profit or loss in the same period that the hedged item affects profit or loss.
i) TaxationCorporation tax payable is recognised on taxable profits using tax rates enacted or substantively enacted at the balance sheet date. Deferred tax is recognised in full, using the balance sheet liability method, on temporary differences arising between the tax bases of assets and liabilities and their carrying amounts in the consolidated Financial Statements. However, if the deferred tax arises from initial recognition of an asset or liability in a transaction other than a business combination that at the time of the transaction affects neither accounting nor taxable profit or loss, it is not accounted for. Deferred tax is determined using tax rates (and laws) that have been enacted or substantively enacted by the balance sheet date and are expected to apply when the related deferred tax asset is realised or the deferred tax liability is settled.
Deferred tax is not recognised for temporary differences relating to investments in subsidiaries to the extent they will not reverse in the foreseeable future.
Deferred tax assets are recognised to the extent that it is probable that future taxable profit will be available against which the temporary differences can be utilised.
Income tax is recognised in the income statement except to the extent that it relates to items recognised directly in equity, in which case it is recognised in equity. Income tax comprises current and deferred tax.
j) Dividend distributionDividend distribution to the Company’s shareholders is recognised as a liability in the Group and Company Financial Statements in the period in which it is declared.
k) Intangible assetsIntangible assets that are acquired by the Group are stated at cost less accumulated amortisation and impairment losses.
NOTES TO THE FINANCIAL STATEMENTS NOTES TO THE FINANCIAL STATEMENTS
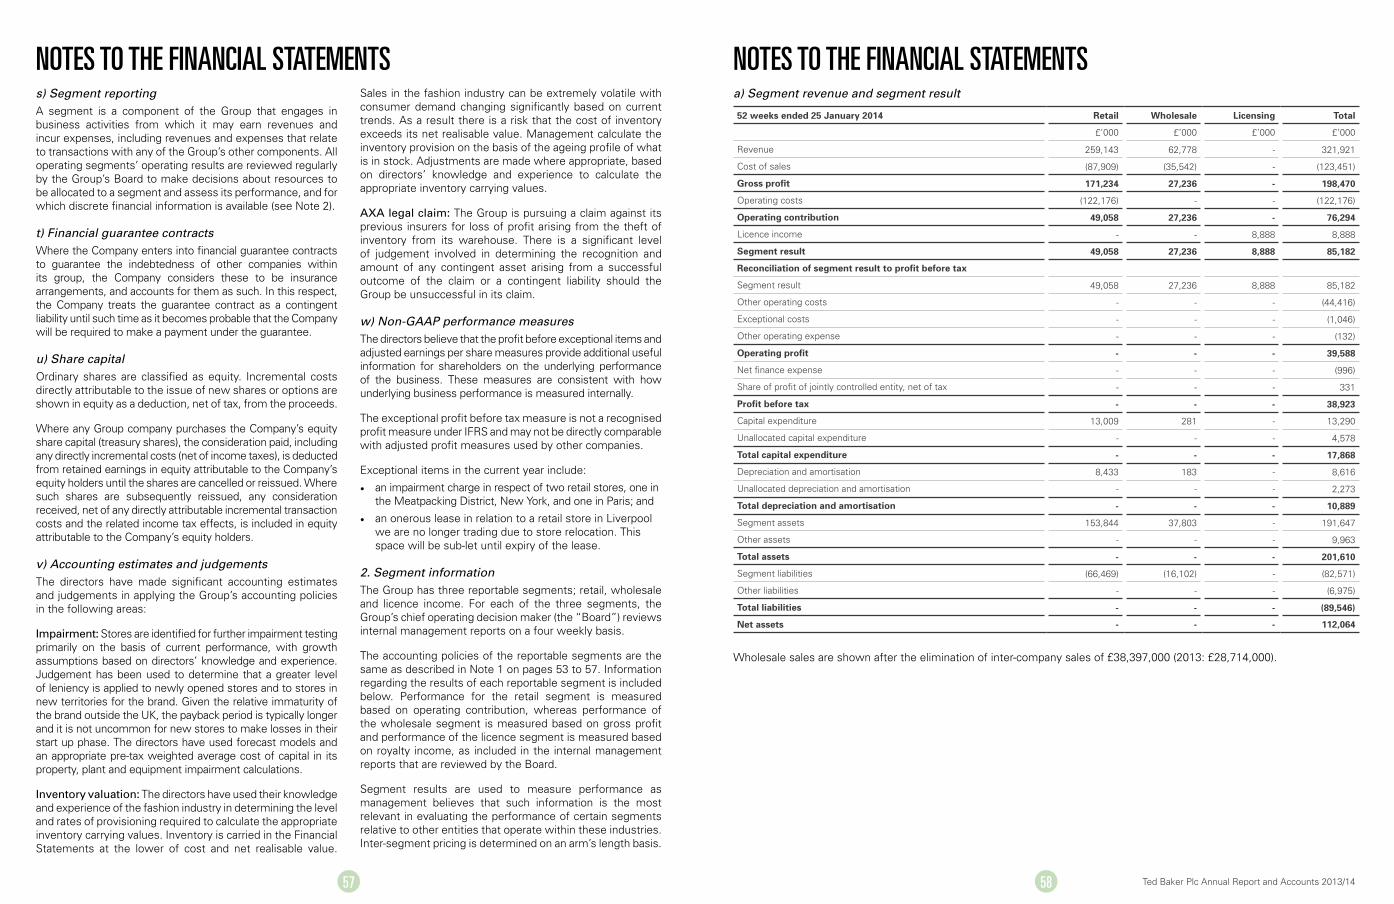
57 58 Ted Baker Plc Annual Report and Accounts 2013/14
s) Segment reportingA segment is a component of the Group that engages in business activities from which it may earn revenues and incur expenses, including revenues and expenses that relate to transactions with any of the Group’s other components. All operating segments’ operating results are reviewed regularly by the Group’s Board to make decisions about resources to be allocated to a segment and assess its performance, and for which discrete financial information is available (see Note 2).
t) Financial guarantee contractsWhere the Company enters into financial guarantee contracts to guarantee the indebtedness of other companies within its group, the Company considers these to be insurance arrangements, and accounts for them as such. In this respect, the Company treats the guarantee contract as a contingent liability until such time as it becomes probable that the Company will be required to make a payment under the guarantee.
u) Share capitalOrdinary shares are classified as equity. Incremental costs directly attributable to the issue of new shares or options are shown in equity as a deduction, net of tax, from the proceeds.
Where any Group company purchases the Company’s equity share capital (treasury shares), the consideration paid, including any directly incremental costs (net of income taxes), is deducted from retained earnings in equity attributable to the Company’s equity holders until the shares are cancelled or reissued. Where such shares are subsequently reissued, any consideration received, net of any directly attributable incremental transaction costs and the related income tax effects, is included in equity attributable to the Company’s equity holders.
v) Accounting estimates and judgementsThe directors have made significant accounting estimates and judgements in applying the Group’s accounting policies in the following areas:
impairment: Stores are identified for further impairment testing primarily on the basis of current performance, with growth assumptions based on directors’ knowledge and experience. Judgement has been used to determine that a greater level of leniency is applied to newly opened stores and to stores in new territories for the brand. Given the relative immaturity of the brand outside the UK, the payback period is typically longer and it is not uncommon for new stores to make losses in their start up phase. The directors have used forecast models and an appropriate pre-tax weighted average cost of capital in its property, plant and equipment impairment calculations.
inventory valuation: The directors have used their knowledge and experience of the fashion industry in determining the level and rates of provisioning required to calculate the appropriate inventory carrying values. Inventory is carried in the Financial Statements at the lower of cost and net realisable value.
Sales in the fashion industry can be extremely volatile with consumer demand changing significantly based on current trends. As a result there is a risk that the cost of inventory exceeds its net realisable value. Management calculate the inventory provision on the basis of the ageing profile of what is in stock. Adjustments are made where appropriate, based on directors’ knowledge and experience to calculate the appropriate inventory carrying values.
aXa legal claim: The Group is pursuing a claim against its previous insurers for loss of profit arising from the theft of inventory from its warehouse. There is a significant level of judgement involved in determining the recognition and amount of any contingent asset arising from a successful outcome of the claim or a contingent liability should the Group be unsuccessful in its claim.
w) Non-GAAP performance measuresThe directors believe that the profit before exceptional items and adjusted earnings per share measures provide additional useful information for shareholders on the underlying performance of the business. These measures are consistent with how underlying business performance is measured internally.
The exceptional profit before tax measure is not a recognised profit measure under IFRS and may not be directly comparable with adjusted profit measures used by other companies.
Exceptional items in the current year include:
• an impairment charge in respect of two retail stores, one in the Meatpacking District, New York, and one in Paris; and
• an onerous lease in relation to a retail store in Liverpool we are no longer trading due to store relocation. This space will be sub-let until expiry of the lease.
2. Segment informationThe Group has three reportable segments; retail, wholesale and licence income. For each of the three segments, the Group’s chief operating decision maker (the “Board”) reviews internal management reports on a four weekly basis.
The accounting policies of the reportable segments are the same as described in Note 1 on pages 53 to 57. Information regarding the results of each reportable segment is included below. Performance for the retail segment is measured based on operating contribution, whereas performance of the wholesale segment is measured based on gross profit and performance of the licence segment is measured based on royalty income, as included in the internal management reports that are reviewed by the Board.
Segment results are used to measure performance as management believes that such information is the most relevant in evaluating the performance of certain segments relative to other entities that operate within these industries. Inter-segment pricing is determined on an arm’s length basis.
a) Segment revenue and segment result
52 weeks ended 25 January 2014 Retail Wholesale Licensing Total
£’000 £’000 £’000 £’000
Revenue 259,143 62,778 - 321,921
Cost of sales (87,909) (35,542) - (123,451)
Gross profit 171,234 27,236 - 198,470
Operating costs (122,176) - - (122,176)
Operating contribution 49,058 27,236 - 76,294
Licence income - - 8,888 8,888
Segment result 49,058 27,236 8,888 85,182
Reconciliation of segment result to profit before tax
Segment result 49,058 27,236 8,888 85,182
Other operating costs - - - (44,416)
Exceptional costs - - - (1,046)
Other operating expense - - - (132)
Operating profit - - - 39,588
Net finance expense - - - (996)
Share of profit of jointly controlled entity, net of tax - - - 331
Profit before tax - - - 38,923
Capital expenditure 13,009 281 - 13,290
Unallocated capital expenditure - - - 4,578
Total capital expenditure - - - 17,868
Depreciation and amortisation 8,433 183 - 8,616
Unallocated depreciation and amortisation - - - 2,273
Total depreciation and amortisation - - - 10,889
Segment assets 153,844 37,803 - 191,647
Other assets - - - 9,963
Total assets - - - 201,610
Segment liabilities (66,469) (16,102) - (82,571)
Other liabilities - - - (6,975)
Total liabilities - - - (89,546)
Net assets - - - 112,064
NOTES TO THE FINANCIAL STATEMENTS NOTES TO THE FINANCIAL STATEMENTS
Wholesale sales are shown after the elimination of inter-company sales of £38,397,000 (2013: £28,714,000).
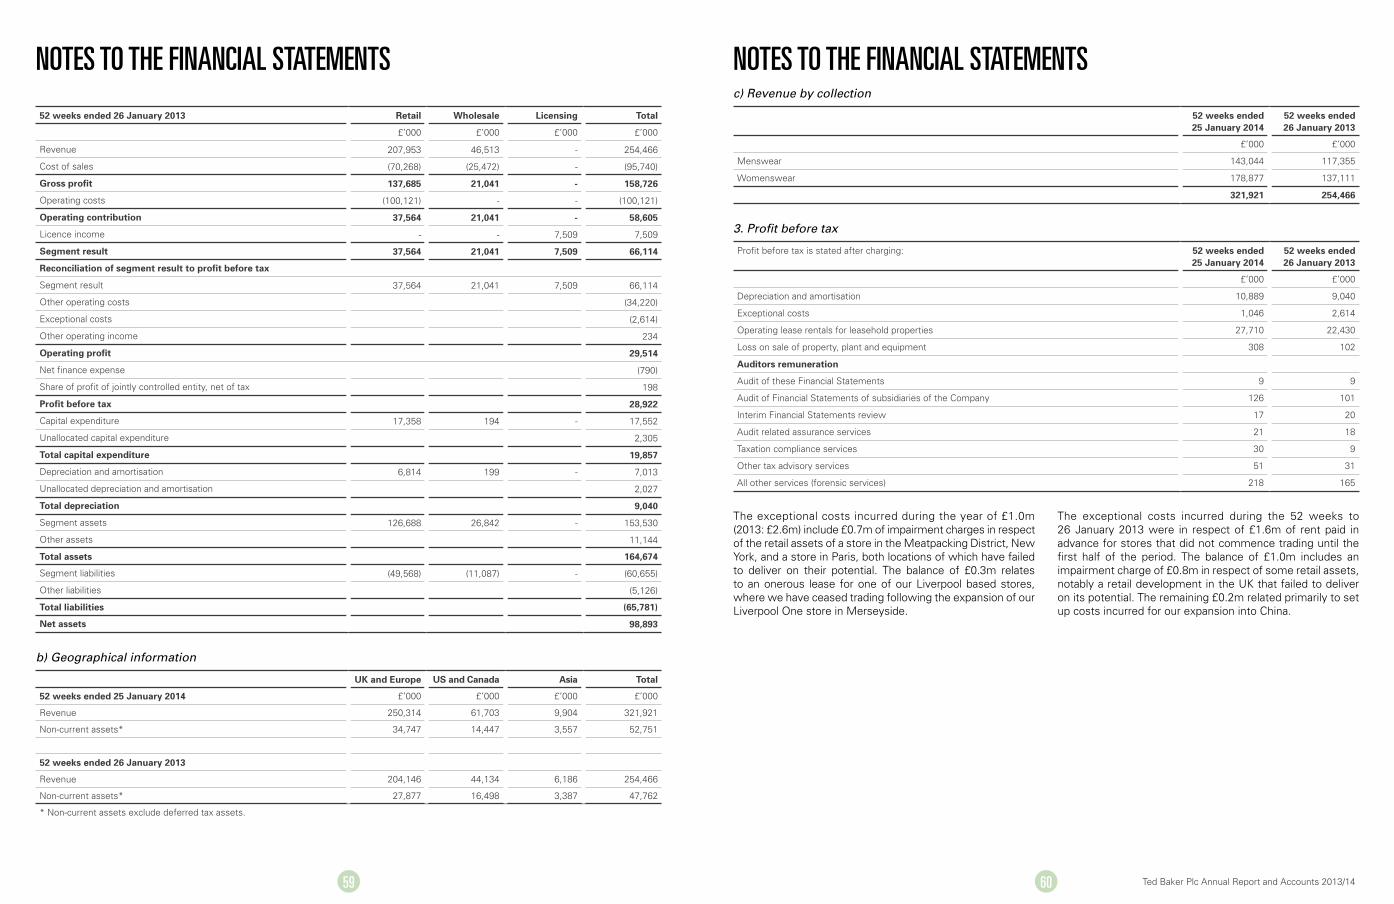
59 60 Ted Baker Plc Annual Report and Accounts 2013/14
52 weeks ended 26 January 2013 Retail Wholesale Licensing Total
£’000 £’000 £’000 £’000
Revenue 207,953 46,513 - 254,466
Cost of sales (70,268) (25,472) - (95,740)
Gross profit 137,685 21,041 - 158,726
Operating costs (100,121) - - (100,121)
Operating contribution 37,564 21,041 - 58,605
Licence income - - 7,509 7,509
Segment result 37,564 21,041 7,509 66,114
Reconciliation of segment result to profit before tax
Segment result 37,564 21,041 7,509 66,114
Other operating costs (34,220)
Exceptional costs (2,614)
Other operating income 234
Operating profit 29,514
Net finance expense (790)
Share of profit of jointly controlled entity, net of tax 198
Profit before tax 28,922
Capital expenditure 17,358 194 - 17,552
Unallocated capital expenditure 2,305
Total capital expenditure 19,857
Depreciation and amortisation 6,814 199 - 7,013
Unallocated depreciation and amortisation 2,027
Total depreciation 9,040
Segment assets 126,688 26,842 - 153,530
Other assets 11,144
Total assets 164,674
Segment liabilities (49,568) (11,087) - (60,655)
Other liabilities (5,126)
Total liabilities (65,781)
Net assets 98,893
b) Geographical information
UK and Europe US and Canada Asia Total
52 weeks ended 25 January 2014 £’000 £’000 £’000 £’000
Revenue 250,314 61,703 9,904 321,921
Non-current assets* 34,747 14,447 3,557 52,751
52 weeks ended 26 January 2013
Revenue 204,146 44,134 6,186 254,466
Non-current assets* 27,877 16,498 3,387 47,762
* Non-current assets exclude deferred tax assets.
c) Revenue by collection
52 weeks ended 25 January 2014
52 weeks ended 26 January 2013
£’000 £’000
Menswear 143,044 117,355
Womenswear 178,877 137,111
321,921 254,466
3. Profit before tax
Profit before tax is stated after charging: 52 weeks ended 25 January 2014
52 weeks ended 26 January 2013
£’000 £’000
Depreciation and amortisation 10,889 9,040
Exceptional costs 1,046 2,614
Operating lease rentals for leasehold properties 27,710 22,430
Loss on sale of property, plant and equipment 308 102
Auditors remuneration
Audit of these Financial Statements 9 9
Audit of Financial Statements of subsidiaries of the Company 126 101
Interim Financial Statements review 17 20
Audit related assurance services 21 18
Taxation compliance services 30 9
Other tax advisory services 51 31
All other services (forensic services) 218 165
The exceptional costs incurred during the year of £1.0m (2013: £2.6m) include £0.7m of impairment charges in respect of the retail assets of a store in the Meatpacking District, New York, and a store in Paris, both locations of which have failed to deliver on their potential. The balance of £0.3m relates to an onerous lease for one of our Liverpool based stores, where we have ceased trading following the expansion of our Liverpool One store in Merseyside.
The exceptional costs incurred during the 52 weeks to 26 January 2013 were in respect of £1.6m of rent paid in advance for stores that did not commence trading until the first half of the period. The balance of £1.0m includes an impairment charge of £0.8m in respect of some retail assets, notably a retail development in the UK that failed to deliver on its potential. The remaining £0.2m related primarily to set up costs incurred for our expansion into China.
NOTES TO THE FINANCIAL STATEMENTS NOTES TO THE FINANCIAL STATEMENTS
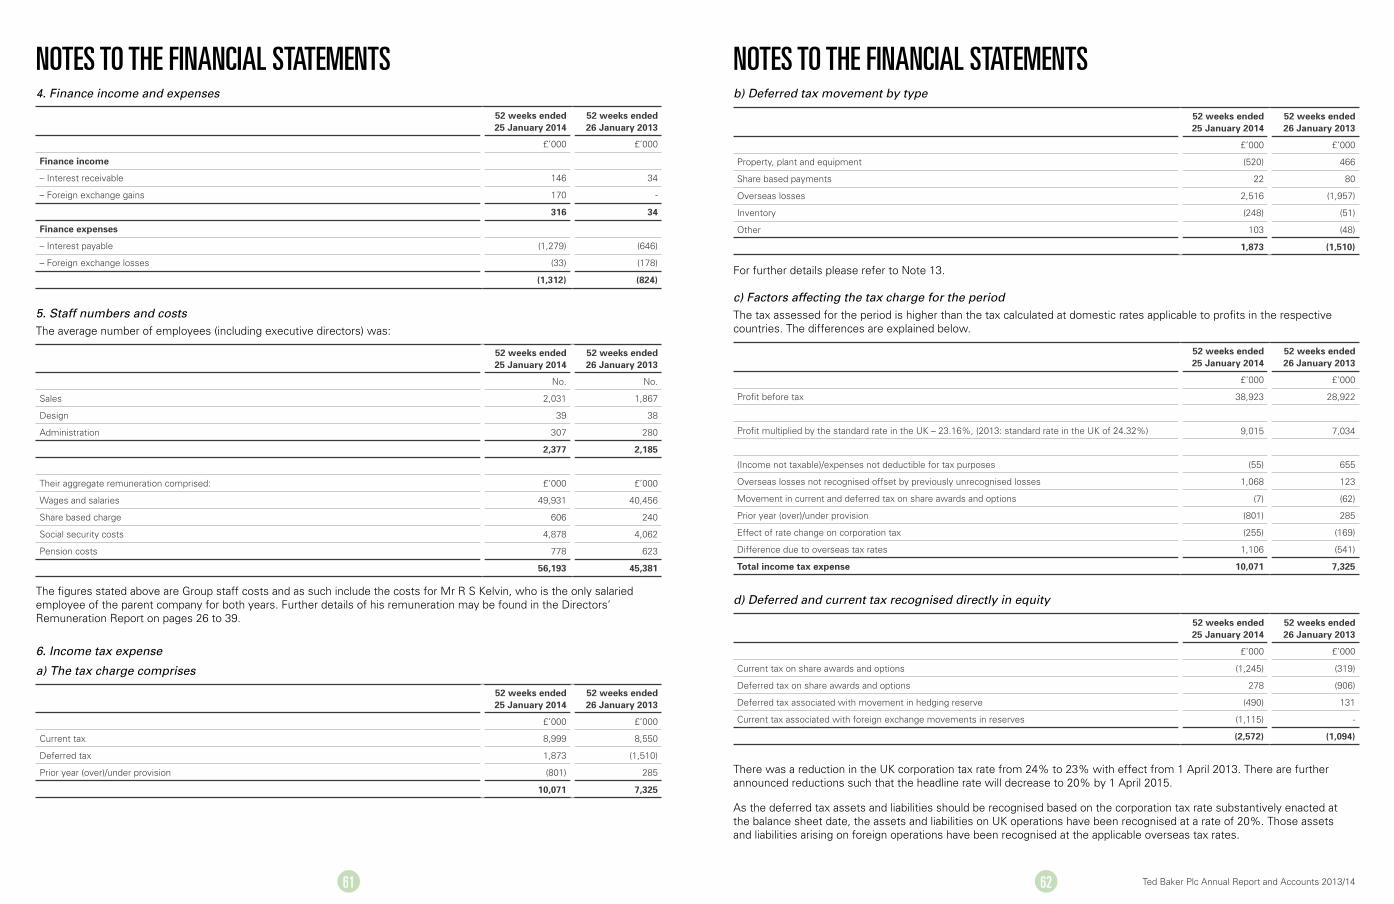
61 62 Ted Baker Plc Annual Report and Accounts 2013/14
b) Deferred tax movement by type
For further details please refer to Note 13.
c) Factors affecting the tax charge for the periodThe tax assessed for the period is higher than the tax calculated at domestic rates applicable to profits in the respective countries. The differences are explained below.
There was a reduction in the UK corporation tax rate from 24% to 23% with effect from 1 April 2013. There are further announced reductions such that the headline rate will decrease to 20% by 1 April 2015.
As the deferred tax assets and liabilities should be recognised based on the corporation tax rate substantively enacted at the balance sheet date, the assets and liabilities on UK operations have been recognised at a rate of 20%. Those assets and liabilities arising on foreign operations have been recognised at the applicable overseas tax rates.
d) Deferred and current tax recognised directly in equity
4. Finance income and expenses
52 weeks ended 25 January 2014
52 weeks ended 26 January 2013
£’000 £’000
Finance income
– Interest receivable 146 34
– Foreign exchange gains 170 -
316 34
Finance expenses
– Interest payable (1,279) (646)
– Foreign exchange losses (33) (178)
(1,312) (824)
6. Income tax expense
a) The tax charge comprises
52 weeks ended 25 January 2014
52 weeks ended 26 January 2013
£’000 £’000
Current tax 8,999 8,550
Deferred tax 1,873 (1,510)
Prior year (over)/under provision (801) 285
10,071 7,325
52 weeks ended 25 January 2014
52 weeks ended 26 January 2013
£’000 £’000
Property, plant and equipment (520) 466
Share based payments 22 80
Overseas losses 2,516 (1,957)
Inventory (248) (51)
Other 103 (48)
1,873 (1,510)
52 weeks ended 25 January 2014
52 weeks ended 26 January 2013
£’000 £’000
Profit before tax 38,923 28,922
Profit multiplied by the standard rate in the UK – 23.16%, (2013: standard rate in the UK of 24.32%) 9,015 7,034
(Income not taxable)/expenses not deductible for tax purposes (55) 655
Overseas losses not recognised offset by previously unrecognised losses 1,068 123
Movement in current and deferred tax on share awards and options (7) (62)
Prior year (over)/under provision (801) 285
Effect of rate change on corporation tax (255) (169)
Difference due to overseas tax rates 1,106 (541)
Total income tax expense 10,071 7,325
52 weeks ended 25 January 2014
52 weeks ended 26 January 2013
£’000 £’000
Current tax on share awards and options (1,245) (319)
Deferred tax on share awards and options 278 (906)
Deferred tax associated with movement in hedging reserve (490) 131
Current tax associated with foreign exchange movements in reserves (1,115) -
(2,572) (1,094)
5. Staff numbers and costsThe average number of employees (including executive directors) was:
52 weeks ended 25 January 2014
52 weeks ended 26 January 2013
No. No.
Sales 2,031 1,867
Design 39 38
Administration 307 280
2,377 2,185
Their aggregate remuneration comprised: £’000 £’000
Wages and salaries 49,931 40,456
Share based charge 606 240
Social security costs 4,878 4,062
Pension costs 778 623
56,193 45,381
The figures stated above are Group staff costs and as such include the costs for Mr R S Kelvin, who is the only salaried employee of the parent company for both years. Further details of his remuneration may be found in the Directors’ Remuneration Report on pages 26 to 39.
NOTES TO THE FINANCIAL STATEMENTS NOTES TO THE FINANCIAL STATEMENTS
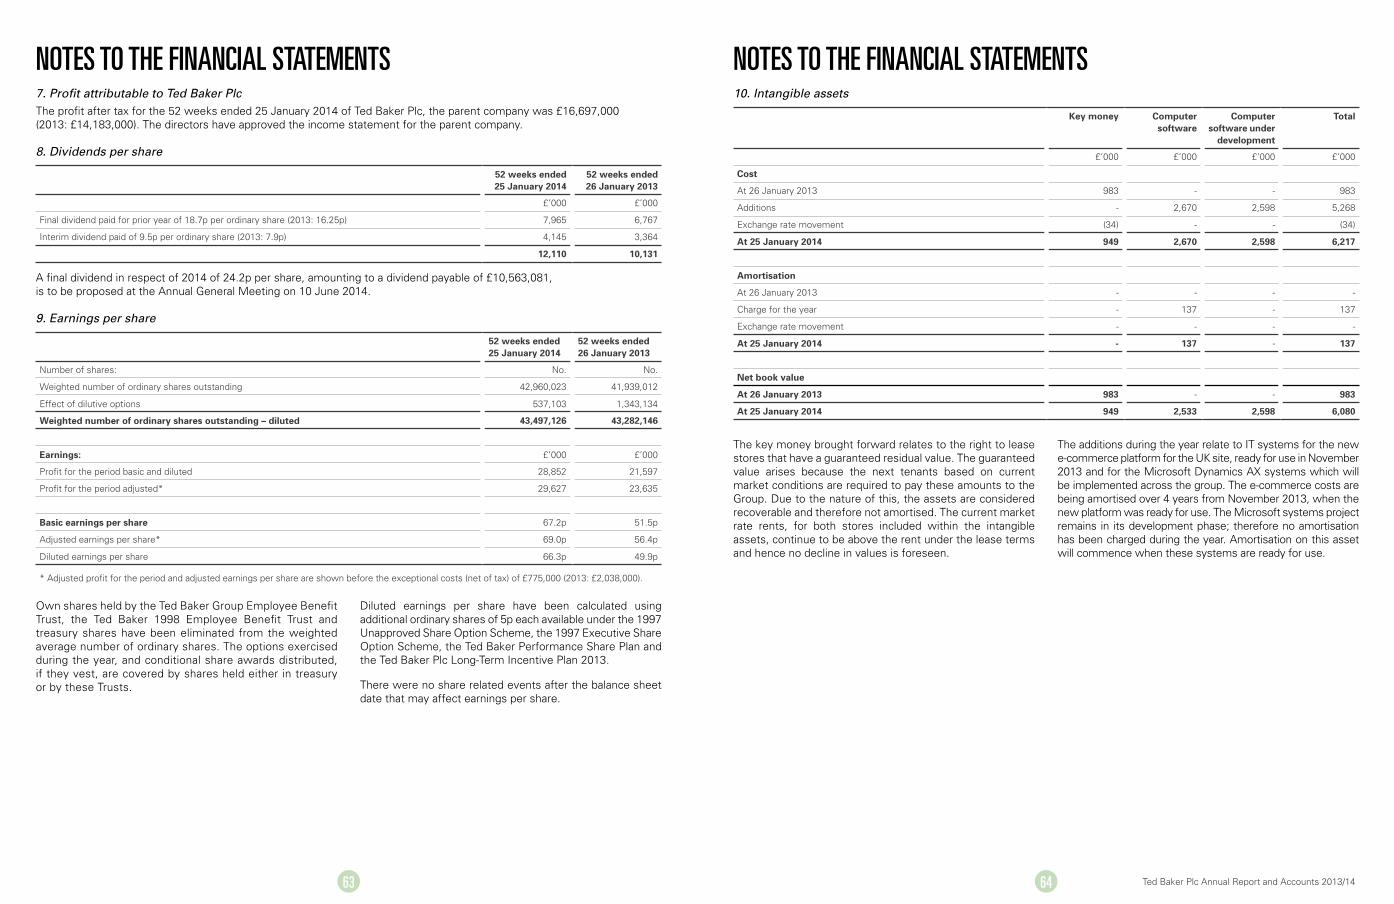
63 64 Ted Baker Plc Annual Report and Accounts 2013/14
7. Profit attributable to Ted Baker PlcThe profit after tax for the 52 weeks ended 25 January 2014 of Ted Baker Plc, the parent company was £16,697,000 (2013: £14,183,000). The directors have approved the income statement for the parent company.
8. Dividends per share
A final dividend in respect of 2014 of 24.2p per share, amounting to a dividend payable of £10,563,081, is to be proposed at the Annual General Meeting on 10 June 2014.
9. Earnings per share
Own shares held by the Ted Baker Group Employee Benefit Trust, the Ted Baker 1998 Employee Benefit Trust and treasury shares have been eliminated from the weighted average number of ordinary shares. The options exercised during the year, and conditional share awards distributed, if they vest, are covered by shares held either in treasury or by these Trusts.
Diluted earnings per share have been calculated using additional ordinary shares of 5p each available under the 1997 Unapproved Share Option Scheme, the 1997 Executive Share Option Scheme, the Ted Baker Performance Share Plan and the Ted Baker Plc Long-Term Incentive Plan 2013.
There were no share related events after the balance sheet date that may affect earnings per share.
10. Intangible assets
52 weeks ended 25 January 2014
52 weeks ended 26 January 2013
£’000 £’000
Final dividend paid for prior year of 18.7p per ordinary share (2013: 16.25p) 7,965 6,767
Interim dividend paid of 9.5p per ordinary share (2013: 7.9p) 4,145 3,364
12,110 10,131
52 weeks ended 25 January 2014
52 weeks ended 26 January 2013
Number of shares: No. No.
Weighted number of ordinary shares outstanding 42,960,023 41,939,012
Effect of dilutive options 537,103 1,343,134
Weighted number of ordinary shares outstanding – diluted 43,497,126 43,282,146
Earnings: £’000 £’000
Profit for the period basic and diluted 28,852 21,597
Profit for the period adjusted* 29,627 23,635
Basic earnings per share 67.2p 51.5p
Adjusted earnings per share* 69.0p 56.4p
Diluted earnings per share 66.3p 49.9p
* Adjusted profit for the period and adjusted earnings per share are shown before the exceptional costs (net of tax) of £775,000 (2013: £2,038,000).
Key money Computer software
Computer software under
development
Total
£’000 £’000 £’000 £’000
Cost
At 26 January 2013 983 - - 983
Additions - 2,670 2,598 5,268
Exchange rate movement (34) - - (34)
At 25 January 2014 949 2,670 2,598 6,217
Amortisation
At 26 January 2013 - - - -
Charge for the year - 137 - 137
Exchange rate movement - - - -
At 25 January 2014 - 137 - 137
Net book value
At 26 January 2013 983 - - 983
At 25 January 2014 949 2,533 2,598 6,080
The key money brought forward relates to the right to lease stores that have a guaranteed residual value. The guaranteed value arises because the next tenants based on current market conditions are required to pay these amounts to the Group. Due to the nature of this, the assets are considered recoverable and therefore not amortised. The current market rate rents, for both stores included within the intangible assets, continue to be above the rent under the lease terms and hence no decline in values is foreseen.
The additions during the year relate to IT systems for the new e-commerce platform for the UK site, ready for use in November 2013 and for the Microsoft Dynamics AX systems which will be implemented across the group. The e-commerce costs are being amortised over 4 years from November 2013, when the new platform was ready for use. The Microsoft systems project remains in its development phase; therefore no amortisation has been charged during the year. Amortisation on this asset will commence when these systems are ready for use.
NOTES TO THE FINANCIAL STATEMENTS NOTES TO THE FINANCIAL STATEMENTS
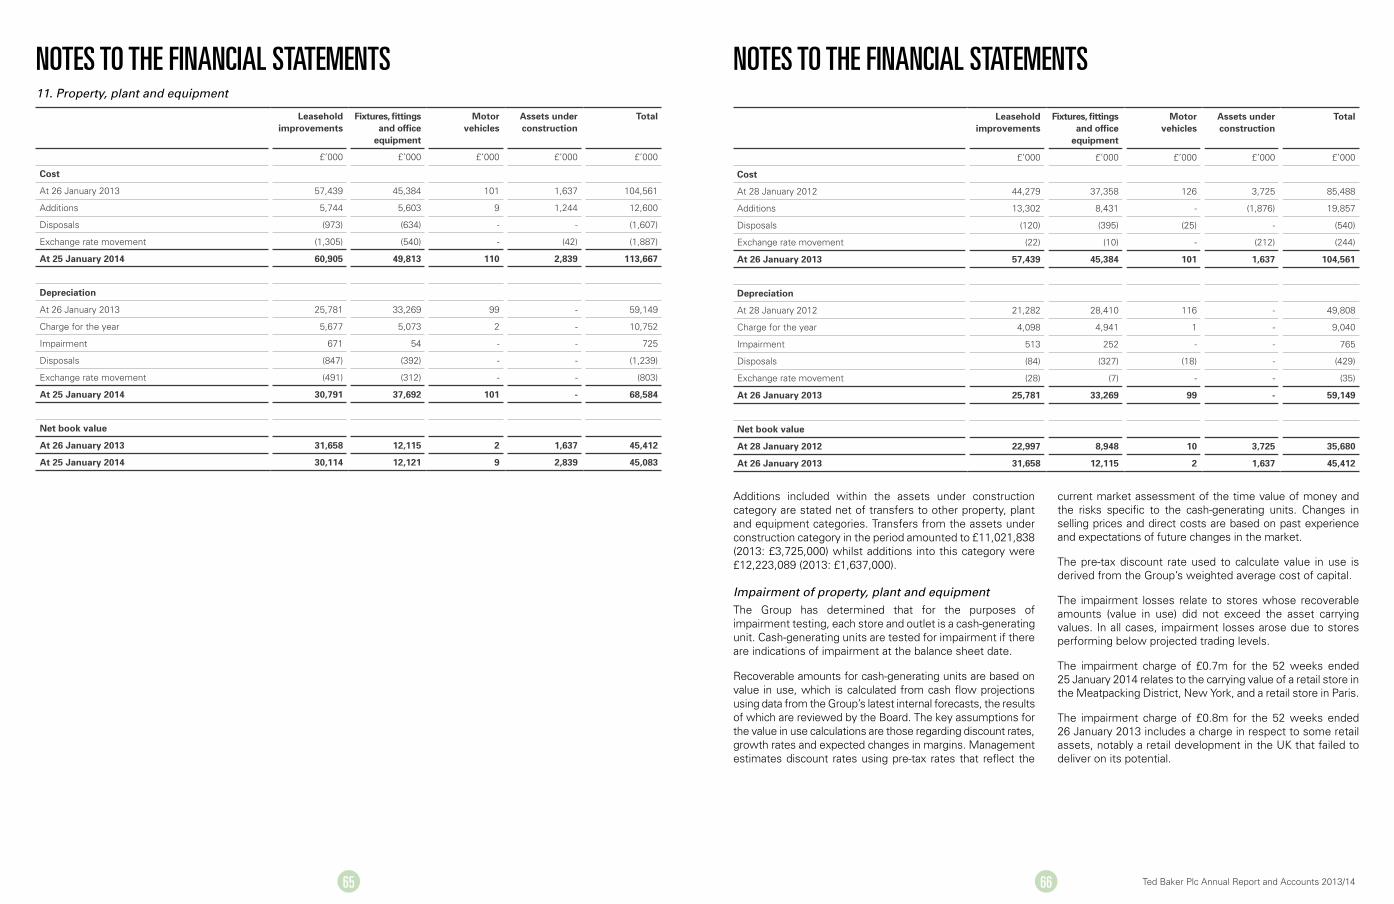
65 66 Ted Baker Plc Annual Report and Accounts 2013/14
11. Property, plant and equipment
Leasehold improvements
Fixtures, fittings and office
equipment
Motor vehicles
Assets under construction
Total
£’000 £’000 £’000 £’000 £’000
Cost
At 26 January 2013 57,439 45,384 101 1,637 104,561
Additions 5,744 5,603 9 1,244 12,600
Disposals (973) (634) - - (1,607)
Exchange rate movement (1,305) (540) - (42) (1,887)
At 25 January 2014 60,905 49,813 110 2,839 113,667
Depreciation
At 26 January 2013 25,781 33,269 99 - 59,149
Charge for the year 5,677 5,073 2 - 10,752
Impairment 671 54 - - 725
Disposals (847) (392) - - (1,239)
Exchange rate movement (491) (312) - - (803)
At 25 January 2014 30,791 37,692 101 - 68,584
Net book value
At 26 January 2013 31,658 12,115 2 1,637 45,412
At 25 January 2014 30,114 12,121 9 2,839 45,083
Leasehold improvements
Fixtures, fittings and office
equipment
Motor vehicles
Assets under construction
Total
£’000 £’000 £’000 £’000 £’000
Cost
At 28 January 2012 44,279 37,358 126 3,725 85,488
Additions 13,302 8,431 - (1,876) 19,857
Disposals (120) (395) (25) - (540)
Exchange rate movement (22) (10) - (212) (244)
At 26 January 2013 57,439 45,384 101 1,637 104,561
Depreciation
At 28 January 2012 21,282 28,410 116 - 49,808
Charge for the year 4,098 4,941 1 - 9,040
Impairment 513 252 - - 765
Disposals (84) (327) (18) - (429)
Exchange rate movement (28) (7) - - (35)
At 26 January 2013 25,781 33,269 99 - 59,149
Net book value
At 28 January 2012 22,997 8,948 10 3,725 35,680
At 26 January 2013 31,658 12,115 2 1,637 45,412
Additions included within the assets under construction category are stated net of transfers to other property, plant and equipment categories. Transfers from the assets under construction category in the period amounted to £11,021,838 (2013: £3,725,000) whilst additions into this category were £12,223,089 (2013: £1,637,000).
Impairment of property, plant and equipmentThe Group has determined that for the purposes of impairment testing, each store and outlet is a cash-generating unit. Cash-generating units are tested for impairment if there are indications of impairment at the balance sheet date.
Recoverable amounts for cash-generating units are based on value in use, which is calculated from cash flow projections using data from the Group’s latest internal forecasts, the results of which are reviewed by the Board. The key assumptions for the value in use calculations are those regarding discount rates, growth rates and expected changes in margins. Management estimates discount rates using pre-tax rates that reflect the
current market assessment of the time value of money and the risks specific to the cash-generating units. Changes in selling prices and direct costs are based on past experience and expectations of future changes in the market.
The pre-tax discount rate used to calculate value in use is derived from the Group’s weighted average cost of capital.
The impairment losses relate to stores whose recoverable amounts (value in use) did not exceed the asset carrying values. In all cases, impairment losses arose due to stores performing below projected trading levels.
The impairment charge of £0.7m for the 52 weeks ended 25 January 2014 relates to the carrying value of a retail store in the Meatpacking District, New York, and a retail store in Paris.
The impairment charge of £0.8m for the 52 weeks ended 26 January 2013 includes a charge in respect to some retail assets, notably a retail development in the UK that failed to deliver on its potential.
NOTES TO THE FINANCIAL STATEMENTS NOTES TO THE FINANCIAL STATEMENTS
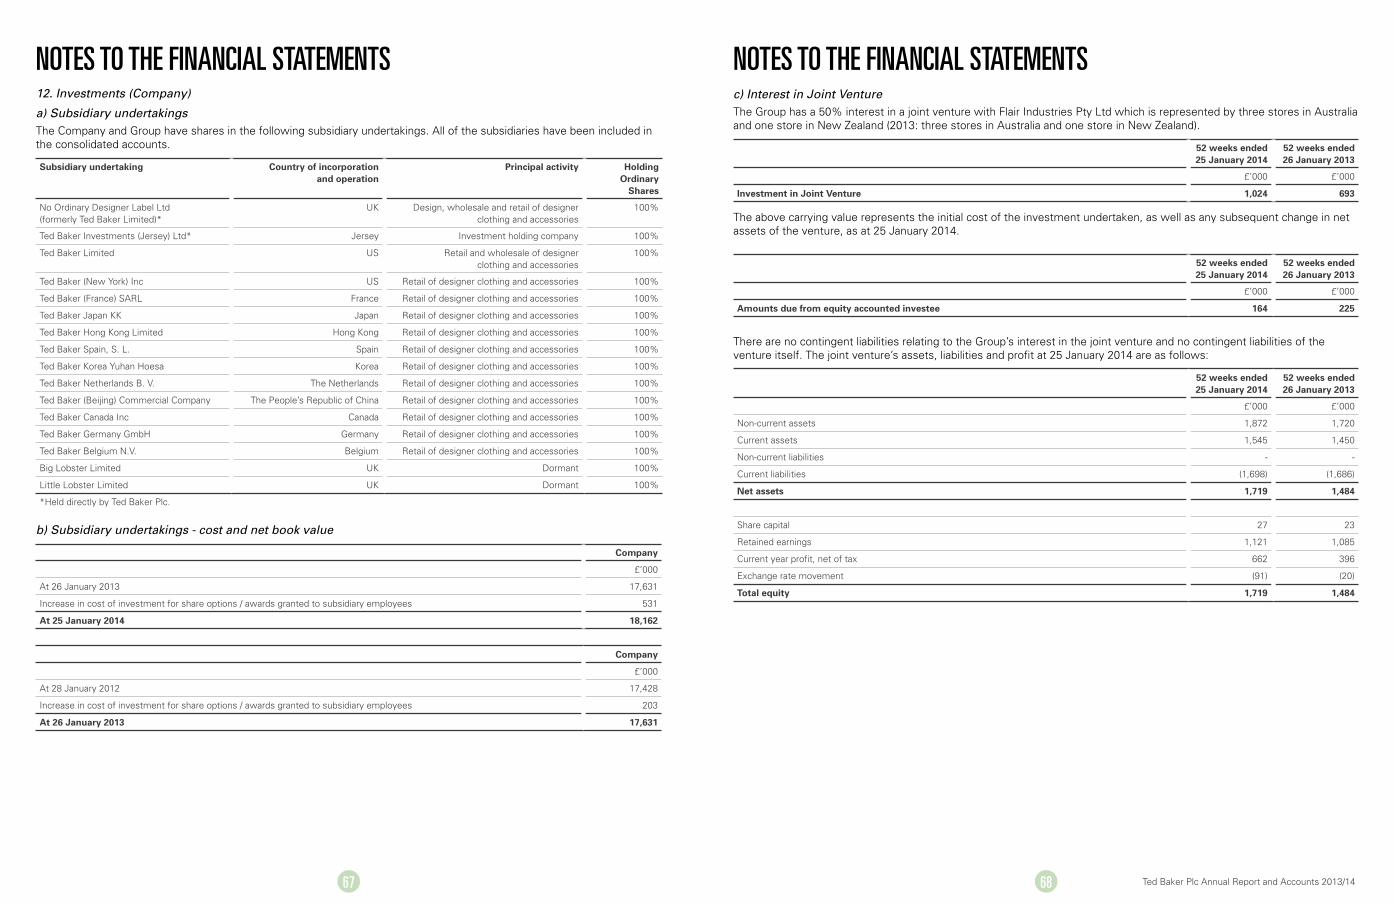
67 68 Ted Baker Plc Annual Report and Accounts 2013/14
12. Investments (Company)
a) Subsidiary undertakingsThe Company and Group have shares in the following subsidiary undertakings. All of the subsidiaries have been included in the consolidated accounts.
b) Subsidiary undertakings - cost and net book value
c) Interest in Joint VentureThe Group has a 50% interest in a joint venture with Flair Industries Pty Ltd which is represented by three stores in Australia and one store in New Zealand (2013: three stores in Australia and one store in New Zealand).
Subsidiary undertaking Country of incorporation and operation
Principal activity Holding Ordinary
Shares
No Ordinary Designer Label Ltd (formerly Ted Baker Limited)*
UK Design, wholesale and retail of designer clothing and accessories
100%
Ted Baker Investments (Jersey) Ltd* Jersey Investment holding company 100%
Ted Baker Limited US Retail and wholesale of designer clothing and accessories
100%
Ted Baker (New York) Inc US Retail of designer clothing and accessories 100%
Ted Baker (France) SARL France Retail of designer clothing and accessories 100%
Ted Baker Japan KK Japan Retail of designer clothing and accessories 100%
Ted Baker Hong Kong Limited Hong Kong Retail of designer clothing and accessories 100%
Ted Baker Spain, S. L. Spain Retail of designer clothing and accessories 100%
Ted Baker Korea Yuhan Hoesa Korea Retail of designer clothing and accessories 100%
Ted Baker Netherlands B. V. The Netherlands Retail of designer clothing and accessories 100%
Ted Baker (Beijing) Commercial Company The People’s Republic of China Retail of designer clothing and accessories 100%
Ted Baker Canada Inc Canada Retail of designer clothing and accessories 100%
Ted Baker Germany GmbH Germany Retail of designer clothing and accessories 100%
Ted Baker Belgium N.V. Belgium Retail of designer clothing and accessories 100%
Big Lobster Limited UK Dormant 100%
Little Lobster Limited UK Dormant 100%
*Held directly by Ted Baker Plc.
Company
£’000
At 26 January 2013 17,631
Increase in cost of investment for share options / awards granted to subsidiary employees 531
At 25 January 2014 18,162
Company
£’000
At 28 January 2012 17,428
Increase in cost of investment for share options / awards granted to subsidiary employees 203
At 26 January 2013 17,631
52 weeks ended 25 January 2014
52 weeks ended 26 January 2013
£’000 £’000
Investment in Joint Venture 1,024 693
The above carrying value represents the initial cost of the investment undertaken, as well as any subsequent change in net assets of the venture, as at 25 January 2014.
There are no contingent liabilities relating to the Group’s interest in the joint venture and no contingent liabilities of the venture itself. The joint venture’s assets, liabilities and profit at 25 January 2014 are as follows:
52 weeks ended 25 January 2014
52 weeks ended 26 January 2013
£’000 £’000
Amounts due from equity accounted investee 164 225
52 weeks ended 25 January 2014
52 weeks ended 26 January 2013
£’000 £’000
Non-current assets 1,872 1,720
Current assets 1,545 1,450
Non-current liabilities - -
Current liabilities (1,698) (1,686)
Net assets 1,719 1,484
Share capital 27 23
Retained earnings 1,121 1,085
Current year profit, net of tax 662 396
Exchange rate movement (91) (20)
Total equity 1,719 1,484
NOTES TO THE FINANCIAL STATEMENTS NOTES TO THE FINANCIAL STATEMENTS

69 70 Ted Baker Plc Annual Report and Accounts 2013/14
13. Deferred tax assets and liabilities 15. Trade and other receivables
16. Derivative financial instruments
18. Trade and other payables
52 weeks ended 25 January 2014
52 weeks ended 26 January 2013
£’000 £’000
Deferred tax asset / (liability) on UK operations arising from:
Assets
Share based payments 1,427 1,727
Derivative financial instruments 463 -
Other 185 -
Liabilities
Property, plant and equipment (232) (155)
Derivative financial instruments - (27)
Other* - (2,042)
Net deferred tax asset/ (liability) 1,843 (497)
Deferred tax asset on foreign operations arising from:
Foreign trading losses 1,557 4.443
Inventory 654 438
Property, plant and equipment (122) (524)
Other 518 166
Net deferred tax asset 2,607 4,523
* Other includes a deferred tax liability, which unwound during the year ended January 2014, for UK tax payable on US operations for which no double tax relief would have been available.
52 weeks ended 25 January 2014
52 weeks ended 26 January 2013
£’000 £’000
Raw materials and packaging 5,736 4,027
Work in progress 922 935
Finished goods and goods for resale 73,774 62,711
80,432 67,673
Cost of inventories recognised as an expense 110,658 79,939
Inventories written down and recognised as an expense in the period 2,317 1,744
Recognition of deferred tax assets is based on the generation of future taxable profits that will allow utilisation of losses.
Deferred tax assets are only recognised on the foreign trading losses when these businesses pass their development phase and when management considers it probable that future taxable profits will be available against which they can be utilised.
The tax effect of the unused cumulative tax losses for which no deferred tax asset has been recognised in the balance sheet is £ 2,120,000 (2013: £2,200,000).
14. Inventories
Derivative financial instruments are used to hedge exposure to fluctuations in foreign exchange rates that arise in the normal course of the Group’s business.
The ineffective portion recognised in the income statement that arises from cash flow hedges amounts to a loss of £nil (2013: £nil).
Gains and losses in equity of forward exchange contracts at 25 January 2014 will be released to the income statement at various dates within 12 months of the balance sheet date, as the hedged forecast transactions occur.
17. Reconciliation of cash and cash equivalents per balance sheet to cash flow statement
Group 25 January 2014
Group 26 January 2013
Company 25 January 2014
Company 26 January 2013
£’000 £’000 £’000 £’000
Trade receivables 23,105 19,529 - -
Amounts owed by Group undertakings - - 39,111 34,376
Prepayments and accrued income 11,688 14,595 - -
34,793 34,124 39,111 34,376
Assets 25 January 2014
Liabilities 25 January 2014
Assets 26 January 2013
Liabilities 26 January 2013
£’000 £’000 £’000 £’000
Forward foreign exchange contracts 499 (3,118) 544 (269)
Group 52 weeks ended
25 January 2014
Group 52 weeks ended
26 January 2013
Company 52 weeks ended
25 January 2014
Company 52 weeks ended
26 January 2013
£’000 £’000 £’000 £’000
Cash and cash equivalents per balance sheet 28,521 9,823 440 440
Borrowings per balance sheet (37,282) (19,862) - -
Net cash and cash equivalents per cash flow statement (8,761) (10,039) 440 440
Group 25 January 2014
Group 26 January 2013
Company 25 January 2014
Company 26 January 2013
£’000 £’000 £’000 £’000
Trade payables 22,049 22,097 - -
Accruals and deferred income 16,901 13,111 12 12
Other taxes and social security 6,339 5,585 - -
45,289 40,793 12 12
NOTES TO THE FINANCIAL STATEMENTS NOTES TO THE FINANCIAL STATEMENTS

71 72 Ted Baker Plc Annual Report and Accounts 2013/14
19. Capital and reserves
52 weeks ended 25 January 2014
52 weeks ended 26 January 2013
£’000 £’000
Authorised – 80,000,000 ordinary shares of 5p each 4,000 4,000
Allotted, called up and fully paid – 43,880,588 ordinary shares of 5p each (2013: 43,198,033) 2,194 2,160
At 25 January 2014, the Ted Baker Group Employee Benefit Trust (“Employee Trust”) and the Ted Baker 1998 Employee Benefit Trust (“1998 Trust”) did not hold any ordinary shares in Ted Baker Plc (2013: Employee Trust - £nil, 1998 Trust - £nil).
The Company held 231,495 shares in treasury at 25 January 2014 (2013: 608,991).
Other reserves and retained earningsOther reserves and retained earnings include the following reserve accounts:
Cash flow hedging reserveThe effective portion of financial instruments that is designated as hedging instruments and is documented as part of an effective hedge of future cash flows is recognised directly in equity and recycled to the income statement when the underlying cash flows occur, or are no longer expected to occur. At 25 January 2014 the change in fair value of financial instruments that are designated as hedging instruments recorded in equity was -£1,850,000 (2013: £91,000).
Translation reserveThe translation reserve comprises all foreign exchange differences arising from the translation of the Group’s Financial Statements of foreign operations.
Other reserves - CompanyThis reserve relates to the premium on equity consideration used in the acquisition of a subsidiary, No Ordinary Designer Label Limited, by Ted Baker Plc in 1997, which is classified within Other Reserves under the Companies Act. This reserve also includes the cost of share options and awards granted to subsidiary employees of the parent company. This reduction in other reserves is reflected in retained earnings in the Group Statement of Changes in Equity.
20. Share based payments
Sharesave SchemeShare options are granted at an option price equal to 80% of the Company share price at the grant date. The share options vest and are exercisable either three or five years after the date of grant, and they expire six months after the end of the vesting period. The options will also expire if the employee leaves the Group prior to the exercise or vesting date.
Movements in the number of share options outstanding under this scheme and their related weighted average exercise prices are as follows:
The charge for the year to the income statement in respect of Sharesave scheme options amounted to £92,393 (2013: £74,199). The weighted average share price at the date of exercise of share options exercised during the year was 1,650.9p (2013: 909.5p).
Share options and awards outstanding under the Sharesave Scheme at the end of the period were as follows:
The fair value of employee share options under the Sharesave Scheme was calculated using the Black-Scholes model.
Weighted average exercise price
2014
Number of options / awards
2014
Weighted average exercise price
2013
Number of options / awards
2013
At beginning of period 550.8p 131,841 382.4p 164,837
Granted during the period 1,001.0p 49,386 722.0p 53,969
Exercised during the period 433.5p (16,993) 303.0p (72,429)
Lapsed during the period 956.8p (19,282) 512.4p (14,536)
Outstanding at the end of period 872.8p 144,952 550.8p 131,841
Grant date Expiry date Exercise price Fair value at grant date
Number of options/awards
at 25 January 2014
Number of options/awards
at 26 January 2013
27 November 2007 31 January 2014 429.0p 144.6p - 3,916
15 May 2009 1 January 2015 303.0p 84.6p 22,826 22,826
14 May 2010 31 January 2015 432.0p 124.6p - 15,523
14 May 2010 31 January 2017 432.0p 129.4p 4,675 6,257
16 May 2011 1 January 2015 552.0p 168.8p 23,108 25,327
16 May 2011 1 January 2017 552.0p 189.0p 6,480 7,318
17 May 2012 1 January 2016 722.0p 193.0p 40,525 45,442
17 May 2012 1 January 2018 722.0p 226.3p 5,232 5,232
19 May 2013 1 January 2017 1,001.0p 221.7p 34,951 -
19 May 2013 1 January 2019 1,001.0p 370.9p 7,155 -
144,952 131,841
NOTES TO THE FINANCIAL STATEMENTS NOTES TO THE FINANCIAL STATEMENTS

73 74 Ted Baker Plc Annual Report and Accounts 2013/14
The charge for the year to the income statement in respect of options issued under the LTIP 2013 amounted to £513,990 (2013: nil). Of the 220,226 (2013: nil) options granted in the year, all were outstanding at the year end (2013: nil). In respect of Mr R S Kelvin, who is employed by the Company, there is a charge of £75,079 in the year (2013: nil).
The Monte Carlo valuation methodology has been used as the basis of measuring fair value of the LTIP 2013. The range of inputs into the Monte Carlo model was as follows:
The share price volatility was determined by calculating the historic volatility of the Group’s share price over a time period matching the expected life of the option.
Long-Term Incentive Plan Share awards are made in the form of nil-cost options over ordinary shares in Ted Baker Plc under the Long-Term Incentive Plan 2013 (“LTIP 2013”), which was approved by the shareholders at the general meeting held on 20 June 2013. The options will be exercisable three years after the date of grant subject to the satisfaction of profit before tax per share and share price performance targets, each measured over a three year period. The profit before tax per share target is calibrated so that the percentage of awards that vests is linked to the level of profit growth achieved.
The terms and conditions of the award of the LTIP 2013 grants made during the year ended 25 January 2014 are as follows:
Value Creation Plan Awards of units were made under the Ted Baker 2009 Value Creation Plan (2009 VCP). The grant, subject to the satisfaction of earnings per share, share price and total shareholder return performance targets, converted and gave participants the right to be granted nil-cost options at the end of the performance period. All awards made in August 2009 under the 2009 VCP vested on 13 August 2012 following the achievement of all performance related vesting conditions. Those awards converted into 2,177,115 nil-cost options to acquire ordinary shares in the Company exercisable in two tranches: 50% in October 2012 and 50% in October 2013 subject to the participants being employed by the Group at those dates.
The charge to the income statement for the year ended 25 January 2014 for 2009 VCP awards amounted to £nil (2013: £165,541). In respect of Mr R S Kelvin, who is employed by the Company, there is no charge in the period (2013: £37,326).
No further awards were made under the 2009 VCP during the year ended 25 January 2014. As at the year end, 231,495 of the 2009 VCP options remained unexercised.
21. Financial commitments
a) Capital commitmentsThe Group has capital commitments of £7,259,000 at 25 January 2014 (2013: £4,101,000) which were not provided in the Financial Statements.
b) Operating leasesTotal of future lease payments under non-cancellable operating leases are as follows:
The Group leases a number of stores, warehouses and head office facilities under operating leases. The leases are of varied length with the longest lease running until 2031.
Leases of land and buildings are typically subject to rent reviews at specified intervals and provide for the lessee to pay all insurance, maintenance and repair costs.
Certain rental expense is determined on the basis of revenue achieved in specific retail locations and is accrued for on that basis. The total amount paid under these agreements was £26,240,446 (2013: £16,717,562).
c) Pension arrangementsThe Group operates a number of defined contribution schemes for senior management and a stakeholder pension scheme for employees, for which the pension cost charge for the period amounted to £778,000 (2013: £623,000). Contributions totalling £36,854 (2013: £24,741) are included in other receivables at the year end.
Grant date Type of award Number of options Vesting conditions Vesting period
3 July 2013 LTIP 2013 220,226 Profit before tax per share growth of 10-15%
per annum and 10% share price growth over the
vesting period
Up to 100% after 3 years
Share price at grant 1,705.0p
Share price at grant (based on 6 month average) for share price performance condition 1,318.0p
Risk free interest rate 0.73%
Expected life of options 3 years
Share price volatility 29.0%
Dividend yield 1.6%
52 weeks ended 25 January 2014
52 weeks ended 26 January 2013
Weighted average share price 1,090.7p 688.4p
Weighted average exercise price 872.8p 550.8p
Risk free interest rate 0.43%–2.77% 0.59%–4.60%
Expected life of options 3–5 years 3–5 years
Share price volatility 12.4%–29.5% 22.8%–32.1%
Dividend yield 1.84%–4.69% 2.24%–4.69%
52 weeks ended 25 January 2014
52 weeks ended 26 January 2013
£’000 £’000
Within one year 24,656 23,062
Between one and five years 81,202 69,603
Later than five years 53,321 54,988
159,179 147,653
The share price volatility was determined by calculating the historic volatility of the Group’s share price over a time period matching the expected life of the option.
The range of inputs into the Black-Scholes model was as follows:
NOTES TO THE FINANCIAL STATEMENTS NOTES TO THE FINANCIAL STATEMENTS
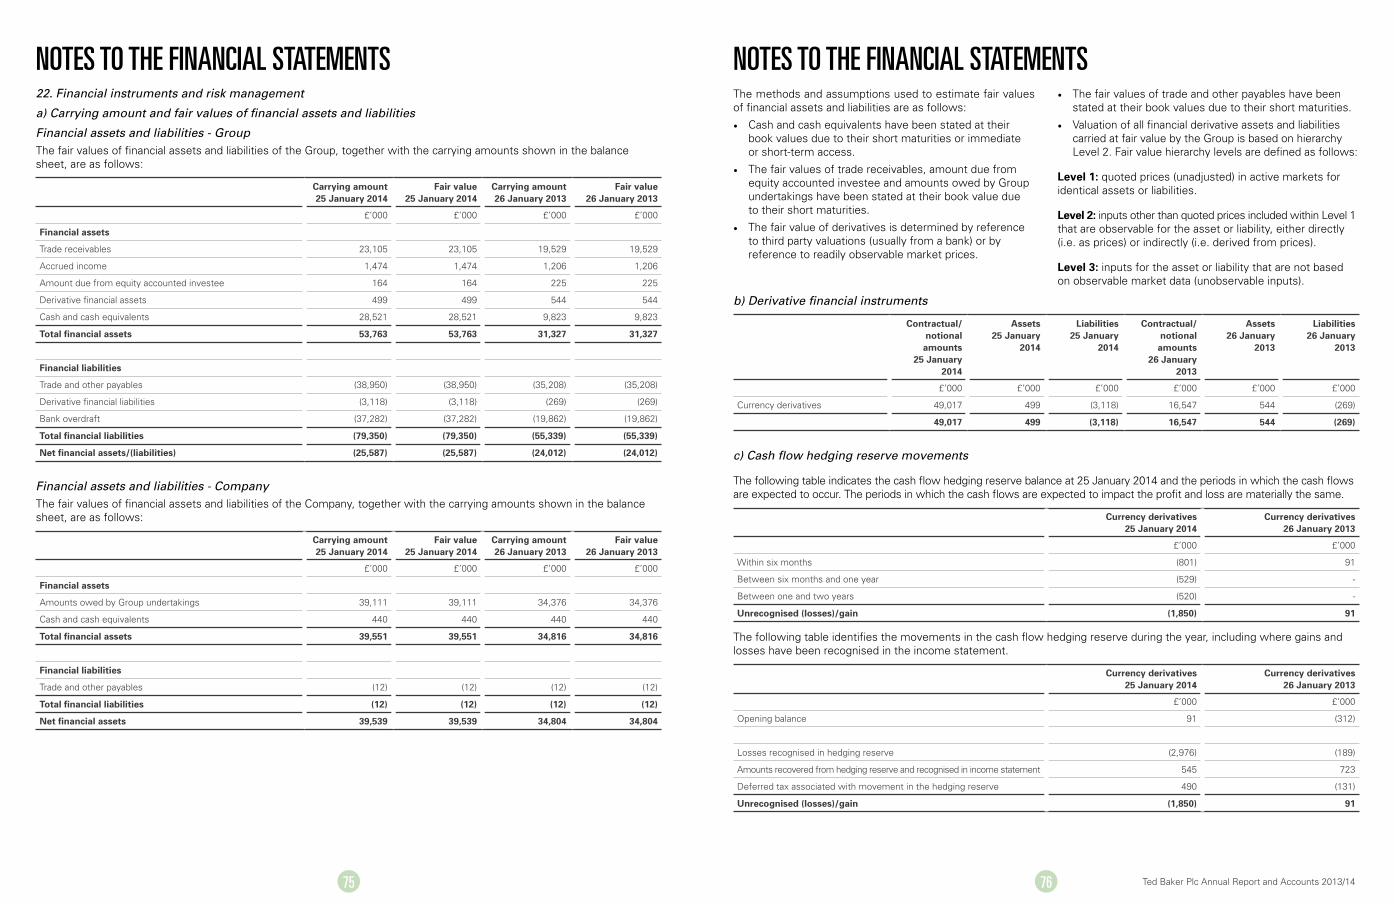
75 76 Ted Baker Plc Annual Report and Accounts 2013/14
22. Financial instruments and risk management
a) Carrying amount and fair values of financial assets and liabilities
Financial assets and liabilities - GroupThe fair values of financial assets and liabilities of the Group, together with the carrying amounts shown in the balance sheet, are as follows:
b) Derivative financial instruments
c) Cash flow hedging reserve movements
The following table indicates the cash flow hedging reserve balance at 25 January 2014 and the periods in which the cash flows are expected to occur. The periods in which the cash flows are expected to impact the profit and loss are materially the same.
The methods and assumptions used to estimate fair values of financial assets and liabilities are as follows:
• Cash and cash equivalents have been stated at their book values due to their short maturities or immediate or short-term access.
• The fair values of trade receivables, amount due from equity accounted investee and amounts owed by Group undertakings have been stated at their book value due to their short maturities.
• The fair value of derivatives is determined by reference to third party valuations (usually from a bank) or by reference to readily observable market prices.
• The fair values of trade and other payables have been stated at their book values due to their short maturities.
• Valuation of all financial derivative assets and liabilities carried at fair value by the Group is based on hierarchy Level 2. Fair value hierarchy levels are defined as follows:
Level 1: quoted prices (unadjusted) in active markets for identical assets or liabilities.
Level 2: inputs other than quoted prices included within Level 1 that are observable for the asset or liability, either directly (i.e. as prices) or indirectly (i.e. derived from prices).
Level 3: inputs for the asset or liability that are not based on observable market data (unobservable inputs).
Financial assets and liabilities - CompanyThe fair values of financial assets and liabilities of the Company, together with the carrying amounts shown in the balance sheet, are as follows:
Carrying amount 25 January 2014
Fair value 25 January 2014
Carrying amount 26 January 2013
Fair value 26 January 2013
£’000 £’000 £’000 £’000
Financial assets
Trade receivables 23,105 23,105 19,529 19,529
Accrued income 1,474 1,474 1,206 1,206
Amount due from equity accounted investee 164 164 225 225
Derivative financial assets 499 499 544 544
Cash and cash equivalents 28,521 28,521 9,823 9,823
Total financial assets 53,763 53,763 31,327 31,327
Financial liabilities
Trade and other payables (38,950) (38,950) (35,208) (35,208)
Derivative financial liabilities (3,118) (3,118) (269) (269)
Bank overdraft (37,282) (37,282) (19,862) (19,862)
Total financial liabilities (79,350) (79,350) (55,339) (55,339)
Net financial assets/(liabilities) (25,587) (25,587) (24,012) (24,012)
Contractual/notional amounts
25 January 2014
Assets 25 January
2014
Liabilities 25 January
2014
Contractual/ notional amounts
26 January 2013
Assets 26 January
2013
Liabilities 26 January
2013
£’000 £’000 £’000 £’000 £’000 £’000
Currency derivatives 49,017 499 (3,118) 16,547 544 (269)
49,017 499 (3,118) 16,547 544 (269)
Carrying amount 25 January 2014
Fair value 25 January 2014
Carrying amount 26 January 2013
Fair value 26 January 2013
£’000 £’000 £’000 £’000
Financial assets
Amounts owed by Group undertakings 39,111 39,111 34,376 34,376
Cash and cash equivalents 440 440 440 440
Total financial assets 39,551 39,551 34,816 34,816
Financial liabilities
Trade and other payables (12) (12) (12) (12)
Total financial liabilities (12) (12) (12) (12)
Net financial assets 39,539 39,539 34,804 34,804
Currency derivatives 25 January 2014
Currency derivatives 26 January 2013
£’000 £’000
Within six months (801) 91
Between six months and one year (529) -
Between one and two years (520) -
Unrecognised (losses)/gain (1,850) 91
Currency derivatives 25 January 2014
Currency derivatives 26 January 2013
£’000 £’000
Opening balance 91 (312)
Losses recognised in hedging reserve (2,976) (189)
Amounts recovered from hedging reserve and recognised in income statement 545 723
Deferred tax associated with movement in the hedging reserve 490 (131)
Unrecognised (losses)/gain (1,850) 91
The following table identifies the movements in the cash flow hedging reserve during the year, including where gains and losses have been recognised in the income statement.
NOTES TO THE FINANCIAL STATEMENTS NOTES TO THE FINANCIAL STATEMENTS

77 78 Ted Baker Plc Annual Report and Accounts 2013/14
d) Financial risk identification and managementThe Group’s multinational operations and debt financing requirements expose it to a variety of financial risks. In the course of its business the Group is exposed to:
• market risk;
• credit risk; and
• liquidity risk.
The Group’s financial risk management process seeks to enable the early identification, evaluation and effective management of key risks facing the business. Risk management policies and systems have been established and are reviewed regularly to reflect changes in the market conditions and the Group’s activities. The Group, through its standards and procedures, aims to develop a disciplined and constructive control environment in which all employees understand their roles and obligations.
i) Market riskMarket risk is the risk that changes in market prices, such as foreign exchange rates, interest rates and equity prices, will affect the Group’s income or the value of its holdings of financial instruments. At the balance sheet date, the only significant market risk to the Group arises from foreign currency risk.
The Group operates internationally and is therefore exposed to foreign currency risk primarily on purchases denominated in US Dollars and Euros.
The Board reviews and agrees policies for managing exchange rate risks on a regular basis. Where appropriate, the Group uses financial instruments to mitigate these risks. All transactions in derivatives, principally forward exchange contracts, are taken solely to manage these risks. No transactions of a speculative nature are entered into. Foreign exchange risk arises when future commercial transactions or recognised assets or liabilities are denominated in a currency that is not the entity’s functional currency.
The Group’s policy is to hedge substantially all the risks of such currency fluctuations by using forward contracts taking into account forecast foreign currency cash inflows and outflows.
The Group’s risk management policy is to hedge the vast majority of anticipated cash flows (mainly purchases of inventory) in each major foreign currency for the subsequent 12 months. The vast majority of projected purchases in each major currency qualifies as “highly probable” forecast transactions for hedge accounting purposes.
Foreign currency riskThe Group operates internationally and is therefore exposed to foreign currency transaction risk, primarily on purchases denominated in US Dollars and Euros. Where appropriate, the Group uses financial instruments to mitigate these risks. The Group also publishes its Financial Statements in Sterling and is therefore exposed to foreign currency translation risks due to movements in foreign exchange rates on the translation of the results and underlying net assets of its foreign operations into Sterling.
Transaction riskCurrency transaction exposure occurs where a business makes sales and purchases in a currency other than its functional currency. It also arises where monetary assets and liabilities of a business are not denominated in its functional currency, and where dividends or surplus funds are remitted from overseas. The Group’s policy is to match transaction exposures wherever possible, and to hedge actual exposures and firm commitments as soon as they occur by using forward foreign exchange contracts. An element of this risk is mitigated by natural hedges as the Group operates internationally and income is generated in the local currencies.
Economic (forecast) riskThe Group also uses forward foreign currency contracts to hedge its exposure to movements in exchange rates on its highly probable forecast foreign currency purchases on a rolling 12 month basis. The Group does not formally define the proportion of highly probable forecast purchases to hedge, but agrees an appropriate percentage on an individual basis with each business by reference to the Group’s risk management policies and prevailing market conditions. The Group documents currency derivatives used to hedge its forecast transactions as cash flow hedges. To the extent that cash flow hedges are effective, gains and losses are deferred in equity until the forecast transaction occurs, at which point the gains and losses are recycled either to the income statement or to the non-financial asset acquired.
The majority of the Group’s currency derivatives have original maturities of less than one year. The Group’s most significant currency transaction exposure is the purchases of inventories which are denominated in a number of currencies, predominantly Euros and US Dollars.
The following significant exchange rates applied during the year:
The analysis of the Group’s foreign currency exposure to financial assets and liabilities by currency of denomination is as follows:
US Dollar 25 January 2014
Euro 25 January 2014
Other 25 January 2014
£’000 £’000 £’000
Financial assets
Trade receivables 2,841 4,353 404
Cash and cash equivalents 2,571 (3,250) 340
5,412 1,103 744
Financial liabilities
Trade and other payables (3,559) (1,979) (1,666)
(3,559) (1,979) (1,666)
1,853 (876) (922)
US Dollar 26 January 2013
Euro 26 January 2013
Other 26 January 2013
£’000 £’000 £’000
Financial assets
Trade receivables 1,893 2,105 72
Cash and cash equivalents 2,608 2,172 (107)
4,501 4,277 (35)
Financial liabilities
Trade and other payables (10,867) (3,132) (1,512)
(10,867) (3,132) (1,512)
(6,366) 1,145 (1,547)
Average rate 25 January 2014
Closing rate 25 January 2014
Average rate 26 January 2013
Closing rate 26 January 2013
US Dollar 1.568 1.659 1.589 1.579
Euro 1.178 1.219 1.233 1.177
NOTES TO THE FINANCIAL STATEMENTS NOTES TO THE FINANCIAL STATEMENTS
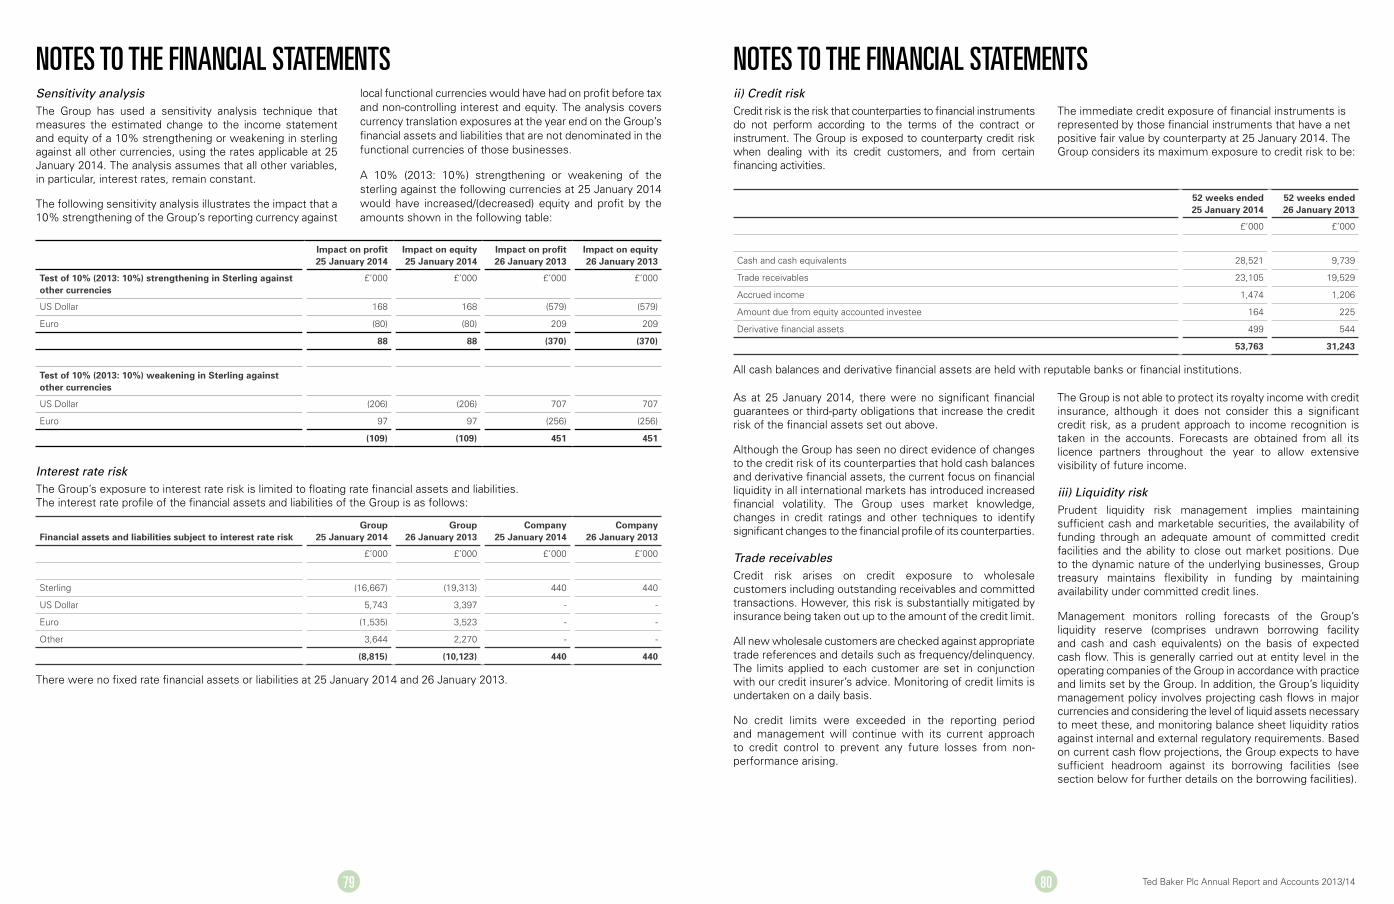
79 80 Ted Baker Plc Annual Report and Accounts 2013/14
Sensitivity analysisThe Group has used a sensitivity analysis technique that measures the estimated change to the income statement and equity of a 10% strengthening or weakening in sterling against all other currencies, using the rates applicable at 25 January 2014. The analysis assumes that all other variables, in particular, interest rates, remain constant.
The following sensitivity analysis illustrates the impact that a 10% strengthening of the Group’s reporting currency against
local functional currencies would have had on profit before tax and non-controlling interest and equity. The analysis covers currency translation exposures at the year end on the Group’s financial assets and liabilities that are not denominated in the functional currencies of those businesses.
A 10% (2013: 10%) strengthening or weakening of the sterling against the following currencies at 25 January 2014 would have increased/(decreased) equity and profit by the amounts shown in the following table:
As at 25 January 2014, there were no significant financial guarantees or third-party obligations that increase the credit risk of the financial assets set out above.
Although the Group has seen no direct evidence of changes to the credit risk of its counterparties that hold cash balances and derivative financial assets, the current focus on financial liquidity in all international markets has introduced increased financial volatility. The Group uses market knowledge, changes in credit ratings and other techniques to identify significant changes to the financial profile of its counterparties.
Trade receivablesCredit risk arises on credit exposure to wholesale customers including outstanding receivables and committed transactions. However, this risk is substantially mitigated by insurance being taken out up to the amount of the credit limit.
All new wholesale customers are checked against appropriate trade references and details such as frequency/delinquency. The limits applied to each customer are set in conjunction with our credit insurer’s advice. Monitoring of credit limits is undertaken on a daily basis.
No credit limits were exceeded in the reporting period and management will continue with its current approach to credit control to prevent any future losses from non-performance arising.
The Group is not able to protect its royalty income with credit insurance, although it does not consider this a significant credit risk, as a prudent approach to income recognition is taken in the accounts. Forecasts are obtained from all its licence partners throughout the year to allow extensive visibility of future income.
iii) Liquidity riskPrudent liquidity risk management implies maintaining sufficient cash and marketable securities, the availability of funding through an adequate amount of committed credit facilities and the ability to close out market positions. Due to the dynamic nature of the underlying businesses, Group treasury maintains flexibility in funding by maintaining availability under committed credit lines.
Management monitors rolling forecasts of the Group’s liquidity reserve (comprises undrawn borrowing facility and cash and cash equivalents) on the basis of expected cash flow. This is generally carried out at entity level in the operating companies of the Group in accordance with practice and limits set by the Group. In addition, the Group’s liquidity management policy involves projecting cash flows in major currencies and considering the level of liquid assets necessary to meet these, and monitoring balance sheet liquidity ratios against internal and external regulatory requirements. Based on current cash flow projections, the Group expects to have sufficient headroom against its borrowing facilities (see section below for further details on the borrowing facilities).
Impact on profit 25 January 2014
Impact on equity 25 January 2014
Impact on profit 26 January 2013
Impact on equity 26 January 2013
Test of 10% (2013: 10%) strengthening in Sterling against other currencies
£’000 £’000 £’000 £’000
US Dollar 168 168 (579) (579)
Euro (80) (80) 209 209
88 88 (370) (370)
Test of 10% (2013: 10%) weakening in Sterling against other currencies
US Dollar (206) (206) 707 707
Euro 97 97 (256) (256)
(109) (109) 451 451
Financial assets and liabilities subject to interest rate riskGroup
25 January 2014Group
26 January 2013Company
25 January 2014Company
26 January 2013
£’000 £’000 £’000 £’000
Sterling (16,667) (19,313) 440 440
US Dollar 5,743 3,397 - -
Euro (1,535) 3,523 - -
Other 3,644 2,270 - -
(8,815) (10,123) 440 440
There were no fixed rate financial assets or liabilities at 25 January 2014 and 26 January 2013.
52 weeks ended 25 January 2014
52 weeks ended 26 January 2013
£’000 £’000
Cash and cash equivalents 28,521 9,739
Trade receivables 23,105 19,529
Accrued income 1,474 1,206
Amount due from equity accounted investee 164 225
Derivative financial assets 499 544
53,763 31,243
All cash balances and derivative financial assets are held with reputable banks or financial institutions.
Interest rate riskThe Group’s exposure to interest rate risk is limited to floating rate financial assets and liabilities. The interest rate profile of the financial assets and liabilities of the Group is as follows:
ii) Credit riskCredit risk is the risk that counterparties to financial instruments do not perform according to the terms of the contract or instrument. The Group is exposed to counterparty credit risk when dealing with its credit customers, and from certain financing activities.
The immediate credit exposure of financial instruments is represented by those financial instruments that have a net positive fair value by counterparty at 25 January 2014. The Group considers its maximum exposure to credit risk to be:
NOTES TO THE FINANCIAL STATEMENTS NOTES TO THE FINANCIAL STATEMENTS
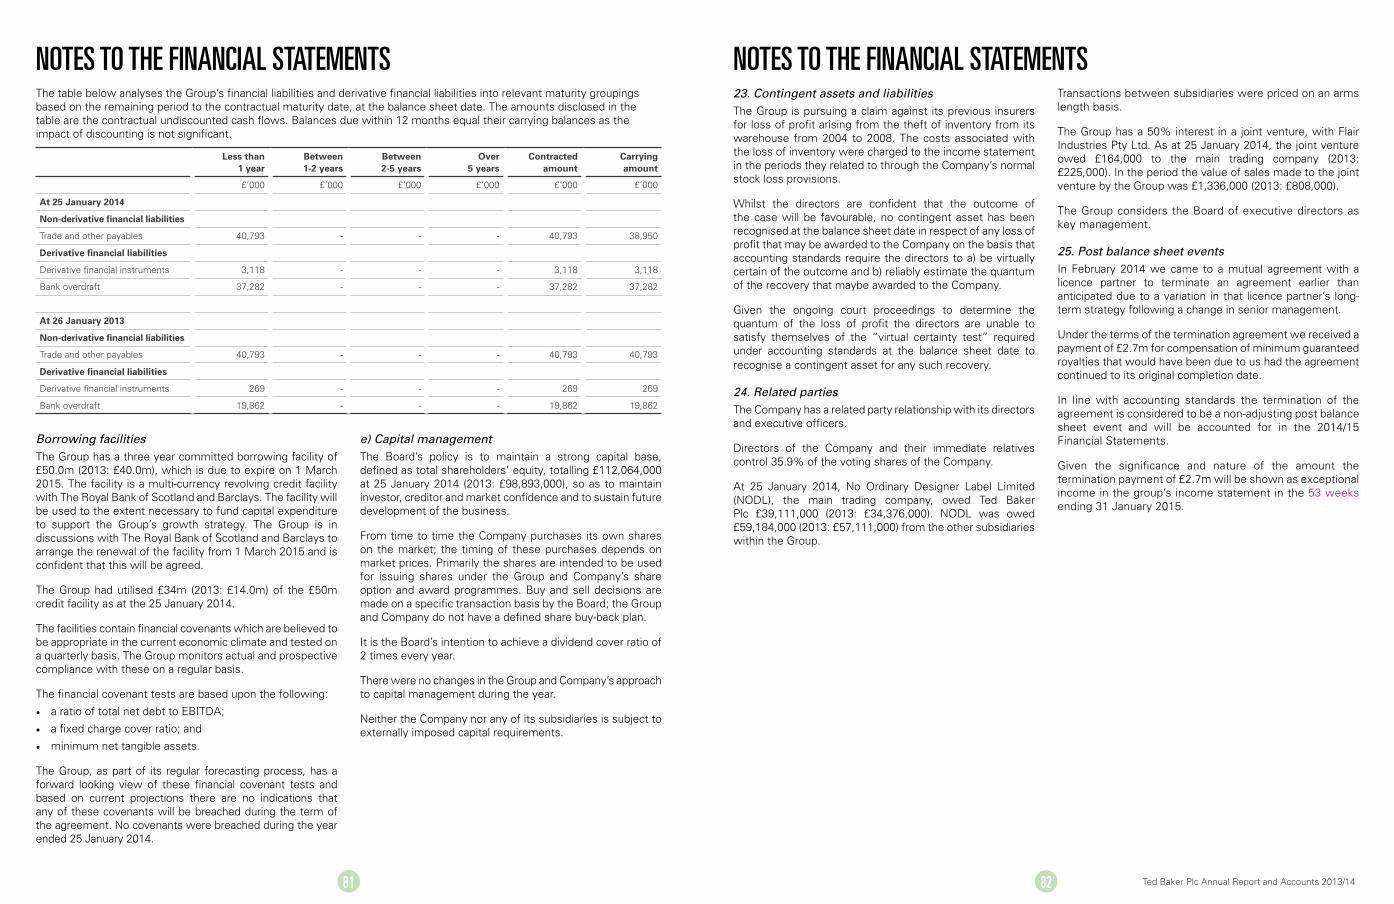
81 82 Ted Baker Plc Annual Report and Accounts 2013/14
23. Contingent assets and liabilitiesThe Group is pursuing a claim against its previous insurers for loss of profit arising from the theft of inventory from its warehouse from 2004 to 2008. The costs associated with the loss of inventory were charged to the income statement in the periods they related to through the Company’s normal stock loss provisions.
Whilst the directors are confident that the outcome of the case will be favourable, no contingent asset has been recognised at the balance sheet date in respect of any loss of profit that may be awarded to the Company on the basis that accounting standards require the directors to a) be virtually certain of the outcome and b) reliably estimate the quantum of the recovery that maybe awarded to the Company.
Given the ongoing court proceedings to determine the quantum of the loss of profit the directors are unable to satisfy themselves of the “virtual certainty test” required under accounting standards at the balance sheet date to recognise a contingent asset for any such recovery.
24. Related partiesThe Company has a related party relationship with its directors and executive officers.
Directors of the Company and their immediate relatives control 35.9% of the voting shares of the Company.
At 25 January 2014, No Ordinary Designer Label Limited (NODL), the main trading company, owed Ted Baker Plc £39,111,000 (2013: £34,376,000). NODL was owed £59,184,000 (2013: £57,111,000) from the other subsidiaries within the Group.
Transactions between subsidiaries were priced on an arms length basis.
The Group has a 50% interest in a joint venture, with Flair Industries Pty Ltd. As at 25 January 2014, the joint venture owed £164,000 to the main trading company (2013: £225,000). In the period the value of sales made to the joint venture by the Group was £1,336,000 (2013: £808,000).
The Group considers the Board of executive directors as key management.
25. Post balance sheet eventsIn February 2014 we came to a mutual agreement with a licence partner to terminate an agreement earlier than anticipated due to a variation in that licence partner’s long- term strategy following a change in senior management.
Under the terms of the termination agreement we received a payment of £2.7m for compensation of minimum guaranteed royalties that would have been due to us had the agreement continued to its original completion date.
In line with accounting standards the termination of the agreement is considered to be a non-adjusting post balance sheet event and will be accounted for in the 2014/15 Financial Statements.
Given the significance and nature of the amount the termination payment of £2.7m will be shown as exceptional income in the group’s income statement in the 53 weeks ending 31 January 2015.
Less than 1 year
Between 1-2 years
Between 2-5 years
Over 5 years
Contracted amount
Carrying amount
£’000 £’000 £’000 £’000 £’000 £’000
At 25 January 2014
Non-derivative financial liabilities
Trade and other payables 40,793 - - - 40,793 38,950
Derivative financial liabilities
Derivative financial instruments 3,118 - - - 3,118 3,118
Bank overdraft 37,282 - - - 37,282 37,282
At 26 January 2013
Non-derivative financial liabilities
Trade and other payables 40,793 - - - 40,793 40,793
Derivative financial liabilities
Derivative financial instruments 269 - - - 269 269
Bank overdraft 19,862 - - - 19,862 19,862
The table below analyses the Group’s financial liabilities and derivative financial liabilities into relevant maturity groupings based on the remaining period to the contractual maturity date, at the balance sheet date. The amounts disclosed in the table are the contractual undiscounted cash flows. Balances due within 12 months equal their carrying balances as the impact of discounting is not significant.
Borrowing facilitiesThe Group has a three year committed borrowing facility of £50.0m (2013: £40.0m), which is due to expire on 1 March 2015. The facility is a multi-currency revolving credit facility with The Royal Bank of Scotland and Barclays. The facility will be used to the extent necessary to fund capital expenditure to support the Group’s growth strategy. The Group is in discussions with The Royal Bank of Scotland and Barclays to arrange the renewal of the facility from 1 March 2015 and is confident that this will be agreed.
The Group had utilised £34m (2013: £14.0m) of the £50m credit facility as at the 25 January 2014.
The facilities contain financial covenants which are believed to be appropriate in the current economic climate and tested on a quarterly basis. The Group monitors actual and prospective compliance with these on a regular basis.
The financial covenant tests are based upon the following:
• a ratio of total net debt to EBITDA;
• a fixed charge cover ratio; and
• minimum net tangible assets.
The Group, as part of its regular forecasting process, has a forward looking view of these financial covenant tests and based on current projections there are no indications that any of these covenants will be breached during the term of the agreement. No covenants were breached during the year ended 25 January 2014.
e) Capital managementThe Board’s policy is to maintain a strong capital base, defined as total shareholders’ equity, totalling £112,064,000 at 25 January 2014 (2013: £98,893,000), so as to maintain investor, creditor and market confidence and to sustain future development of the business.
From time to time the Company purchases its own shares on the market; the timing of these purchases depends on market prices. Primarily the shares are intended to be used for issuing shares under the Group and Company’s share option and award programmes. Buy and sell decisions are made on a specific transaction basis by the Board; the Group and Company do not have a defined share buy-back plan.
It is the Board’s intention to achieve a dividend cover ratio of 2 times every year.
There were no changes in the Group and Company’s approach to capital management during the year.
Neither the Company nor any of its subsidiaries is subject to externally imposed capital requirements.
NOTES TO THE FINANCIAL STATEMENTS NOTES TO THE FINANCIAL STATEMENTS
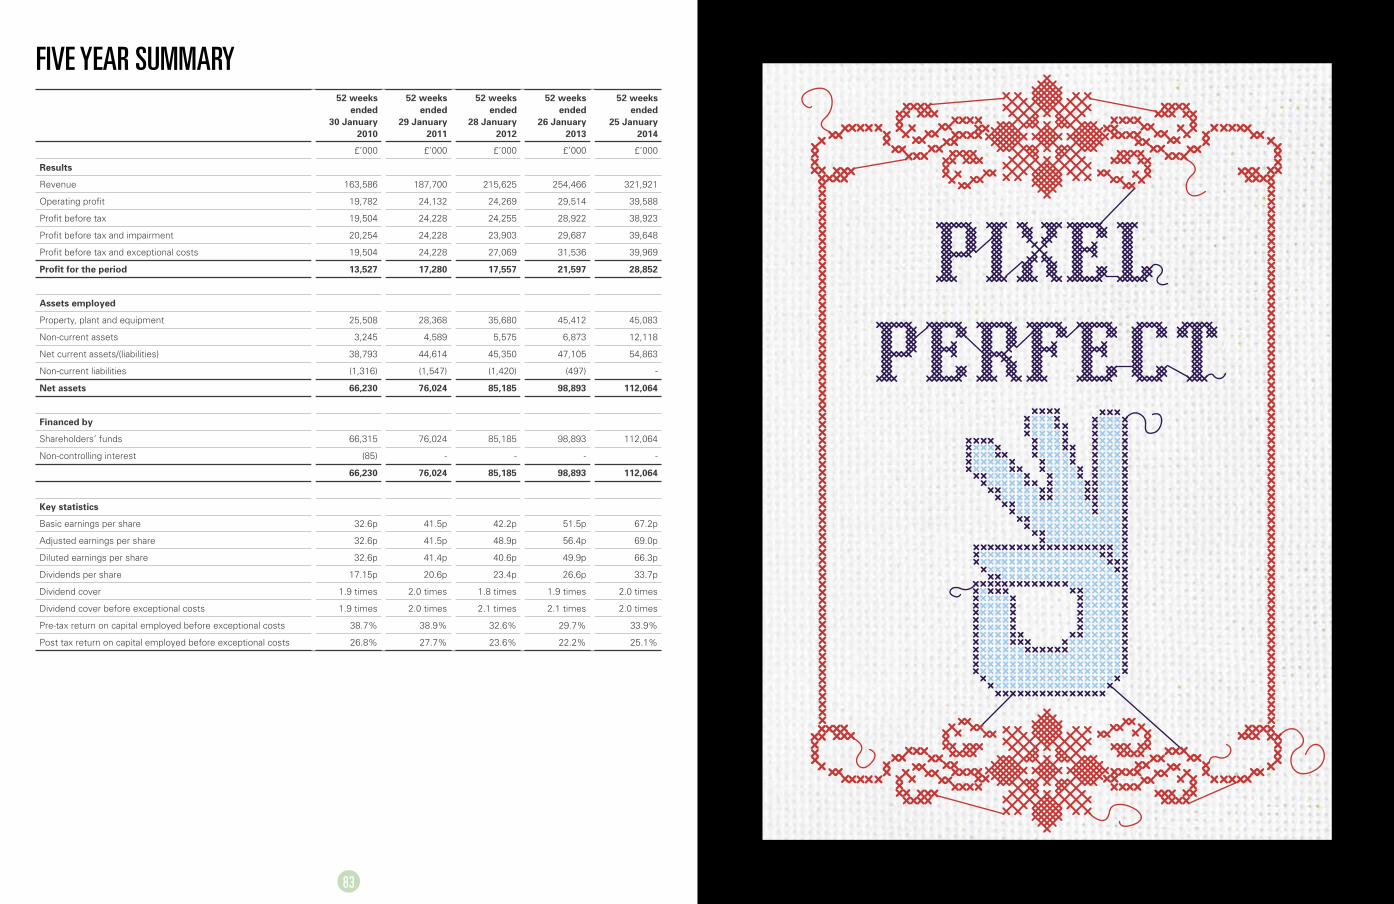
83
FIVE yEAR SUMMARy52 weeks
ended 30 January
2010
52 weeks ended
29 January 2011
52 weeks ended
28 January 2012
52 weeks ended
26 January 2013
52 weeks ended
25 January 2014
£’000 £’000 £’000 £’000 £’000
Results
Revenue 163,586 187,700 215,625 254,466 321,921
Operating profit 19,782 24,132 24,269 29,514 39,588
Profit before tax 19,504 24,228 24,255 28,922 38,923
Profit before tax and impairment 20,254 24,228 23,903 29,687 39,648
Profit before tax and exceptional costs 19,504 24,228 27,069 31,536 39,969
Profit for the period 13,527 17,280 17,557 21,597 28,852
Assets employed
Property, plant and equipment 25,508 28,368 35,680 45,412 45,083
Non-current assets 3,245 4,589 5,575 6,873 12,118
Net current assets/(liabilities) 38,793 44,614 45,350 47,105 54,863
Non-current liabilities (1,316) (1,547) (1,420) (497) -
Net assets 66,230 76,024 85,185 98,893 112,064
Financed by
Shareholders’ funds 66,315 76,024 85,185 98,893 112,064
Non-controlling interest (85) - - - -
66,230 76,024 85,185 98,893 112,064
Key statistics
Basic earnings per share 32.6p 41.5p 42.2p 51.5p 67.2p
Adjusted earnings per share 32.6p 41.5p 48.9p 56.4p 69.0p
Diluted earnings per share 32.6p 41.4p 40.6p 49.9p 66.3p
Dividends per share 17.15p 20.6p 23.4p 26.6p 33.7p
Dividend cover 1.9 times 2.0 times 1.8 times 1.9 times 2.0 times
Dividend cover before exceptional costs 1.9 times 2.0 times 2.1 times 2.1 times 2.0 times
Pre-tax return on capital employed before exceptional costs 38.7% 38.9% 32.6% 29.7% 33.9%
Post tax return on capital employed before exceptional costs 26.8% 27.7% 23.6% 22.2% 25.1%