Finance Analysis on Ted Baker PLC and SuperGroup Plc
35
PDE 4231 Human and Financial Management in Engineering Group Coursework 1 MIDDLESEX UNIVERSITY LONDON School of Science and Technology PDE 4231 Human and Financial Management in Engineering Group Coursework For the Academic Year 2014-2015 Team Members Rahul S Pawar - M00514164 Kelvin Shoko - M00363602 Rifat Abdul Rahiman – M00514416 Gowtham Srinivasan - M00514456 Bharath Kumar Munusamy - M00508732
-
Upload
rifat-abdul-rahiman -
Category
Economy & Finance
-
view
991 -
download
4
Transcript of Finance Analysis on Ted Baker PLC and SuperGroup Plc

PDE 4231 Human and Financial Management in Engineering Group Coursework 1
MIDDLESEX UNIVERSITY LONDON
School of Science and Technology
PDE 4231 Human and Financial Management in Engineering
Group Coursework
For the Academic Year 2014-2015
Team Members
Rahul S Pawar - M00514164 Kelvin Shoko - M00363602
Rifat Abdul Rahiman – M00514416 Gowtham Srinivasan - M00514456
Bharath Kumar Munusamy - M00508732

2PDE 4231 Human and Financial Management in Engineering Group Coursework
Contents
Introduction.....................................................................................................................................................4History and Background...........................................................................................................................5Trend Analysis..............................................................................................................................................8
Super Group Income Statement.....................................................................................................8Super Group balance sheet..............................................................................................................9Ted Baker Income Statement.......................................................................................................10Ted Baker balance sheet.................................................................................................................11Bar Graph - Company comparison............................................................................................12
Ratio Analysis.............................................................................................................................................13Findings Of Ratio Analysis..................................................................................................................13
1. Profitability Ratio:...........................................................................................................................13(a) Gross Profit Margin..................................................................................................................13(b) Net Profit Margin:......................................................................................................................14(c) Return on Capital Employed:..............................................................................................152. Liquidity Ratios................................................................................................................................15(a) Current Ratio:..............................................................................................................................16(b) Quick Ratio (Acid Test):.........................................................................................................163. Efficiency Ratio:..............................................................................................................................17(a) Trade Receivable Days:........................................................................................................17(b) Creditors Payment Period:...................................................................................................184. Financing Ratios:............................................................................................................................19(a) Gearing Ratio:.............................................................................................................................19(b) Interest Cover:............................................................................................................................20(c) Earning Per Share (EPS):.....................................................................................................21(d) Diluted EPS:.................................................................................................................................215. Investment Ratios:.........................................................................................................................22(a) Price Earning Ratio (P/E):....................................................................................................22(b) Dividend Coverage Ratio:.....................................................................................................23(c) Dividend Yield:............................................................................................................................24
Share Price Analysis...............................................................................................................................25CVP Analysis..............................................................................................................................................27
Assumptions:.........................................................................................................................................27WORKINGS AND GRAPHS..................................................................................................................27
SuperGroup PLC 2012.....................................................................................................................27SuperGroup PLC 2013.....................................................................................................................28

PDE 4231 Human and Financial Management in Engineering Group Coursework 3
TED Baker PLC 2012........................................................................................................................29TED Baker PLC 2013.......................................................................................................................29TED Baker PLC 2014........................................................................................................................29
DESCRIPTION.......................................................................................Error!Bookmarknotdefined.Comparison......................................................................................................................................................31Conclusion........................................................................................................................................................31
Financial News Review.........................................................................................................................32Conclusion....................................................................................................................................................33
List of Graphs. 1. Trend Analysis…………………………………………………………………………..12 2. Gross Profit Margin……………………………………………………………………..14 3. Net Profit Margin………………………………………………………………………...14 4. Return on Investment Employed………………………………………………………15 5. Current Ratio…………………………………………………………………………….16 6. Quick Ratio (Acid Test).………………………………………………………………..17 7. Trade Receivable Days………………………………………………………………...17 8. Creditors Payment Period……………………………………………………………...18 9. Inventory Turnover Days……………………………………………………………….19 10. Gearing Ratio…………………………………………………………………………..20 11. Interest Cover………………………………………………………………………….20 12. EPS……………………………………………………………………………………..21 13. Diluted EPS…………………………………………………………………………….22 14. P/E Ratio………………………………………………………………………………..23 15. Dividend Coverage Ratio………………………………………………………..……23 16. Dividend Yield………………………………………………………………………….24 17. Share Price of Ted Baker…………………………………………………………….25 18. Share Price of SuperGroup…………………………………………………………..26 19. Break Even Point for SuperGroup 2012……………………………………………27 20. Break Even Point for SuperGroup 2013……………………………………………28 21. Break Even Point for SuperGroup 2014……………………………………………28 22. Break Even Point for Ted Baker 2012…………………………………………...…29 23. Break Even Point for Ted Baker 2013……………………………………………...29 24. Break Even Point for Ted Baker 2014…………………………………………...…29 List of Tables. 1. SuperGroup Income Statement……………………………………………………….08 2. SuperGroup Balance Sheet……………………………………………………………09 3. Ted Baker Income Statement………………………………………………………....10 4. Ted Baker Balance Sheet…………………………………………………...…………11 5. CVP Analysis of SuperGroup……………………………………………………….....28 6. CVP Analysis of Ted Baker…………………………………………………………….30

4PDE 4231 Human and Financial Management in Engineering Group Coursework
Introduction This Report provides findings obtained from in-depth Financial Analysis, Financial Press Review and Share Market Review for Ted Baker PLC and SuperGroup Plc. Both the companies are lifestyle companies concentrating specially on the Clothing Sector. The Report focuses on the examination of financial position and performance of both the companies, which include evaluation of Profitability ratios, Efficiency ratios, liquidity ratios, Gearing ratios and Investment ratios based on the data available from the Company’s Annual Report from 2012 to 2014 and the finally a summary of findings is given.

PDE 4231 Human and Financial Management in Engineering Group Coursework 5History and Background
Ted Baker PLC: Established in 1988 as a shirting specialist of some repute, Ted Baker London is a global lifestyle brand offering menswear, women’s wear, accessories and everything in between. A quintessentially British brand, Ted Baker is famed for its quirky yet commercial fashion offering, high quality design detailing and distinctive use of pattern and color. The brand’s unconventional approach to fashion, irreverent sense of humor and, above all, unswerving attention to detail appeals to style-conscious men and women who trust Ted to deliver that certain something out of the ordinary. In order to protect the ethos and persona for which we have gained an enviable reputation (Ted Baker, 2014. Soft wear, Annual Report 2013-2014, London: Ted Baker) It’s impossible to know the history of Ted Baker without studying the man behind the name. Raymond Stuart Kelvin was born in 1955 in North London. In 1988, at the age of 33, Kelvin opened his first clothing shop in Glasgow, and named it Ted Baker. The fledgling Ted Baker sold only men’s shirts at that time. Kelvin offered free dry cleaning for every shirt he sold. Unable to afford expensive advertising, Kelvin relied upon word of mouth for his store’s exposure. (Larsen, L. 2010) Two years later, in 1990, Kelvin bought a store in Covent Garden, and by 1992 had stores in Soho, London, Leeds and Nottingham. It was at this time that Ted Baker became a privately owned company. As Ted Baker fashion grew in popularity, Kelvin saw fit to add a line of women’s clothing in 1995. Soon after, Teddy Boy was introduced—clothing for boys between the ages of five and twelve. Kelvin took a back seat to the elusive Ted Baker, watching with amused fascination as Ted Baker fans fleshed in the fictitious character. Believed to be an adventurous, daring and dashing fellow, Ted Baker powerfully drives the allure for Kelvin’s creations. (Larsen,L. 2010) Today Ted Baker stores have expanded to the United States, Hong Kong, Dubai, Australia and beyond. New lines of fashion include Teddy Girl, clothing for girls, Ted Baker Footwear, sunglasses and eyewear, perfumes, jeans and Born—a casual menswear collection. The history of Ted Baker is still in the making, with future plans for more stores, more product lines and more success. (Larsen, L. 2010) With 110 stores/outlets and 252 concessions in a total of 24 countries (as at 25 January 2014), the company continues to develop its presence in new and existing markets and focus on the long-term development of Ted Baker as a global lifestyle brand. (Ted Baker, 2014. Soft wear, Annual Report 2013-2014, London: Ted Baker) Board of Directors:
1. David Alan Bernstein, Non-Executive Chairman. 2. Raymond Stuart kelvin, Chief Executive. 3. Lindsay Dennis Page, Ma, Finance Director. 4. Ronald Stewart, Non-Executive Director. 5. Anne Sheinfield, Non-Executive Director. 6. Andrew Jennings, Non-Executive Director.

6PDE 4231 Human and Financial Management in Engineering Group Coursework
SuperGroup PLC:
SuperGroup began with the founding of Cult Clothing in 1985 by Julian Dunkerton and a former business partner. The original Cult Clothing store in Cheltenham led to the creation of others across the country, many of them in university towns. (SuperGroup.PLC, 12 December 2012) In 2003, Julian joined forces with designer James Holder, who had previously founded the Bench brand, to develop and create a new in-house brand and Superdry was born. The Superdry brand has since gained both recognition and popularity in the UK and overseas and underpins the growth of the business. (SuperGroup.PLC, 12 December 2012) Following the successful introduction of Superdry into Cult Clothing stores a second store format, branded as Superdry and dedicated to selling Superdry products was launched in 2004. Recognizing the potential of the Superdry brand at home and abroad, and with the introduction of a new partner, Theo Karpathios, the Group’s UK and international wholesale business was initiated. (Theo resigned from the business in August 2012) (SuperGroup.PLC, 12 December 2012) In March 2010 the business undertook a successful flotation on the London Stock Exchange to launch the next stage of its global growth and expansion. And In February 2011 SuperGroup announced the acquisition of its France and Benelux franchise and distribution partner, CNC Collections BVBA (SuperGroup Europe BVBA), assisting SuperGroup to further accelerate its European franchise rollout.(SuperGroup.PLC, 12 December 2012) The Company predominantly targets the younger end of the fashion market; specifically designing for men and women aged between 15 and 25 years old with affordable, premium-quality clothing, accessories, footwear and cosmetics. Increasingly, the brand appeals to a much broader age group as it develops the breadth and nature of its product ranges. Already well established in the UK, its home market, the Company and its subsidiaries (the “Group”) also operate a significant and continually expanding international business which is developed through websites, wholesale partners, a network of franchise stores and, increasingly, its own stores. (SuperGroup, 2014. Annual Report 2013-2014, London: SuperGroup)
The business has expanded quickly over the 11 years of its life, becoming a truly international brand as it has done so, and there has been no slowdown over the past 12 months as the Group has added over 100 new stores to its portfolio around the world taking its total number of stores to 516, with a physical presence in 46 countries.

PDE 4231 Human and Financial Management in Engineering Group Coursework 7At the end of the 2014 financial year (“2014” or “FY14”) the Group’s direct customer channels consisted of:
• 139 of its own stores;
• 74 concessions;
• 185 franchised stores;
• 23 licensed stores;
• 95 shop-in-shop stores; and
• 18 international websites.
In addition to those shops and websites, the Group has a successful and growing wholesale business. In the UK it sells directly to third party retailers but internationally it predominantly uses a distribution network, taking advantage of local knowledge and expertise in each country. (SuperGroup, 2014. Annual Report 2013-2014, London: SuperGroup)
Superdry focuses on high-quality, contemporary products that, in varying degrees, fuse vintage Americana and Japanese-inspired graphics with a British style. They are characterized by:
• quality fabrics with authentic vintage washes; • unique vintage detailing;
• world leading hand-drawn graphics; and
• tailored fits with diverse styling.
The Board of Directors: The Board of Directors for SuperGroup PLC is currently made up of a Non-executive Chairman, a Group Chief Executive Officer, 5 Executive Directors and 3 Non-executive Directors. On appointment the Non-executive Directors meet the criteria for independence.
The Board is as follows
1. Peter Bamford, Chairman 2. Euan Sutherland, Group Chief Executive Officer 3. Julian Dunkerton, Founder, Product & Brand Director 4. Susanne Given, Chief Operating Officer 5. James Holder, Founder, Brand and Design Director 6. Hans Schmitt, Managing Director International & Wholesale. 7. Shaun Wills, Chief Financial Officer 8. Keith Edelman, Senior Independent Non-executive Director 9. Ken McCall, Independent Non-executive Director 10. Minnow Powell, Independent Non-executive Director

8PDE 4231 Human and Financial Management in Engineering Group Coursework
Trend Analysis What is Trend Analysis? Trend analysis is the practice of collecting information and attempting to spot a pattern or trend in the same metric historically, either by examining it in tables or charts. Often this trend analysis is used to predict or inform decisions around future events. (Boundless, 2014)
Super Group Income Statement
Formula used to find amount change: Current year amount - Base year amount Formula used to find percentage change: (Current year amount - Base year
amount) divide by base year amount
2012
2013
2014
Amount
change in million
Percentage
change
Turnover 313.8 360.4 430.9 46.6 (2013)
70.5 (2014)
14.9% (2013)
19.6% (2014)
Cost of sales 135.0 150.4 173.6 15.4 (2013)
23.2 (2014)
11.4% (2013)
15.4% (2014)
Gross margin 178.8 209.6 257.3 30.8 (2013)
47.7 (2014)
17.2% (2013)
22.8% (2014)
Selling, general and
administrative expenses
138.8 163.3 200.5 24.5 (2013)
37.2 (2014)
17.7% (2013)
22.8% (2014)
Other gains and losses
2.7 5.2 4.7 2.5 (2013)
0.5 (2014)
92.6% (2013)
9.6% (2014
Operating income
37.3 41.1 52.4 3.8 (2013)
11.3 (2014)
10.2% (2013)
27.5% (2014)
Super Group has been able to maintain a consist flow of progression. Each year the turnover has been increasing because of the addition of new stores nationwide and internationally. Also the group has invested in significant programme of infrastructure developments which are aimed at supporting future growth and efficiencies. Even though like for like sales growth did not meet expectations that did not affect the financial performance for the year as a whole as it was in line with market expectations and produced good movements on the Group's key performance indicators. "Whilst there are still more improvements to make, these initial investments have delivered a solid platform for the Group's growth aspirations, improved its processes and controls, and will provide cost savings and efficiency gains from financial year 2015 onwards". (Peter Bamford, 2014) Revenue rose by 19.6% to £430.9m (2013: £360.4m). The Group gross margin rose 140 basis points to 22.8% (2013: 17.7%) showing lower clearance activity, the increasing mix of international business, and the benefits of increasing scale and purchasing power.
Table 1 – SuperGroup Income Statement

PDE 4231 Human and Financial Management in Engineering Group Coursework 9
Super Group balance sheet
2012
2013
2014
Amount
change in millions
Percentage
change
Total non- current assets
142.5 139.2 147.7 3.3 (2013)
8.5 (2014)
2.3% (2013)
6.1% (2014)
Total current assets
129.0 174.3 218.3 45.3 (2013)
44 (2014)
35.1% (2013)
25.2% (2014)
Total non- current
liabilities
34.3 32.2 31.7 2.1 (2013)
0.5 (2014)
6.1% (2013)
1.6% (2014)
Total liabilities 52.2 57.4 73.1 5.2 (2013)
15.7 (2014)
10% (2013)
27.4% (2014)
Once again the group has been able to generate a consist flow of income from its assets. According to the information provided in the annual report year on year increase is based on increase in revenues and underlying profit. Also the improvement of working capital management is another reason why the value of assets has been improving yearly. There has been a increase in investing activities driven by the capital expenditure due to the opening of a 100,000 square feet of new retail space, opening of the new distribution centre, and information technology investments. If the company manages to maintain this yearly progress they will continue to produce a good balance sheet that will enable them to invest in new business opportunities and infrastructure growth. The value of property, plant and equipment increased by 10% in 2014 from £63.7m the previous year to £70.3m. However £21.8m in 2014 was taken from capital additions and relates to leasehold improvements in the company. Balance is made up of computer equipment, fixture and fittings and furniture which all add up to £5million. Intangible assets consist of lease premiums, goodwill, trademarks and distribution agreements. The website and computer software was valued at £46.7million at the year end compared to £41.5million in 2013. After a successful year the company's reputation value (gooodwill) went up £0.7m and also the value of intangibles increased. "Investment in inventories, trade receivables and trade payables decreased by 0.7% during the year to £67.9m (2013: £68.4m) and as a proportion of Group revenue was 15.8% (2013: 19.0%). Group inventory increased to £77.8m (2013: £72.5m), up 7.3%. The increase in inventory is a result of the increase in both retail space and sales, offset by a reduction in aged stock. Trade receivables (excluding prepayments and provisions) increased by 14.8% to £32.5m (2013: £28.3m) and were 7.5% (2013: 7.8%) of Group revenue. This is broadly in line year-on-year". (Investegate, 2014)
Table 2 – SuperGroup Balance Sheet

10PDE 4231 Human and Financial Management in Engineering Group Coursework
Ted Baker Income Statement
2012
2013
2014
Amount
change in millions
Percentage
change
Turnover 215.625 254.466 321.921 38.841 (2013)
67.455 (2014)
18% (2013)
26.5% (2014) Cost of sales 83.419 95.740 123.451 12.321 (2013)
27.711 (2014)
14.8% (2013)
29% (2014) Gross margin 132.206 158.726 198.47 26.52 (2013)
39.744 (2014)
20.1% (2013)
25% (2014)
Distribution costs
82.358 101.357 123.211 18.999 (2013)
21.854 (2014)
23.1% (2013)
21.6% (2014) Administrative
expenses 29.640 32.984 43.381 3.344 (2013)
10.397 (2014)
11.3% (2013)
31.5% (2014)
Exceptional costs
2.814 2.614 1.046 0.2 (2013)
1.568 (2014)
7.1% (2013)
60% (2014)
Licence income
6.733 7.509 8.888 0.776 (2013)
1.379 (2014)
11.4% (2013)
18.4% (2014)
Other operating expense
0.142 0.234 0.132 0.092 (2013)
0.102 (2014)
64.7% (2013)
43.6% (2014)
Operating income
10.519 15.596
21.812 5.077 (2013)
6.216 (2014)
48.3% (2013)
38.9% (2014)
Ted Baker continue to perform well each year in the trading environment and are focused on the long term progression of the brand globally. Openings of more stores across all markets and investing in newer markets has been the reason why turnover has been healthy each year. They continue to invest in people and infrastructure to support growth of Ted Baker which will bring more revenue in the future. According to the chairman's statement in the annual report "following the successful launch of our e-commerce platform, we will further develop our e-commerce site to provide a more relevant customer experience and advance the local content provided to our European customers including language options specific to key countries." (David Bernstein, 2014) This has been a key factor in the progression of Ted Baker as they have improved their internet sites over the years which makes shopping online easy and attracts more customers, in return brought more revenue. Another reason for progression each year is the opening of further concessions in France and Netherlands. Also the growth in the US played a big part in terms of revenue as three more stores were opened and an e-commerce site was also introduced after it was a success in the UK. Lastly following an expansion in the Asian market in 2013 the company enjoyed more revenue returns from its invest in people and infrastructure but remain focused on building brand awareness in this market as its still developing which shows the company is aware of the mandatory work that needs to done to maintain consist flow of revenue each year.
Table 3 – Ted Baker Income Statement

PDE 4231 Human and Financial Management in Engineering Group Coursework 11
Ted Baker balance sheet
2012
2013
2014
Amount
change in millions
Percentage
change
Total non- current assets
41.255 52.285 57.201 11.03 (2013)
4.916 (2014)
26.7% (2013)
9.4 % (2014)
Total current assets
91.387 112.389 144.409 21.002 (2013)
32.02 (2014)
23% (2013)
28.4% (2014)
Total non- current
liabilities
1.420 0.497 N/A 0.923 (2013) 65% (2013)
Total current liabilities
46.487 65.284 89.546 18.797 (2013)
24.262 (2014)
40.4% (2013)
37.1% (2014)
The value of assets has been increasing consistently each year due to the retail sector performing well with sales up to 14% according to the annual report. Wholesale and licence income also played a part in increasing the value of the company's assets. However as the company is investing in new markets and opening new stores worldwide they have borrowed money to fund and support infrastructure development which has led to liabilities going up each year.
Table 4 – Ted Baker Balance Sheet

12PDE 4231 Human and Financial Management in Engineering Group Coursework
Bar Graph - Company comparison
Graph 1 – Trend Analysis
Looking at the chart both companies have progressed in three years. Both companies saw a gap in the market and decided to invest in new emerging market territories, people and developing infrastructure programs around the world. Also the development of its e-commerce service provided more revenue stream for both companies, which in turn increased the value assets such as goodwill.
£-
£50.00
£100.00
£150.00
£200.00
£250.00
£300.00
£350.00
£400.00
£450.00
£500.00
2012 2013 2014
Inmillions
SuperGroupandTedbaker
SuperGroupTurnover
Tedbakerturnover
SuperGroupassets
Tedbakerassets

PDE 4231 Human and Financial Management in Engineering Group Coursework 13Ratio Analysis
Ratio Analysis of Ted Baker and SuperGroup for the year ending 2012, 2013 and 2014 Ratio Analysis: Over the years, investors and analysts have developed various analytical tools, concepts and techniques to look at the relative qualities and shortcomings of organizations. These tools, concepts and techniques structure the premise of key examination of the fundamentals. Ratio Analysis is a tool that was developed to perform quantitative analysis on numbers found on financial statements. Ratios help link the three financial statements together and offer figures that are comparable between companies and across industries and sectors. Ratio analysis is one of the most widely used fundamental analysis techniques. Ratio Analysis is usually classified into five categories, they are
1. Profitability Ratio. 2. Liquidity Ratio. 3. Efficiency Ratio. 4. Gearing Ratio. 5. Investment Ratio.
Findings Of Ratio Analysis 1. Profitability Ratio: Every firm is most concerned with its profitability. A standout amongst the most regularly used financial ratio analysis is profitability ratio, which is utilized to focus the organization's bottom-line. Profitability measures are imperative to company managers and owners apparently equivalent. If a small business has outside investors who have put their own money into the company, the primary owner certainly has to show profitability to those equity investors. (Bernstein & Wild, 2004) Profitability Ratios are further categorized into. (a) Gross Profit Margin: The gross profit margin looks at cost of goods sold as a percentage of sales This ratio looks at how well an organization controls the expense of its inventory and the manufacturing of its products and accordingly passes on the expenses to its customers. The bigger the gross profit margin, the better for the organization
Gross Profit Margin = Gross Profit x 100 Sales Revenue

14PDE 4231 Human and Financial Management in Engineering Group Coursework
Graph 2 - Gross Profit Margin.
Ted Baker: The gross profit margin for the Group decreased by 0.7% from 62.4% in 2013 to 61.7% in 2014. An increase in the proportion of total sales attributable to the wholesale business. While retail margins were in line, wholesale margins were lower due to a greater proportion of wholesale sales to the territorial license partners, which carry a lower margin. How ever there was increase in the gross profit margin in 2013 from 62.4% to 61.3% in 2012.
SuperGroup: The Group gross margin for 2014 rose to 59.7% from 58.3% reflecting lower clearance activity, the increasing mix of international business, and the benefits of increasing scale and purchasing power.
(b) Net Profit Margin: When doing a simple profitability ratio analysis, net profit margin is the most often margin ratio used. The net profit margin shows how much of each sales pound shows up as net income after all expenses are paid.
Net Profit Margin = Net Profit x 100 Sales Revenue
Graph 3 - Net Profit Margin.
54.00%
56.00%
58.00%
60.00%
62.00%
64.00%
TedBaker SuperGroup
GrossProfitMargin
0.00%2.00%4.00%6.00%8.00%10.00%12.00%14.00%16.00%18.00%
TedBaker SuperGroup2012 11.20% 16.40%2013 11.40% 14.40%2014 12.00% 10.50%
NetProfitMargin

PDE 4231 Human and Financial Management in Engineering Group Coursework 15Ted Baker: Net Profit Margin for the year 2014 increased to 12% compared to 2013: 11.4% and 2012: 11.2%.
SuperGroup: Net Profit Margin for the year 2014 fell by 3.9% to 10.50% from 14.40% in 2013 and 16.40% in 2012. This shows that the net profit is not doing well, compared to sales after the overheads are taken out.
* For the calculation of the aboved mentioned Net Profit Margin, we have considered the Profit before tax and interest as the Net Profit
(c) Return on Capital Employed: The Return on Capital Employed ratio is perhaps the most important of all the financial ratios to investors in the company. It measures the return on the money the investors have put into the company.
Return on Capital Employed = Operating Profit x 100
Capital Employed (Equity)
Graph 4 - Return On Capital Employed.
Ted Baker: The Return on Capital Employed increased gradually from 2012: 28.00% to 2013: 29.70% and further to 35.30% in 2014. SuperGroup: for the SuperGroup the Return on Capital Employed decreased from 23.50% in 2012 to 2013: 20.10% and to 2014: 15.30%.
2. Liquidity Ratios: A company's liquidity is its ability to meet its near-term
0.00%5.00%10.00%15.00%20.00%25.00%30.00%35.00%40.00%
TedBaker SuperGroup2012 28.00% 23.50%2013 29.70% 20.10%2014 35.30% 15.30%
AxisTitle
Return on Capital Employed

16PDE 4231 Human and Financial Management in Engineering Group Coursework
obligations, and it is a major measure of financial health. Liquidity can be measured through several ratios, but the most commonly used are (a) Current Ratio: The current ratio is the most fundamental liquidity test. It connotes a company's capacity to reach its transient liabilities with its current assets. A current ratio more prominent than or equivalent to one indicates that current assets ought to have the capacity to fulfill near term commitments.
Current Ratio = Total Current Assets Total Current Liability
Graph 5 – Current Ratio.
Ted Baker: The Current Ratio for Ted Baker decreased from 2 in 2012 to 1.7(2013) and further to 1.6 in 2014. This decrease in the ratio is due to increase in the current liability of the company. SuperGroup: There is an increasing trend in the Current Ratio of SuperGroup particularly due to decrease in its current liability.
(b) Quick Ratio (Acid Test): The Quick Ratio is a harder test of liquidity than the current ratio. It wipes out specific current assets for example, inventory and prepaid costs that may be harder to change over to cash. Like the current ratio, having a quick ratio over one, the company ought to have little problem with liquidity. The higher the ratio, the more liquid it is, and the better capable the company will be to ride out any downturn in its business.
Quick Ratio = Total Quick Assets Total Current Liability
0
0.5
1
1.5
2
2.5
3
TedBaker SuperGroup2012 2 2.42013 1.7 32014 1.6 3
CurrentRatio

PDE 4231 Human and Financial Management in Engineering Group Coursework 17
Graph 6 – Quick Ratio.
Ted Baker: from the above graph we can see that the Quick Ratio of Ted Baker is well below the mark of 1. This is a cause of concern, as the company’s current liability is more than its quick asset. SuperGroup: Compared to the ratios of Ted Baker, SuperGroup has a healthy ratio and it doesn’t look like the company might get into any trouble as its Quick Ratios are high and are increasing gradually year after year. 3. Efficiency Ratio: Efficiency Ratios are typically used to analyze how well a company uses its assets and liabilities internally. Efficiency Ratios can ascertain the turnover of receivables, the repayment of liabilities, the amount and use of equity and the general utilization of inventory and machinery.
(a) Trade Receivable Days: In trade receivable days, we calculate the time period of trade receivable which is the total amount of money due to the company for products or services sold on an open credit account.
Trade Receivable Days = Trade Receivable x 365 Credit Sales/ Sales Revenue
Graph 7 – Trade Receivable Days.
00.51
1.52
TedBaker SuperGroup2012 0.86 1.382013 0.68 1.772014 0.71 1.92
QuickRatio
0102030405060
TedBaker SuperGroup2012 52 502013 49 462014 39 46
Days
Trade Receivable Days

18PDE 4231 Human and Financial Management in Engineering Group Coursework
Ted Baker: The Trade Receivable Days for Ted Baker has kept on decreasing from 52 days in 2012 to 49 days in 2013 and 39 days in 2014. This is particularly due to decrease in the Trade Receivable of the company.
SuperGroup: On the other hand the Trade Receivable Days for SuperGroup is remained almost constant from 50 days in 2012 to 46 days in both 2013 and 2014.
(b) Creditors Payment Period: Creditors Payment Period is a short-term liquidity measure used to quantify the rate at which a company pays off its suppliers and vendors.
Creditors Payment Period = Trade Payable x 365 Credit Purchase/ Cost of Sales
Graph 8 – Creditors Payment Period.
Ted Baker: The Creditors Payment Period for the company is 154 days, 156 days and 134 days for the years 2012, 2013 and 2014 respectively. SuperGroup: The Creditors Payment Period for the company is 128 days, 119 days and 61 days for the years 2012, 2013 and 2014 respectively.
(c) Inventory Turnover Days: For a company to be profitable, it must have the capacity to deal with its Inventory, on the grounds that it is money invested that does not earn a return. The best measure of inventory utilization is the Inventory turnover ratio. The lower turnover in days indicates the maximum utilization of inventory efficiently.
Inventory Turnover Days = Inventory x 365 Cost of Sale
020406080100120140160
TedBaker SuperGroup2012 154 1282013 156 1192014 134 61
Days
CreditorsPaymentPeriod

PDE 4231 Human and Financial Management in Engineering Group Coursework 19
Graph 9 – Inventory Turnover Days.
Ted Baker: The Inventory Turnover Days for Ted Baker was 227 days in 2012, 258 days in 2013 and 238 days in 2014, SuperGroup: The Inventory Turnover Days for SuperGroup was 150 days in 2012, 176 days in 2013 and 164 days in 2014. Which is comparatively lower than that of Ted Baker and the SuperGroup is able to convert its inventory into cash more efficiently and faster compared to Ted Baker. 4. Financing Ratios: Financing Ratios are extremely helpful pointers of a company's performance and financial situation. Financing Ratios can be utilized to investigate patterns and to contrast the company's financials with those of others.
(a) Gearing Ratio: The Gearing Ratio contrasts an company's total debt with its total equity, which is utilized to increase a general thought as to the measure of leverage being utilized by the company. A low rate means that the company is less subject to leverage, i.e., cash obtained from and/or owed to others. The lower the rate, the less leverage a company is utilizing and the stronger its equity position. The higher the proportion, the more risk the company is considered to have taken on.
Gearing Ratio = Long Term Liabilities + Preference Shares Ordinary Shareholders Funds (Equity)
0
50
100
150
200
250
300
TedBaker SuperGroup2012 227 1502013 258 1762014 238 164
Days
InventoryTurnoverDays

20PDE 4231 Human and Financial Management in Engineering Group Coursework
Graph 10 – Gearing Ratio.
Ted Baker: The Gearing Ratio for the company for the years 2012, 2013 and 2014 is as follows 1.70%, 0.50% and 0.00% respectively. SuperGroup: Whereas the Gearing Ratio for SuperGroup for the same review period as above is 18.6%, 14.4% and 12%. Usually The lower the rate, the less leverage a company is utilizing and the stronger its equity position. The higher the proportion, the more risk the company is considered to have taken on. So from the above graph we can see that SuperGroup has a large Gearing Ratio due to its High Long term Liabilities compared to that of Ted Baker.
(b) Interest Cover: The interest cover ratio is utilized to decide how effectively a company can pay interest expense on outstanding debt. The ratio is ascertained by dividing a company's profit before interest and tax by the company's interest expense for the same period. The lower the ratio, the more the company is loaded by debt expense.
Interest Cover = Profit Before Interest and tax Interest Payable
Graph 11 – Interest Cover.
0.0%5.0%10.0%15.0%20.0%
TedBaker SuperGroup2012 1.7% 18.6%2013 0.5% 14.4%2014 0 12%
GearingRatio
020406080100120140
TedBaker SuperGroup2012 126.3 02013 45.7 02014 33.3 0
InterestCover

PDE 4231 Human and Financial Management in Engineering Group Coursework 21* We consider the interest cover for SuperGroup as Zero as there is no interest to be paid for the period under the review Ted Baker: The Interest Cover for Ted baker over the years 2012, 2013 and 2014 is 126.3, 45.7 and 33.3 respectively; we can see that there is a downward trend in the interest cover this is due to the increase in debt expense. SuperGroup: However the Interest Cover for SuperGroup is Nil as the company has no Debt Expense and the company has no Interest to pay. (c) Earning Per Share (EPS): The portion of a company’s profit allocated to each outstanding share of common stock. Earning per share serves as an indicator of a company’s profitability.
EPS = Profit after interest and tax - Minority interest - Preference dividends
Number of Ordinary Shares
Graph 12 - EPS
Ted Baker: The EPS of Ted Baker for the year 2012 was 42.2p which increased by 22% to 51.5p in 2013 and further increased by 31% to 67.2% in 2014. SuperGroup: Unlike Ted Baker the EPS of SuperGroup kept on decreasing from 44.9p in 2012 by 0.5% to 44.7p in 2013 and further decreased by 31.5% to 34p in 2014. This was due to the fall in share price of SuperGroup. (d) Diluted EPS: A performance metric used to gage the nature of a company's Earning Per Share (EPS) if all convertible securities were worked out. A convertible security alludes to all exceptional convertible preference shares, convertible debentures, stock options (primarily employee based) and warrants. The diluted EPS will always be lower than the simple EPS.
£-£0.100£0.200£0.300£0.400£0.500£0.600£0.700
TedBaker SuperGroup2012 £0.422 £0.4492013 £0.515 £0.4472014 £0.672 £0.34
EPS

22PDE 4231 Human and Financial Management in Engineering Group Coursework
Diluted EPS = Profit after interest and tax – Minority interest – Pref dividends
The weighted average number of ordinary shares +The weighted average number of potential ordinary shares
Graph 13 – Diluted EPS.
Ted Baker: The Diluted EPS of Ted Baker shows an upward trend, which increased by 23% from 40.6p in 2012 to 49.9p in 2013 and further, increased by 33% to 66.3p in 2014, this is significantly due to the increase in the company’s share price. SuperGroup: Unlike Ted Baker the Diluted EPS of SuperGroup kept on decreasing from 44.7p in 2012 by 0.9% to 44.3p in 2013 and further decreased by 31.8% to 33.6p in 2014. This was due to the fall in share price of SuperGroup 5. Investment Ratios: Investment Ratios helps us to analyze the relationship between the investment and its returns that the company has earned over a period. And compare it with competitors companies and decide how well or how bad a company is performing. (a) Price Earning Ratio (P/E): The P/E looks at the relationship between the stock price and the company's per-share earning. The P/E is the most mainstream metric of stock investigation, despite the fact that it is a long way from the one and only we should consider.
Price Earning Ratio (P/E) = Market Price Per Ordinary Share
EPS
£-£0.100£0.200£0.300£0.400£0.500£0.600£0.700
TedBaker SuperGroup2012 £0.406 £0.4472013 £0.499 £0.4432014 £0.663 £0.336
DilutedEPS
PDE 4231 Human and Financial Management in Engineering Group Coursework 23
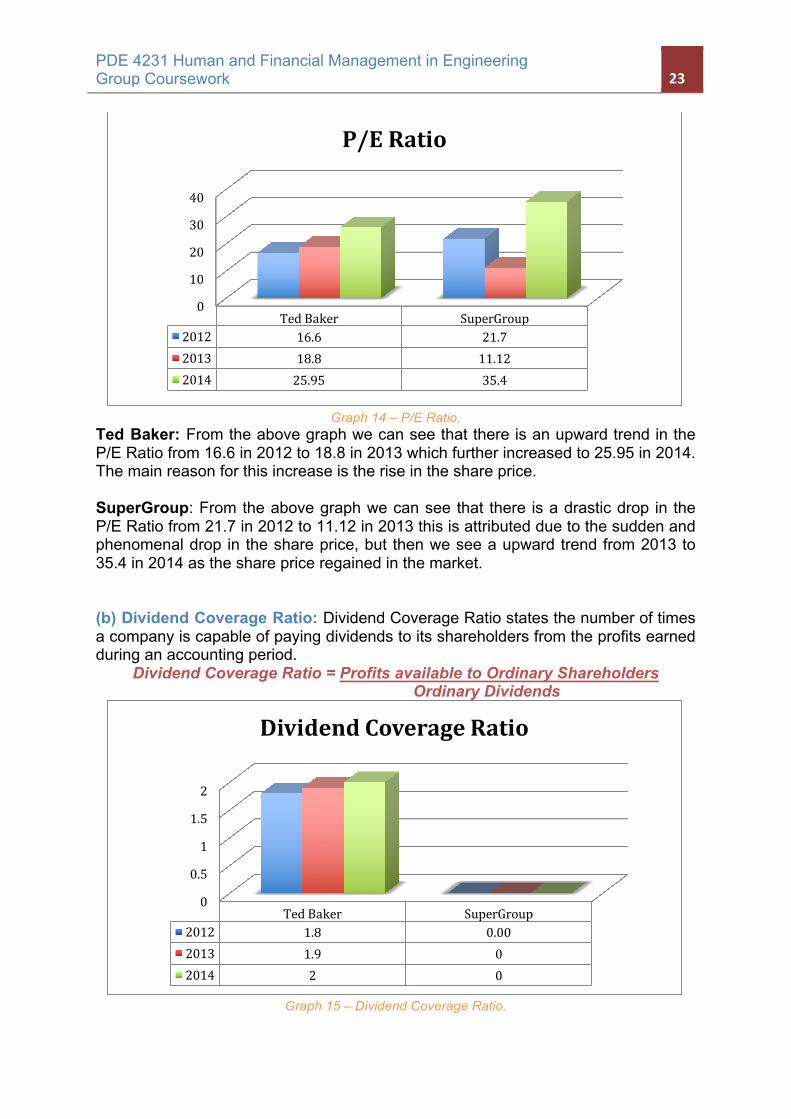
Graph 14 – P/E Ratio.
Ted Baker: From the above graph we can see that there is an upward trend in the P/E Ratio from 16.6 in 2012 to 18.8 in 2013 which further increased to 25.95 in 2014. The main reason for this increase is the rise in the share price. SuperGroup: From the above graph we can see that there is a drastic drop in the P/E Ratio from 21.7 in 2012 to 11.12 in 2013 this is attributed due to the sudden and phenomenal drop in the share price, but then we see a upward trend from 2013 to 35.4 in 2014 as the share price regained in the market.
(b) Dividend Coverage Ratio: Dividend Coverage Ratio states the number of times a company is capable of paying dividends to its shareholders from the profits earned during an accounting period.
Dividend Coverage Ratio = Profits available to Ordinary Shareholders Ordinary Dividends
Graph 15 – Dividend Coverage Ratio.
0
10
20
30
40
TedBaker SuperGroup2012 16.6 21.72013 18.8 11.122014 25.95 35.4
P/ERatio
0
0.5
1
1.5
2
TedBaker SuperGroup2012 1.8 0.002013 1.9 02014 2 0
DividendCoverageRatio

24PDE 4231 Human and Financial Management in Engineering Group Coursework
Ted Baker: We can see that there is a upward trend in the dividend cover of Ted Baker which is due to the increase in the profits. SuperGroup: The SuperGroup paid no Dividend, The Board recognizes the level of cash building on the balance sheet but has decided not to return excess cash to shareholders. There are a number of opportunities over and above the organic roll-out covered in the Strategic Report which, when and if they materialize, will require meaningful capital investment and the Board does not wish to restrict the Group’s ability to take advantage of these opportunities. Consequently, the Board remains of the view that the business is best served by retaining current cash reserves to support growth (SuperGroup Annual Report, 2014)
(c) Dividend Yield: A financial ratio that shows how much a company pays out in dividends each year relative to its share price. In the absence of any capital gains, the dividend yield is the return on investment for a stock.
Dividend Yield = Dividend per Share x 100 Market Price per Share
Graph 16 – Dividend Yield.
Ted Baker: From the graph we can see that there is an downward trend in the Dividend Yield of the company, this is due to the higher share price and the lower dividend paid to the share holders SuperGroup: The SuperGroup paid no Dividend, and hence there is no Dividend Yield. The Board recognizes the level of cash building on the balance sheet but has decided not to return excess cash to shareholders. There are a number of opportunities over and above the organic roll-out covered in the Strategic Report which, when and if they materialize, will require meaningful capital investment and the Board does not wish to restrict the Group’s ability to take advantage of these opportunities. Consequently, the Board remains of the view that the business is best served by retaining current cash reserves to support growth (SuperGroup Annual Report, 2014)
0.00%0.50%1.00%1.50%2.00%2.50%3.00%3.50%
TedBaker SuperGroup2012 3.33% 02013 2.75% 02014 1.93% 0
DividendYield

PDE 4231 Human and Financial Management in Engineering Group Coursework 25Share Price Analysis
The Share Price Analysis provides information to find the performance of both companies knowing the share price being traded on London stock exchange and to provide customer the confidence for the future of the companies. Ted Baker.PLC Share Price
Graph 17 – Share Price Analysis of Ted Baker
Share price of Ted Baker has been increasing for the past five years .The share price has increased by 87% from 2012- 2013. Ted Baker has been able to post solid results because it has persuaded customers its worthwhile paying a premium for product which has a quality edge as well as strong design credentials (BBC news 2012). The share price had a huge boost in 2014 when they reached 2000p .The full-year results showed it has been performing well across all its markets with wholesale up 35 per cent and website sales ahead by 55.7 per cent. Group sales soared 26.5 per cent to £321.9 million due to global expansion and ecommerce sales ( independent, 2014). Group sales rose 15.7% for the three months to 8 November compared with the same period a year ago, as the company opened stores in Las Vegas and Toronto, and further concessions in the US, France, Spain, Portugal and South Korea. Performance was also boosted by a 34.6% rise in internet sales( the guardian 2014). it continued to perform well in London stock exchange and they expanded the overseas market to increase its shares in later half of 2014.
26PDE 4231 Human and Financial Management in Engineering Group Coursework
SuperGroup.PLC Share Price
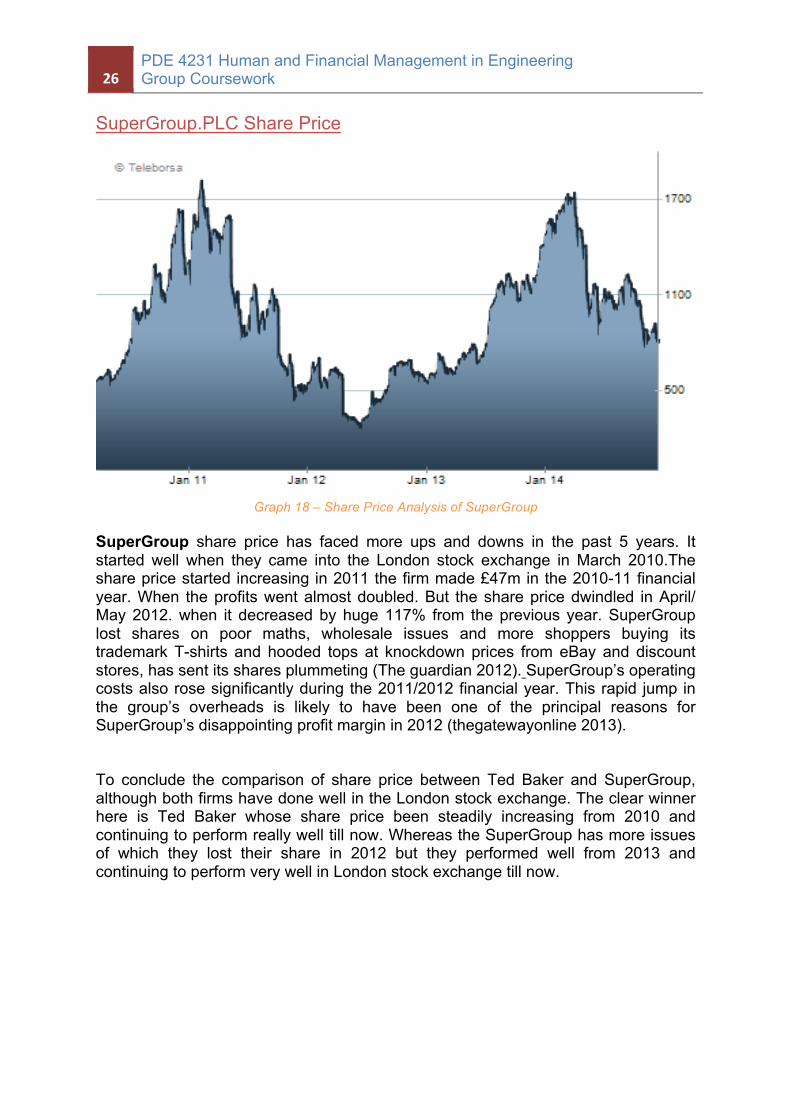
Graph 18 – Share Price Analysis of SuperGroup
SuperGroup share price has faced more ups and downs in the past 5 years. It started well when they came into the London stock exchange in March 2010.The share price started increasing in 2011 the firm made £47m in the 2010-11 financial year. When the profits went almost doubled. But the share price dwindled in April/ May 2012. when it decreased by huge 117% from the previous year. SuperGroup lost shares on poor maths, wholesale issues and more shoppers buying its trademark T-shirts and hooded tops at knockdown prices from eBay and discount stores, has sent its shares plummeting (The guardian 2012). SuperGroup’s operating costs also rose significantly during the 2011/2012 financial year. This rapid jump in the group’s overheads is likely to have been one of the principal reasons for SuperGroup’s disappointing profit margin in 2012 (thegatewayonline 2013).
To conclude the comparison of share price between Ted Baker and SuperGroup, although both firms have done well in the London stock exchange. The clear winner here is Ted Baker whose share price been steadily increasing from 2010 and continuing to perform really well till now. Whereas the SuperGroup has more issues of which they lost their share in 2012 but they performed well from 2013 and continuing to perform very well in London stock exchange till now.

PDE 4231 Human and Financial Management in Engineering Group Coursework 27CVP Analysis
Cost-Volume-Profit (CVP) analysis is a managerial accounting technique that is concerned with the effect of sales volume and product costs on operating profit of a business. It deals with how operating profit is affected by changes in variable costs, fixed costs, selling price per unit and the sales mix of two or more different products. (Accounting explained, 2011)
Assumptions A number of assumptions have to be made to simplify and enable computation and comparison for both companies observed in this report.
The first and main assumption is that the company sells only one product. However, this is not true for most companies where resulting data refers to an average costumer. This average costumer might buy a mix of several products, usually referred to as sales mix, which is why sales price and variable costs are valid for this mix of products only (Eldenburg and Wolcott 2005).
The second assumption is that neither fixed costs nor variable costs changed over the considered time span. Otherwise, calculations would require a deeper insight into the company’s financial structure, which is not available from the annual reports (Caplan 2007).
The third assumption is to consider a fixed sales mix over the reviewed time span. In addition, prices are presumed to remain constant over the survey period (Eldenburg and Wolcott 2005).
WORKINGS AND GRAPHS
SuperGroup.Plc 2012
Total Fixed Cost =151m Variable Cost =135.0m Selling price =313.8m Gross profit =178.8 Break event point in units:151/178 =848,315 units Break event point in pounds 0.848*313.8=266.20m Graph 19 – Break Even Point
for SuperGroup 2012
0
200
400
600
100
200
300
400
500
600
700
800
900
1000
1100
1200
1300
1400
1500salesandcostin£
millions
unitofsalesin*1000
BreakEvenPointSUPERGROUP.LTE2012
totalfixedcost revenue totalcost

28PDE 4231 Human and Financial Management in Engineering Group Coursework
SuperGroup.Plc 2013
Total Fixed Cost =176.7m Variable Cost =150.4m Selling price =360.4m Gross profit =210 Break event point in units :176.7/210=841,429 units Break event point in pounds =.841*360.4=303.25m Graph 20 – Break Even Point for SuperGroup 2013
SuperGroup.Plc 2014
Total Fixed Cost = 215.4m Variable Cost = 173.6 Selling price = 430.9m Gross profit = 257.3 Break event point in units= 215.4/257.3=837,110 units Break event point in pounds= 0.837*430.9=360.66m
Graph 21 – Break Even Point for SuperGroup 2014 Year 2012 2013 2014 Selling price 313.8 360.4 430.9 Break even point 266.20 303.25 360.66 Break event point units
848,315 841,429 837,110
Contribution Per unit 314 428 438 Margin of safety[%] 14% 50% 28%
Table 5- CVP of SuperGroup
0
100
200
300
400
500
salesandcostin£
millions
unitofsalesin*1000
BreakEvenPointSUPERGROUP.LTE2013
totalfixedcost totalrevnue totalcost
0
100
200
300
400
500
600
700
0100
200
300
400
500
600
700
800
900
1000
1100
1200
salesandcostin£
millions
unitofsalesin*1000
breakevenpointsupergroup2014
Column3 Column2 Series3

PDE 4231 Human and Financial Management in Engineering Group Coursework 29
Ted Baker.Tlc 2012
Total Fixed Cost =122m Variable Cost =83m Selling price =216m Gross profit =132m Break event point in units:122/133 =917,293 units Break event point in pounds :.917*216=198.14m
Graph 22 – Break Even Point for Ted Baker 2012
Ted Baker.Plc 2013
Total Fixed Cost =143m Variable Cost =96m Selling price =255m Gross profit =159m Break event point in units :145/159=911,940 units Break event point in pounds =0.911*255=232.55m
Graph 23 – Break Even Point for Ted Baker 2013
Ted Baker.Plc 2014
Total Fixed Cost =178m Variable Cost =124m Selling price =322m Gross profit =199m Break event point in units:178/198=898,990 units Break event point in pounds :0.848*322=289.47m
Graph 24 – Break Even Point for Ted Baker 2014
0
100
200
300
400
100
200
300
400
500
600
700
800
900
1000
1100
1200
1300
1400
1500
salesandcostin£
millions
unitofsalesin*1000
BreakevenpointofTEDBAKER.TLC2012totalfixedcost totalreavenue
050100150200250300350400
100
200
300
400
500
600
700
800
900
1000
1100
1200
1300
1400
1500sa
lesandcostin£
millions
unitofsalesin*1000
totalfixedcost totalrevenue totalcost
0
100
200
300
400
500
600
100
200
300
400
500
600
700
800
900
1000
1100
1200
1300
1400
1500
salesandcostin£
millions
unitofsalesin*1000
Fixedcost Salesrevenue totalcost

30PDE 4231 Human and Financial Management in Engineering Group Coursework
Break-Even Point and Margin of Safety of TED BAKER
Year 2012 2013 2014 Selling price 216 255 322 Breakeven point 198.14 232.55 289.47 Breakeven point units 917,293 911,940 898,990 Contribution Per unit 216 255 322 Margin of safety[%] 1.7% 22% 33%
Table 6- CVP of Ted Baker Description
SuperGroup
• In 2012 the company met the breakeven point by selling 848,315 units (£303.24m) 31.9% more revenue than the last year.
• In 2013 Super Group managed to meet the breakeven point by selling 841,429 units (£266.20m) and revenue also increased by 14.9%.
• In the latest year 2014 the company performed well and sold 837,110 units to meet the break event point and went on to increase sales by 19%
Ted Baker
• In 2012 the company had to sell 917,293 units to cross the input cash of £198.14m which is same as the year 2013.
• In the year 2013 the company has to take up 232.55 million pounds to meet the break event point by selling some what similar amount of products like last year 911,940 units and hence the organisation made a 18% more group revenue than the last year.
• In year 2014 the Ted Baker company had to sell 898,990 units to meet the break event point of 289.47 million and hence which has gone forward and made a better margin than the last two years by increase in 26.5% in the overall revenue.

PDE 4231 Human and Financial Management in Engineering Group Coursework 31Comparison
SuperGroup in the year 2012 to 2014 made 19% to 31% increase in total revenue and an overall profit of £40.4m after the breakeven point from £266.20m to £360m which led to the increase of contribution per unit from £314m to £438m. Ted Baker is a good example of a successful company and made good revenue without much fluctuations in the company and showing high number of sales in the duration period. It has the breakeven point of approximately 900,000 units and contribution per unit rose from £216m to £322m.
Conclusion
Hence the conclusion of both the companies proves that they make meet the break even point by meeting its revenues more and making a firmly profit as well. These both companies are entirely different in process and they make a better margin separately, hence it can be increased by decreasing in administrative and general expenses by maintaining it efficiently and also by increasing sales by implementing better techniques like SuperGroup to bring up the better result for Ted Baker.

32PDE 4231 Human and Financial Management in Engineering Group Coursework
Financial News Review
Ted Baker. PLC On 13th November 2014, it was reported by the Financial Times that retail sales in the 13 weeks to November 8 rose by 12.7% as an increase in retail space offset the adverse currency fluctuations. Moreover the wholesale revenues increased by about 25% over the same period while the overall group revenue increased by 15.7%. Two weeks later, on 28th November 2014, Investors Chronicle revealed that Lindsay Page, finance director of Ted Baker offloaded almost £1million worth of shares. The company reported that the 45,000-share sale at 2,050p left Mr Page with 81,000 shares as well as 58,000 nil-cost incentive-scheme options. Ted Baker was also in the news for wrong reasons as it was revealed by the Telegraph on 3rd November 2014 that a warehouse worker stolen more than 7 tones of Ted Baker clothes which cost the firm nearly GBP 5 million in lost business and legal costs. The thefts were revealed after the failure of a legal challenge by Ted Baker's distribution arm, No Ordinary Designer Label Limited (NODL), against its insurers, who refused to pay out because the company had not completed the necessary paperwork.
SuperGroup. PLC
On 10th October 2014, Share news reported that SuperGroup concluded an agreement to acquire 78.28% of the shares of Allen Ford, which is a franchised motor dealer group that has over 100 years, history in the UK motor industry. It was purchased for GBP 33.9million while the net asset value of the Allen Ford acquisition is approximately GBP 9.5 million. On the 12th of December 2014, it was reported by the Telegraph that SuperGroup launched a strategic review of the retailer after it reported a sharp slide in profits. They suffered a 5% drop in its shares while the like-for-like sales fell by 4.1pc in the 26 weeks to October 25. Moreover the shares in SuperGroup were down by 23.79p, which stood at 806.21p. On 23rd April 2012, Accounting Web revealed that SuperGroup suffered a GBP 2.5 million shortfall due to arithmetic errors in its forecasting. Furthermore they also suffered a loss of GBP 4 million because demand for its stock came later than expected in addition to the rise in operating costs.

PDE 4231 Human and Financial Management in Engineering Group Coursework 33Conclusion In conclusion, it can be seen that Ted Baker has been performing consistently well in the past few years while SuperGroup has been inconsistent with their performance. It is clear that both these companies maximized their profit through investment in distinct market territories, people and developing infrastructure programs around the world in addition to the development of its e-commerce, which provided further revenue streams. On analyzing their performance in the market, it is evident that Ted Baker has been enjoying a stability in terms of achieving a profit whereas SuperGroup has been struggling to maintain its benefits due to excessive operating costs which can be seen through its reduced net profit margin and the return on its capital employed. Nevertheless both the companies have been able to meet its near-term obligations and have been efficient on how they use their assets and liabilities internally. Moreover share price of Ted Baker has been rising rapidly for the past five years. The share price reached 2000p in 2014 after it increased by about 87% in 2012-2013. Results show that it has been performing well across all markets with wholesale up by 35% and website sales ahead by 56%. Also group sales soared 26.5% to £321.9 million due to global expansion and ecommerce sales. In contrast SuperGroup performance in the share market for the last five years has been instable due to the continuation fluctuations in its share price. They lost a whopping 117% in 2012 from the previous year due to poor forecasting and rising maintenance costs. However from 2013 there has been a steady rise in its share price after they entered into e-commerce.

34PDE 4231 Human and Financial Management in Engineering Group Coursework
Bibliography
Algy Hall (2014), Finance director sheds Ted Baker. Investors Chronicle [online]. 28 November 2014. Available at: http://www.investorschronicle.co.uk/2014/11/28/shares/directors-deals/finance-director-sheds-ted-baker-0Kwck4eXMQN0XCD6awGteO/article.html;jsessionid=2C2E174798D0A35B8DC197593BF37FEF.mps-apr-01-8104 [Accessed 30 November 2014].
Agency (2014), Super Group to Purchase UK Ford and Kia Dealerships. Sharenews [online].10 October 2014. Available at: http://sharenews.co.za/super-group-to-purchase-uk-ford-and-kia-dealerships/ [Accessed 12 December 2014].
Agency (2014), Ted Baker loses £5m after employee steals seven tonnes of clothes. Telegraph [online]. 3 November 2014. Available at: http://www.telegraph.co.uk/news/uknews/crime/11205477/Ted-Baker-loses-5m-after-employee-steals-seven-tonnes-of-clothes.html [Accessed 30 November 2014].
Caplan, D. (2007). Management Accounting: Concepts and Techniques - Part 2: Microeconomic Foundatios of Management Accounting [online]. Available from: http://classes.bus.oregonstate.edu/spring- 07/ba422/Management%20Accounting%20Chapter%207.htm. [Accessed 01 December 2013].
Eldenburg, L.G. and Wolcott, S.K. (2005). Cost Management: Measuring, Monitoring, and Motivation Performance. John Wiley & Sons, Hoboken, NJ. pp. 86-127. Available from: http://www.wiley.com/college/sc/eldenburg/ch03.pdf. [Accessed 08 December 2014].
Graham Ruddick (2014), Supergroup warns on margins as profits slide 30pc. Telegraph [online]. 12 December 2014. Available at: http://www.telegraph.co.uk/finance/newsbysector/retailandconsumer/11286862/Supergroup-warns-on-margins-as-profits-slide-30pc.html [Accessed 12 December 2014].
Inside a real business: supergroup’s P&L statement .[online] Available at: <http://thegatewayonline.com/commercial-awareness/business-analysis/inside-a-real-business-supergroups-pl-statement > [Accessed at 10 december 2014]
Khadim Shubber (2014), Ted Baker avoids UK warm weather woes. Financial Times [online]. 13 November 2014. Available at: http://www.ft.com/cms/s/0/b17c212a-6b21-11e4-ae52-00144feabdc0.html#axzz3KYT65WlW [Accessed 30 November 2014]. Larsen,L.2010. History of Ted Baker[online]. Available at http://www.mademan.com/mm/history-ted-baker.html [Accessed 8th December 2014].
Robert Lovell (2014), SuperGroup gets forecasts wrong. AccountingWeb [online]. 23 April 2012. Available at: http://www.accountingweb.co.uk/article/supergroup-profit-warning-down-maths-errors/526687 [Accessed 12 December 2014].

PDE 4231 Human and Financial Management in Engineering Group Coursework 35Student study guide” Pearson Higher Education,2012.Cost-volume-profit analysis.[pdf].Available at: http://wps.prenhall.com/wps/media/objects/2033/2082045/student_study_guide/cost12_study03.pdf [accessed 14 December 2014]. SuperGroup.PLC, 12 December 2012. Available at <http://www.supergroup.co.uk/our-history> [Accessed 8th December 2014] SuperGroup shares plunge after new profit warning blamed on bad maths. The Guardian [online] Available at: <http://www.theguardian.com/business/2012/apr/20/supergroup-shares-plunge-profit-warning> [Accessed at 10 December 2014]. Ted Baker profits soar as retailer aims for global expansion. Independent [online] Available at: <http://www.independent.co.uk/news/business/news/ted-baker-profits-soar-as-retailer-aims-for-global-expansion-9205171.html > [Accessed at 09 December 2014]. Ted Baker sales flourish in unseasonal autumn conditions.The Guardian [online]. 13 November 2014. Available at: <http://www.theguardian.com/business/2014/nov/13/ted-baker-sales-rise-warm-autum-weather > [Accessed at 09 December 2014]. Ted Baker's sales boosted by overseas growth. BBC [online]. 12 June 2012. Available at: <http://www.bbc.co.uk/news/business-18406260 > [Accessed at 08 December 2014].