Family life in power couples: Continued childbearing and ...
34
Demographic Research a free, expedited, online journal of peer-reviewed research and commentary in the population sciences published by the Max Planck Institute for Demographic Research Konrad-Zuse Str. 1, D-18057 Rostock · GERMANY www.demographic-research.org DEMOGRAPHIC RESEARCH VOLUME 23, ARTICLE 30, PAGES 847-878 PUBLISHED 02 NOVEMBER 2010 http://www.demographic-research.org/Volumes/Vol23/30/ DOI: 10.4054/DemRes.2010.23.30 Research Article Family life in power couples: Continued childbearing and union stability among the educational elite in Sweden, 1991–2005 Martin Dribe Maria Stanfors ©2010 Martin Dribe & Maria Stanfors. This open-access work is published under the terms of the Creative Commons Attribution NonCommercial License 2.0 Germany, which permits use, reproduction & distribution in any medium for non-commercial purposes, provided the original author(s) and source are given credit. See http:// creativecommons.org/licenses/by-nc/2.0/de/
Transcript of Family life in power couples: Continued childbearing and ...

Demographic Research a free, expedited, online journal
of peer-reviewed research and commentary in the population sciences published by the Max Planck Institute for Demographic Research Konrad-Zuse Str. 1, D-18057 Rostock · GERMANY www.demographic-research.orgDEMOGRAPHIC RESEARCH VOLUME 23, ARTICLE 30, PAGES 847-878 PUBLISHED 02 NOVEMBER 2010 http://www.demographic-research.org/Volumes/Vol23/30/ DOI: 10.4054/DemRes.2010.23.30 Research Article
Family life in power couples: Continued childbearing and union stability among the educational elite in Sweden, 1991–2005
Martin Dribe
Maria Stanfors
©2010 Martin Dribe & Maria Stanfors. This open-access work is published under the terms of the Creative Commons Attribution NonCommercial License 2.0 Germany, which permits use, reproduction & distribution in any medium for non-commercial purposes, provided the original author(s) and source are given credit. See http:// creativecommons.org/licenses/by-nc/2.0/de/
Table of Contents
1 Introduction 848 2 Theoretical background and previous research 848 2.1 Power couples 848 2.2 Education, employment and fertility 849 2.3 Dual careers and family compatibility in different contexts 851 2.4 Education, homogamy, and union stability 852 2.5 Hypotheses 853 3 Data 854 4 Methods 855 5 Variables 856 6 Results 861 7 Conclusion 869 8 Acknowledgements 871 References 872

Demographic Research: Volume 23, Article 30 Research Article
http://www.demographic–research.org 847
Family life in power couples: Continued childbearing and union stability
among the educational elite in Sweden, 1991–2005
Martin Dribe1
Maria Stanfors2
Abstract
This article studies continued childbearing and union stability among “power couples,” or dual-career couples. The determinants of these events are analysed multivariately using longitudinal data on couples from population registers in Sweden, 1991–2005. Power couples are identified using their levels and fields of education, and their sectors of employment. Income and other variables are controlled for. The results show that power couples are more likely to continue childbearing, and are less likely to separate, than other couples. This implies that, despite the expected higher opportunity costs of childbearing and the small gains to specialisation, power couples who start families are able to combine career and continued childbearing.
1 Center for Economic Demography and Department of Economic History, Lund University, Sweden. E-mail: [email protected]. 2 Center for Economic Demography and Department of Economic History, Lund University, Sweden. E-mail: [email protected].

Demographic Research: Volume 23, Article 30
http://www.demographic–research.org 848
1. Introduction
A “power couple” is a feature of modern life that is defined as two individuals, both having high -powered careers, or being influential otherwise (see Costa and Kahn 2000; Compton and Pollak 2004). Today’s power couples are different from those of the past (Abbott 2003), and the growth in the number of these couples is related to the huge increase in women’s education and labour force participation since the 1960s, and the increased prevalence of the dual-earner family. In a dual-earner couple, both partners have jobs, but only one of the partners has a career. Power couples differ from dual-earner couples in that both partners pursue careers characterised by high professional standards, continuous progress through a hierarchy, and high degrees of challenge and commitment. Power couples therefore face a number of challenges, of which co-location and geographic mobility, together with family responsibilities, are the most important.
These issues affect women’s careers more than men’s careers. Due to the perceived incompatibility of family and career, researchers throughout the Western world have tended to view “opting out” (Stone 2007), late and low fertility, and increasing levels of childlessness among highly educated and professional women as responses to the high opportunity costs associated with childbearing (e.g., Gerson 1985; Hewlett 2003). There are, however, theoretical reasons to suppose that power couples with high earnings potential might not have lower fertility than other couples, and may indeed be more likely to continue childbearing than those with moderate earnings potential. Empirical tests of this assumption are, however, rare. We wish to help fill this gap by analysing continued childbearing and union stability in power couples in Sweden since 1990. We focus on the childbearing patterns of couples in which both partners are university graduates, and who are therefore more likely than other couples to have high powered careers. In the analysis, we also take into account union dissolution by using a multinomial logit model to simultaneously analyse the impact of the explanatory variables on having a birth and separating. The analyses are made using longitudinal data from population registers in Sweden 1991–2005.
2. Theoretical background and previous research
2.1 Power couples
Power couples, or dual-career households (cf. Rapoport and Rapoport 1969, 1971; Costa and Kahn 2000), make up a small share of the population, but are nevertheless becoming increasingly common as more women and men acquire academic degrees and

Dribe & Stanfors: Family life in power couples
http://www.demographic–research.org 849
choose to pursue high powered careers. Power couples are often said to have coupled or coordinated careers (Bernasco 1994), because this is what distinguishes them from the more common dual-earner couples. The often-cited difficulties associated with combining career and family lead many professional women and men in dual-career households to limit their family size or remain childless (Altucher and Williams 2003). Whereas some remain childless by choice to avert the negative impact that parenthood might have on their careers (Bram 1985; Tanturri and Mencarini 2008), Hewlett (2002) argues that many successful female professionals in the United States find themselves in this situation through a “creeping non-choice,” because each year, for the sake of work, they put off family formation, and then one day discover it is too late to have children.
However, while dual-career couples face problems and potential conflicts, they also benefit from having higher incomes, which enables them to purchase more services and goods than other couples. In addition, due to assortative mating, these couples tend share common interests and to understand each other’s situations. The education and career of one spouse may have positive spill-over effects for the other spouse, as he or she may benefit from the spouse’s skills and experience in areas such as contacts, promotions, and tacit knowledge; as well as in the transmission of knowledge and expertise (Benham 1974; Bernardi 1999). Several studies suggest that gender equity is higher among dual-career couples, although this does not extend to an egalitarian division of household labour (Gregson and Lowe 1994; Hardill et al. 1997).
2.2 Education, employment and fertility
Considerable attention has been devoted to the association between education and fertility, especially between that of educational level and fertility. Most studies have dealt with women only, and have assumed that there is a negative relationship between women’s education and fertility. Better educated women, who also tend to be the most career-oriented, are expected to have both later and lower levels of fertility than women with less education, because for them childbearing is a costly interruption of their careers (for reviews see Rindfuss, Morgan, and Offutt 1996; Gustafsson 2001; Dribe and Stanfors 2009). This hypothesis is based on the theoretically anticipated relationships between education and fertility, as well as on the interrelationship of career orientation, labour force participation, and fertility (Mincer 1963; Becker 1991). Apart from the direct costs associated with having a child, there are also the indirect costs, of which the most notable are the opportunity costs of the mother’s time. Assuming that higher education is connected to a greater orientation towards work, it may be expected that higher levels of education would also be associated with higher

Demographic Research: Volume 23, Article 30
http://www.demographic–research.org 850
opportunity costs of childbearing. As long as fathers are not expected to give up too much of their working time to care for children, labour force participation will not conflict with family to the same extent among men as among women. Hence, childbearing can be expected to be more delayed, or even avoided, among highly qualified and work-oriented women.
Numerous studies have shown that a woman’s educational attainment has a negative effect on various childbearing outcomes (e.g., Bloom and Trussell 1984; Happel, Hill, and Low 1984; Marini 1984; Rindfuss, Morgan, and Swicegood 1988; Blossfeld and Huinink 1991; Blackburn, Bloom, and Neumark 1993; Gustafsson and Wetzels 2000). Others have found positive relationships between educational attainment and fertility after the first birth (e.g., Hoem and Hoem 1989, Kravdal 1992, 2007; Hoem 1993; Joshi 2002; Kreyenfeldt 2002; Gerster et al. 2007). While this finding may be partly a result of self-selection when birth intervals are modelled separately (Kravdal 2001), it probably also reflects the strength of the two-child norm, as well as genuine differences between contexts in career-family compatibility (Blossfeld and Drobnic 2001).
More recently, it has been shown that educational orientation may be a more important determinant of fertility than educational level (Lappegård 2002; Hoem, Neyer, and Andersson 2006a, 2006b; Van Bavel 2010). If there are systematic differences when it comes to career tracks, work demands, and perceived work-life balance between occupations or employment sectors, the investment in different kinds of higher education may be decisive for the individual’s range of choices. It may be expected that childbearing would be most delayed among women and men who are on career tracks, have demanding jobs, associate childbearing with high economic costs, and foresee difficulties in combining career and family. Moreover, skill depreciation following career breaks is more of a problem in some occupations and sectors than in others. The forms of firm-specific expertise and technological skills typically demanded in the private sector tend to depreciate faster than general skills. Therefore, human capital loss due to career breaks will be more of a problem in the private than in the public sector, and those who face a greater skills depreciation problem can be expected to have fewer children than those who face less of an atrophy rate. The steeper earnings profiles in the private sector exacerbate the negative effects of career breaks on lifetime earnings relative to the effects in the public sector. In order to cope, (potential) parents tend to choose occupations that accommodate family responsibilities and reduce wage punishment (cf. Polachek 1981). This is one reason why many women have chosen to work in the public sector, which is often considered to be more family-friendly and less competitive than the private sector.

Dribe & Stanfors: Family life in power couples
http://www.demographic–research.org 851
2.3 Dual careers and family compatibility in different contexts
As the number of both dual-earner and dual-career households has risen in most industrialised countries, the interest in career-family compatibility has grown (e.g., Spain and Bianchi 1996; Blossfeld and Drobnic 2001). Having a career and a family is often seen as incompatible, at least for women, as both demand commitment, time, and energy; and because the demands are usually most acute at the time in life when both career advancement and family formation are supposed to take place. This challenge may be accentuated among dual-career couples, who need to manage two careers and a family at the same time.
Across countries, there is considerable variation in the polices and institutions that may affect the ability of parents to combine work and family. Institutions differ between countries when it comes to parental leave schemes, wages, the working conditions of parents, the provision and pricing of child care, and the taxation of families and individuals. While all of these factors are important, it is most likely the combination of these policies and institutions that determines the degree of family and career compatibility. Whereas in many countries policies only deal with the reconciliation of women’s double roles, in other countries, like in Sweden, institutional arrangements have a broader scope, and address gender equality issues alongside questions of work-family balance for all parents (see McDonald 2000).
Sweden is often seen as a forerunner when it comes to family and work-related policies. On an aggregate level, it would appear that the institutional arrangements in Sweden are more supportive of combining career and childbearing (e.g., Billari and Kohler 2004) than the conservative and liberal models, with their more traditional approach to family and gender roles. Due to its universalistic and general design, all couples potentially benefit from the Swedish welfare state, and the opportunities the state provides for combining work and family. In reality, however, the actual combination of work and family is a result of choices made by individuals and couples concerning both career and childbearing.
In Sweden, highly educated couples are more likely than other couples to make use of publicly provided day care and other services provided by the welfare state (Stanfors 2003). This may be because highly educated individuals tend to have a stronger work orientation, better information, and more gender-equal attitudes (Bernhardt and Goldscheider 2006). Parental leave, child benefits, and subsidised child care reduce the opportunity cost of parents’ wages, and especially of women’s wages, on fertility. These benefits are provided regardless of the education and economic status of the parents, and thus boost the income effect. In Sweden, the quality of public child care is

Demographic Research: Volume 23, Article 30
http://www.demographic–research.org 852
excellent, and the fees for care are highly subsidised, especially for higher earners.3 Having a higher income also enables people to buy goods and services that make it easier to cope with the demands of career and family (cars, housing, home services, etc.). When parenthood and employment are no longer viewed as alternatives that are at odds with each other, but are rather seen as potentially compatible, the negative effect of women’s labour force participation and wages may be expected to be greatly reduced, and even reversed into a positive income effect. Thus, women’s education, employment, and earnings may have positive effects on continued childbearing and family size.
2.4 Education, homogamy, and union stability
Union stability can be expected to depend both on the educational levels, and on the relationship between the educational levels, of the spouses, i.e., on whether or not they are educationally homogamous. In traditional economic and sociological models, higher levels of education and earnings potential among women destabilises unions, because of the lower specialisation gains to marriage, and the lower degree of female dependence on the spouse (e.g., Becker 1991; Becker, Landes, and Michael 1977; Nock 1995). This effect would be greatest in educationally homogamous unions, or unions in which women have higher levels of education than their husbands. Previous research has, however, only partly supported these predictions (Ono 1998). As was stressed by Oppenheimer (1997), this effect has been shown to be largely connected to the change from one-earner to two-earner models in many Western countries. Such a change implies that gains to marriage are not necessarily declining with increased equality in earnings potentials (cf. Lyngstad 2004). Moreover, in addition to specialisation and dependence, value similarity is usually assumed to promote union stability, which seems to imply that educationally homogamous couples should be more stable than heterogamous ones, because they can be expected to share interests, career views, communication styles, and basic values (e.g., Becker 1973; Glenn, Hoppe, and Weiner 1974; Tynes 1990). Among power couples, the gains to specialisation are minimal, which should lead to a higher separation risk. This is strengthened by the fact that highly educated women enjoy a higher degree of independence, which should make it easier for them to leave unhappy relationships. At the same time, however, these
3 Child care fees are based on the total gross income of the household in which the child resides. Fees are only income-dependent up to the equivalent of a gross monthly income of 42,000 SEK (in 2009). After that, the same fee applies to all households, irrespective of income, which is especially beneficial for high income earners. Coverage is extensive—about 85% of all children aged 1–6 were in public day care in 2005—which means that dual-career couples are able to spend more of their income on other goods and services that may help them combine career and family.

Dribe & Stanfors: Family life in power couples
http://www.demographic–research.org 853
couples may be expected to share similar values and preferences, and to have a consumption level that requires two earners to sustain, which should promote union stability.
In previous research, higher education has also been found to be related to greater marriage stability (Hoem 1997; Jalovaara 2001, 2003). However, attempts to study the relationship between educational homogamy and union stability have produced mixed results. While some studies have shown that educational homogamy increases union stability (Goldstein and Harknett 2006; Jalovaara 2003), other studies have found that educational heterogamy has little or no effect on divorce risks (Bumpass and Sweet 1972; Tjötta and Vaage 2003; Tzeng and Mare 1995). In some cases, the effects of education on union stability appear to differ according to gender (Henz and Jonsson 2003; Kalmijn and Poortman 2006).
2.5 Hypotheses
Based on the discussion so far, we propose three hypotheses concerning the continued childbearing and union stability of power couples in the context of a comprehensive welfare state, such as that of Sweden. First, we expect power couples in Sweden to enjoy a comparatively advantageous situation in terms of family-work compatibility, mainly as a consequence of generous parental leave benefits that compensate for income loss, and the extensive public provision of reliable child care services, which reduces the opportunity costs of having children following frequent and sustained career breaks. Thus, we do not expect to find lower fertility after the first birth among dual-career couples than among other couples in the population. Because men in power couples are highly educated, and this group generally appears to have more gender-equal attitudes towards the division of housework and women’s careers, the compatibility between career and family might even be greater among power couples than among less career-oriented couples, which should, in turn, promote continued childbearing. For the same reason, we expect these couples to be more stable than couples of lower or mixed educational status. Union stability among power couples may be further strengthened by the relatively greater gain associated with having a “power partner,” relative to other potential matches or being single.4
Second, because working conditions in the public sector are often seen as more flexible and tolerant towards absences and career breaks, public sector employment is expected to be associated with greater compatibility of family and work, compared with the private sector. Although this most likely holds regardless of educational status, this
4 Having higher educational status or a partner with educational power may also increase the likelihood of remaining partnered for other reasons, as mentioned in the text above.

Demographic Research: Volume 23, Article 30
http://www.demographic–research.org 854
consideration may be expected to be especially important for power couples, because of the potential costs of career breaks. Moreover, public sector employment is associated with a lower atrophy rate than professional employment in the private sector. Thus, all other things being equal, power couples in which at least one partner is employed in the public sector can be expected to be more likely to have either a second or higher order birth, and power couples in which both spouses are employed in the public sector will be more likely to continue childbearing after they have started a family than similar couples in the private sector. We also expect to find a higher degree of stability in these partnerships, partly because of the more bureaucratic hierarchies and the more flexible working conditions found in the public sector, which should put less stress on parents, and enable them to stop their careers temporarily when they have young children.
Third, when looking at couples in general, we expect to find a positive effect of educational homogamy on having second and higher order births, net of couple income. We also expect to find a higher degree of union stability among power couples, since they experience the greatest gains from homogamy, and benefit the least from factors emphasised by the specialisation model. The higher degree of independence that a woman in a power couple enjoys may not necessarily increase the risk of separation, but may rather be used to improve her threat-point position in various intra-household bargaining situations, and thus to enhance her overall position in the couple. The relative power of women, together with the expectation that highly educated men are more gender-equal in their norms and values, and are thus more willing to share domestic tasks, may be of importance for union stability among power couples.
3. Data
The data used come from the Swedish population registers maintained by Statistics Sweden. From a dataset consisting of all individuals in the birth cohorts 1942–1989 who resided in Sweden at any time from 1961 onwards, we selected heterosexual couples (married or cohabiting without being formally married) who are in their first partnership. We followed these couples from the birth of the first child (the registers only have information on non-marital cohabitation when the cohabitants have common children), beginning in 1989, to the woman’s age 45, the dissolution of the partnership, emigration, or the end of the study period in 2005.
The data were derived from the multigenerational register (Flergenerationsregistret), which contains information on the biological and adopted children of all of the index persons in the sampling frame (all individuals in birth cohorts 1942–89 who resided in Sweden at some point in time after 1960). Due to frequent missing information on adoption dates for adopted children, we only included

Dribe & Stanfors: Family life in power couples
http://www.demographic–research.org 855
biological children in the analysis. Because we only studied couples in their first partnership with children, the number of children previously born is always the same for men and women in the couples. From 1990 onwards, the Swedish population registers record non-marital cohabitation when there are common children (RTB-families). For the individuals in these couples, we have linked register-based information on place of residence, income, education (level and field), branch of employment, as well as demographic events (deaths, external migration, and changes in civil status).5
4. Methods
As we have no information on non-marital cohabitation when there are no common children, we were unable to follow non-marital partnerships (cohabitation) before the birth of the first child. Therefore, we did not explicitly study the transition into partnership and parenthood, but focused instead on what happens after the birth of the first child. We expect that there are important selection mechanisms in this process, which means that the couples that actually formed might be selected among the more family-oriented individuals. Moreover, the extent to which this kind of family orientation differs between subgroups (by education, income, etc.), and the observed differences in higher order fertility between groups, might partly be the result of this kind of selection (see Kravdal 2001, 2007; Kreyenfeldt 2002). However, given the aim of this study – to analyse continued childbearing and partner stability among power couples – this was less of a concern, because the focus was on the family life of actually formed partnerships with at least one child born, and not on underlying educational differences in fertility more generally.
Most of the register-based information is available once a year, while the demographic information is available on a monthly basis. Even though it is in principle possible to construct a dataset for fertility analysis that is continuous, with monthly precision in terms of the events studied and the starting time of partnerships, such an approach creates a large number of tied observations, because a majority of birth intervals are between two and three years. Thus, most couples share a rather limited number of birth intervals. For this reason, we chose a discrete approach in the multivariate analysis, studying the transformed probability of having a child or experiencing a separation during the year, conditioned on the values of the covariates at the beginning of the year. Multiple births during a year (i.e., twins or two separate births within the same calendar year) were counted as one delivery, but the number of
5 In the models estimated all variables refer to the situation on 1 January.

Demographic Research: Volume 23, Article 30
http://www.demographic–research.org 856
previous births took multiple births into account. For example, in the case of a twin birth as the second birth, only one birth event was created as an end point of the interval from the first to the second birth, and the interval between the second and the third births was not included, because it happened at the same time as the second birth. Thus, the interval 3–4 followed immediately after the interval 1–2 .
Given this discrete approach, we estimated multinomial logit models of the transformed probability of having a child or experiencing union dissolution during the year. We estimated models separately for each birth interval (first to second births, second to third, and third to fourth). In cases of a separation and a birth occurring the same year, the event was coded as a birth.
5. Variables
To study differences between power couples and other couples, we constructed a variable indicating the educational status of the spouses in the couples. It was defined according to both the highest educational level obtained and the field of education. For the group with high educational power, we also added a dimension of potential career-family compatibility. We distinguished between those who are employed in the private sector (including government-owned corporations) and the public sector, because we expect a private sector career track to be more competitive and less compatible with family responsibilities than a career in the public sector. We categorised educational status into four different categories:
1. High education power, private sector (high/pr): Post-graduate degree (PhD, PhLic) all fields, university education of three years or more in the fields of medicine, the social sciences, law, business administration, science, mathematics, computer, and technology. Self-employed and employees in private companies or government-owned corporations.
2. High education power, other (high/pu): Same levels and fields of education as in high/pr, but employed outside of private companies or government-owned corporations (i.e., state or municipality administration, non-governmental organisations, other occupations).
3. Medium education power (middle): University education of three years or more in the fields of teaching, humanities and arts, farming and forestry, health and social work (except medical doctors), and services. High school and post-high school education of less than three years (universities, community colleges, nursing schools, etc.), all fields.
4. Low education power (low): High school education of two years or less and basic education (up to nine years), all fields.

Dribe & Stanfors: Family life in power couples
http://www.demographic–research.org 857
The educational status of each spouse was combined into a hierarchical variable for the couple, ranging from the lowest educational power to the highest. Higher power always indicates that both spouses have a similar status. For example, a couple in which both spouses are in the middle group are considered to have higher educational power than a couple in which one of the spouses is in the high group and the other is in the low group. Men’s status is also given preference, so that couples in which the man is in the high and the woman is in the middle group are considered to be more high powered than a couple in which the man is the middle and the woman is in the high group. This ordering is partly based on the fact that men generally out-earn women, and also tend to work longer hours, which typically results in higher incomes; and partly on the fact that, in most couples, the man is a couple of years older than the woman (see Table 1), which tends to give him an edge when it comes to labour market position and earnings.
In the analysis, we limited the sample by excluding couples for whom we lack information on educational status (2% of the sample), and we also truncated the sample at eight years since the previous birth. Table 1 shows the distribution of the covariates used in the analysis. The couples categorised as power couples, i.e., in which both spouses belong to the high categories, make up 4.5% of the entire sample. In addition, about 10% of the couples have one spouse in the high category and one in the middle.
Table 1: Descriptive statistics Education status % Previous births % m low - w low 28.5 1 45.7 m low - w middle 20.7 2 45.5 m middle - w low 10.8 3 8.8 m low - w high/pu 0.5 Total 100.0 m high/pu - w low 0.4 m low - w high/pr 0.5 m high/pr - w low 0.9 Place of residence % m middle - w middle 23.4 Metro cities 14.8 m middle - w high/pu 1.3 Metro suburbs 18.4 m high/pu - w middle 2.1 Big cities 28.1 m middle - w high/pr 1.5 Commuter 6.2 m high/pr - w middle 5.0 Rural 2.9 m high/pu - w high/pu 1.0 Manufacturing 6.8 m high/pu - w high/pr 0.4 Other>25000 13.6 m high/pr - w high/pu 1.1 Other12500-25000 6.7 m high/pr - w high/pr 2.0 Other<12500 2.7 Total 100.0 Total 100.0
Demographic Research: Volume 23, Article 30
http://www.demographic–research.org 858
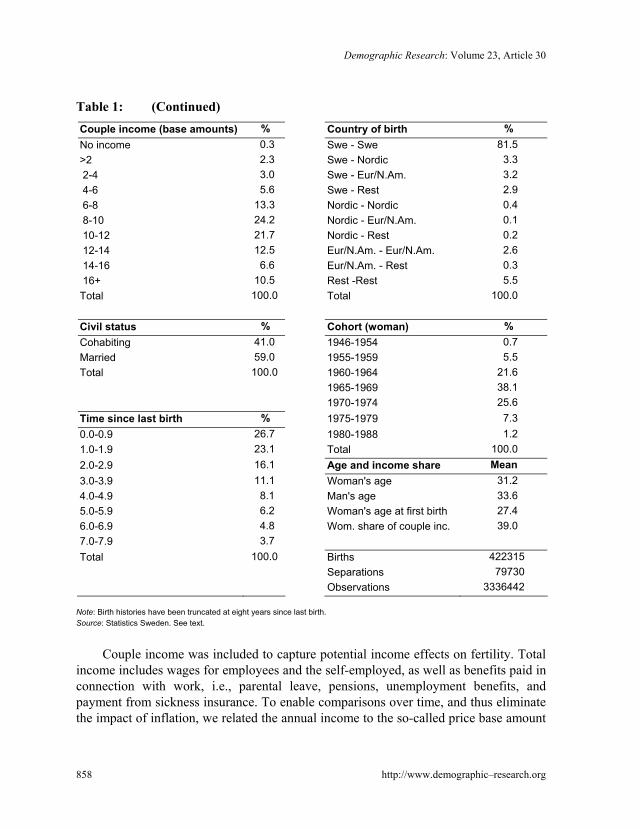
Table 1: (Continued) Couple income (base amounts) % Country of birth % No income 0.3 Swe - Swe 81.5 >2 2.3 Swe - Nordic 3.3 2-4 3.0 Swe - Eur/N.Am. 3.2 4-6 5.6 Swe - Rest 2.9 6-8 13.3 Nordic - Nordic 0.4 8-10 24.2 Nordic - Eur/N.Am. 0.1 10-12 21.7 Nordic - Rest 0.2 12-14 12.5 Eur/N.Am. - Eur/N.Am. 2.6 14-16 6.6 Eur/N.Am. - Rest 0.3 16+ 10.5 Rest -Rest 5.5 Total 100.0 Total 100.0 Civil status % Cohort (woman) % Cohabiting 41.0 1946-1954 0.7 Married 59.0 1955-1959 5.5 Total 100.0 1960-1964 21.6 1965-1969 38.1 1970-1974 25.6 Time since last birth % 1975-1979 7.3 0.0-0.9 26.7 1980-1988 1.2 1.0-1.9 23.1 Total 100.0 2.0-2.9 16.1 Age and income share Mean 3.0-3.9 11.1 Woman's age 31.2 4.0-4.9 8.1 Man's age 33.6 5.0-5.9 6.2 Woman's age at first birth 27.4 6.0-6.9 4.8 Wom. share of couple inc. 39.0 7.0-7.9 3.7 Total 100.0 Births 422315 Separations 79730 Observations 3336442
Note: Birth histories have been truncated at eight years since last birth. Source: Statistics Sweden. See text.
Couple income was included to capture potential income effects on fertility. Total
income includes wages for employees and the self-employed, as well as benefits paid in connection with work, i.e., parental leave, pensions, unemployment benefits, and payment from sickness insurance. To enable comparisons over time, and thus eliminate the impact of inflation, we related the annual income to the so-called price base amount
Dribe & Stanfors: Family life in power couples
http://www.demographic–research.org 859
(hereafter simply called base amount) of the year. The base amount was set for each calendar year on the basis of changes in the Consumer Price Index (KPI). Its main purpose is to adjust different kinds of public benefits (pensions, student aid, sickness insurance, etc.) to account for inflation. We also included a variable measuring the share of couple income earned by the woman as a proxy for her relative bargaining position.
In addition to these main variables, we also controlled for a number of covariates with a possible impact on fertility. We included a set of controls of standard demographic characteristics: civil status, the man’s age, the woman’s age, the square terms of the two ages, the time since the last birth, the age of the woman at the first birth, and the cohort. In addition, we controlled for the characteristics of the place of residence in order to capture more general differences in fertility levels between geographical areas. Here, we used the categorisation of municipalities from the Swedish Association of Local Authorities and Regions (SKL), which is commonly used in regional analyses. It captures both population density and the character of the municipality. We also included a variable measuring the country of birth of the spouses using four country groups: Sweden, the other Nordic countries (Denmark, Norway, Finland, Iceland), European countries other than the Nordic countries and the USA and Canada, and the rest of the world.
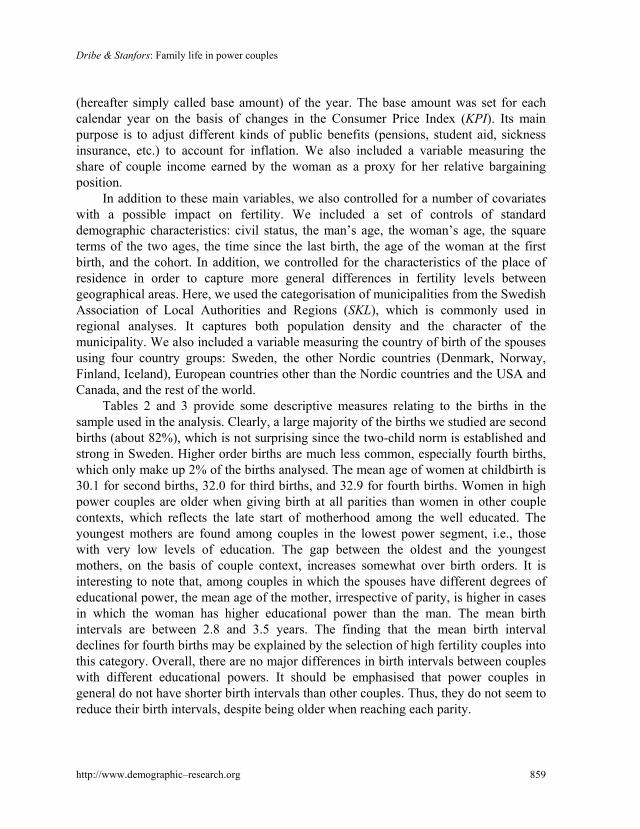
Tables 2 and 3 provide some descriptive measures relating to the births in the sample used in the analysis. Clearly, a large majority of the births we studied are second births (about 82%), which is not surprising since the two-child norm is established and strong in Sweden. Higher order births are much less common, especially fourth births, which only make up 2% of the births analysed. The mean age of women at childbirth is 30.1 for second births, 32.0 for third births, and 32.9 for fourth births. Women in high power couples are older when giving birth at all parities than women in other couple contexts, which reflects the late start of motherhood among the well educated. The youngest mothers are found among couples in the lowest power segment, i.e., those with very low levels of education. The gap between the oldest and the youngest mothers, on the basis of couple context, increases somewhat over birth orders. It is interesting to note that, among couples in which the spouses have different degrees of educational power, the mean age of the mother, irrespective of parity, is higher in cases in which the woman has higher educational power than the man. The mean birth intervals are between 2.8 and 3.5 years. The finding that the mean birth interval declines for fourth births may be explained by the selection of high fertility couples into this category. Overall, there are no major differences in birth intervals between couples with different educational powers. It should be emphasised that power couples in general do not have shorter birth intervals than other couples. Thus, they do not seem to reduce their birth intervals, despite being older when reaching each parity.

Demographic Research: Volume 23, Article 30
http://www.demographic–research.org 860
Table 2: Age of woman at birth by parity and educational status
2nd births 3rd births 4th births
Mean Median St.dev Mean Median St.dev Mean Median St.dev
m low - w low 28.2 28 4.19 30.0 30 3.97 31.5 31 4.04
m low - w middle 29.7 29 3.89 31.7 32 3.68 32.9 33 3.76
m middle - w low 29.4 29 4.31 31.1 31 4.11 32.0 32 4.10
m low - w high/pu 32.8 32 3.63 34.6 34 3.29 35.5 35 4.22
m high/pu - w low 31.0 31 4.36 32.2 32 4.28 32.8 32 3.84
m low - w high/pr 32.7 32 3.32 34.9 35 3.22 35.0 35 2.89
m high/pr - w low 31.6 32 3.96 33.0 33 3.89 34.0 34 4.44
m middle - w middle 30.7 30 3.91 32.7 33 3.71 33.9 34 3.84
m middle - w high/pu 33.0 33 3.39 34.9 35 3.26 36.0 36 3.13
m high/pu - w middle 32.4 32 3.68 34.1 34 3.39 34.8 35 3.71
m middle - w high/pr 33.2 33 3.10 35.1 35 2.80 36.2 37 3.13
m high/pr - w middle 32.4 32 3.45 34.4 34 3.25 35.4 35 3.31
m high/pu - w high/pu 33.4 33 3.31 35.3 35 3.09 37.0 37 3.21
m high/pu - w high/pr 33.4 33 3.06 35.4 35 2.81 36.8 37 3.32
m high/pr - w high/pu 33.4 33 3.19 35.5 35 2.92 36.9 37 3.21
m high/pr - w high/pr 33.5 33 2.88 35.7 36 2.67 37.6 38 3.02
Total 30.1 30 4.23 32.0 32 4.09 32.9 33 4.16
Births 344431 68666 9218 Note and source: See Table 1.

Dribe & Stanfors: Family life in power couples
http://www.demographic–research.org 861
Table 3: Birth intervals (years) by parity and educational status
2nd births 3rd births 4th births
Mean Median St.dev Mean Median St.dev Mean Median St.dev
m low - w low 2.8 2.5 1.34 3.5 3.1 1.81 3.2 2.8 1.71
m low - w middle 2.8 2.6 1.28 3.6 3.3 1.80 3.2 2.7 1.75
m middle - w low 2.8 2.5 1.30 3.4 3.0 1.77 3.1 2.6 1.66
m low - w high/pu 2.9 2.7 1.37 3.4 3.0 1.80 3.0 2.5 1.69
m high/pu - w low 2.7 2.4 1.29 3.2 2.8 1.71 2.8 2.3 1.57
m low - w high/pr 2.9 2.7 1.22 3.9 3.5 1.78 2.6 2.6 1.12
m high/pr - w low 2.7 2.5 1.29 3.4 3.0 1.66 3.4 2.8 1.80
m middle - w middle 2.7 2.5 1.21 3.5 3.2 1.73 3.3 2.8 1.73
m middle - w high/pu 2.8 2.5 1.26 3.4 3.0 1.65 3.2 3.0 1.35
m high/pu - w middle 2.7 2.4 1.23 3.4 3.1 1.64 3.2 2.7 1.59
m middle - w high/pr 2.7 2.5 1.16 3.6 3.3 1.72 3.1 2.8 1.49
m high/pr - w middle 2.7 2.4 1.16 3.6 3.3 1.68 3.1 2.7 1.52
m high/pu - w high/pu 2.7 2.5 1.20 3.4 3.3 1.55 3.2 2.8 1.49
m high/pu - w high/pr 2.7 2.6 1.13 3.4 3.1 1.62 3.4 3.2 1.58
m high/pr - w high/pu 2.7 2.5 1.14 3.4 3.2 1.60 3.1 2.7 1.46
m high/pr - w high/pr 2.6 2.4 1.05 3.6 3.3 1.60 3.5 3.3 1.60
Total 2.8 2.5 1.26 3.5 3.2 1.76 3.2 2.8 1.69
Births 344431 68666 9218 Note and source: See Table 1.
6. Results
Table 4 displays the multinomial logit estimates of birth and separation for the birth intervals separately (panels A–C). In general, it seems clear that the higher the educational power, the higher the chances of having a child. This is more or less true in all intervals. For third births, it is very clear that couples in the high power groups (i.e., in which both spouses are highly educated, and are labelled either high/pr or high/pu) are considerably more likely to continue childbearing than couples with medium educational status (relative risks ranging from 1.38 to 1.86). The same appears to be

Demographic Research: Volume 23, Article 30
http://www.demographic–research.org 862
true for fourth births, even though the highest group in which both spouses are employed in the private sector has a lower likelihood of childbirth (although not statistically significant). It is also important to note that the relationship between educational status and childbearing is not driven by couple income. This is illustrated in Figure 1, where the relative risks for births of different parities of two separate models are compared: one including couple income, and one without this control variable.
Table 4: Relative risks from multinomial logit estimates of experiencing a
birth or separation. 1991–2005
A. Previous births=1 B. Previous births=2 C. Previous births=3
Birth Separation Birth Separation Birth Separation
RR P>|z| RR P>|z| RR P>|z| RR P>|z| RR P>|z| RR P>|z|
Education status
m low – w low 0.82 0.000 1.54 0.000 0.79 0.000 1.36 0.000 0.99 0.843 1.43 0.000
m low – w middle 0.92 0.000 1.19 0.000 0.82 0.000 1.14 0.000 0.89 0.001 1.20 0.001
m middle – w low 0.88 0.000 1.38 0.000 0.84 0.000 1.23 0.000 1.00 0.991 1.25 0.000
m low – w high/pu 0.95 0.112 1.11 0.214 1.08 0.219 1.31 0.004 0.75 0.156 1.10 0.748
m high/pu – w low 0.99 0.886 1.34 0.000 1.11 0.104 1.13 0.251 1.22 0.133 1.38 0.155
m low – w high/pr 0.93 0.018 1.05 0.612 0.84 0.011 1.04 0.716 0.97 0.878 1.49 0.132
m high/pr – w low 1.02 0.310 1.16 0.023 1.04 0.370 0.94 0.400 1.07 0.558 0.89 0.545
m middle – w middle 1.00 r.c. 1.00 r.c. 1.00 r.c. 1.00 r.c. 1.00 r.c. 1.00 r.c.
m middle – w high/pu 1.02 0.264 0.94 0.004 1.36 0.000 1.08 0.225 1.19 0.098 1.08 0.673
m high/pu – w middle 1.15 0.000 0.86 0.028 1.41 0.000 0.89 0.040 1.23 0.005 0.78 0.081
m middle – w high/pr 1.06 0.001 0.87 0.000 0.99 0.883 0.96 0.476 1.12 0.354 1.05 0.799
m high/pr – w middle 1.19 0.000 0.77 0.003 1.32 0.000 0.78 0.000 1.01 0.872 0.86 0.138
m high/pu – w high/pu 1.13 0.000 0.77 0.000 1.86 0.000 0.84 0.056 1.65 0.000 0.48 0.008
m high/pu – w high/pr 1.15 0.000 0.56 0.000 1.50 0.000 0.75 0.037 1.33 0.150 0.66 0.286
m high/pr – w high/pu 1.14 0.000 0.66 0.000 1.62 0.000 0.73 0.000 1.20 0.110 0.49 0.007
m high/pr – w high/pr 1.19 0.000 0.49 0.012 1.38 0.000 0.69 0.000 0.89 0.313 0.77 0.110
Couple income (base am.)
No income 0.64 0.000 0.82 0.000 1.21 0.007 0.83 0.166 1.51 0.002 1.20 0.442
>2 0.75 0.000 1.22 0.000 1.21 0.000 1.21 0.000 1.45 0.000 1.29 0.021
2–4 0.83 0.000 1.30 0.000 1.17 0.000 1.28 0.000 1.33 0.000 1.40 0.000
4–6 0.88 0.000 1.27 0.000 1.10 0.000 1.25 0.000 1.14 0.005 1.10 0.184
6–8 1.00 r.c. 1.00 r.c. 1.00 r.c. 1.00 r.c. 1.00 r.c. 1.00 r.c.
8–10 1.04 0.000 0.76 0.000 0.84 0.000 0.83 0.000 0.84 0.000 0.84 0.001
10–12 1.12 0.000 0.72 0.017 0.79 0.000 0.80 0.000 0.79 0.000 0.86 0.005
12–14 1.21 0.000 0.74 0.000 0.82 0.000 0.85 0.000 0.67 0.000 0.85 0.010
14–16 1.30 0.000 0.83 0.000 0.87 0.000 0.93 0.016 0.76 0.000 0.81 0.011
16+ 1.44 0.000 0.92 0.000 1.00 0.929 1.01 0.664 0.75 0.000 1.06 0.444

Dribe & Stanfors: Family life in power couples
http://www.demographic–research.org 863
Table 4: (Continued)
A. Previous births=1 B. Previous births=2 C. Previous births=3
Birth Separation Birth Separation Birth Separation
RR P>|z| RR P>|z| RR P>|z| RR P>|z| RR P>|z| RR P>|z|
Wom. share of couple inc. 1.00 0.000 1.00 0.585 1.00 0.000 1.01 0.000 1.00 0.058 1.01 0.000
Man's age 1.09 0.000 0.89 0.000 0.98 0.040 0.87 0.000 0.90 0.000 0.82 0.000
Man's age sq. 1.00 0.000 1.00 0.000 1.00 0.943 1.00 0.000 1.00 0.000 1.00 0.000
Woman's age 2.43 0.000 1.01 0.839 1.39 0.000 0.69 0.000 1.43 0.000 0.82 0.000
Woman's age sq. 0.99 0.000 1.00 0.000 0.99 0.000 1.00 0.000 0.99 0.000 1.00 0.500
Wom. age at first birth 0.48 0.000 0.71 0.000 0.79 0.000 0.97 0.214 0.80 0.000 0.86 0.012
Wom. age at first birth sq. 1.01 0.000 1.00 0.015 1.01 0.000 1.00 0.545 1.01 0.000 1.00 0.012
Time since last birth
0.0–0.9 0.21 0.000 0.49 0.000 0.15 0.000 0.30 0.000 0.24 0.000 0.30 0.000
1.0–1.9 1.09 0.000 0.82 0.000 0.81 0.000 0.66 0.000 1.07 0.027 0.70 0.000
2.0–2.9 1.00 r.c. 1.00 r.c. 1.00 r.c. 1.00 r.c. 1.00 r.c. 1.00 r.c.
3.0–3.9 0.59 0.000 0.95 0.000 1.21 0.000 1.29 0.000 0.93 0.076 1.24 0.000
4.0–4.9 0.28 0.000 0.77 0.000 1.34 0.000 1.41 0.000 1.02 0.727 1.54 0.000
5.0–5.9 0.14 0.000 0.58 0.000 1.54 0.000 1.51 0.000 1.01 0.886 1.71 0.000
6.0–6.9 0.07 0.000 0.40 0.042 1.46 0.000 1.60 0.000 0.98 0.773 1.73 0.000
7.0–7.9 0.04 0.000 0.28 0.000 1.41 0.000 1.57 0.000 0.86 0.066 1.91 0.000
Place of residence
Metro cities 0.86 0.000 1.63 0.805 0.89 0.000 1.53 0.000 1.01 0.901 1.34 0.000
Metro suburbs 0.98 0.109 1.17 0.000 0.89 0.000 1.18 0.000 0.85 0.002 1.13 0.093
Big cities 0.94 0.000 1.22 0.000 0.97 0.095 1.17 0.000 0.99 0.753 1.11 0.121
Commuter 1.00 r.c. 1.00 r.c. 1.00 r.c. 1.00 r.c. 1.00 r.c. 1.00 r.c.
Rural 0.98 0.315 0.93 0.000 1.34 0.000 0.95 0.217 1.37 0.000 0.80 0.025
Manufacturing 1.03 0.014 0.86 0.004 1.12 0.000 0.82 0.000 1.03 0.655 0.80 0.009
Other>25000 0.96 0.000 1.10 0.249 0.99 0.687 1.08 0.005 1.01 0.834 1.04 0.601
Other12500–25000 0.98 0.036 1.01 0.000 1.06 0.004 0.98 0.495 1.10 0.110 0.93 0.396
Other<12500 1.00 0.764 0.85 0.000 1.12 0.000 0.91 0.017 1.03 0.681 0.87 0.159
Country of birth
Swe – Swe 1.00 r.c. 1.00 r.c. 1.00 r.c. 1.00 r.c. 1.00 r.c. 1.00 r.c.
Swe – Nordic 0.90 0.000 1.15 0.117 1.04 0.059 1.29 0.000 1.30 0.000 1.39 0.000
Swe – Eur/N.Am. 0.79 0.000 1.39 0.326 1.00 0.979 1.38 0.000 1.27 0.000 1.16 0.149
Swe – Rest 0.74 0.000 1.64 0.269 1.11 0.000 1.58 0.000 1.53 0.000 1.44 0.000
Nordic – Nordic 0.63 0.000 0.79 0.003 1.16 0.034 1.10 0.350 1.50 0.018 1.01 0.965
Nordic – Eur/N.Am. 0.67 0.000 1.18 0.008 1.17 0.231 1.57 0.008 2.07 0.017 2.24 0.051
Nordic – Rest 0.73 0.000 1.53 0.000 1.25 0.042 1.67 0.000 1.69 0.039 1.58 0.209
Eur/N.Am. – Eur/N.Am. 0.34 0.000 0.74 0.000 0.72 0.000 0.80 0.000 0.96 0.711 1.22 0.161
Eur/N.Am. – Rest 0.55 0.000 1.61 0.000 1.05 0.490 1.37 0.002 1.29 0.149 1.53 0.079
Rest – Rest 0.74 0.000 1.03 0.000 1.83 0.000 1.09 0.007 2.31 0.000 1.04 0.604

Demographic Research: Volume 23, Article 30
http://www.demographic–research.org 864
Table 4: (Continued)
A. Previous births=1 B. Previous births=2 C. Previous births=3
Birth Separation Birth Separation Birth Separation
RR P>|z| RR P>|z| RR P>|z| RR P>|z| RR P>|z| RR P>|z|
Cohort (woman)
1946–1954 1.00 r.c. 1.00 r.c. 1.00 r.c. 1.00 r.c. 1.00 r.c. 1.00 r.c.
1955–1959 1.34 0.000 1.11 0.117 1.54 0.000 1.05 0.724 3.00 0.033 0.73 0.503
1960–1964 1.41 0.000 1.07 0.326 1.71 0.000 0.89 0.415 3.17 0.025 0.57 0.233
1965–1969 1.32 0.000 0.92 0.269 1.67 0.000 0.73 0.029 3.35 0.019 0.41 0.060
1970–1974 1.20 0.000 0.81 0.003 1.72 0.000 0.60 0.000 3.73 0.011 0.30 0.011
1975–1979 1.05 0.141 0.82 0.008 1.89 0.000 0.51 0.000 4.80 0.003 0.22 0.002
1980–1988 0.97 0.354 0.67 0.000 2.10 0.000 0.34 0.000 5.82 0.002 0.15 0.001
Civil status
Cohabiting 1.00 r.c. 1.00 r.c. 1.00 r.c. 1.00 r.c. 1.00 r.c. 1.00 r.c.
Married 1.26 0.000 0.33 0.000 1.41 0.000 0.443 0.000 1.31 0.000 0.45 0.000
Number of obs 1523818 1518650 293974
Wald chi2(124) 202585 53273 10200
Prob > chi2 0.0000 0.0000 0.0000
Pseudo R2 0.1313 0.0647 0.0753
Log pseudolikelihood -869007 -404946 -58948 Note and source: See Table 1.

Dribe & Stanfors: Family life in power couples
Figure 1a–c.: Model comparisons of relative risks of birth by educational status with and without controlling for couple income and woman’s income share of couple income.
a. Previous births=1
b. Previous births=2
http://www.demographic–research.org 865

Demographic Research: Volume 23, Article 30
Figure 1: (Continued)
c. Previous births=3
Note: Based on model estimates controlling for all other variables in table 4. Educational categories with husband first, i.e., L/L
is “m low/w low”, L/M “m low/w middle”, etc. Source: See Table 1.
For second births (panel A), high power couples have greater chances of having a
birth, irrespective of sector of employment, which demonstrates that higher education and career are widely perceived to be compatible with family in Sweden.6 However, the results indicate that, for third and fourth births, the sector of employment seems to matter a great deal, not only for power couples, but also among couples in which one spouse has lower educational status. Couples in which one spouse has high educational power and is employed in the public sector are more likely to have a second or higher birth than comparable couples in which the spouse is employed in the private sector. It does not matter much whether it is the man or the woman who works in the public sector, but it is noteworthy that power couples in which both spouses are employed in the public sector have the highest chances of having a third and a fourth birth.7
6 We do not, however, wish to imply that having children and a family is unproblematic. At least one partner may work less during the baby years, and have a slower and/or more difficult career path as a result. Nevertheless, childbearing is not delayed, and this serves as an indicator that even power couples see that there are ways of combining work and family. 7 Using ’m high/pr – w high/pr’ as the reference category also shows that the differences according to sector of employment are statistically significant (results not shown).
http://www.demographic–research.org 866

Dribe & Stanfors: Family life in power couples
http://www.demographic–research.org 867
The public sector is generally seen as more family-friendly than the private sector. In Sweden, the public sector led the way in introducing work arrangements and conditions that make it easier for employees to combine work and parenthood, and that minimise the economic effects of career breaks. Many of the compatibility-enhancing work arrangements in Sweden are, however, granted by law (e.g., parental leave and minimum parental leave benefits, the right to work reduced hours, temporary absence in order to care for a sick child, job retention, etc.). In the 1990s, it became more common for private sector companies to introduce programmes to help their professional employees better combine parenthood and career. The core components of these programmes were additional compensation granted by contract during parental leave8, more flexible work schedules and opportunities to work from home, additional income compensation for parents on leave, guarantees of job continuation for parents on leave, and continuous on-the-job training. In theory, these programmes should have reduced the differences in work-family compatibility between the sectors of employment, but it is apparent that such differences nonetheless persist.
For separations, the picture is exactly the opposite of that for continued childbearing. Couples with low educational status have much higher separation risks than middle status couples, while power couples have the lowest risk of experiencing a separation in all intervals. This finding holds irrespective of parity of previous births, and of sector of employment. It is quite clear that educational homogamy tends to stabilise unions among the highly educated. While educationally homogamous power couples are at lowest risk of union dissolution, couples with one highly educated spouse and another with a medium level of education are less likely to separate than couples with lower and less similar levels of education. Thus, power couples have a considerably higher degree of union stability than couples with medium and lower educational status, and are also more likely to proceed to higher parities than medium and low status couples. At least part of the explanation for these low dissolution rates could be the more egalitarian attitudes and division of household labour and specialisation seen among these couples. In dual-career households in which both spouses have high levels of career involvement, both partners also have a high degree of independence and access to economic resources, and therefore have a solid basis for negotiation. Moreover, competing preferences and stress can be mediated in these couples through each partner’s understanding of the other’s workload. When it comes to childrearing, couples with higher educational status and skills share more of the total parental leave benefits than those with lower educational status and skills (Sundström and Duvander 2002), and they make greater use of public child care. Taken together, it
8 This is of importance for power couples, as there is a ceiling with respect to level of compensation in the form of parental leave benefits, which leaves higher earners with less generous compensation in relative terms.
Demographic Research: Volume 23, Article 30
http://www.demographic–research.org 868
would appear that a more egalitarian relationship between the spouses, and the more harmonious family life that emerges as a result of this balance of power, can also be fertility enhancing.
Looking briefly at some of the control variables, we can see that there is a clear positive (couple) income effect for second births. Overall, the impact of income on birth risks is rather linear. Couples with very low incomes are about 25% less likely to experience a second birth than middle income couples. In the highest income groups, the probability of having a second birth is about 40% higher than among middle income couples. For third and fourth births, on the other hand, the patterns are entirely different. Here we see a negative relationship between income and fertility. Controlling for educational status, high income couples are found to have lower chances of having a third and fourth child than middle income couples, and the couples with the lowest incomes show the highest relative risks of childbirth in these intervals. Even though the means reported in Table 1 show that the two lowest income groups are quite small, this does not change the pattern.
As was the case with educational status, we find that the income effect hardly changes at all if we do not control for educational status (results not shown). This is not a simple compositional effect attributable to a failure to fully control for the high fertility of low income immigrants in the sample, as was shown in a study with similar findings in which the country of birth was controlled for in much greater detail (Andersson and Scott 2007). Moreover, because there is no indication that the effects are stronger for couples in which the woman, rather than the man, has a low income (results not shown), it is less likely that the negative effect of income on higher order births is a result of a reverse causation in which high fertility women withdraw from the labour market, and thus earn less. If anything, the opposite effect can be observed: couples in which the woman earns a higher share of the household income have a higher risk of having a second or third birth, though no effect is seen for fourth births. The magnitudes of the effects are not large: when a 10-percentage unit higher share of the couple’s income is earned by the woman, the risk of a second birth increases by 4%, and even less for third births.
The relationship between couple income and separations is not as clear as in the case of income and childbearing. The patterns are quite similar between different intervals. Excluding couples with no income, low and medium income couples (below 8–10 base amounts) have about the same risks of separation, while the risks are a bit lower in the interval 8–14 base amounts. At the highest incomes, the differences relative to the medium and low income couples are not statistically significant, and are also of a low magnitude. Thus, it is only at moderately high couple incomes that the separation risks are lower (about 20%) than at medium, low, and very high incomes. When a larger share of a couple income’s is earned by the woman, the separation risk

Dribe & Stanfors: Family life in power couples
http://www.demographic–research.org 869
also increases. This finding is consistent with theories of divorce that predict that higher female income and independence contributes to a stronger bargaining position, and thus to a lower cost of divorce for a woman (see e.g., Becker 1991).
The metropolitan areas and big cities have some of the lowest fertility in all intervals, except perhaps in interval 3–4. This is in line with previous findings (Kulu, Vikat, and Andersson 2007). Couples in rural areas have the highest risk of having third and fourth children. Although urban areas have the most dynamic labour markets, especially for the well-educated, they are crowded and housing is often expensive. Moreover, many people move to cities in order to work or study, and the move takes them away from kin and social networks. Difficulties in finding adequate housing for a bigger family and assistance in taking care of children after regular day care hours may be factors inhibiting continued childbearing. It also evident that separation risks are higher in the metropolitan areas and bigger cities than in other communities.
Couples in which both spouses were born in Sweden have the highest risk of having a second child. However, when looking at third and fourth births, we see that immigrant status becomes more important, as couples in which both spouses come from outside Europe and North America are more likely to have a child. However, the non-Swedish-endogamous couples not only have higher risks of experiencing a higher order birth; they also show higher separation risks at these intervals, in most cases in the second interval. Immigrant or intermarried couples are both more child-oriented and less stable. In line with the findings of many previous studies, our analysis showed that formally married couples have higher fertility than cohabiting couples, and that this is true for all birth intervals. Married couples are generally seen as more child-oriented than those in informal unions. This has to do with selection, because even if non-marital cohabitation is widespread in Sweden, lifelong cohabitation is not common because many cohabiting couples decide to formalise their unions and marry once they have entered parenthood (Bernhardt 2002). Whereas about two-thirds of all first births are born to cohabiting parents, second and higher order births are more likely to take place within marriage. Non-marital cohabitation is also associated with considerably elevated separation risks, as is clear from Table 4.
7. Conclusion
In research dealing with the interaction between work and family in contemporary societies, there is a strong tendency to assume that family life is highly incompatible with pursuing a career, at least for women. While different views can be found in the literature, most of the research has studied women only, and has generally found

Demographic Research: Volume 23, Article 30
http://www.demographic–research.org 870
corroborating evidence for these rather negative claims about the relationship between professional life and family life.
In this article, we have sought to deepen the understanding of the conditions of working life and their connection to partner stability and childbearing by focusing on a rather small group of couples in which both the man and the woman have the highest educational levels in the fields most likely to be characterised by pronounced career paths. We call them power couples, and we have studied the extent to which their childbearing patterns after the first child and their risk of separation differ from patterns seen among other couples.
We expected to find that power couples in Sweden enjoy a comparatively favourable situation in terms of family-work compatibility, which enables them to combine career with continued childbearing. Thus, we did not expect to find lower fertility after the first birth among these couples than among less career-oriented couples. The results strongly support this hypothesis: power couples are found to be considerably more likely to continue childbearing after the first birth than other couples. In fact, we observed a more or less linear positive relationship between educational power and fertility in all intervals: the couples with the lowest educational status were found to have the lowest likelihood of having another birth, while those with the highest status were shown to have the greatest chance of having a child. Only minor differences in fertility could be demonstrated between couples in which just the man or just the woman has higher educational status than the other spouse. Higher educational status was also found to be connected to lower risks of partner dissolution, and thus to a higher degree of union stability.
Our second hypothesis, that power couples employed in the public sector are more likely to continue childbearing once they have had their first child due to their more family-friendly work conditions, is supported for third and fourth births. Power couples with at least one spouse employed in the public sector are more likely to have a third and a fourth child than other power couples. It does not seem to matter much if the man or the woman works in the public sector. Moreover, the sector of employment does not appear to have any significant effect on union stability.
The third hypothesis concerns the impact of educational homogamy on union stability. We find that educational homogamy leads to a lower risk of separation among the highly educated. Thus, power couples have a considerably higher degree of union stability than couples with medium and lower educational status, and are also more likely to proceed to higher parities than the medium and low status couples.
These findings clearly indicate that there are high degrees of family commitment and of work-family compatibility in Sweden. The fact that power couples are not just as likely as other couples to continue childbearing, but are even more likely, could be related to the fact that the provision of generous parental leave, child benefits, and

Dribe & Stanfors: Family life in power couples
http://www.demographic–research.org 871
subsidised child care reduces the opportunity cost of parents’ earnings on fertility, making it independent of education. For those couples who have already resolved the question of whether to have children and have made the transition to parenthood, the majority will go on to have a second birth, since the two-child norm is very strong. Having a third child is, however, seen as optional, and most men and women will not choose to have three or more children. Since the income effect is relevant not just for women in very high earning couples who choose to go on to the higher parities, our results could be seen as an indication of various compatibility-enhancing factors that also alleviate some of the opportunity costs connected to childbearing and child-rearing. The findings for these power couples may also be related to the more equal division of housework in these households, the more egalitarian attitudes among highly educated men, and the greater level of mutual support between partners, including the better understanding of each other’s work situations, as both partners in these couples know the challenges associated with career-track jobs. Overall, power couples have greater means for balancing work and family than other couples. Regardless of the reasons why, it seems safe to conclude that highly educated couples in Sweden do not feel forced to abstain from continued childbearing after having one child, and that they also have a lower risk of union dissolution. However, this does not mean that these couples do not face challenges in combining family life and career. There are frequent reports, both in the research literature and in the public debate, of parents of small children feeling stressed and pressured by the conflicting demands of home and work.
8. Acknowledgements
This work was conducted within the project “Male Fertility and Fatherhood,” which was financed by the Swedish Research Council. A previous version of the paper was presented at the annual meeting of the Population Association of America, New Orleans, 2008; the IUSSP seminar on Fertility and Public Policies in Low Fertility Countries, Barcelona, July 2008. We are grateful to participants at these events, and to Jan Hoem, Andrew Hinde, and Gunnar Andersson for their valuable comments and suggestions.

Demographic Research: Volume 23, Article 30
http://www.demographic–research.org 872
References
Abbott, M. (2003). Power couples. Harlow: Pearson Education Limited.
Altucher, K.A. and Williams, L.B. (2003). Family clocks: Timing parenthood. In: Moen, P. (ed.). It's about time: Couples and careers. Ithaca: Cornell University Press: 49–59.
Andersson, G. and Scott, K. (2007). Childbearing dynamics in a universalistic welfare state: The role of labor-market status, country of origin, and gender. Demographic Research 17(30): 897–938. doi:10.4054/DemRes.2007.17.30.
Becker, G.S. (1973). A theory of marriage: Part 1. Journal of Political Economy 81(4): 813–846. doi:10.1086/260084.
Becker, G.S. (1991). A treatise on the family. Cambridge: Harvard University Press.
Becker, G.S., Landes, E.M., and Michael, R.T. (1977). An economic analysis of marital instability. Journal of Political Economy 85(6): 1141–1187. doi:10.1086/260631.
Benham, L. (1974). Benefits of women’s education within marriage. Journal of Political Economy 82(S2): 57–71. doi:10.1086/260291.
Bernardi, F. (1999). Does the husband matter? European Sociological Review 15(3): 285–300.
Bernasco, W. (1994). Coupled careers. The effects of spouse’s resources on success at work. Amsterdam: Thesis Publication.
Bernhardt, E. and Goldscheider, F. (2006). Gender equality, parenthood attitudes, and first births in Sweden. Vienna Yearbook of Population Research 2006: 19-39. (Vienna: Vienna Institute of Demography).
Bernhardt, E.M. (2002). Cohabitation and marriage among young adults in Sweden: Attitudes, expectations and plans. In: Carling, J. (ed.). Nordic demography: Trends and differentials. Oslo: Unipub/Nordic Demographic Society: 157–170.
Billari, F.C. and Kohler, H.-P. (2004). Patterns of low and lowest-low fertility in Europe. Population Studies 58(2): 161–176. doi:10.1080/ 0032472042000213695.
Blackburn, M.L., Bloom, D.E., and Neumark, D. (1993). Fertility timing, wages, and human capital. Journal of Population Economics 6(1): 1–30. doi:10.1007/BF00164336.

Dribe & Stanfors: Family life in power couples
http://www.demographic–research.org 873
Bloom, D.E. and Trussell, J. (1984). What are the determinants of delayed childbearing and permanent childlessness in the United States? Demography 21(4): 591–611. doi:10.2307/2060917.
Blossfeld, H.-P. and Drobnic, S. (eds.) (2001). Careers of couples in contemporary societies: From male breadwinner to dual earner families. Oxford: Oxford University Press.
Blossfeld, H.-P. and Huinink, J. (1991). Human capital investments or norms of role transition? How women’s schooling and career affect the process of family formation. American Journal of Sociology 97(1): 143–168. doi:10.1086/229743.
Bram, S. (1985). Childlessness revisited: A longitudinal study of voluntary childless couples, delayed parents, and parents. Lifestyles 8(1): 46–66. doi:10.1007/BF01435914.
Bumpass, L.L. and Sweet, J.A. (1972). Differentials in marital instability: 1970. American Sociological Review 37(6): 754–766. doi:10.2307/2093585.
Compton, J. and Pollak, R.A. (2004). Why are power couples increasingly concentrated in large metropolitan areas? (NBER Working Paper No. W10918).
Costa, D.L. and Kahn, M.E. (2000). Power couples: Changes in the location choice of the college educated, 1940-1990. Quarterly Journal of Economics 115(4): 1287–1315. doi:10.1162/003355300555079.
Dribe, M. and Stanfors, M. (2009). Education, work and parenthood: Comparing the experience of young men and women in Sweden. Journal of Family and Economic Issues 30(1): 32–42. doi:10.1007/s10834-008-9134-7.
Gerson, K. (1985). Hard choices. How women decide about work, career, and motherhood. Berkeley: University of California Press.
Gerster, M., Keiding, N., Knudsen, L.B., and Strandberg-Larsen, K. (2007). Education and second birth rates in Denmark 1981–1994. Demographic Research 17(8): 181–210. doi:10.4054/DemRes.2007.17.8.
Glenn, N.D., Hoppe, S.K., and Weiner, D. (1974). Social class heterogamy and marital success: A study of the empirical adequacy of a textbook generalization. Social Problems 21(4): 539–550. doi:10.1525/sp.1974.21.4.03a00070.
Goldstein, J.R. and Harknett, K. (2006). Parenting across racial and class lines: Assortative mating patterns of new parents who are married, cohabiting, dating or no longer romantically involved. Social Forces 85(1): 121–143. doi:10.1353/sof.2006.0125.

Demographic Research: Volume 23, Article 30
http://www.demographic–research.org 874
Gregson, N. and Lowe, M. (1994). Renegotiating the domestic division of labor? A study of dual-career households in North East and South East England. Sociology 28(1): 55–78. doi:10.1177/0038038594028001005.
Gustafsson, S. (2001). Optimal age at motherhood. Theoretical and empirical considerations on postponement of maternity in Europe. Journal of Population Economics 14(2): 225–247. doi:10.1007/s001480000051.
Gustafsson, S. and Wetzels, C. (2000). Optimal age at giving birth: Germany, Great Britain, the Netherlands and Sweden. In: Gustafsson, S.S. and Meulders, D.E. (eds.). Gender and the Labor Market. Econometric Evidence on Obstacles in Achieving Gender Equality. Basingstoke: MacMillan: 188–209.
Happel, S.K., Hill, J.K., and Low, S.A. (1984). An economic analysis of the timing of childbirth. Population Studies 38(2): 299–311. doi:10.2307/2174078.
Hardill, I., Green, A.C., Dudleston, A.C., and Owe, D.W. (1997). Who decides what? Decision making in dual-career households. Work, Employment and Society 11(2): 313–326.
Henz, U. and Jonsson, J.O. (2003). Union disruption in Sweden. Does economic dependency inhibit separation? International Journal of Sociology 33(1): 3–39.
Hewlett, S.A. (2002). Executive women and the myth of having it all. Harvard Business Review 80(1): 66–73.
Hewlett, S.A. (2003). Creating a life. What every woman needs to know about having a baby and a career. New York: Miramax Books.
Hoem, B. (1993). The compatibility of employment and childbearing in contemporary Sweden. Acta Sociologica 36(2): 101–120. doi:10.1177/000169939303600202.
Hoem, B. and Hoem, J.M. (1989). The impact of women's employment on second and third births in modern Sweden. Population Studies 43(1): 47–67. doi:10.1080/0032472031000143846.
Hoem, J.M. (1997). Educational gradients in divorce risk in Sweden in recent decades. Population Studies 51(1): 19–27. doi:10.1080/0032472031000149696.
Hoem, J.M., Neyer, G., and Andersson, G. (2006a). Education and childlessness: The relationship between educational field, educational level, and childlessness among Swedish women born in 1955–59. Demographic Research 14(15): 331–380. doi:10.4054/DemRes.2006.14.15.

Dribe & Stanfors: Family life in power couples
http://www.demographic–research.org 875
Hoem, J.M., Neyer, G., and Andersson, G. (2006b). Educational attainment and ultimate fertility among Swedish women born in 1955–59. Demographic Research 14(16): 381–404. doi:10.4054/DemRes.2006.14.16.
Jalovaara, M. (2001). Socio-economic status and divorce in first marriages in Finland 1991–93. Population Studies 55(2): 119–133. doi:10.1080/00324720127685.
Jalovaara, M. (2003). The joint effects of marriage partners’ socioeconomic positions on the risk of divorce. Demography 40(1): 67–81. doi:10.1353/dem.2003.0004.
Joshi, H. (2002). Production, reproduction and education: Women, children and work in a British perspective. Population and Development Review 28(3): 445–474. doi:10.1111/j.1728-4457.2002.00445.x.
Kalmijn, M. and Poortman, A. (2006). His or her divorce? The gendered nature of divorce and its determinants. European Sociological Review 22(2): 201–214. doi:10.1093/esr/jci052.
Kravdal, Ø. (1992). The weak impact of female labor force participation on Norwegian third-birth rates. European Journal of Population 8(3): 247–263. doi:10.1007/BF01797212.
Kravdal, Ø. (2001). The high fertility of college educated women in Norway: An artefact of the separate modelling of each parity transition. Demographic Research 5(6): 187–216. doi:10.4054/DemRes.2001.5.6.
Kravdal, Ø. (2007). Effects of current education on second- and third-birth rates among Norwegian women and men born in 1964: Substantive interpretations and methodological issues. Demographic Research 17(9): 211–246. doi:10.4054/DemRes.2007.17.9.
Kreyenfeldt, M. (2002). Time-squeeze, partner effect or self-selection? An investigation into the positive effects of women’s education on second birth risks in West Germany. Demographic Research 7(2): 15–48. doi:10.4054/DemRes.2002.7.2.
Kulu, H., Vikat, A., and Andersson, G. (2007). Settlement size and fertility in the Nordic countries. Population Studies 61(3): 265–286. doi:10.1080/ 00324720701571749.
Lappegård, T. (2002). Education attainment and fertility pattern among Norwegian women. (Statistics Norway Document 2000/18).
Lyngstad, T.H. (2004). The impact of parents’ and spouses’ education on divorce rates in Norway. Demographic Research 10(5): 121–142. doi:10.4054/ DemRes.2004.10.5.

Demographic Research: Volume 23, Article 30
http://www.demographic–research.org 876
Marini, M.M. (1984). Women’s educational attainment and the timing of entry into parenthood. American Sociological Review 49(4): 491–511. doi:10.2307/2095464.
McDonald, P. (2000). Gender equity in theories of fertility transition. Population and Development Review 26(3): 427–439. doi:10.1111/j.1728-4457.2000.00427.x.
Mincer, J. (1963). Market prices, opportunity costs, and income effects. In: Christ, E. et al. (eds.). Measurement in Economics. Stanford: Stanford University Press: 67–82.
Nock, S.L. (1995). Commitment and dependency in marriage. Journal of Marriage and Family 57(2): 503–514. doi:10.2307/353702.
Ono, H. (1998). Husbands’ and wives’ resources and marital dissolution. Journal of Marriage and Family 60(3): 674–689. doi:10.2307/353537.
Oppenheimer, V.K. (1997). Women’s employment and the gain to marriage: The specialization and trading model. Annual Review of Sociology 23(1): 431–453. doi:10.1146/annurev.soc.23.1.431.
Polachek, S.W. (1981). Occupational self-selection: A human capital approach to sex differences in occupational structure. Review of Economics and Statistics 63(1): 60–69. doi:10.2307/1924218.
Rapoport, R. and Rapoport, R.N. (1969). The dual career family. A variant pattern and social change. Human Relations 22(1): 3–30. doi:10.1177/ 001872676902200101.
Rapoport, R. and Rapoport, R.N. (1971). Dual-career families. Harmondsworth: Penguin Books.
Rindfuss, R.R., Morgan, S.P., and Offutt, K. (1996). Education and the changing age pattern of American fertility: 1963–1989. Demography 33(3): 277–290. doi:10.2307/2061761.
Rindfuss, R.R., Morgan, S.P., and Swicegood, G. (1988). First births in America: Changing patterns of parenthood. Berkeley, CA: University of California Press.
Spain, D. and Bianchi, S.M. (1996). Balancing act. Motherhood, marriage, and employment among American women. New York: Russell Sage Foundation.
Stanfors, M. (2003). Education, labor force participation and changing fertility patterns. A study of women and socioeconomic change in twentieth century Sweden. Stockholm: Almqvist and Wiksell International.

Dribe & Stanfors: Family life in power couples
http://www.demographic–research.org 877
Stone, P. (2007). Opting out? Why women really quit careers and head home. Berkeley, CA: University of California Press.
Sundström, M. and Duvander, A.-Z. (2002). Gender division of childcare and the sharing of parental leave among new parents in Sweden. European Sociological Review 18(4): 433–447. doi:10.1093/esr/18.4.433.
Tanturri, M.L. and Mencarini, L. (2008). Childless or childfree? Paths to voluntary childlessness in Italy. Population and Development Review 34(1): 51–77. doi:10.1111/j.1728-4457.2008.00205.x.
Tjötta, S. and Vaage, K. (2003). Union disruption in Norway. International Journal of Sociology 33(1): 40–63.
Tynes, S.R. (1990). Educational heterogamy and marital satisfaction between spouses. Social Science Research 19(2): 153–174. doi:10.1016/0049-089X(90)90019-F.
Tzeng, J.M. and Mare, R.D. (1995). Labor market and socioeconomic effects on marital stability. Social Science Research 24(4): 329–351. doi:10.1006/ssre.1995.1013.
Van Bavel, J. (2010). Choice of study discipline and the postponement of motherhood in Europe: The impact of expected earnings, gender composition and family attitudes. Demography 47(2): 439–458. doi:10.1353/dem.0.0108.

Demographic Research: Volume 23, Article 30
http://www.demographic–research.org 878