FALL ENROLLMENT REPORT UNIVERSITY OF HAWAI‘I … FALL ENROLLMENT REPORT UNIVERSITY OF HAWAI‘I AT...
29
FALL ENROLLMENT REPORT UNIVERSITY OF HAWAI‘I AT HILO FALL 2006 Institutional Research Office University of Hawai‘i April 2007 File Reference: Management and Planning Support Folder, Enrollment Reports available online at: http://www.hawaii.edu/iro/maps.htm
Transcript of FALL ENROLLMENT REPORT UNIVERSITY OF HAWAI‘I … FALL ENROLLMENT REPORT UNIVERSITY OF HAWAI‘I AT...
FALL ENROLLMENT REPORT
UNIVERSITY OF HAWAI‘I AT HILO
FALL 2006
Institutional Research Office
University of Hawai‘i
April 2007
File Reference: Management and Planning Support Folder, Enrollment
Reports available online at: http://www.hawaii.edu/iro/maps.htm

THE UNIVERSITY OF HAWAI>I AT HILO HEADCOUNT ENROLLMENT, FALL 2006
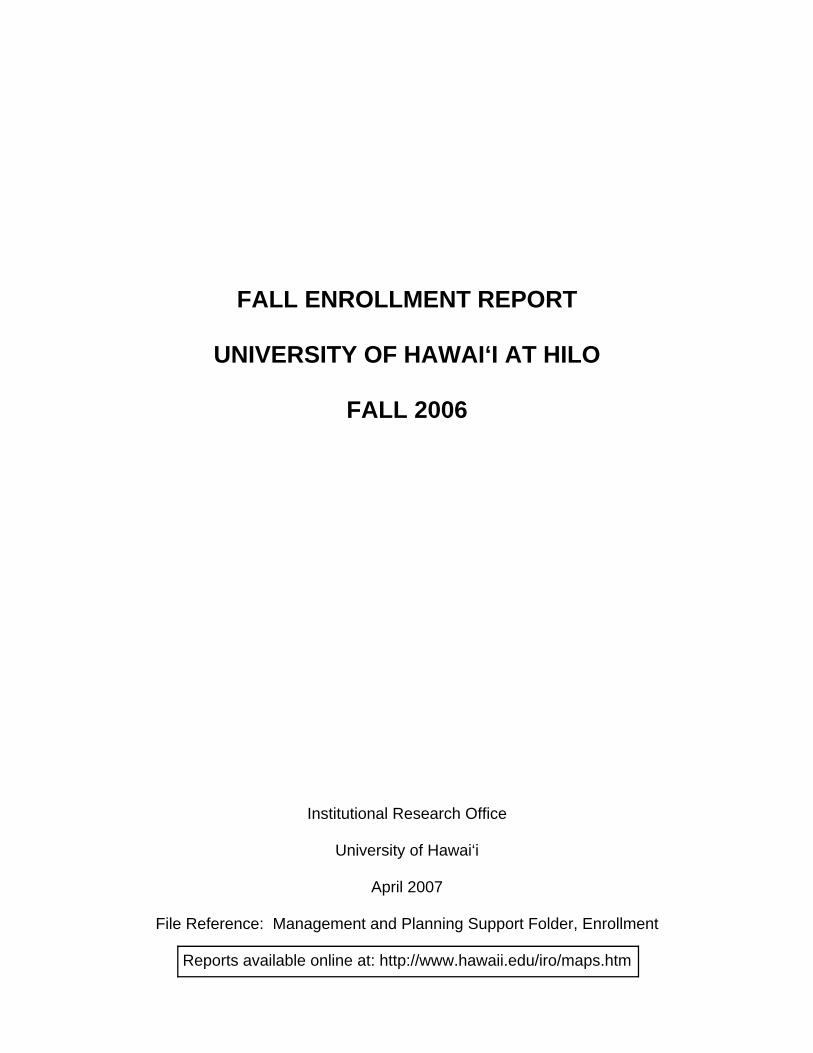
Headcount enrollment at the University of Hawai>i at Hilo measured 3,507 for Fall 2006, a 2.5% increase over the previous fall semester and a new historical high enrollment (Table 1 and Figures 1 & 2). Full-Time Equivalent (FTE) enrollment increased 1.5% to reach 2,949, also a new historical high (Table 2). Since Fall 1997, headcount enrollment has increased 32.9%, while FTE enrollment has increased 35.6%. In Fall 2003, the UH four-year campuses migrated to a new student registration system. In Fall 2005, the University of Hawai‘i Institutional Research Office completed development of the IRO Base table. Breakouts for certain items in the report tables, such as citizenship and mailing address, have changed. The Hawaiian Ancestry measure is new. Data for certain other items may show discontinuities due to changes in data processing. The reader is advised to exercise caution when examining trends or percentage data over time. With the migration to a new student registration system in Fall 2003, ethnic reporting has been expanded to include additional Asian and Pacific Islander categories (Tables 3, 4 & 7). However, only new students are included in these new categories; students already enrolled are shown under the ethnic category previously selected. Other Fall 2006 enrollment highlights:
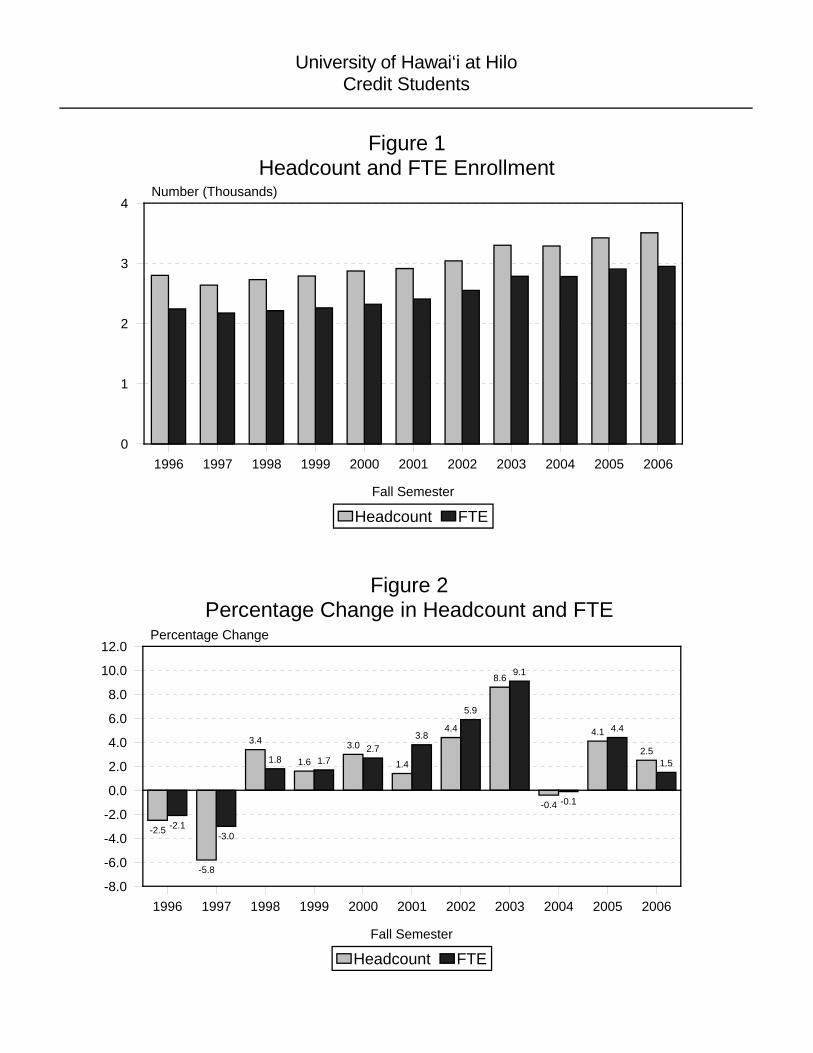
! Enrollment in the Western Undergraduate Exchange program declined 8.5% in Fall 2006 to 472 students, the lowest level since Fall 2002. The period of rapid enrollment growth observed in this program since inception in Fall 1997 appears to have ended (Figure 4).
! Students with neighbor island mailing addresses have been increasing in
recent years, and measured 221 (6.3% of total enrollment) in Fall 2006 (Figure 5). This measure may reflect increased delivery of instruction via distance education.
! Students of Hawaiian Ancestry measured 721 students in Fall 2006, 20.6% of
total enrollment. This item was added to the report in Fall 2005. Students were asked on the application to indicate Hawaiian ancestry. The figures given in Table 3 and Table 4 show the aggregate number of students who indicated “Yes” to Hawaiian ancestry or who selected Hawaiian ethnicity.
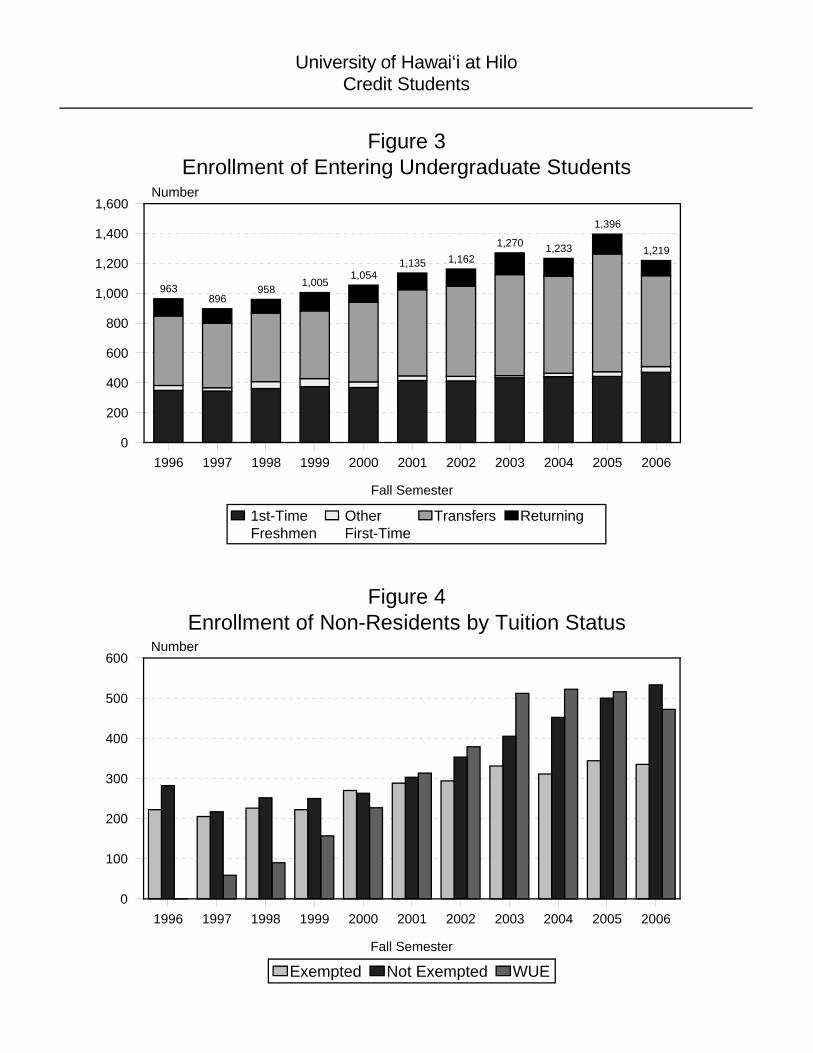
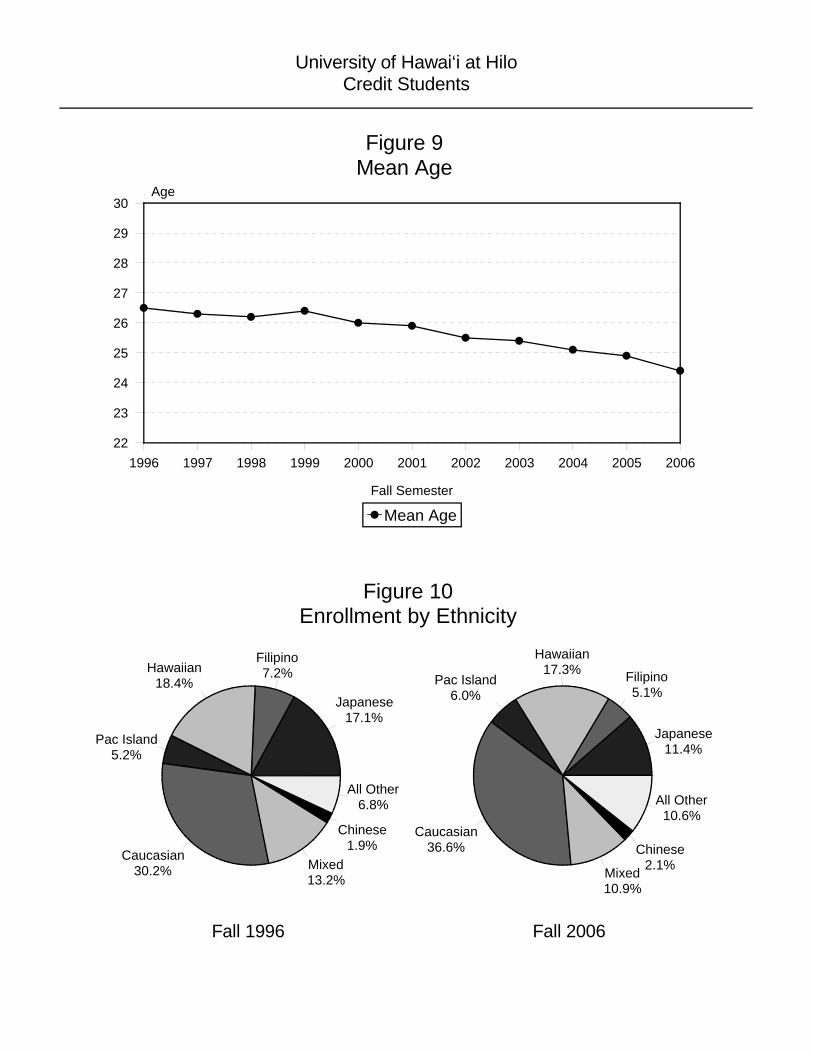
! In Fall 2006, 79.4% of the students at UH Hilo were enrolled full-time (Table 3
& Figure 7). Women comprised just over 60% of total enrollment (Figure 8). The Mean Age of students continued to decline, measuring 24.4 years, the lowest level in over ten years (Figure 9).
! The student body is ethnically diverse and continues to diversify (Figure 10).
UH Hilo enrolls the highest percentage of Pacific Islanders (other than Hawaiian / Part-Hawaiian) of any campus in the UH system, measuring 6.0% of total enrollment in Fall 2006.
1996 1997 1998 1999 2000 2001 2002 2003 2004 2005 2006
Fall Semester
0
1
2
3
4 Number (Thousands)
Headcount FTE
Figure 1Headcount and FTE Enrollment
-2.5
-5.8
3.4
1.6
3.0
1.4
4.4
8.6
-0.4
4.1
2.5
-2.1-3.0
1.8 1.72.7
3.8
5.9
9.1
-0.1
4.4
1.5
1996 1997 1998 1999 2000 2001 2002 2003 2004 2005 2006
Fall Semester
0.0
2.0
4.0
6.0
8.0
10.0
12.0
-2.0
-4.0
-6.0
-8.0
Percentage Change
Headcount FTE
Figure 2Percentage Change in Headcount and FTE
University of Hawai‘i at HiloCredit Students
963896
958 1,0051,054
1,135 1,1621,270 1,233
1,396
1,219
1996 1997 1998 1999 2000 2001 2002 2003 2004 2005 2006
Fall Semester
0
200
400
600
800
1,000
1,200
1,400
1,600 Number
1st-Time Freshmen
Other First-Time
Transfers Returning
Figure 3Enrollment of Entering Undergraduate Students
University of Hawai‘i at HiloCredit Students
1996 1997 1998 1999 2000 2001 2002 2003 2004 2005 2006
Fall Semester
0
100
200
300
400
500
600 Number
Exempted Not Exempted WUE
Figure 4Enrollment of Non-Residents by Tuition Status

University of Hawai‘i at HiloCredit Students
Figure 6Enrollment by Registration Status
Continuing61.5%
Returning5.8%
First-Time13.8%
Transfers18.9%
Continuing61.8%
Returning4.3%
First-Time15.5%
Transfers18.4%
Fall 1996 Fall 2006
6144
75 82
144
117 122
155
184192
221
1996 1997 1998 1999 2000 2001 2002 2003 2004 2005 2006
Fall Semester
0
50
100
150
200
250 Number
Figure 5Students with Neighbor Island Mailing Address

1996 1997 1998 1999 2000 2001 2002 2003 2004 2005 2006
Fall Semester
20%
30%
40%
50%
60%
70%
80% Percent of Total Enrollment
Women Men
Figure 8Enrollment by Gender
University of Hawai‘i at HiloCredit Students
1996 1997 1998 1999 2000 2001 2002 2003 2004 2005 2006
Fall Semester
0%
20%
40%
60%
80%
100% Percent of Total Enrollment
Full-Time Part-Time
Figure 7Enrollment by Attendance Status
1996 1997 1998 1999 2000 2001 2002 2003 2004 2005 2006
Fall Semester
22
23
24
25
26
27
28
29
30 Age
Mean Age
Figure 9Mean Age
Figure 10Enrollment by Ethnicity
Japanese17.1%
Filipino7.2%Hawaiian
18.4%
Pac Island5.2%
Caucasian30.2% Mixed
13.2%
Chinese1.9%
All Other6.8%
Japanese11.4%
Filipino5.1%
Hawaiian17.3%
Pac Island6.0%
Caucasian36.6%
Mixed10.9%
Chinese2.1%
All Other10.6%
Fall 1996 Fall 2006
University of Hawai‘i at HiloCredit Students
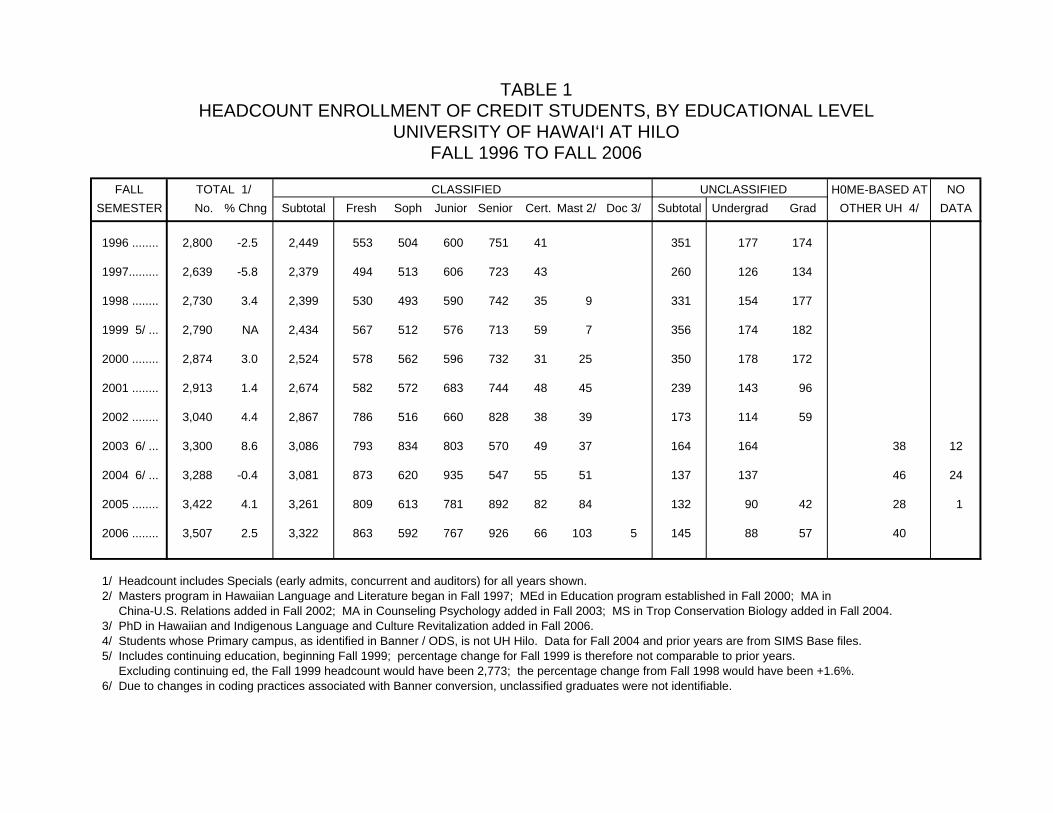
TABLE 1HEADCOUNT ENROLLMENT OF CREDIT STUDENTS, BY EDUCATIONAL LEVEL
UNIVERSITY OF HAWAI‘I AT HILOFALL 1996 TO FALL 2006
FALL TOTAL 1/ H0ME-BASED AT NOSEMESTER No. % Chng Subtotal Fresh Soph Junior Senior Cert. Mast 2/ Doc 3/ Subtotal Undergrad Grad OTHER UH 4/ DATA
1996 ........ 2,800 -2.5 2,449 553 504 600 751 41 351 177 174
1997......... 2,639 -5.8 2,379 494 513 606 723 43 260 126 134
1998 ........ 2,730 3.4 2,399 530 493 590 742 35 9 331 154 177
1999 5/ ... 2,790 NA 2,434 567 512 576 713 59 7 356 174 182
2000 ........ 2,874 3.0 2,524 578 562 596 732 31 25 350 178 172
2001 ........ 2,913 1.4 2,674 582 572 683 744 48 45 239 143 96
2002 ........ 3,040 4.4 2,867 786 516 660 828 38 39 173 114 59
2003 6/ ... 3,300 8.6 3,086 793 834 803 570 49 37 164 164 38 12
2004 6/ ... 3,288 -0.4 3,081 873 620 935 547 55 51 137 137 46 24
2005 ........ 3,422 4.1 3,261 809 613 781 892 82 84 132 90 42 28 1
2006 ........ 3,507 2.5 3,322 863 592 767 926 66 103 5 145 88 57 40
1/ Headcount includes Specials (early admits, concurrent and auditors) for all years shown.2/ Masters program in Hawaiian Language and Literature began in Fall 1997; MEd in Education program established in Fall 2000; MA in China-U.S. Relations added in Fall 2002; MA in Counseling Psychology added in Fall 2003; MS in Trop Conservation Biology added in Fall 2004.3/ PhD in Hawaiian and Indigenous Language and Culture Revitalization added in Fall 2006.4/ Students whose Primary campus, as identified in Banner / ODS, is not UH Hilo. Data for Fall 2004 and prior years are from SIMS Base files.5/ Includes continuing education, beginning Fall 1999; percentage change for Fall 1999 is therefore not comparable to prior years. Excluding continuing ed, the Fall 1999 headcount would have been 2,773; the percentage change from Fall 1998 would have been +1.6%.6/ Due to changes in coding practices associated with Banner conversion, unclassified graduates were not identifiable.
CLASSIFIED UNCLASSIFIED
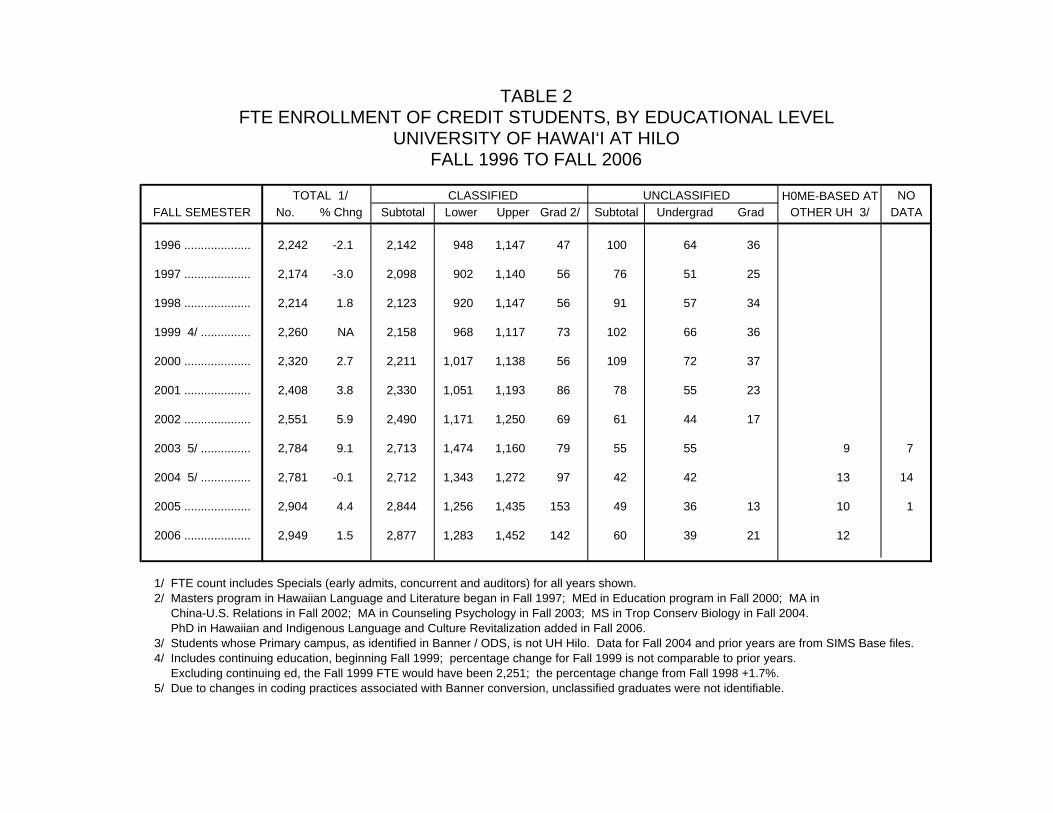
TABLE 2FTE ENROLLMENT OF CREDIT STUDENTS, BY EDUCATIONAL LEVEL
UNIVERSITY OF HAWAI‘I AT HILOFALL 1996 TO FALL 2006
TOTAL 1/ H0ME-BASED AT NOFALL SEMESTER No. % Chng Subtotal Lower Upper Grad 2/ Subtotal Undergrad Grad OTHER UH 3/ DATA
1996 .................... 2,242 -2.1 2,142 948 1,147 47 100 64 36
1997 .................... 2,174 -3.0 2,098 902 1,140 56 76 51 25
1998 .................... 2,214 1.8 2,123 920 1,147 56 91 57 34
1999 4/ ............... 2,260 NA 2,158 968 1,117 73 102 66 36
2000 .................... 2,320 2.7 2,211 1,017 1,138 56 109 72 37
2001 .................... 2,408 3.8 2,330 1,051 1,193 86 78 55 23
2002 .................... 2,551 5.9 2,490 1,171 1,250 69 61 44 17
2003 5/ ............... 2,784 9.1 2,713 1,474 1,160 79 55 55 9 7
2004 5/ ............... 2,781 -0.1 2,712 1,343 1,272 97 42 42 13 14
2005 .................... 2,904 4.4 2,844 1,256 1,435 153 49 36 13 10 1
2006 .................... 2,949 1.5 2,877 1,283 1,452 142 60 39 21 12
1/ FTE count includes Specials (early admits, concurrent and auditors) for all years shown.2/ Masters program in Hawaiian Language and Literature began in Fall 1997; MEd in Education program in Fall 2000; MA in China-U.S. Relations in Fall 2002; MA in Counseling Psychology in Fall 2003; MS in Trop Conserv Biology in Fall 2004. PhD in Hawaiian and Indigenous Language and Culture Revitalization added in Fall 2006.3/ Students whose Primary campus, as identified in Banner / ODS, is not UH Hilo. Data for Fall 2004 and prior years are from SIMS Base files.4/ Includes continuing education, beginning Fall 1999; percentage change for Fall 1999 is not comparable to prior years. Excluding continuing ed, the Fall 1999 FTE would have been 2,251; the percentage change from Fall 1998 +1.7%.5/ Due to changes in coding practices associated with Banner conversion, unclassified graduates were not identifiable.
CLASSIFIED UNCLASSIFIED
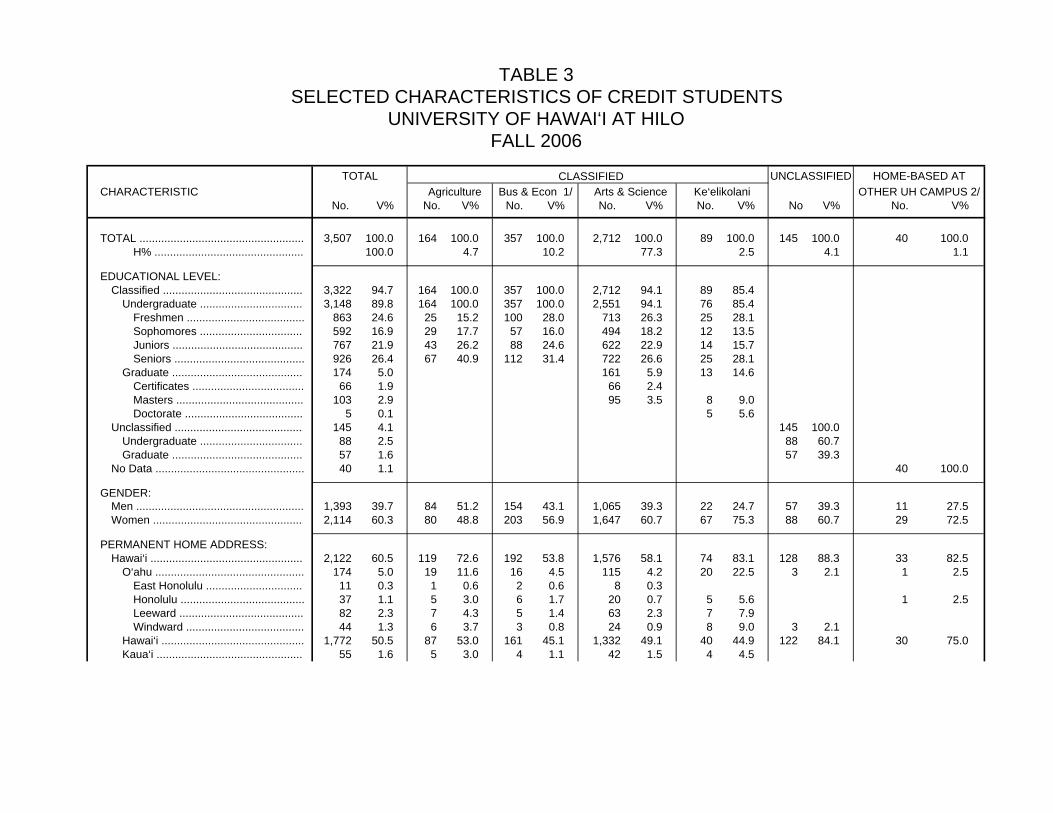
TABLE 3SELECTED CHARACTERISTICS OF CREDIT STUDENTS
UNIVERSITY OF HAWAI‘I AT HILOFALL 2006
TOTAL CLASSIFIED UNCLASSIFIED HOME-BASED ATCHARACTERISTIC Agriculture Bus & Econ 1/ Arts & Science Ke‘elikolani OTHER UH CAMPUS 2/
No. V% No. V% No. V% No. V% No. V% No V% No. V%
TOTAL ..................................................... 3,507 100.0 164 100.0 357 100.0 2,712 100.0 89 100.0 145 100.0 40 100.0H% ................................................ 100.0 4.7 10.2 77.3 2.5 4.1 1.1
EDUCATIONAL LEVEL:Classified .............................................. 3,322 94.7 164 100.0 357 100.0 2,712 94.1 89 85.4
Undergraduate .................................. 3,148 89.8 164 100.0 357 100.0 2,551 94.1 76 85.4Freshmen ...................................... 863 24.6 25 15.2 100 28.0 713 26.3 25 28.1Sophomores .................................. 592 16.9 29 17.7 57 16.0 494 18.2 12 13.5Juniors .......................................... 767 21.9 43 26.2 88 24.6 622 22.9 14 15.7Seniors .......................................... 926 26.4 67 40.9 112 31.4 722 26.6 25 28.1
Graduate ........................................... 174 5.0 161 5.9 13 14.6Certificates .................................... 66 1.9 66 2.4Masters ......................................... 103 2.9 95 3.5 8 9.0Doctorate ...................................... 5 0.1 5 5.6
Unclassified .......................................... 145 4.1 145 100.0Undergraduate .................................. 88 2.5 88 60.7Graduate ........................................... 57 1.6 57 39.3
No Data ................................................ 40 1.1 40 100.0
GENDER:Men ...................................................... 1,393 39.7 84 51.2 154 43.1 1,065 39.3 22 24.7 57 39.3 11 27.5Women ................................................. 2,114 60.3 80 48.8 203 56.9 1,647 60.7 67 75.3 88 60.7 29 72.5
PERMANENT HOME ADDRESS:Hawai‘i .................................................. 2,122 60.5 119 72.6 192 53.8 1,576 58.1 74 83.1 128 88.3 33 82.5
O‘ahu ................................................ 174 5.0 19 11.6 16 4.5 115 4.2 20 22.5 3 2.1 1 2.5East Honolulu ................................ 11 0.3 1 0.6 2 0.6 8 0.3Honolulu ........................................ 37 1.1 5 3.0 6 1.7 20 0.7 5 5.6 1 2.5Leeward ........................................ 82 2.3 7 4.3 5 1.4 63 2.3 7 7.9Windward ...................................... 44 1.3 6 3.7 3 0.8 24 0.9 8 9.0 3 2.1
Hawai‘i .............................................. 1,772 50.5 87 53.0 161 45.1 1,332 49.1 40 44.9 122 84.1 30 75.0Kaua‘i ................................................ 55 1.6 5 3.0 4 1.1 42 1.5 4 4.5
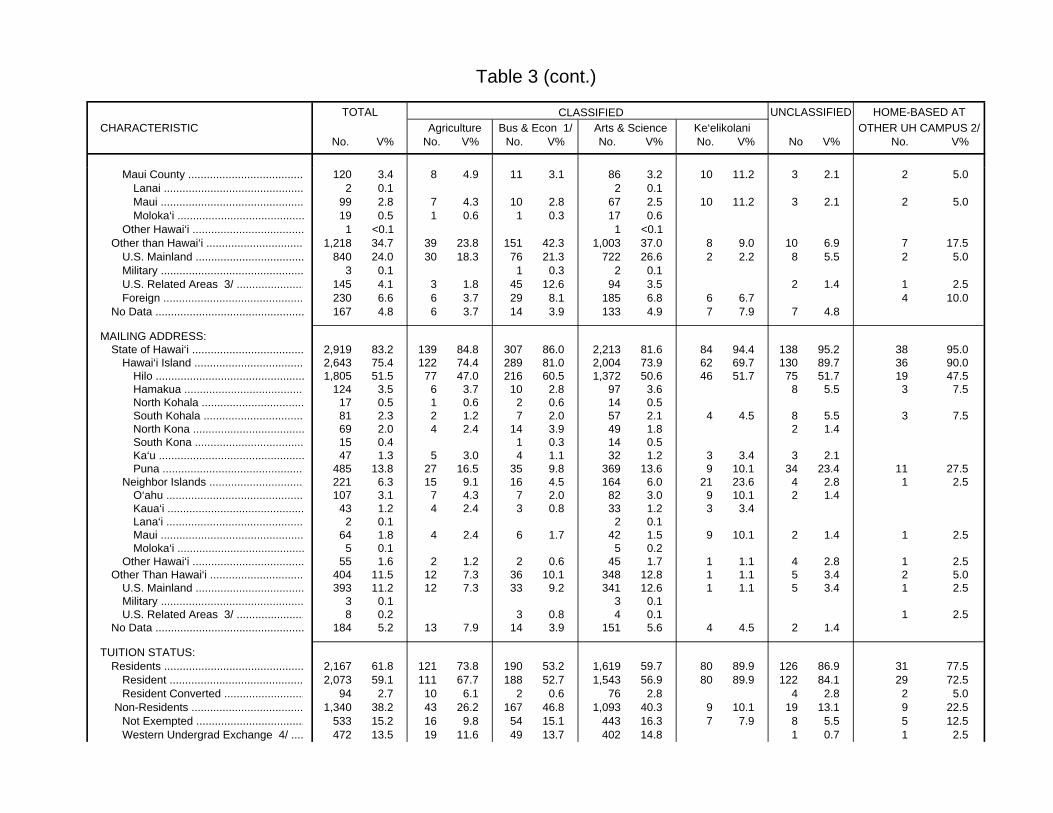
Table 3 (cont.)
TOTAL CLASSIFIED UNCLASSIFIED HOME-BASED ATCHARACTERISTIC Agriculture Bus & Econ 1/ Arts & Science Ke‘elikolani OTHER UH CAMPUS 2/
No. V% No. V% No. V% No. V% No. V% No V% No. V%
Maui County ..................................... 120 3.4 8 4.9 11 3.1 86 3.2 10 11.2 3 2.1 2 5.0Lanai ............................................. 2 0.1 2 0.1Maui .............................................. 99 2.8 7 4.3 10 2.8 67 2.5 10 11.2 3 2.1 2 5.0Moloka‘i ......................................... 19 0.5 1 0.6 1 0.3 17 0.6
Other Hawai‘i .................................... 1 <0.1 1 <0.1 Other than Hawai‘i ................................ 1,218 34.7 39 23.8 151 42.3 1,003 37.0 8 9.0 10 6.9 7 17.5
U.S. Mainland ................................... 840 24.0 30 18.3 76 21.3 722 26.6 2 2.2 8 5.5 2 5.0Military .............................................. 3 0.1 1 0.3 2 0.1U.S. Related Areas 3/ ...................... 145 4.1 3 1.8 45 12.6 94 3.5 2 1.4 1 2.5Foreign ............................................. 230 6.6 6 3.7 29 8.1 185 6.8 6 6.7 4 10.0
No Data ................................................ 167 4.8 6 3.7 14 3.9 133 4.9 7 7.9 7 4.8
MAILING ADDRESS:State of Hawai‘i .................................... 2,919 83.2 139 84.8 307 86.0 2,213 81.6 84 94.4 138 95.2 38 95.0
Hawai‘i Island ................................... 2,643 75.4 122 74.4 289 81.0 2,004 73.9 62 69.7 130 89.7 36 90.0Hilo ................................................ 1,805 51.5 77 47.0 216 60.5 1,372 50.6 46 51.7 75 51.7 19 47.5Hamakua ....................................... 124 3.5 6 3.7 10 2.8 97 3.6 8 5.5 3 7.5North Kohala ................................. 17 0.5 1 0.6 2 0.6 14 0.5South Kohala ................................ 81 2.3 2 1.2 7 2.0 57 2.1 4 4.5 8 5.5 3 7.5North Kona .................................... 69 2.0 4 2.4 14 3.9 49 1.8 2 1.4South Kona ................................... 15 0.4 1 0.3 14 0.5Ka‘u ............................................... 47 1.3 5 3.0 4 1.1 32 1.2 3 3.4 3 2.1Puna .............................................. 485 13.8 27 16.5 35 9.8 369 13.6 9 10.1 34 23.4 11 27.5
Neighbor Islands ............................... 221 6.3 15 9.1 16 4.5 164 6.0 21 23.6 4 2.8 1 2.5O‘ahu ............................................ 107 3.1 7 4.3 7 2.0 82 3.0 9 10.1 2 1.4Kaua‘i ............................................ 43 1.2 4 2.4 3 0.8 33 1.2 3 3.4Lana‘i ............................................ 2 0.1 2 0.1Maui .............................................. 64 1.8 4 2.4 6 1.7 42 1.5 9 10.1 2 1.4 1 2.5Moloka‘i ......................................... 5 0.1 5 0.2
Other Hawai‘i .................................... 55 1.6 2 1.2 2 0.6 45 1.7 1 1.1 4 2.8 1 2.5Other Than Hawai‘i .............................. 404 11.5 12 7.3 36 10.1 348 12.8 1 1.1 5 3.4 2 5.0
U.S. Mainland ................................... 393 11.2 12 7.3 33 9.2 341 12.6 1 1.1 5 3.4 1 2.5Military .............................................. 3 0.1 3 0.1U.S. Related Areas 3/ ...................... 8 0.2 3 0.8 4 0.1 1 2.5
No Data ................................................ 184 5.2 13 7.9 14 3.9 151 5.6 4 4.5 2 1.4
TUITION STATUS:Residents ............................................. 2,167 61.8 121 73.8 190 53.2 1,619 59.7 80 89.9 126 86.9 31 77.5
Resident ........................................... 2,073 59.1 111 67.7 188 52.7 1,543 56.9 80 89.9 122 84.1 29 72.5Resident Converted .......................... 94 2.7 10 6.1 2 0.6 76 2.8 4 2.8 2 5.0
Non-Residents .................................... 1,340 38.2 43 26.2 167 46.8 1,093 40.3 9 10.1 19 13.1 9 22.5Not Exempted ................................... 533 15.2 16 9.8 54 15.1 443 16.3 7 7.9 8 5.5 5 12.5Western Undergrad Exchange 4/ .... 472 13.5 19 11.6 49 13.7 402 14.8 1 0.7 1 2.5
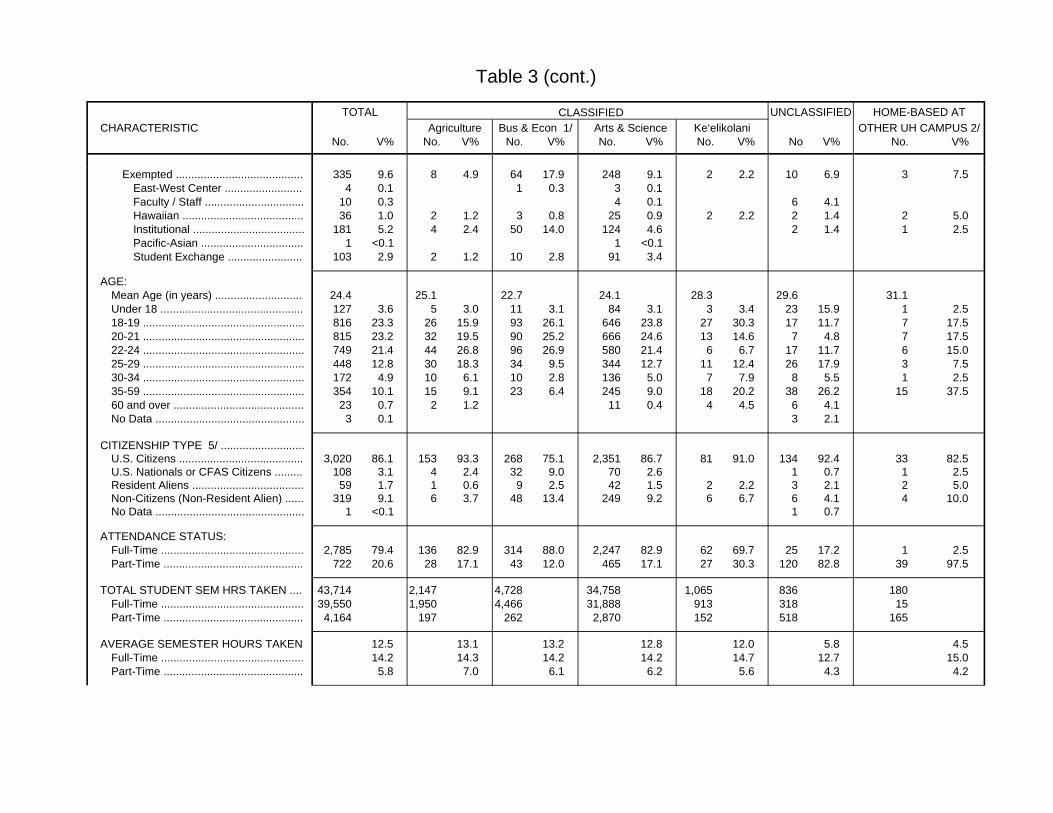
Table 3 (cont.)
TOTAL CLASSIFIED UNCLASSIFIED HOME-BASED ATCHARACTERISTIC Agriculture Bus & Econ 1/ Arts & Science Ke‘elikolani OTHER UH CAMPUS 2/
No. V% No. V% No. V% No. V% No. V% No V% No. V%
Exempted ......................................... 335 9.6 8 4.9 64 17.9 248 9.1 2 2.2 10 6.9 3 7.5East-West Center .......................... 4 0.1 1 0.3 3 0.1Faculty / Staff ................................ 10 0.3 4 0.1 6 4.1Hawaiian ....................................... 36 1.0 2 1.2 3 0.8 25 0.9 2 2.2 2 1.4 2 5.0Institutional .................................... 181 5.2 4 2.4 50 14.0 124 4.6 2 1.4 1 2.5Pacific-Asian ................................. 1 <0.1 1 <0.1 Student Exchange ......................... 103 2.9 2 1.2 10 2.8 91 3.4
AGE:Mean Age (in years) ............................. 24.4 25.1 22.7 24.1 28.3 29.6 31.1Under 18 .............................................. 127 3.6 5 3.0 11 3.1 84 3.1 3 3.4 23 15.9 1 2.518-19 .................................................... 816 23.3 26 15.9 93 26.1 646 23.8 27 30.3 17 11.7 7 17.520-21 .................................................... 815 23.2 32 19.5 90 25.2 666 24.6 13 14.6 7 4.8 7 17.522-24 .................................................... 749 21.4 44 26.8 96 26.9 580 21.4 6 6.7 17 11.7 6 15.025-29 .................................................... 448 12.8 30 18.3 34 9.5 344 12.7 11 12.4 26 17.9 3 7.530-34 .................................................... 172 4.9 10 6.1 10 2.8 136 5.0 7 7.9 8 5.5 1 2.535-59 .................................................... 354 10.1 15 9.1 23 6.4 245 9.0 18 20.2 38 26.2 15 37.560 and over .......................................... 23 0.7 2 1.2 11 0.4 4 4.5 6 4.1No Data ................................................ 3 0.1 3 2.1
CITIZENSHIP TYPE 5/ ...........................U.S. Citizens ........................................ 3,020 86.1 153 93.3 268 75.1 2,351 86.7 81 91.0 134 92.4 33 82.5U.S. Nationals or CFAS Citizens .......... 108 3.1 4 2.4 32 9.0 70 2.6 1 0.7 1 2.5Resident Aliens .................................... 59 1.7 1 0.6 9 2.5 42 1.5 2 2.2 3 2.1 2 5.0Non-Citizens (Non-Resident Alien) ...... 319 9.1 6 3.7 48 13.4 249 9.2 6 6.7 6 4.1 4 10.0No Data ................................................ 1 <0.1 1 0.7
ATTENDANCE STATUS:Full-Time .............................................. 2,785 79.4 136 82.9 314 88.0 2,247 82.9 62 69.7 25 17.2 1 2.5Part-Time ............................................. 722 20.6 28 17.1 43 12.0 465 17.1 27 30.3 120 82.8 39 97.5
TOTAL STUDENT SEM HRS TAKEN ..... 43,714 2,147 4,728 34,758 1,065 836 180Full-Time .............................................. 39,550 1,950 4,466 31,888 913 318 15Part-Time ............................................. 4,164 197 262 2,870 152 518 165
AVERAGE SEMESTER HOURS TAKEN 12.5 13.1 13.2 12.8 12.0 5.8 4.5Full-Time .............................................. 14.2 14.3 14.2 14.2 14.7 12.7 15.0Part-Time ............................................. 5.8 7.0 6.1 6.2 5.6 4.3 4.2
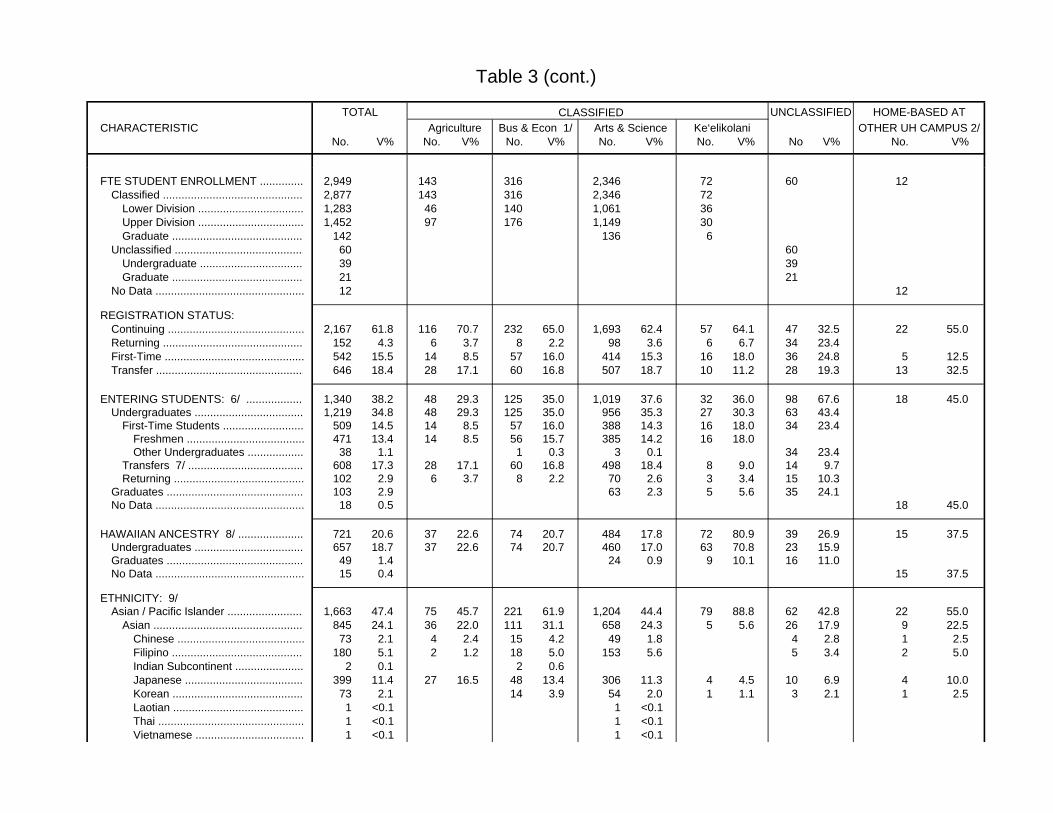
Table 3 (cont.)
TOTAL CLASSIFIED UNCLASSIFIED HOME-BASED ATCHARACTERISTIC Agriculture Bus & Econ 1/ Arts & Science Ke‘elikolani OTHER UH CAMPUS 2/
No. V% No. V% No. V% No. V% No. V% No V% No. V%
FTE STUDENT ENROLLMENT .............. 2,949 143 316 2,346 72 60 12Classified .............................................. 2,877 143 316 2,346 72
Lower Division .................................. 1,283 46 140 1,061 36Upper Division .................................. 1,452 97 176 1,149 30Graduate ........................................... 142 136 6
Unclassified .......................................... 60 60Undergraduate .................................. 39 39Graduate ........................................... 21 21
No Data ................................................ 12 12
REGISTRATION STATUS:Continuing ............................................ 2,167 61.8 116 70.7 232 65.0 1,693 62.4 57 64.1 47 32.5 22 55.0Returning .............................................. 152 4.3 6 3.7 8 2.2 98 3.6 6 6.7 34 23.4First-Time ............................................. 542 15.5 14 8.5 57 16.0 414 15.3 16 18.0 36 24.8 5 12.5Transfer ................................................ 646 18.4 28 17.1 60 16.8 507 18.7 10 11.2 28 19.3 13 32.5
ENTERING STUDENTS: 6/ ................... 1,340 38.2 48 29.3 125 35.0 1,019 37.6 32 36.0 98 67.6 18 45.0Undergraduates ................................... 1,219 34.8 48 29.3 125 35.0 956 35.3 27 30.3 63 43.4
First-Time Students .......................... 509 14.5 14 8.5 57 16.0 388 14.3 16 18.0 34 23.4Freshmen ...................................... 471 13.4 14 8.5 56 15.7 385 14.2 16 18.0Other Undergraduates .................. 38 1.1 1 0.3 3 0.1 34 23.4
Transfers 7/ ..................................... 608 17.3 28 17.1 60 16.8 498 18.4 8 9.0 14 9.7Returning .......................................... 102 2.9 6 3.7 8 2.2 70 2.6 3 3.4 15 10.3
Graduates ............................................ 103 2.9 63 2.3 5 5.6 35 24.1No Data ................................................ 18 0.5 18 45.0
HAWAIIAN ANCESTRY 8/ ..................... 721 20.6 37 22.6 74 20.7 484 17.8 72 80.9 39 26.9 15 37.5Undergraduates ................................... 657 18.7 37 22.6 74 20.7 460 17.0 63 70.8 23 15.9Graduates ............................................ 49 1.4 24 0.9 9 10.1 16 11.0No Data ................................................ 15 0.4 15 37.5
ETHNICITY: 9/Asian / Pacific Islander ......................... 1,663 47.4 75 45.7 221 61.9 1,204 44.4 79 88.8 62 42.8 22 55.0
Asian ................................................. 845 24.1 36 22.0 111 31.1 658 24.3 5 5.6 26 17.9 9 22.5Chinese ......................................... 73 2.1 4 2.4 15 4.2 49 1.8 4 2.8 1 2.5Filipino ........................................... 180 5.1 2 1.2 18 5.0 153 5.6 5 3.4 2 5.0Indian Subcontinent ...................... 2 0.1 2 0.6Japanese ...................................... 399 11.4 27 16.5 48 13.4 306 11.3 4 4.5 10 6.9 4 10.0Korean .......................................... 73 2.1 14 3.9 54 2.0 1 1.1 3 2.1 1 2.5Laotian .......................................... 1 <0.1 1 <0.1 Thai ............................................... 1 <0.1 1 <0.1 Vietnamese ................................... 1 <0.1 1 <0.1
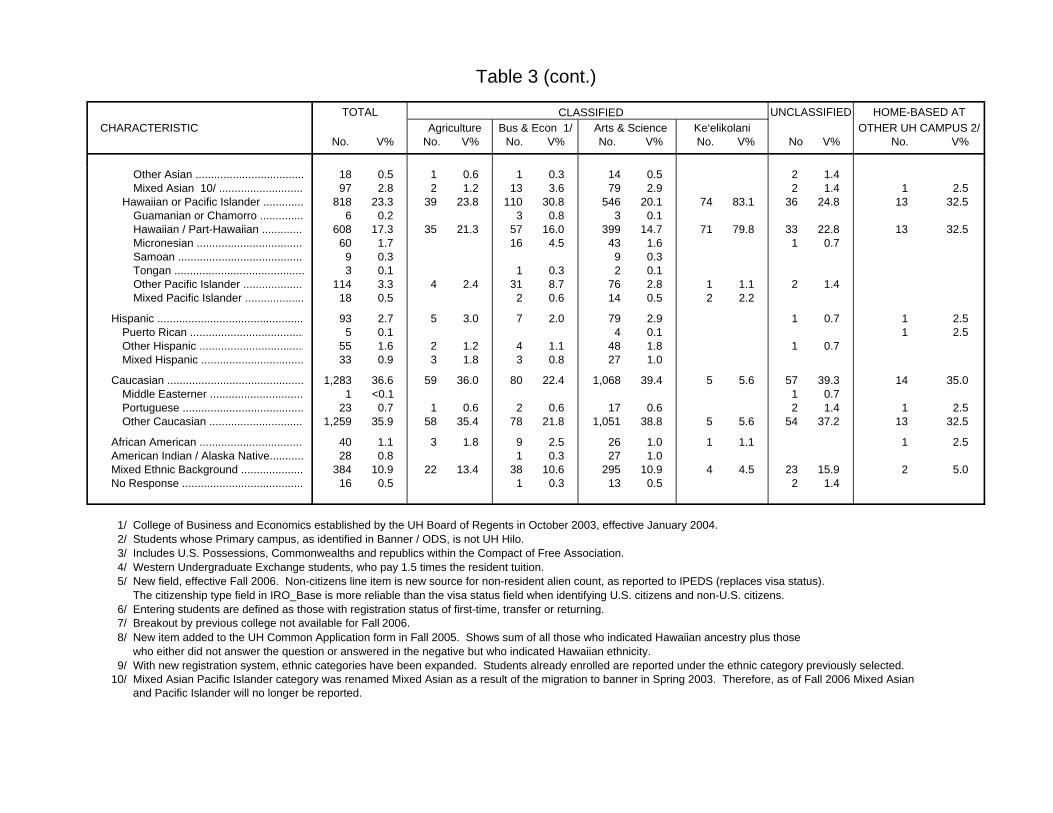
Table 3 (cont.)
TOTAL CLASSIFIED UNCLASSIFIED HOME-BASED ATCHARACTERISTIC Agriculture Bus & Econ 1/ Arts & Science Ke‘elikolani OTHER UH CAMPUS 2/
No. V% No. V% No. V% No. V% No. V% No V% No. V%
Other Asian ................................... 18 0.5 1 0.6 1 0.3 14 0.5 2 1.4Mixed Asian 10/ ........................... 97 2.8 2 1.2 13 3.6 79 2.9 2 1.4 1 2.5
Hawaiian or Pacific Islander ............. 818 23.3 39 23.8 110 30.8 546 20.1 74 83.1 36 24.8 13 32.5Guamanian or Chamorro .............. 6 0.2 3 0.8 3 0.1Hawaiian / Part-Hawaiian .............. 608 17.3 35 21.3 57 16.0 399 14.7 71 79.8 33 22.8 13 32.5Micronesian ................................... 60 1.7 16 4.5 43 1.6 1 0.7Samoan ......................................... 9 0.3 9 0.3Tongan .......................................... 3 0.1 1 0.3 2 0.1Other Pacific Islander .................... 114 3.3 4 2.4 31 8.7 76 2.8 1 1.1 2 1.4Mixed Pacific Islander ................... 18 0.5 2 0.6 14 0.5 2 2.2
Hispanic ............................................... 93 2.7 5 3.0 7 2.0 79 2.9 1 0.7 1 2.5Puerto Rican ..................................... 5 0.1 4 0.1 1 2.5Other Hispanic .................................. 55 1.6 2 1.2 4 1.1 48 1.8 1 0.7Mixed Hispanic ................................. 33 0.9 3 1.8 3 0.8 27 1.0
Caucasian ............................................ 1,283 36.6 59 36.0 80 22.4 1,068 39.4 5 5.6 57 39.3 14 35.0Middle Easterner .............................. 1 <0.1 1 0.7Portuguese ....................................... 23 0.7 1 0.6 2 0.6 17 0.6 2 1.4 1 2.5Other Caucasian ............................... 1,259 35.9 58 35.4 78 21.8 1,051 38.8 5 5.6 54 37.2 13 32.5
African American .................................. 40 1.1 3 1.8 9 2.5 26 1.0 1 1.1 1 2.5American Indian / Alaska Native........... 28 0.8 1 0.3 27 1.0Mixed Ethnic Background .................... 384 10.9 22 13.4 38 10.6 295 10.9 4 4.5 23 15.9 2 5.0No Response ....................................... 16 0.5 1 0.3 13 0.5 2 1.4
1/ College of Business and Economics established by the UH Board of Regents in October 2003, effective January 2004. 2/ Students whose Primary campus, as identified in Banner / ODS, is not UH Hilo. 3/ Includes U.S. Possessions, Commonwealths and republics within the Compact of Free Association. 4/ Western Undergraduate Exchange students, who pay 1.5 times the resident tuition. 5/ New field, effective Fall 2006. Non-citizens line item is new source for non-resident alien count, as reported to IPEDS (replaces visa status). The citizenship type field in IRO_Base is more reliable than the visa status field when identifying U.S. citizens and non-U.S. citizens. 6/ Entering students are defined as those with registration status of first-time, transfer or returning. 7/ Breakout by previous college not available for Fall 2006. 8/ New item added to the UH Common Application form in Fall 2005. Shows sum of all those who indicated Hawaiian ancestry plus those who either did not answer the question or answered in the negative but who indicated Hawaiian ethnicity. 9/ With new registration system, ethnic categories have been expanded. Students already enrolled are reported under the ethnic category previously selected.10/ Mixed Asian Pacific Islander category was renamed Mixed Asian as a result of the migration to banner in Spring 2003. Therefore, as of Fall 2006 Mixed Asian and Pacific Islander will no longer be reported.
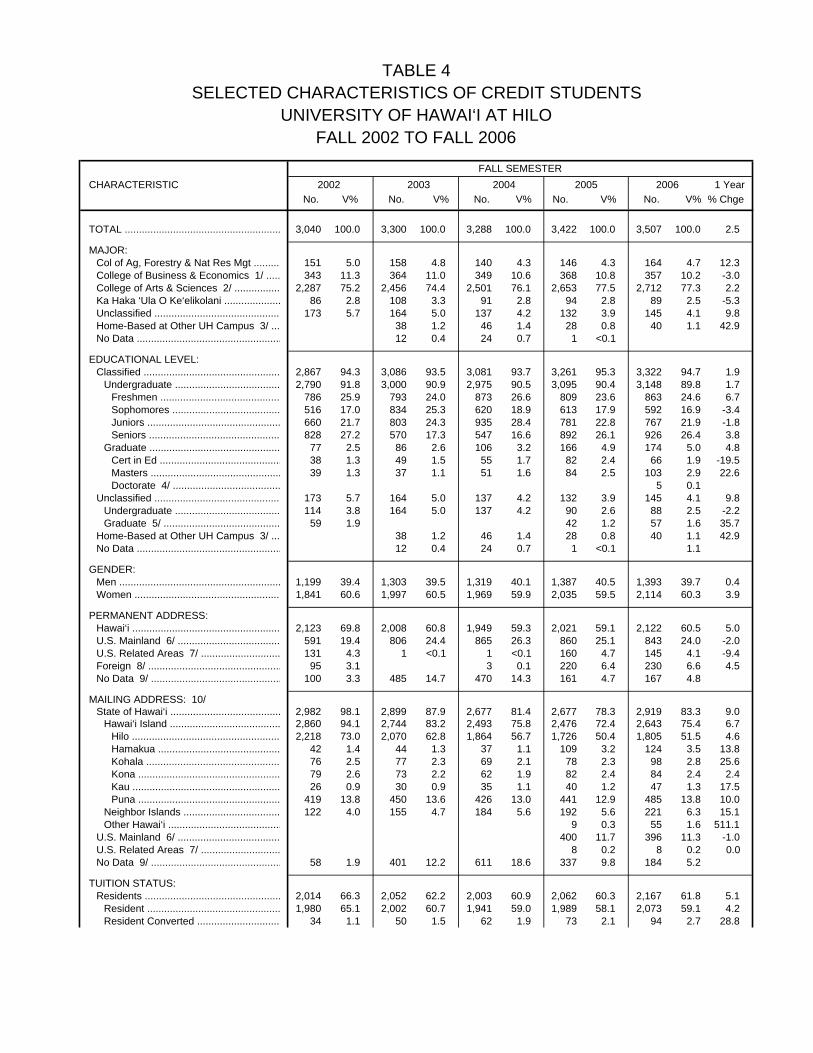
TABLE 4SELECTED CHARACTERISTICS OF CREDIT STUDENTS
UNIVERSITY OF HAWAI‘I AT HILOFALL 2002 TO FALL 2006
CHARACTERISTIC 2002 2003 2004 2005 2006 1 YearNo. V% No. V% No. V% No. V% No. V% % Chge
TOTAL ....................................................... 3,040 100.0 3,300 100.0 3,288 100.0 3,422 100.0 3,507 100.0 2.5
MAJOR:Col of Ag, Forestry & Nat Res Mgt ......... 151 5.0 158 4.8 140 4.3 146 4.3 164 4.7 12.3College of Business & Economics 1/ ..... 343 11.3 364 11.0 349 10.6 368 10.8 357 10.2 -3.0College of Arts & Sciences 2/ ................ 2,287 75.2 2,456 74.4 2,501 76.1 2,653 77.5 2,712 77.3 2.2Ka Haka ‘Ula O Ke‘elikolani .................... 86 2.8 108 3.3 91 2.8 94 2.8 89 2.5 -5.3Unclassified ............................................ 173 5.7 164 5.0 137 4.2 132 3.9 145 4.1 9.8Home-Based at Other UH Campus 3/ ... 38 1.2 46 1.4 28 0.8 40 1.1 42.9No Data ................................................... 12 0.4 24 0.7 1 <0.1
EDUCATIONAL LEVEL:Classified ................................................ 2,867 94.3 3,086 93.5 3,081 93.7 3,261 95.3 3,322 94.7 1.9
Undergraduate ..................................... 2,790 91.8 3,000 90.9 2,975 90.5 3,095 90.4 3,148 89.8 1.7Freshmen .......................................... 786 25.9 793 24.0 873 26.6 809 23.6 863 24.6 6.7Sophomores ...................................... 516 17.0 834 25.3 620 18.9 613 17.9 592 16.9 -3.4Juniors ............................................... 660 21.7 803 24.3 935 28.4 781 22.8 767 21.9 -1.8Seniors .............................................. 828 27.2 570 17.3 547 16.6 892 26.1 926 26.4 3.8
Graduate .............................................. 77 2.5 86 2.6 106 3.2 166 4.9 174 5.0 4.8Cert in Ed ........................................... 38 1.3 49 1.5 55 1.7 82 2.4 66 1.9 -19.5Masters .............................................. 39 1.3 37 1.1 51 1.6 84 2.5 103 2.9 22.6Doctorate 4/ ...................................... 5 0.1
Unclassified ............................................ 173 5.7 164 5.0 137 4.2 132 3.9 145 4.1 9.8Undergraduate ..................................... 114 3.8 164 5.0 137 4.2 90 2.6 88 2.5 -2.2Graduate 5/ ......................................... 59 1.9 42 1.2 57 1.6 35.7
Home-Based at Other UH Campus 3/ ... 38 1.2 46 1.4 28 0.8 40 1.1 42.9No Data ................................................... 12 0.4 24 0.7 1 <0.1 1.1
GENDER:Men ......................................................... 1,199 39.4 1,303 39.5 1,319 40.1 1,387 40.5 1,393 39.7 0.4Women ................................................... 1,841 60.6 1,997 60.5 1,969 59.9 2,035 59.5 2,114 60.3 3.9
PERMANENT ADDRESS:Hawai‘i .................................................... 2,123 69.8 2,008 60.8 1,949 59.3 2,021 59.1 2,122 60.5 5.0U.S. Mainland 6/ .................................... 591 19.4 806 24.4 865 26.3 860 25.1 843 24.0 -2.0U.S. Related Areas 7/ ............................ 131 4.3 1 <0.1 1 <0.1 160 4.7 145 4.1 -9.4Foreign 8/ ............................................... 95 3.1 3 0.1 220 6.4 230 6.6 4.5No Data 9/ .............................................. 100 3.3 485 14.7 470 14.3 161 4.7 167 4.8
MAILING ADDRESS: 10/State of Hawai‘i ....................................... 2,982 98.1 2,899 87.9 2,677 81.4 2,677 78.3 2,919 83.3 9.0
Hawai‘i Island ....................................... 2,860 94.1 2,744 83.2 2,493 75.8 2,476 72.4 2,643 75.4 6.7Hilo .................................................... 2,218 73.0 2,070 62.8 1,864 56.7 1,726 50.4 1,805 51.5 4.6Hamakua ........................................... 42 1.4 44 1.3 37 1.1 109 3.2 124 3.5 13.8Kohala ............................................... 76 2.5 77 2.3 69 2.1 78 2.3 98 2.8 25.6Kona .................................................. 79 2.6 73 2.2 62 1.9 82 2.4 84 2.4 2.4Kau .................................................... 26 0.9 30 0.9 35 1.1 40 1.2 47 1.3 17.5Puna .................................................. 419 13.8 450 13.6 426 13.0 441 12.9 485 13.8 10.0
Neighbor Islands .................................. 122 4.0 155 4.7 184 5.6 192 5.6 221 6.3 15.1Other Hawai‘i ........................................ 9 0.3 55 1.6 511.1
U.S. Mainland 6/ .................................... 400 11.7 396 11.3 -1.0U.S. Related Areas 7/ ............................ 8 0.2 8 0.2 0.0 No Data 9/ .............................................. 58 1.9 401 12.2 611 18.6 337 9.8 184 5.2
TUITION STATUS:Residents ................................................ 2,014 66.3 2,052 62.2 2,003 60.9 2,062 60.3 2,167 61.8 5.1
Resident ............................................... 1,980 65.1 2,002 60.7 1,941 59.0 1,989 58.1 2,073 59.1 4.2Resident Converted ............................. 34 1.1 50 1.5 62 1.9 73 2.1 94 2.7 28.8
FALL SEMESTER
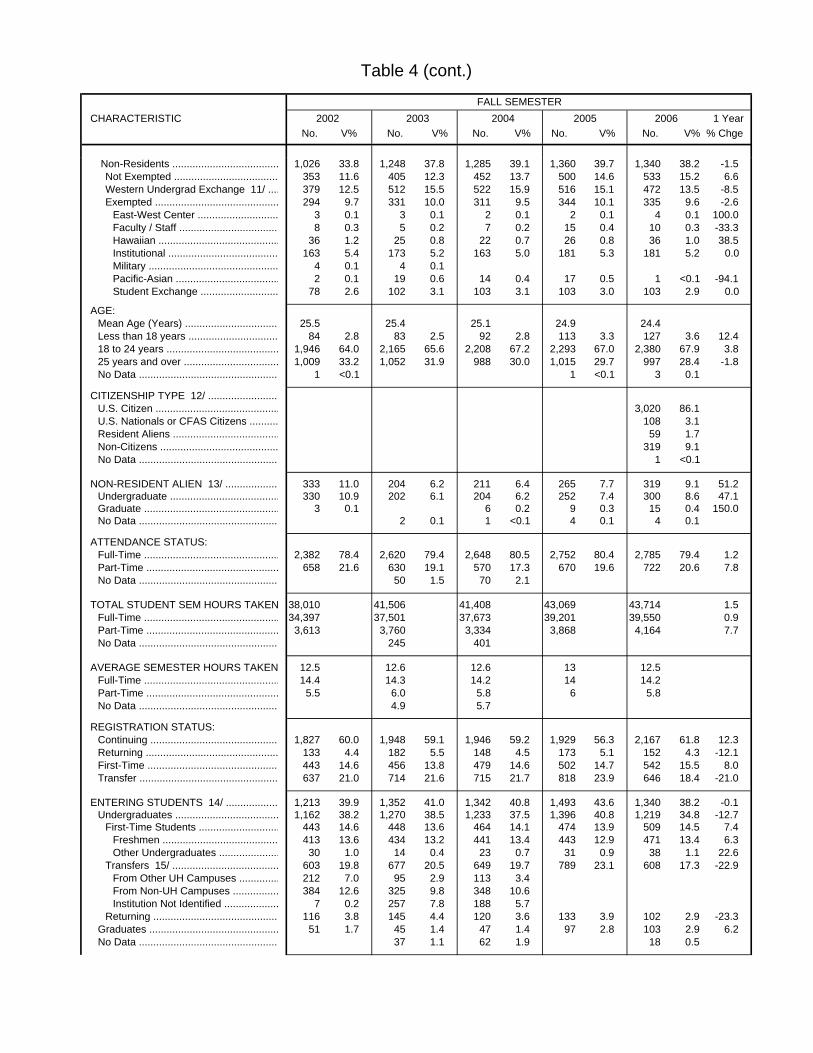
Table 4 (cont.)
CHARACTERISTIC 2002 2003 2004 2005 2006 1 YearNo. V% No. V% No. V% No. V% No. V% % Chge
FALL SEMESTER
Non-Residents ..................................... 1,026 33.8 1,248 37.8 1,285 39.1 1,360 39.7 1,340 38.2 -1.5Not Exempted .................................... 353 11.6 405 12.3 452 13.7 500 14.6 533 15.2 6.6Western Undergrad Exchange 11/ .... 379 12.5 512 15.5 522 15.9 516 15.1 472 13.5 -8.5Exempted ........................................... 294 9.7 331 10.0 311 9.5 344 10.1 335 9.6 -2.6
East-West Center ............................ 3 0.1 3 0.1 2 0.1 2 0.1 4 0.1 100.0Faculty / Staff ................................... 8 0.3 5 0.2 7 0.2 15 0.4 10 0.3 -33.3Hawaiian .......................................... 36 1.2 25 0.8 22 0.7 26 0.8 36 1.0 38.5Institutional ...................................... 163 5.4 173 5.2 163 5.0 181 5.3 181 5.2 0.0 Military ............................................. 4 0.1 4 0.1Pacific-Asian .................................... 2 0.1 19 0.6 14 0.4 17 0.5 1 <0.1 -94.1Student Exchange ........................... 78 2.6 102 3.1 103 3.1 103 3.0 103 2.9 0.0
AGE:Mean Age (Years) ................................. 25.5 25.4 25.1 24.9 24.4Less than 18 years ............................... 84 2.8 83 2.5 92 2.8 113 3.3 127 3.6 12.418 to 24 years ....................................... 1,946 64.0 2,165 65.6 2,208 67.2 2,293 67.0 2,380 67.9 3.825 years and over ................................. 1,009 33.2 1,052 31.9 988 30.0 1,015 29.7 997 28.4 -1.8No Data ................................................. 1 <0.1 1 <0.1 3 0.1
CITIZENSHIP TYPE 12/ .........................U.S. Citizen ........................................... 3,020 86.1U.S. Nationals or CFAS Citizens .......... 108 3.1Resident Aliens ..................................... 59 1.7Non-Citizens ......................................... 319 9.1No Data ................................................. 1 <0.1
NON-RESIDENT ALIEN 13/ ................... 333 11.0 204 6.2 211 6.4 265 7.7 319 9.1 51.2Undergraduate ...................................... 330 10.9 202 6.1 204 6.2 252 7.4 300 8.6 47.1Graduate ............................................... 3 0.1 6 0.2 9 0.3 15 0.4 150.0No Data ................................................. 2 0.1 1 <0.1 4 0.1 4 0.1
ATTENDANCE STATUS:Full-Time ............................................... 2,382 78.4 2,620 79.4 2,648 80.5 2,752 80.4 2,785 79.4 1.2Part-Time .............................................. 658 21.6 630 19.1 570 17.3 670 19.6 722 20.6 7.8No Data ................................................. 50 1.5 70 2.1
TOTAL STUDENT SEM HOURS TAKEN 38,010 41,506 41,408 43,069 43,714 1.5Full-Time ............................................... 34,397 37,501 37,673 39,201 39,550 0.9Part-Time .............................................. 3,613 3,760 3,334 3,868 4,164 7.7No Data ................................................. 245 401
AVERAGE SEMESTER HOURS TAKEN 12.5 12.6 12.6 13 12.5Full-Time ............................................... 14.4 14.3 14.2 14 14.2Part-Time .............................................. 5.5 6.0 5.8 6 5.8No Data ................................................. 4.9 5.7
REGISTRATION STATUS:Continuing ............................................. 1,827 60.0 1,948 59.1 1,946 59.2 1,929 56.3 2,167 61.8 12.3Returning .............................................. 133 4.4 182 5.5 148 4.5 173 5.1 152 4.3 -12.1First-Time .............................................. 443 14.6 456 13.8 479 14.6 502 14.7 542 15.5 8.0Transfer ................................................ 637 21.0 714 21.6 715 21.7 818 23.9 646 18.4 -21.0
ENTERING STUDENTS 14/ .................. 1,213 39.9 1,352 41.0 1,342 40.8 1,493 43.6 1,340 38.2 -0.1Undergraduates .................................... 1,162 38.2 1,270 38.5 1,233 37.5 1,396 40.8 1,219 34.8 -12.7
First-Time Students ............................ 443 14.6 448 13.6 464 14.1 474 13.9 509 14.5 7.4Freshmen ........................................ 413 13.6 434 13.2 441 13.4 443 12.9 471 13.4 6.3Other Undergraduates ..................... 30 1.0 14 0.4 23 0.7 31 0.9 38 1.1 22.6
Transfers 15/ ..................................... 603 19.8 677 20.5 649 19.7 789 23.1 608 17.3 -22.9From Other UH Campuses .............. 212 7.0 95 2.9 113 3.4From Non-UH Campuses ................ 384 12.6 325 9.8 348 10.6Institution Not Identified ................... 7 0.2 257 7.8 188 5.7
Returning ............................................ 116 3.8 145 4.4 120 3.6 133 3.9 102 2.9 -23.3Graduates ............................................. 51 1.7 45 1.4 47 1.4 97 2.8 103 2.9 6.2No Data ................................................. 37 1.1 62 1.9 18 0.5

Table 4 (cont.)
CHARACTERISTIC 2002 2003 2004 2005 2006 1 YearNo. V% No. V% No. V% No. V% No. V% % Chge
FALL SEMESTER
HAWAIIAN ANCESTRY 16/ ..................... 561 16.4 721 20.6 28.5Undergraduates ...................................... 497 14.5 657 18.7 32.2Graduates ............................................... 54 1.6 49 1.4 -9.3No Data ................................................... 10 0.3 15 0.4
ETHNICITY: 17/Asian / Pacific Islander ........................... 1,450 47.7 1,495 45.3 1,485 45.2 1,586 46.3 1,663 47.4 4.9
Asian .................................................... 810 26.6 788 23.9 786 23.9 830 24.3 845 24.1 1.8Chinese ............................................. 63 2.1 56 1.7 56 1.7 67 2.0 73 2.1 9.0Filipino ............................................... 176 5.8 186 5.6 177 5.4 177 5.2 180 5.1 1.7Indian Subcontinent ........................... 2 0.1 4 0.1 4 0.1 3 0.1 2 0.1 -33.3Japanese ........................................... 418 13.8 387 11.7 383 11.6 396 11.6 399 11.4 0.8Korean ............................................... 50 1.6 56 1.7 67 2.0 77 2.3 73 2.1 -5.2Laotian ............................................... 2 0.1 1 <0.1 -50.0Thai .................................................... 1 <0.1 Vietnamese ....................................... 1 <0.1 2 0.1 3 0.1 1 <0.1 -66.7Other Asian ....................................... 14 0.5 14 0.4 15 0.5 14 0.4 18 0.5 28.6Mixed Asian 18/ ................................ 87 2.9 84 2.5 82 2.5 91 2.7 97 2.8 6.6
Hawaiian or Pacific Islander ................. 640 21.1 707 21.4 699 21.3 756 22.1 818 23.3 8.2Guamanian or Chamorro ................... 3 0.1 3 0.1 3 0.1 6 0.2 100.0Hawaiian / Part-Hawaiian .................. 480 15.8 519 15.7 518 15.8 547 16.0 608 17.3 11.2Micronesian ....................................... 24 0.7 31 0.9 53 1.5 60 1.7 13.2Samoan ............................................. 7 0.2 8 0.2 10 0.3 9 0.3 -10.0Tongan .............................................. 1 <0.1 3 0.1Other Pacific Islander ........................ 160 5.3 153 4.6 132 4.0 131 3.8 114 3.3 -13.0Mixed Pacific Islander ....................... 7 0.2 12 0.4 18 0.5 50.0
Hispanic .................................................. 74 2.4 83 2.5 99 3.0 92 2.7 93 2.7 1.1Puerto Rican ........................................ 5 0.2 7 0.2 4 0.1 4 0.1 5 0.1 25.0Other Hispanic ..................................... 13 0.4 28 0.8 44 1.3 44 1.3 55 1.6 25.0Mixed Hispanic ..................................... 56 1.8 48 1.5 51 1.6 44 1.3 33 0.9 -25.0
Caucasian ............................................... 1,071 35.2 1,271 38.5 1,252 38.1 1,297 37.9 1,283 36.6 -1.1Middle Easterner .................................. 1 <0.1 1 <0.1 Portuguese ........................................... 47 1.5 50 1.5 42 1.3 33 1.0 23 0.7 -30.3Other Caucasian .................................. 1,024 33.7 1,221 37.0 1,209 36.8 1,264 36.9 1,259 35.9 -0.4
African American .................................... 39 1.3 42 1.3 45 1.4 45 1.3 40 1.1 -11.1American Indian / Alaska Native.............. 16 0.5 20 0.6 21 0.6 28 0.8 28 0.8 0.0 Mixed Ethnic Background ....................... 390 12.8 387 11.7 384 11.7 368 10.8 384 10.9 4.3No Response .......................................... 2 0.1 2 0.1 6 0.2 16 0.5 166.7
1/ College of Business and Economics established by the UH Board of Regents in October 2003. Data for prior years compiled from records. 2/ Historical data have been adjusted to reflect movement of majors to other colleges. 3/ Students whose Primary campus, as identified in Banner / ODS, is not UH Hilo. Data for Fall 2004 and prior years are from SIMS Base files. 4/ PhD in Hawaiian and Indigenous Language and Culture Revitalization added in Fall 2006. 5/ Do to changes in coding practices associated with Banner conversion, unclassified graduates were not identifiable in Fall 2003 and Fall 2004. 6/ Includes U.S. military stationed overseas. 7/ Includes U.S. Possessions, Commonwealths and republics within the Compact of Free Association. 8/ Data on students with foreign permanent addresses not available for Fall 2003 and Fall 2004. 9/ Migration to Banner registration system in Fall 2003 resulted in an increase in invalid data.10/ Breakout changed with migration to Operational Data Store (ODS) tables in Fall 2005.11/ Western Undergraduate Exchange students, who pay 1.5 times the resident tuition.12/ New field, effective Fall 2006. Non-citizen line item is new source for non-resident alien count, as reported to IPEDS (replaces visa status). 13/ Effective Fall 2006, non-resident alien is defined as the non-citizen count under citizenship type. For prior years, shows counts by visa type (i.e. sum of students with student and other visas).14/ Entering students are defined as those with registration status of first-time, transfer or returning.15/ Breakout by previous college not available for Fall 2005 or Fall 2006.16/ New item added to the UH Common Application form in Fall 2005. Shows sum of all those who indicated Hawaiian ancestry plus those who either did not answer the question or answered in the negative but who indicated Hawaiian ethnicity.17/ With new registration system, ethnic categories have been expanded. Students already enrolled are reported under the ethnic category previously selected.18/ Mixed Asian Pacific Islander category was renamed Mixed Asian as a result of the migration to banner in Spring 2003. Therefore, as of Fall 2006 Mixed Asian and Pacific Islander will no longer be reported as a separate line item.
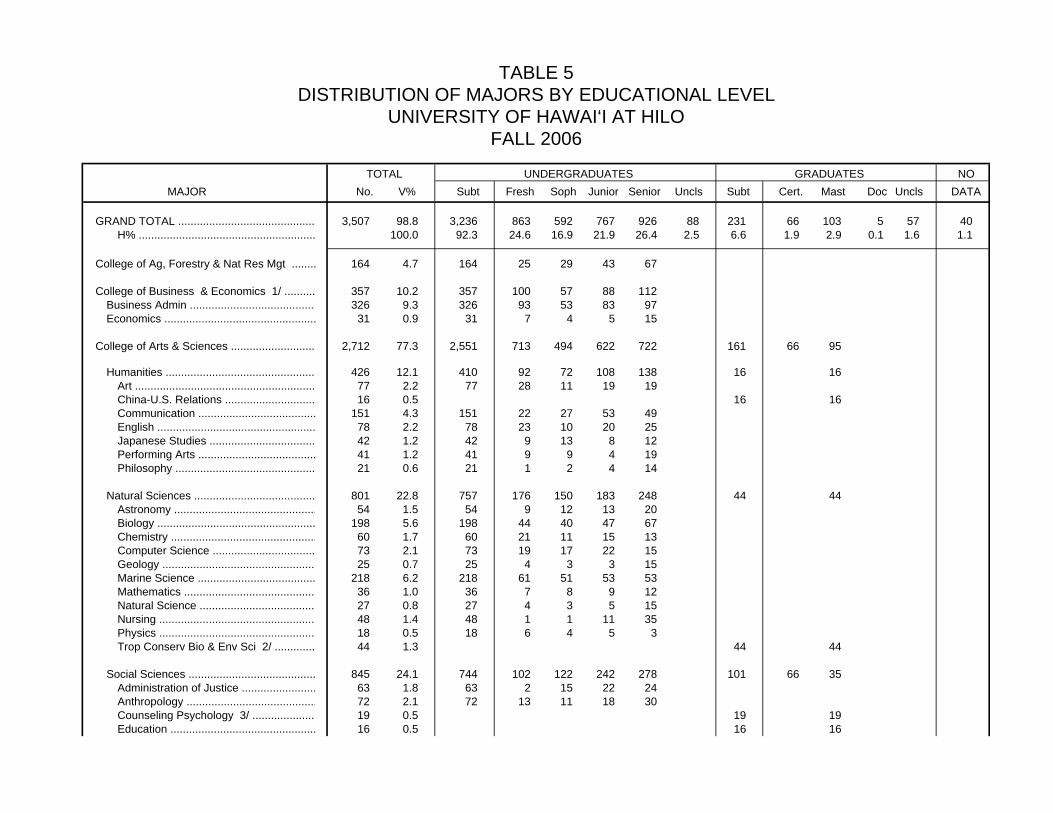
TABLE 5DISTRIBUTION OF MAJORS BY EDUCATIONAL LEVEL
UNIVERSITY OF HAWAI‘I AT HILOFALL 2006
NOMAJOR No. V% Subt Fresh Soph Junior Senior Uncls Subt Cert. Mast Doc Uncls DATA
GRAND TOTAL ............................................. 3,507 98.8 3,236 863 592 767 926 88 231 66 103 5 57 40H% ......................................................... 100.0 92.3 24.6 16.9 21.9 26.4 2.5 6.6 1.9 2.9 0.1 1.6 1.1
College of Ag, Forestry & Nat Res Mgt ........ 164 4.7 164 25 29 43 67
College of Business & Economics 1/ .......... 357 10.2 357 100 57 88 112Business Admin ......................................... 326 9.3 326 93 53 83 97Economics ................................................. 31 0.9 31 7 4 5 15
College of Arts & Sciences ............................ 2,712 77.3 2,551 713 494 622 722 161 66 95
Humanities ................................................. 426 12.1 410 92 72 108 138 16 16Art .......................................................... 77 2.2 77 28 11 19 19China-U.S. Relations ............................. 16 0.5 16 16Communication ...................................... 151 4.3 151 22 27 53 49English ................................................... 78 2.2 78 23 10 20 25Japanese Studies .................................. 42 1.2 42 9 13 8 12Performing Arts ...................................... 41 1.2 41 9 9 4 19Philosophy ............................................. 21 0.6 21 1 2 4 14
Natural Sciences ....................................... 801 22.8 757 176 150 183 248 44 44Astronomy .............................................. 54 1.5 54 9 12 13 20Biology ................................................... 198 5.6 198 44 40 47 67Chemistry ............................................... 60 1.7 60 21 11 15 13Computer Science ................................. 73 2.1 73 19 17 22 15Geology .................................................. 25 0.7 25 4 3 3 15Marine Science ...................................... 218 6.2 218 61 51 53 53Mathematics ........................................... 36 1.0 36 7 8 9 12Natural Science ...................................... 27 0.8 27 4 3 5 15Nursing ................................................... 48 1.4 48 1 1 11 35Physics ................................................... 18 0.5 18 6 4 5 3Trop Conserv Bio & Env Sci 2/ ............. 44 1.3 44 44
Social Sciences ......................................... 845 24.1 744 102 122 242 278 101 66 35 Administration of Justice ........................ 63 1.8 63 2 15 22 24 Anthropology .......................................... 72 2.1 72 13 11 18 30
Counseling Psychology 3/ ..................... 19 0.5 19 19 Education ............................................... 16 0.5 16 16
TOTAL UNDERGRADUATES GRADUATES
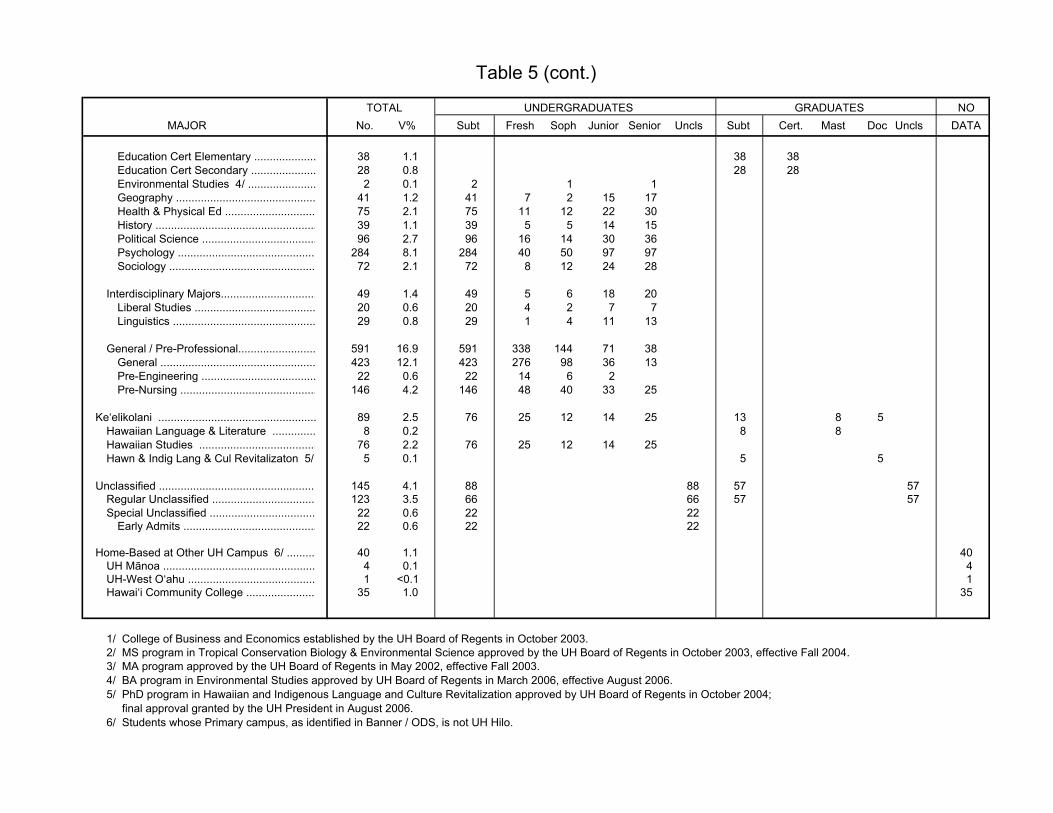
Table 5 (cont.)
NOMAJOR No. V% Subt Fresh Soph Junior Senior Uncls Subt Cert. Mast Doc Uncls DATA
TOTAL UNDERGRADUATES GRADUATES
Education Cert Elementary .................... 38 1.1 38 38 Education Cert Secondary ..................... 28 0.8 28 28
Environmental Studies 4/ ...................... 2 0.1 2 1 1 Geography ............................................. 41 1.2 41 7 2 15 17 Health & Physical Ed ............................. 75 2.1 75 11 12 22 30 History .................................................... 39 1.1 39 5 5 14 15 Political Science ..................................... 96 2.7 96 16 14 30 36 Psychology ............................................. 284 8.1 284 40 50 97 97 Sociology ............................................... 72 2.1 72 8 12 24 28
Interdisciplinary Majors............................... 49 1.4 49 5 6 18 20Liberal Studies ....................................... 20 0.6 20 4 2 7 7Linguistics .............................................. 29 0.8 29 1 4 11 13
General / Pre-Professional......................... 591 16.9 591 338 144 71 38General .................................................. 423 12.1 423 276 98 36 13Pre-Engineering ..................................... 22 0.6 22 14 6 2Pre-Nursing ............................................ 146 4.2 146 48 40 33 25
Ke‘elikolani ................................................... 89 2.5 76 25 12 14 25 13 8 5Hawaiian Language & Literature .............. 8 0.2 8 8Hawaiian Studies ...................................... 76 2.2 76 25 12 14 25Hawn & Indig Lang & Cul Revitalizaton 5/ 5 0.1 5 5
Unclassified ................................................... 145 4.1 88 88 57 57Regular Unclassified .................................. 123 3.5 66 66 57 57Special Unclassified .................................. 22 0.6 22 22
Early Admits ........................................... 22 0.6 22 22
Home-Based at Other UH Campus 6/ .......... 40 1.1 40UH Mānoa ................................................. 4 0.1 4UH-West O‘ahu ......................................... 1 <0.1 1Hawai‘i Community College ....................... 35 1.0 35
1/ College of Business and Economics established by the UH Board of Regents in October 2003.2/ MS program in Tropical Conservation Biology & Environmental Science approved by the UH Board of Regents in October 2003, effective Fall 2004.3/ MA program approved by the UH Board of Regents in May 2002, effective Fall 2003.4/ BA program in Environmental Studies approved by UH Board of Regents in March 2006, effective August 2006.5/ PhD program in Hawaiian and Indigenous Language and Culture Revitalization approved by UH Board of Regents in October 2004; final approval granted by the UH President in August 2006.6/ Students whose Primary campus, as identified in Banner / ODS, is not UH Hilo.

TABLE 6DISTRIBUTION OF MAJORS, CREDIT STUDENTS
UNIVERSITY OF HAWAI‘I AT HILOFALL 2002 TO FALL 2006
FALL SEMESTERMAJOR 2002 2003 2004 2005 2006
No. V% No. V% No. V% No. V% No. V%
TOTAL .................................................. 3,040 100.0 3,300 100.0 3,288 100.0 3,422 100.0 3,507 100.0Lower Division 1/ .............................. 1,416 46.6 1,841 55.8 1,700 51.7 1,541 45.0 1,583 45.1Upper Division .................................. 1,488 48.9 1,373 41.6 1,482 45.1 1,673 48.9 1,693 48.3Graduate Level 2/ ............................. 136 4.5 86 2.6 106 3.2 208 6.1 231 6.6
Col of Ag, For & Nat Res Mgt ............... 151 5.0 158 4.8 140 4.3 146 4.3 164 4.7Lower Division ................................... 72 2.4 81 2.5 72 2.2 58 1.7 54 1.5Upper Division .................................. 79 2.6 77 2.3 68 2.1 88 2.6 110 3.1
College of Business & Econ 3/ ............. 343 11.3 364 11.0 349 10.6 368 10.8 357 10.2Lower Division ................................... 168 5.5 219 6.6 156 4.7 167 4.9 157 4.5Upper Division .................................. 175 5.8 145 4.4 193 5.9 201 5.9 200 5.7
Business Administration .................... 320 10.5 345 10.5 324 9.9 333 9.7 326 9.3Lower Division ................................ 160 5.3 207 6.3 150 4.6 157 4.6 146 4.2Upper Division ............................... 160 5.3 138 4.2 174 5.3 176 5.1 180 5.1
Economics ......................................... 23 0.8 19 0.6 25 0.8 35 1.0 31 0.9Lower Division ................................ 8 0.3 12 0.4 6 0.2 10 0.3 11 0.3Upper Division ............................... 15 0.5 7 0.2 19 0.6 25 0.7 20 0.6
College of Arts & Sciences 4/ ............... 2,287 75.2 2,456 74.4 2,501 76.1 2,653 77.5 2,712 77.3Lower Division ................................... 1,034 34.0 1,278 38.7 1,226 37.3 1,170 34.2 1,207 34.4Upper Division .................................. 1,181 38.8 1,106 33.5 1,177 35.8 1,338 39.1 1,344 38.3Graduate Level .................................. 72 2.4 72 2.2 98 3.0 145 4.2 161 4.6
Humanities ........................................ 344 11.3 384 11.6 419 12.7 417 12.2 426 12.1Lower Division ................................ 107 3.5 186 5.6 168 5.1 149 4.4 164 4.7Upper Division ............................... 237 7.8 198 6.0 242 7.4 250 7.3 246 7.0Graduate Level ............................... 9 0.3 18 0.5 16 0.5
Art ................................................... 62 2.0 59 1.8 74 2.3 75 2.2 77 2.2Lower Division ............................ 24 0.8 33 1.0 35 1.1 31 0.9 39 1.1Upper Division ........................... 38 1.3 26 0.8 39 1.2 44 1.3 38 1.1
China-U.S. Relations 5/ ................. 9 0.3 18 0.5 16 0.5Graduate Level ........................... 9 0.3 18 0.5 16 0.5
Communication .............................. 141 4.6 144 4.4 152 4.6 149 4.4 151 4.3Lower Division ............................ 44 1.4 75 2.3 59 1.8 49 1.4 49 1.4Upper Division ........................... 97 3.2 69 2.1 93 2.8 100 2.9 102 2.9
English ............................................ 97 3.2 94 2.8 87 2.6 77 2.3 78 2.2Lower Division ............................ 24 0.8 37 1.1 33 1.0 32 0.9 33 0.9Upper Division ........................... 73 2.4 57 1.7 54 1.6 45 1.3 45 1.3
Japanese Studies ........................... 15 0.5 25 0.8 25 0.8 28 0.8 42 1.2Lower Division ............................ 10 0.3 14 0.4 9 0.3 14 0.4 22 0.6Upper Division ........................... 5 0.2 11 0.3 16 0.5 14 0.4 20 0.6
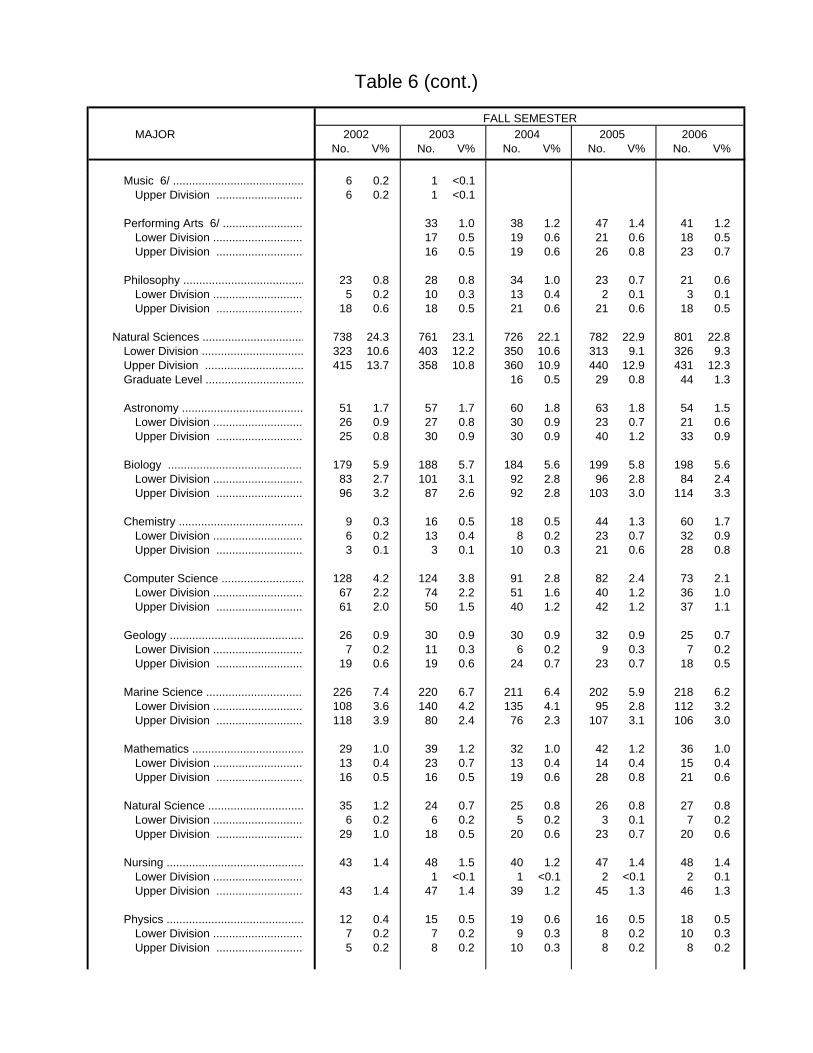
Table 6 (cont.)
FALL SEMESTERMAJOR 2002 2003 2004 2005 2006
No. V% No. V% No. V% No. V% No. V%
Music 6/ ......................................... 6 0.2 1 <0.1 Upper Division ........................... 6 0.2 1 <0.1
Performing Arts 6/ ......................... 33 1.0 38 1.2 47 1.4 41 1.2Lower Division ............................ 17 0.5 19 0.6 21 0.6 18 0.5Upper Division ........................... 16 0.5 19 0.6 26 0.8 23 0.7
Philosophy ...................................... 23 0.8 28 0.8 34 1.0 23 0.7 21 0.6Lower Division ............................ 5 0.2 10 0.3 13 0.4 2 0.1 3 0.1Upper Division ........................... 18 0.6 18 0.5 21 0.6 21 0.6 18 0.5
Natural Sciences ................................ 738 24.3 761 23.1 726 22.1 782 22.9 801 22.8Lower Division ................................ 323 10.6 403 12.2 350 10.6 313 9.1 326 9.3Upper Division ............................... 415 13.7 358 10.8 360 10.9 440 12.9 431 12.3Graduate Level ............................... 16 0.5 29 0.8 44 1.3
Astronomy ...................................... 51 1.7 57 1.7 60 1.8 63 1.8 54 1.5Lower Division ............................ 26 0.9 27 0.8 30 0.9 23 0.7 21 0.6Upper Division ........................... 25 0.8 30 0.9 30 0.9 40 1.2 33 0.9
Biology ........................................... 179 5.9 188 5.7 184 5.6 199 5.8 198 5.6Lower Division ............................ 83 2.7 101 3.1 92 2.8 96 2.8 84 2.4Upper Division ........................... 96 3.2 87 2.6 92 2.8 103 3.0 114 3.3
Chemistry ....................................... 9 0.3 16 0.5 18 0.5 44 1.3 60 1.7Lower Division ............................ 6 0.2 13 0.4 8 0.2 23 0.7 32 0.9Upper Division ........................... 3 0.1 3 0.1 10 0.3 21 0.6 28 0.8
Computer Science .......................... 128 4.2 124 3.8 91 2.8 82 2.4 73 2.1Lower Division ............................ 67 2.2 74 2.2 51 1.6 40 1.2 36 1.0Upper Division ........................... 61 2.0 50 1.5 40 1.2 42 1.2 37 1.1
Geology .......................................... 26 0.9 30 0.9 30 0.9 32 0.9 25 0.7Lower Division ............................ 7 0.2 11 0.3 6 0.2 9 0.3 7 0.2Upper Division ........................... 19 0.6 19 0.6 24 0.7 23 0.7 18 0.5
Marine Science ............................... 226 7.4 220 6.7 211 6.4 202 5.9 218 6.2Lower Division ............................ 108 3.6 140 4.2 135 4.1 95 2.8 112 3.2Upper Division ........................... 118 3.9 80 2.4 76 2.3 107 3.1 106 3.0
Mathematics ................................... 29 1.0 39 1.2 32 1.0 42 1.2 36 1.0Lower Division ............................ 13 0.4 23 0.7 13 0.4 14 0.4 15 0.4Upper Division ........................... 16 0.5 16 0.5 19 0.6 28 0.8 21 0.6
Natural Science .............................. 35 1.2 24 0.7 25 0.8 26 0.8 27 0.8Lower Division ............................ 6 0.2 6 0.2 5 0.2 3 0.1 7 0.2Upper Division ........................... 29 1.0 18 0.5 20 0.6 23 0.7 20 0.6
Nursing ........................................... 43 1.4 48 1.5 40 1.2 47 1.4 48 1.4Lower Division ............................ 1 <0.1 1 <0.1 2 <0.1 2 0.1Upper Division ........................... 43 1.4 47 1.4 39 1.2 45 1.3 46 1.3
Physics ........................................... 12 0.4 15 0.5 19 0.6 16 0.5 18 0.5Lower Division ............................ 7 0.2 7 0.2 9 0.3 8 0.2 10 0.3Upper Division ........................... 5 0.2 8 0.2 10 0.3 8 0.2 8 0.2

Table 6 (cont.)
FALL SEMESTERMAJOR 2002 2003 2004 2005 2006
No. V% No. V% No. V% No. V% No. V%
Trop Conserv Bio & Env Sci 7/ ....... 16 0.5 29 0.8 44 1.3Graduate Level ........................... 16 0.5 29 0.8 44 1.3
Social Sciences ................................. 677 22.3 791 24.0 778 23.7 859 25.1 845 24.1Lower Division ................................ 213 7.0 281 8.5 262 8.0 242 7.1 224 6.4Upper Division ............................... 392 12.9 438 13.3 443 13.5 519 15.2 520 14.8Graduate Level ............................... 72 2.4 72 2.2 73 2.2 98 2.9 101 2.9
Administration of Justice 8/ ........... 24 0.8 47 1.4 52 1.6 50 1.5 63 1.8Lower Division ............................ 11 0.4 19 0.6 18 0.5 14 0.4 17 0.5Upper Division ........................... 13 0.4 28 0.8 34 1.0 36 1.1 46 1.3
Anthropology .................................. 44 1.4 58 1.8 58 1.8 68 2.0 72 2.1Lower Division ............................ 11 0.4 14 0.4 17 0.5 20 0.6 24 0.7Upper Division ........................... 33 1.1 44 1.3 41 1.2 48 1.4 48 1.4
Counseling Psychology 9/ ............. 11 0.3 19 0.5Graduate Level ........................... 11 0.3 19 0.5
Education ....................................... 34 1.1 35 1.1 18 0.5 17 0.5 16 0.5Graduate Level ........................... 34 1.1 35 1.1 18 0.5 17 0.5 16 0.5
Education Elementary (Cert) .......... 12 0.4 22 0.7 32 1.0 38 1.1 38 1.1Graduate Level ........................... 12 0.4 22 0.7 32 1.0 38 1.1 38 1.1
Education Secondary (Cert) ........... 26 0.9 15 0.5 23 0.7 32 0.9 28 0.8Graduate Level ........................... 26 0.9 15 0.5 23 0.7 32 0.9 28 0.8
Environmental Studies 10/ ............ 2 0.1Lower Division ............................ 1 <0.1 Upper Division ........................... 1 <0.1
Geography ...................................... 30 1.0 46 1.4 47 1.4 47 1.4 41 1.2Lower Division ............................ 5 0.2 13 0.4 18 0.5 9 0.3 9 0.3Upper Division ........................... 25 0.8 33 1.0 29 0.9 38 1.1 32 0.9
Health & Physical Ed 11/ ............... 13 0.4 42 1.3 59 1.8 76 2.2 75 2.1Lower Division ............................ 7 0.2 21 0.6 28 0.9 29 0.8 23 0.7Upper Division ........................... 6 0.2 21 0.6 31 0.9 47 1.4 52 1.5
History ............................................ 38 1.3 48 1.5 45 1.4 39 1.1 39 1.1Lower Division ............................ 15 0.5 22 0.7 17 0.5 15 0.4 10 0.3Upper Division ........................... 23 0.8 26 0.8 28 0.9 24 0.7 29 0.8
Political Science ............................. 67 2.2 84 2.5 81 2.5 99 2.9 96 2.7Lower Division ............................ 26 0.9 49 1.5 42 1.3 36 1.1 30 0.9Upper Division ........................... 41 1.3 35 1.1 39 1.2 63 1.8 66 1.9
Psychology ..................................... 302 9.9 310 9.4 283 8.6 290 8.5 284 8.1Lower Division ............................ 119 3.9 124 3.8 98 3.0 95 2.8 90 2.6Upper Division ........................... 183 6.0 186 5.6 185 5.6 195 5.7 194 5.5
Sociology ........................................ 87 2.9 84 2.5 80 2.4 92 2.7 72 2.1Lower Division ............................ 19 0.6 19 0.6 24 0.7 24 0.7 20 0.6Upper Division ........................... 68 2.2 65 2.0 56 1.7 68 2.0 52 1.5
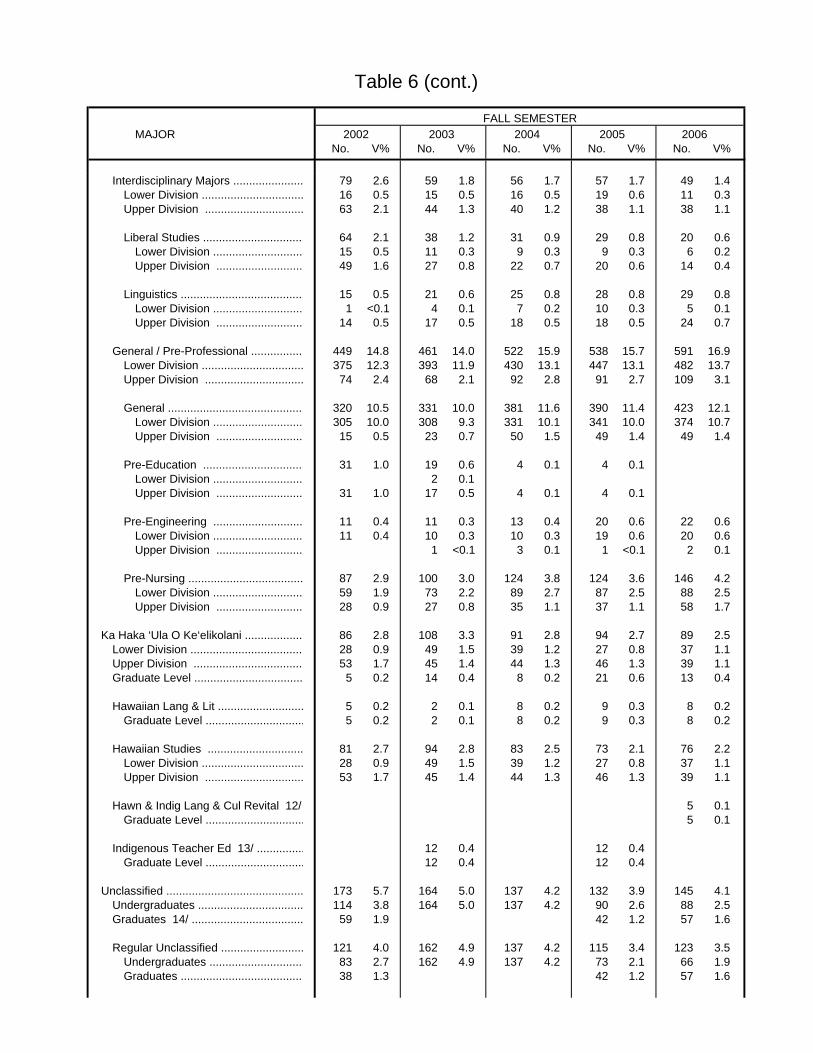
Table 6 (cont.)
FALL SEMESTERMAJOR 2002 2003 2004 2005 2006
No. V% No. V% No. V% No. V% No. V%
Interdisciplinary Majors ...................... 79 2.6 59 1.8 56 1.7 57 1.7 49 1.4Lower Division ................................ 16 0.5 15 0.5 16 0.5 19 0.6 11 0.3Upper Division ............................... 63 2.1 44 1.3 40 1.2 38 1.1 38 1.1
Liberal Studies ................................ 64 2.1 38 1.2 31 0.9 29 0.8 20 0.6Lower Division ............................ 15 0.5 11 0.3 9 0.3 9 0.3 6 0.2Upper Division ........................... 49 1.6 27 0.8 22 0.7 20 0.6 14 0.4
Linguistics ....................................... 15 0.5 21 0.6 25 0.8 28 0.8 29 0.8Lower Division ............................ 1 <0.1 4 0.1 7 0.2 10 0.3 5 0.1Upper Division ........................... 14 0.5 17 0.5 18 0.5 18 0.5 24 0.7
General / Pre-Professional ................ 449 14.8 461 14.0 522 15.9 538 15.7 591 16.9Lower Division ................................ 375 12.3 393 11.9 430 13.1 447 13.1 482 13.7Upper Division ............................... 74 2.4 68 2.1 92 2.8 91 2.7 109 3.1
General ........................................... 320 10.5 331 10.0 381 11.6 390 11.4 423 12.1Lower Division ............................ 305 10.0 308 9.3 331 10.1 341 10.0 374 10.7Upper Division ........................... 15 0.5 23 0.7 50 1.5 49 1.4 49 1.4
Pre-Education ................................ 31 1.0 19 0.6 4 0.1 4 0.1Lower Division ............................ 2 0.1Upper Division ........................... 31 1.0 17 0.5 4 0.1 4 0.1
Pre-Engineering ............................ 11 0.4 11 0.3 13 0.4 20 0.6 22 0.6Lower Division ............................ 11 0.4 10 0.3 10 0.3 19 0.6 20 0.6Upper Division ........................... 1 <0.1 3 0.1 1 <0.1 2 0.1
Pre-Nursing .................................... 87 2.9 100 3.0 124 3.8 124 3.6 146 4.2Lower Division ............................ 59 1.9 73 2.2 89 2.7 87 2.5 88 2.5Upper Division ........................... 28 0.9 27 0.8 35 1.1 37 1.1 58 1.7
Ka Haka ‘Ula O Ke‘elikolani .................. 86 2.8 108 3.3 91 2.8 94 2.7 89 2.5Lower Division ................................... 28 0.9 49 1.5 39 1.2 27 0.8 37 1.1Upper Division .................................. 53 1.7 45 1.4 44 1.3 46 1.3 39 1.1Graduate Level .................................. 5 0.2 14 0.4 8 0.2 21 0.6 13 0.4
Hawaiian Lang & Lit ........................... 5 0.2 2 0.1 8 0.2 9 0.3 8 0.2Graduate Level ............................... 5 0.2 2 0.1 8 0.2 9 0.3 8 0.2
Hawaiian Studies .............................. 81 2.7 94 2.8 83 2.5 73 2.1 76 2.2Lower Division ................................ 28 0.9 49 1.5 39 1.2 27 0.8 37 1.1Upper Division ............................... 53 1.7 45 1.4 44 1.3 46 1.3 39 1.1
Hawn & Indig Lang & Cul Revital 12/ 5 0.1Graduate Level ............................... 5 0.1
Indigenous Teacher Ed 13/ ............... 12 0.4 12 0.4Graduate Level ............................... 12 0.4 12 0.4
Unclassified ........................................... 173 5.7 164 5.0 137 4.2 132 3.9 145 4.1Undergraduates ................................. 114 3.8 164 5.0 137 4.2 90 2.6 88 2.5Graduates 14/ ................................... 59 1.9 42 1.2 57 1.6
Regular Unclassified .......................... 121 4.0 162 4.9 137 4.2 115 3.4 123 3.5Undergraduates .............................. 83 2.7 162 4.9 137 4.2 73 2.1 66 1.9Graduates ....................................... 38 1.3 42 1.2 57 1.6
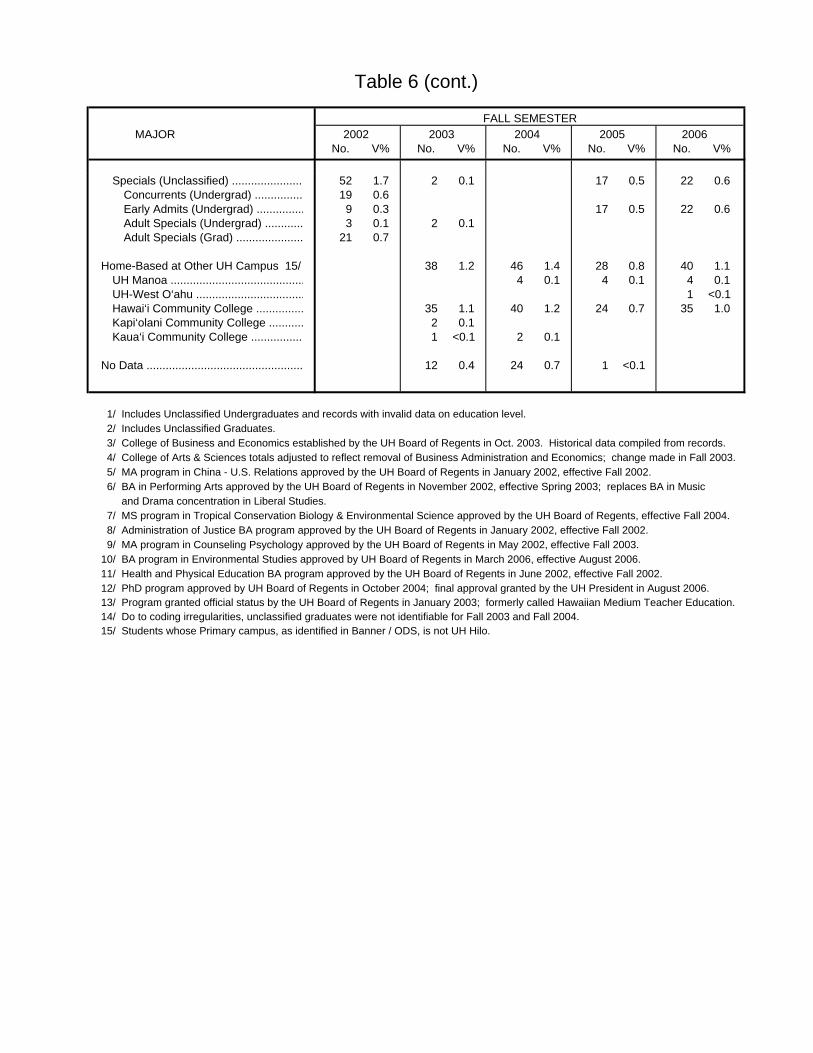
Table 6 (cont.)
FALL SEMESTERMAJOR 2002 2003 2004 2005 2006
No. V% No. V% No. V% No. V% No. V%
Specials (Unclassified) ...................... 52 1.7 2 0.1 17 0.5 22 0.6Concurrents (Undergrad) ............... 19 0.6Early Admits (Undergrad) ............... 9 0.3 17 0.5 22 0.6Adult Specials (Undergrad) ............ 3 0.1 2 0.1Adult Specials (Grad) ..................... 21 0.7
Home-Based at Other UH Campus 15/ 38 1.2 46 1.4 28 0.8 40 1.1UH Manoa .......................................... 4 0.1 4 0.1 4 0.1UH-West O‘ahu .................................. 1 <0.1 Hawai‘i Community College ............... 35 1.1 40 1.2 24 0.7 35 1.0Kapi‘olani Community College ........... 2 0.1Kaua‘i Community College ................ 1 <0.1 2 0.1
No Data ................................................. 12 0.4 24 0.7 1 <0.1
1/ Includes Unclassified Undergraduates and records with invalid data on education level. 2/ Includes Unclassified Graduates. 3/ College of Business and Economics established by the UH Board of Regents in Oct. 2003. Historical data compiled from records. 4/ College of Arts & Sciences totals adjusted to reflect removal of Business Administration and Economics; change made in Fall 2003. 5/ MA program in China - U.S. Relations approved by the UH Board of Regents in January 2002, effective Fall 2002. 6/ BA in Performing Arts approved by the UH Board of Regents in November 2002, effective Spring 2003; replaces BA in Music and Drama concentration in Liberal Studies. 7/ MS program in Tropical Conservation Biology & Environmental Science approved by the UH Board of Regents, effective Fall 2004. 8/ Administration of Justice BA program approved by the UH Board of Regents in January 2002, effective Fall 2002. 9/ MA program in Counseling Psychology approved by the UH Board of Regents in May 2002, effective Fall 2003.10/ BA program in Environmental Studies approved by UH Board of Regents in March 2006, effective August 2006.11/ Health and Physical Education BA program approved by the UH Board of Regents in June 2002, effective Fall 2002.12/ PhD program approved by UH Board of Regents in October 2004; final approval granted by the UH President in August 2006.13/ Program granted official status by the UH Board of Regents in January 2003; formerly called Hawaiian Medium Teacher Education.14/ Do to coding irregularities, unclassified graduates were not identifiable for Fall 2003 and Fall 2004.15/ Students whose Primary campus, as identified in Banner / ODS, is not UH Hilo.
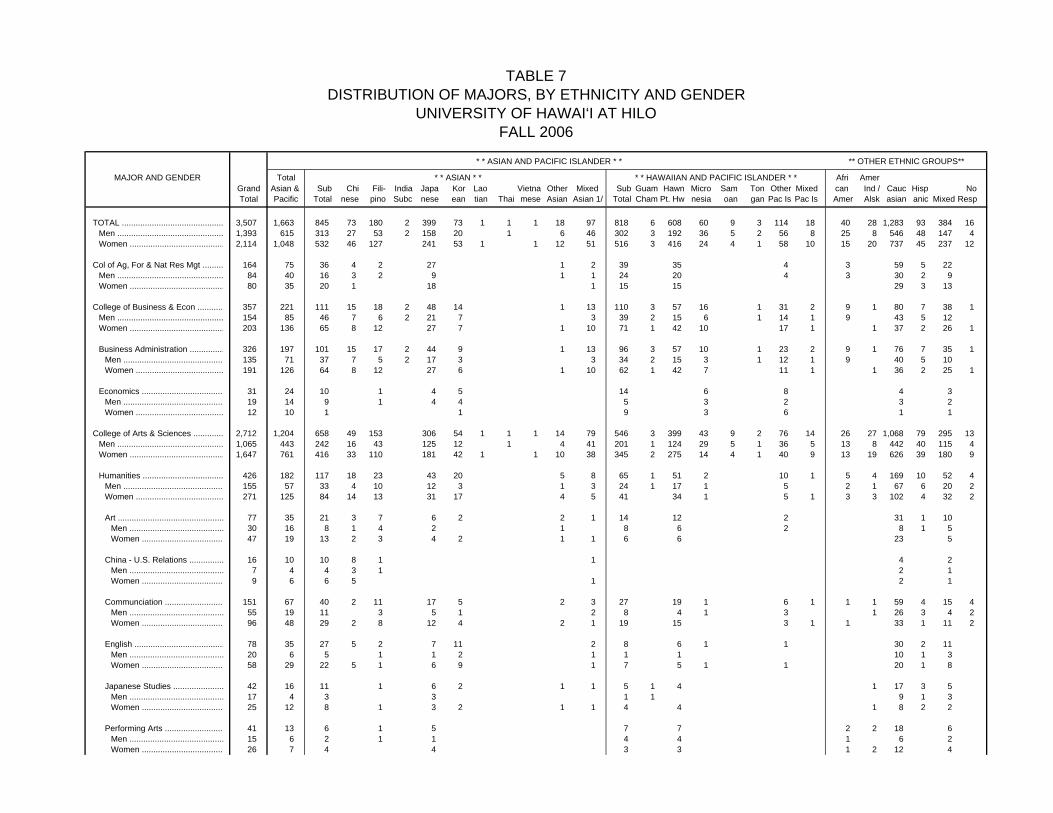
TABLE 7DISTRIBUTION OF MAJORS, BY ETHNICITY AND GENDER
UNIVERSITY OF HAWAI‘I AT HILOFALL 2006
* * ASIAN AND PACIFIC ISLANDER * * ** OTHER ETHNIC GROUPS**
MAJOR AND GENDER Total * * ASIAN * * * * HAWAIIAN AND PACIFIC ISLANDER * * Afri AmerGrand Asian & Sub Chi Fili- India Japa Kor Lao Vietna Other Mixed Sub Guam Hawn Micro Sam Ton Other Mixed can Ind / Cauc Hisp NoTotal Pacific Total nese pino Subc nese ean tian Thai mese Asian Asian 1/ Total Cham Pt. Hw nesia oan gan Pac Is Pac Is Amer Alsk asian anic Mixed Resp
TOTAL ............................................ 3,507 1,663 845 73 180 2 399 73 1 1 1 18 97 818 6 608 60 9 3 114 18 40 28 1,283 93 384 16Men .............................................. 1,393 615 313 27 53 2 158 20 1 6 46 302 3 192 36 5 2 56 8 25 8 546 48 147 4Women ......................................... 2,114 1,048 532 46 127 241 53 1 1 12 51 516 3 416 24 4 1 58 10 15 20 737 45 237 12
Col of Ag, For & Nat Res Mgt ......... 164 75 36 4 2 27 1 2 39 35 4 3 59 5 22Men .............................................. 84 40 16 3 2 9 1 1 24 20 4 3 30 2 9Women ......................................... 80 35 20 1 18 1 15 15 29 3 13
College of Business & Econ ........... 357 221 111 15 18 2 48 14 1 13 110 3 57 16 1 31 2 9 1 80 7 38 1Men .............................................. 154 85 46 7 6 2 21 7 3 39 2 15 6 1 14 1 9 43 5 12Women ......................................... 203 136 65 8 12 27 7 1 10 71 1 42 10 17 1 1 37 2 26 1
Business Administration ............... 326 197 101 15 17 2 44 9 1 13 96 3 57 10 1 23 2 9 1 76 7 35 1Men ............................................ 135 71 37 7 5 2 17 3 3 34 2 15 3 1 12 1 9 40 5 10Women ...................................... 191 126 64 8 12 27 6 1 10 62 1 42 7 11 1 1 36 2 25 1
Economics .................................... 31 24 10 1 4 5 14 6 8 4 3Men ............................................ 19 14 9 1 4 4 5 3 2 3 2Women ...................................... 12 10 1 1 9 3 6 1 1
College of Arts & Sciences ............. 2,712 1,204 658 49 153 306 54 1 1 1 14 79 546 3 399 43 9 2 76 14 26 27 1,068 79 295 13Men .............................................. 1,065 443 242 16 43 125 12 1 4 41 201 1 124 29 5 1 36 5 13 8 442 40 115 4Women ......................................... 1,647 761 416 33 110 181 42 1 1 10 38 345 2 275 14 4 1 40 9 13 19 626 39 180 9
Humanities ................................... 426 182 117 18 23 43 20 5 8 65 1 51 2 10 1 5 4 169 10 52 4Men ............................................ 155 57 33 4 10 12 3 1 3 24 1 17 1 5 2 1 67 6 20 2Women ...................................... 271 125 84 14 13 31 17 4 5 41 34 1 5 1 3 3 102 4 32 2
Art .............................................. 77 35 21 3 7 6 2 2 1 14 12 2 31 1 10Men ......................................... 30 16 8 1 4 2 1 8 6 2 8 1 5Women .................................... 47 19 13 2 3 4 2 1 1 6 6 23 5
China - U.S. Relations ............... 16 10 10 8 1 1 4 2Men ......................................... 7 4 4 3 1 2 1Women .................................... 9 6 6 5 1 2 1
Communciation .......................... 151 67 40 2 11 17 5 2 3 27 19 1 6 1 1 1 59 4 15 4Men ......................................... 55 19 11 3 5 1 2 8 4 1 3 1 26 3 4 2Women .................................... 96 48 29 2 8 12 4 2 1 19 15 3 1 1 33 1 11 2
English ....................................... 78 35 27 5 2 7 11 2 8 6 1 1 30 2 11Men ......................................... 20 6 5 1 1 2 1 1 1 10 1 3Women .................................... 58 29 22 5 1 6 9 1 7 5 1 1 20 1 8
Japanese Studies ...................... 42 16 11 1 6 2 1 1 5 1 4 1 17 3 5Men ......................................... 17 4 3 3 1 1 9 1 3Women .................................... 25 12 8 1 3 2 1 1 4 4 1 8 2 2
Performing Arts .......................... 41 13 6 1 5 7 7 2 2 18 6Men ......................................... 15 6 2 1 1 4 4 1 6 2Women .................................... 26 7 4 4 3 3 1 2 12 4
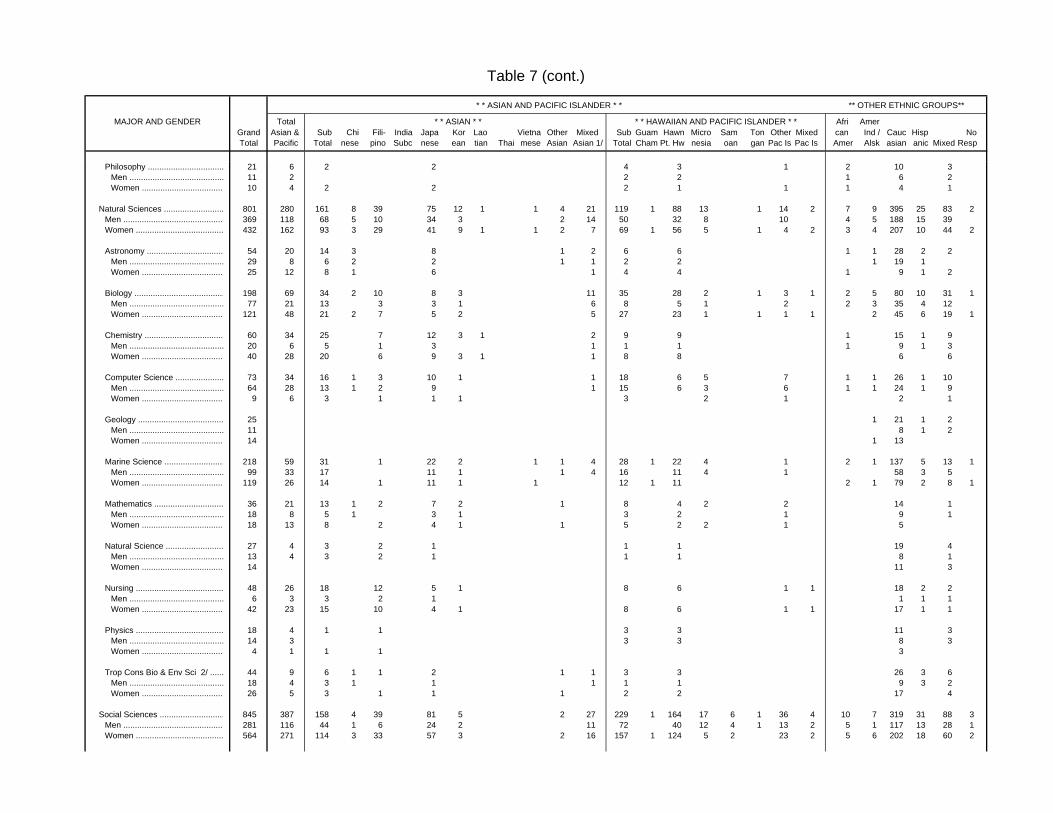
Table 7 (cont.)
* * ASIAN AND PACIFIC ISLANDER * * ** OTHER ETHNIC GROUPS**
MAJOR AND GENDER Total * * ASIAN * * * * HAWAIIAN AND PACIFIC ISLANDER * * Afri AmerGrand Asian & Sub Chi Fili- India Japa Kor Lao Vietna Other Mixed Sub Guam Hawn Micro Sam Ton Other Mixed can Ind / Cauc Hisp NoTotal Pacific Total nese pino Subc nese ean tian Thai mese Asian Asian 1/ Total Cham Pt. Hw nesia oan gan Pac Is Pac Is Amer Alsk asian anic Mixed Resp
Philosophy ................................. 21 6 2 2 4 3 1 2 10 3Men ......................................... 11 2 2 2 1 6 2Women .................................... 10 4 2 2 2 1 1 1 4 1
Natural Sciences .......................... 801 280 161 8 39 75 12 1 1 4 21 119 1 88 13 1 14 2 7 9 395 25 83 2Men ............................................ 369 118 68 5 10 34 3 2 14 50 32 8 10 4 5 188 15 39Women ...................................... 432 162 93 3 29 41 9 1 1 2 7 69 1 56 5 1 4 2 3 4 207 10 44 2
Astronomy ................................. 54 20 14 3 8 1 2 6 6 1 1 28 2 2Men ......................................... 29 8 6 2 2 1 1 2 2 1 19 1Women .................................... 25 12 8 1 6 1 4 4 1 9 1 2
Biology ....................................... 198 69 34 2 10 8 3 11 35 28 2 1 3 1 2 5 80 10 31 1Men ......................................... 77 21 13 3 3 1 6 8 5 1 2 2 3 35 4 12Women .................................... 121 48 21 2 7 5 2 5 27 23 1 1 1 1 2 45 6 19 1
Chemistry .................................. 60 34 25 7 12 3 1 2 9 9 1 15 1 9Men ......................................... 20 6 5 1 3 1 1 1 1 9 1 3Women .................................... 40 28 20 6 9 3 1 1 8 8 6 6
Computer Science ..................... 73 34 16 1 3 10 1 1 18 6 5 7 1 1 26 1 10Men ......................................... 64 28 13 1 2 9 1 15 6 3 6 1 1 24 1 9Women .................................... 9 6 3 1 1 1 3 2 1 2 1
Geology ..................................... 25 1 21 1 2Men ......................................... 11 8 1 2Women .................................... 14 1 13
Marine Science .......................... 218 59 31 1 22 2 1 1 4 28 1 22 4 1 2 1 137 5 13 1Men ......................................... 99 33 17 11 1 1 4 16 11 4 1 58 3 5Women .................................... 119 26 14 1 11 1 1 12 1 11 2 1 79 2 8 1
Mathematics .............................. 36 21 13 1 2 7 2 1 8 4 2 2 14 1Men ......................................... 18 8 5 1 3 1 3 2 1 9 1Women .................................... 18 13 8 2 4 1 1 5 2 2 1 5
Natural Science ......................... 27 4 3 2 1 1 1 19 4Men ......................................... 13 4 3 2 1 1 1 8 1Women .................................... 14 11 3
Nursing ...................................... 48 26 18 12 5 1 8 6 1 1 18 2 2Men ......................................... 6 3 3 2 1 1 1 1Women .................................... 42 23 15 10 4 1 8 6 1 1 17 1 1
Physics ...................................... 18 4 1 1 3 3 11 3Men ......................................... 14 3 3 3 8 3Women .................................... 4 1 1 1 3
Trop Cons Bio & Env Sci 2/ ...... 44 9 6 1 1 2 1 1 3 3 26 3 6Men ......................................... 18 4 3 1 1 1 1 1 9 3 2Women .................................... 26 5 3 1 1 1 2 2 17 4
Social Sciences ............................ 845 387 158 4 39 81 5 2 27 229 1 164 17 6 1 36 4 10 7 319 31 88 3Men ............................................ 281 116 44 1 6 24 2 11 72 40 12 4 1 13 2 5 1 117 13 28 1Women ...................................... 564 271 114 3 33 57 3 2 16 157 1 124 5 2 23 2 5 6 202 18 60 2

Table 7 (cont.)
* * ASIAN AND PACIFIC ISLANDER * * ** OTHER ETHNIC GROUPS**
MAJOR AND GENDER Total * * ASIAN * * * * HAWAIIAN AND PACIFIC ISLANDER * * Afri AmerGrand Asian & Sub Chi Fili- India Japa Kor Lao Vietna Other Mixed Sub Guam Hawn Micro Sam Ton Other Mixed can Ind / Cauc Hisp NoTotal Pacific Total nese pino Subc nese ean tian Thai mese Asian Asian 1/ Total Cham Pt. Hw nesia oan gan Pac Is Pac Is Amer Alsk asian anic Mixed Resp
Admin of Justice ........................ 63 43 11 5 5 1 32 1 19 4 8 14 3 3Men ......................................... 27 16 6 2 3 1 10 4 3 3 8 2 1Women .................................... 36 27 5 3 2 22 1 15 1 5 6 1 2
Anthropology ............................. 72 22 6 2 3 1 16 9 2 4 1 1 41 1 6 1Men ......................................... 24 5 5 3 1 1 1 16 1 1Women .................................... 48 17 6 2 3 1 11 6 1 3 1 25 6
Counseling Psychology 3/ ........ 19 7 4 2 2 3 3 1 7 2 2Men ......................................... 1 1 1 1Women .................................... 18 6 3 2 1 3 3 1 7 2 2
Education ................................... 16 9 3 3 6 6 3 1 3Men ......................................... 4 2 2 2 1 1Women .................................... 12 7 3 3 4 4 2 1 2
Education Cert Elementary ........ 38 18 10 3 6 1 8 8 16 1 2 1Men ......................................... 7 2 1 1 1 1 5Women .................................... 31 16 9 3 5 1 7 7 11 1 2 1
Education Cert Secondary.......... 28 9 7 1 4 1 1 2 1 1 12 1 6Men ......................................... 12 3 3 3 6 3Women .................................... 16 6 4 1 1 1 1 2 1 1 6 1 3
Environmental Studies 4/ .......... 2 1 1 1 1Women .................................... 2 1 1 1 1
Geography ................................. 41 9 1 1 8 4 2 2 1 1 24 2 4Men ......................................... 24 6 1 1 5 3 2 1 14 1 2Women .................................... 17 3 3 1 2 1 10 1 2
Health & Physical Ed ................. 75 41 19 5 9 5 22 18 1 2 1 23 4 7Men ......................................... 38 23 12 1 7 4 11 9 1 1 11 2 2Women .................................... 37 18 7 4 2 1 11 9 1 1 12 2 5
History ....................................... 39 9 5 1 2 1 1 4 3 1 1 24 1 4Men ......................................... 24 6 4 1 2 1 2 1 1 1 13 1 3Women .................................... 15 3 1 1 2 2 11 1
Political Science ........................ 96 49 12 1 3 4 1 3 37 13 10 2 10 2 1 1 31 3 11Men ......................................... 51 28 7 1 3 3 21 5 7 1 6 2 1 15 2 5Women .................................... 45 21 5 1 2 1 1 16 8 3 1 4 1 16 1 6
Psychology ................................ 284 133 63 2 14 35 2 1 9 70 60 1 1 8 2 4 102 9 33 1Men ......................................... 58 22 8 2 5 1 14 11 1 2 1 23 3 9Women .................................... 226 111 55 2 12 30 2 1 8 56 49 1 6 1 4 79 6 24 1
Sociology ................................... 72 37 16 6 7 3 21 20 1 3 1 21 3 7Men ......................................... 11 2 1 1 1 1 1 5 1 2Women .................................... 61 35 15 6 7 2 20 19 1 2 1 16 2 5
Interdisciplinary Majors ................ 49 22 19 3 2 8 3 3 3 2 1 1 24 1 1Men ............................................ 22 10 8 2 2 2 2 2 1 1 11 1Women ...................................... 27 12 11 1 6 3 1 1 1 1 13 1
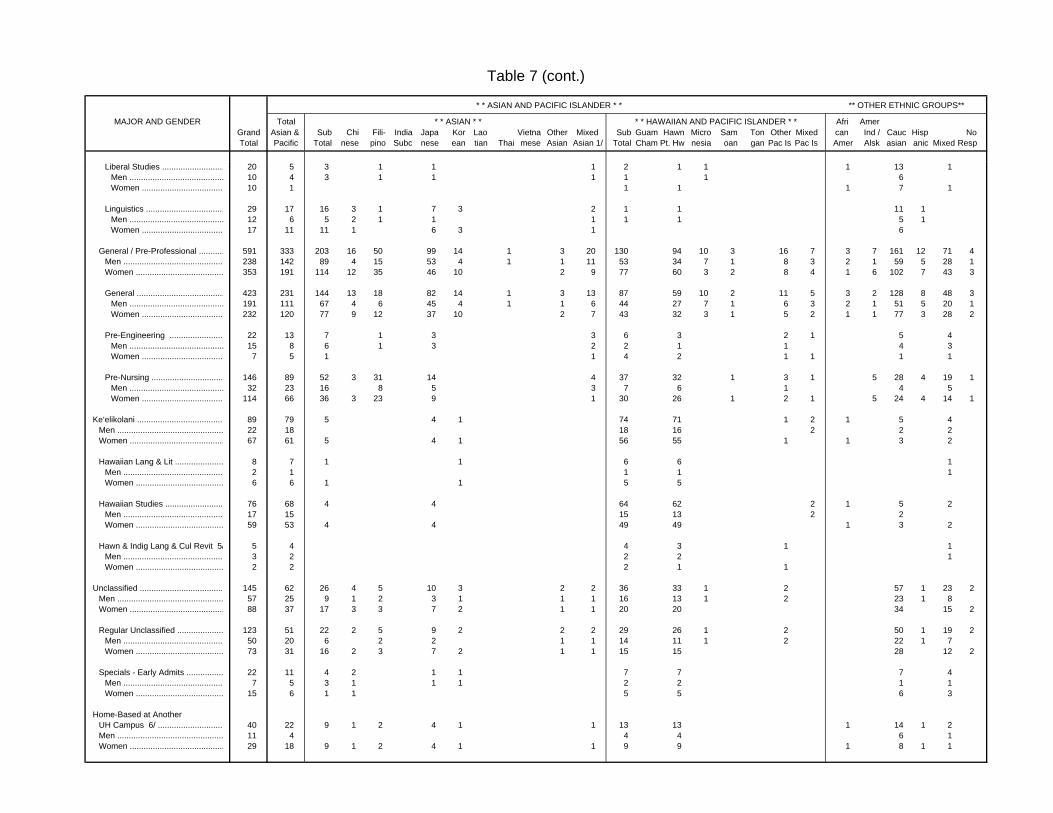
Table 7 (cont.)
* * ASIAN AND PACIFIC ISLANDER * * ** OTHER ETHNIC GROUPS**
MAJOR AND GENDER Total * * ASIAN * * * * HAWAIIAN AND PACIFIC ISLANDER * * Afri AmerGrand Asian & Sub Chi Fili- India Japa Kor Lao Vietna Other Mixed Sub Guam Hawn Micro Sam Ton Other Mixed can Ind / Cauc Hisp NoTotal Pacific Total nese pino Subc nese ean tian Thai mese Asian Asian 1/ Total Cham Pt. Hw nesia oan gan Pac Is Pac Is Amer Alsk asian anic Mixed Resp
Liberal Studies ........................... 20 5 3 1 1 1 2 1 1 1 13 1Men ......................................... 10 4 3 1 1 1 1 1 6Women .................................... 10 1 1 1 1 7 1
Linguistics .................................. 29 17 16 3 1 7 3 2 1 1 11 1Men ......................................... 12 6 5 2 1 1 1 1 1 5 1Women .................................... 17 11 11 1 6 3 1 6
General / Pre-Professional ........... 591 333 203 16 50 99 14 1 3 20 130 94 10 3 16 7 3 7 161 12 71 4Men ............................................ 238 142 89 4 15 53 4 1 1 11 53 34 7 1 8 3 2 1 59 5 28 1Women ...................................... 353 191 114 12 35 46 10 2 9 77 60 3 2 8 4 1 6 102 7 43 3
General ...................................... 423 231 144 13 18 82 14 1 3 13 87 59 10 2 11 5 3 2 128 8 48 3Men ......................................... 191 111 67 4 6 45 4 1 1 6 44 27 7 1 6 3 2 1 51 5 20 1Women .................................... 232 120 77 9 12 37 10 2 7 43 32 3 1 5 2 1 1 77 3 28 2
Pre-Engineering ........................ 22 13 7 1 3 3 6 3 2 1 5 4Men ......................................... 15 8 6 1 3 2 2 1 1 4 3Women .................................... 7 5 1 1 4 2 1 1 1 1
Pre-Nursing ............................... 146 89 52 3 31 14 4 37 32 1 3 1 5 28 4 19 1Men ......................................... 32 23 16 8 5 3 7 6 1 4 5Women .................................... 114 66 36 3 23 9 1 30 26 1 2 1 5 24 4 14 1
Ke‘elikolani ...................................... 89 79 5 4 1 74 71 1 2 1 5 4Men .............................................. 22 18 18 16 2 2 2Women ......................................... 67 61 5 4 1 56 55 1 1 3 2
Hawaiian Lang & Lit ..................... 8 7 1 1 6 6 1Men ............................................ 2 1 1 1 1Women ...................................... 6 6 1 1 5 5
Hawaiian Studies ......................... 76 68 4 4 64 62 2 1 5 2Men ............................................ 17 15 15 13 2 2Women ...................................... 59 53 4 4 49 49 1 3 2
Hawn & Indig Lang & Cul Revit 5/ 5 4 4 3 1 1Men ............................................ 3 2 2 2 1Women ...................................... 2 2 2 1 1
Unclassified .................................... 145 62 26 4 5 10 3 2 2 36 33 1 2 57 1 23 2Men .............................................. 57 25 9 1 2 3 1 1 1 16 13 1 2 23 1 8Women ......................................... 88 37 17 3 3 7 2 1 1 20 20 34 15 2
Regular Unclassified .................... 123 51 22 2 5 9 2 2 2 29 26 1 2 50 1 19 2Men ............................................ 50 20 6 2 2 1 1 14 11 1 2 22 1 7Women ...................................... 73 31 16 2 3 7 2 1 1 15 15 28 12 2
Specials - Early Admits ................ 22 11 4 2 1 1 7 7 7 4Men ............................................ 7 5 3 1 1 1 2 2 1 1Women ...................................... 15 6 1 1 5 5 6 3
Home-Based at Another UH Campus 6/ ............................. 40 22 9 1 2 4 1 1 13 13 1 14 1 2Men .............................................. 11 4 4 4 6 1Women ......................................... 29 18 9 1 2 4 1 1 9 9 1 8 1 1
Table 7 (cont.)
* * ASIAN AND PACIFIC ISLANDER * * ** OTHER ETHNIC GROUPS**
MAJOR AND GENDER Total * * ASIAN * * * * HAWAIIAN AND PACIFIC ISLANDER * * Afri AmerGrand Asian & Sub Chi Fili- India Japa Kor Lao Vietna Other Mixed Sub Guam Hawn Micro Sam Ton Other Mixed can Ind / Cauc Hisp NoTotal Pacific Total nese pino Subc nese ean tian Thai mese Asian Asian 1/ Total Cham Pt. Hw nesia oan gan Pac Is Pac Is Amer Alsk asian anic Mixed Resp
1/ Mixed Asian Pacific Islander category was renamed Mixed Asian as a result of the migration to Banner in Spring 2003. Mixed Asian and Pacific Islander data are now reported under Mixed Asian.2/ MS program in Tropical Conservation Biology & Environmental Science approved by the UH Board of Regents in October 2003, effective Fall 2004.3/ MA program in Counseling Psychology approved by the UH Board of Regents in May 2002, effective Fall 2003.4/ BA program in Environmental Studies approved by UH Board of Regents in March 2006, effective August 2006.5/ PhD program in Hawaiian and Indigenous Language and Culture Revitalization approved by UH Board of Regents in October 2004; final approval granted by the UH President in August 2006.6/ Students whose Primary campus, as identified in Banner / ODS, is not UH Hilo.