Financing Intermediate Inputs and Misallocation: Evidence ...
Export performance and access to intermediate inputs:
the case of rules of origin liberalisation ∗
Anna Andersson†
Department of Economics, Lund University, P.O. Box 7082, SE-22207 Lund, Sweden
August 2014
PRELIMINARY DRAFT. PLEASE DO NOT CITE.
Abstract
Internationally fragmented production processes have highlighted the need of efficient
sourcing from foreign suppliers. This paper aims to investigate how exports of final goods
are affected by better access to foreign intermediate inputs. In particular, the paper
empirically tests if expanding the set of available intermediate input suppliers through
preferential rules of origin liberalisation affects exports of final goods. We exploit the
introduction of the southern Mediterranean countries into the Pan-Euro-Med zone of di-
agonal cumulation which meant that foreign intermediate inputs could be used from more
countries than before without jeopardising the preferential access to the EU. By using a
fixed effects specification that controls for detailed levels of unobserved heterogeneity and
multilateral resistance we examine the effect of the new diagonal cumulation possibilities
on southern Mediterranean exports to EU15. We find a positive effect on export intensity,
the value of exports, but no robust effect on export diversification, the number of exported
products. Being part of the Pan-Euro-Med zone of diagonal cumulation is associated with
a 17% increase in export intensity.
Keywords: Rules of origin, the Euro-Med partnership, intermediate inputs, export perfor-
mance
JEL: F13, F14, F15
∗I would like to thank Joakim Gullstrand, Maria Persson, and participants at the Lund University
international economics seminars for helpful comments and suggestions.†Tel.: +46 (0)46 222 46 69, e-mail: [email protected]
1
1 Introduction
Fragmented production processes with global supply chains have made sourcing strategies
more complex. Today, most goods consist of intermediate inputs produced in many dif-
ferent places. Efficient sourcing of intermediate inputs has therefore become increasingly
important for competitiveness. Limited access to efficient suppliers reduces firms’ possi-
bilities to compete both on the domestic and the international market. It has for example
been shown that input tariff cuts promote firm productivity (Amiti and Konings, 2007),
the range of products produced by domestic firms (Goldberg et al., 2010), the probability
of entering the export market (Bas, 2012) and export performance among productive firms
(Chevassus-Lozza et al., 2013). Tariffs on intermediate inputs is only one way to limit the
access to efficient foreign suppliers. This paper focuses on a different trade policy instru-
ment that also highly affects the possibility to source intermediate inputs from abroad,
preferential rules of origin (ROO).
FTAs and PTAs aim to improve market access for signatory parties by offering bilateral
(FTAs) or unilateral (PTAs) tariff cuts. Since the aim of the agreements is to give pref-
erential market access to some countries but not to others, for whatever reason, rules are
needed to make sure that only products produced in countries eligible for trade prefer-
ences are given tariff cuts. Preferential rules of origin (ROO) define what constitutes an
originating product in a country that is granted preferential access, i.e. preferential ROO
define which goods that are eligible for the tariff cuts offered in FTAs and PTAs.
ROO are necessary in FTAs and PTAs to prevent trade deflection but they may also
substantially reduce the value of the preferences granted. ROO are often very complex
and the administrative burden of compliance may be high. Most importantly, ROO limit
which foreign intermediate inputs a final-good producer can use. For example, originating
status may only be granted to a sweater if at least 50% of its value is added or if both the
weaving of the fabric and the sewing takes place in the country. This restrictiveness of the
ROO can be problematic in a world where cross-border production sharing is important
to stay competitive. Producers may no longer be able to use the most efficient suppliers
without loosing the originating status of the final good.
This paper aims at investigating how ROO liberalisation which results in better access
to foreign intermediate input suppliers affects exports of final goods. Better access to
efficient suppliers and/or access to suppliers of previously unavailable intermediate goods
should make exporters more competitive through a reduction of production costs. This
can increase export volumes and make it profitable to export more products than before.
The main aim is hence to empirically test if expanding the set of available suppliers
through ROO liberalisation affects i) export intensity measured as the value of exports
of final goods, and ii) export diversification measured as the number of exported final
goods. To perform the empirical estimations we exploit the introduction of the southern
Mediterranean countries (Algeria, Egypt, Israel, Jordan, Lebanon, Libya, Morocco, the
2
Palestinian Authority, Syria and Tunisia) into the Pan-European System of Cumulation
(PECS).1 The analysis gives new insights into how intermediate input trade liberalisation
affects export possibilities in several ways. First, compared to previous studies we clearly
differentiate between intermediate and final good trade which allows us to capture the
impact of efficient sourcing on final good trade instead of total trade. Second, by not
only analysing export intensity but also export diversification we are able to give a more
complete picture of how access to intermediate inputs affects export patterns. Third, we
provide a complement to the studies that focus on input tariff liberalisation and trade
by looking at another way to improve the access to foreign intermediate inputs, ROO
liberalisation. Fourth, we also add to the ROO literature by using different measures of
cumulation to better capture the differences in cumulation possibilities between countries.
Lastly, the detailed dataset used allows us to control for very detailed levels of unobserved
heterogeneity in form of product-level fixed effects.
The introduction of the southern Mediterranean countries into the Pan-European System
of Cumulation (PECS) meant, in short, that the ROO were liberalised in the trade agree-
ments between the southern Mediterranean countries and the European countries in such
a way that it became easier to use imported intermediate inputs in final-good production.
In technical terms, this meant that the southern Mediterranean countries were introduced
into a European system of diagonal cumulation.2 PECS was originally introduced in 1997
between the EU, EFTA and 10 EU applicant countries.3 The countries substituted the
existing ROO in all different European FTAs with a common set of rules that allowed for
diagonal cumulation. Diagonal cumulation made it possible for the participating countries
to use originating intermediate inputs, to cumulate value, from each other without risking
the preferential access of the final good to any of the participating markets of which the
most important market naturally was the EU market.
The southern Mediterranean countries were introduced into the European cumulation
system in the middle of the 2000s as a part of the Barcelona process.4 The cooperation
between the EU and the southern Mediterranean countries has a long history and indus-
trial products from these countries have had preferential access to the EU market since
1When the term southern Mediterranean countries is used below it always refers to Algeria, Egypt,
Israel, Jordan, Lebanon, Libya, Morocco, the Palestinian Authority, Syria and Tunisia.2Integration of the southern Mediterranean countries into the PECS is an ongoing process meaning
that some countries are still outside the cumulation system, see below.3In 1997 the EU had 15 member states: Austria, Belgium, Denmark, Finland, France, Germany, Greece,
Ireland, Italy, Luxembourg, the Netherlands, Portugal, Spain, Sweden, the UK. EFTA had 4 members:
Iceland, Lichtenstein, Norway and Switzerland. The EU applicants were: Bulgaria, Estonia, Hungary,
Latvia, Lithuania, the Czech Republic, Poland, Romania, Slovakia and Slovenia. Turkey joined the PECS
in 1999.4The Barcelona process was launched in 1995 between the EU and 14 southern Mediterranean
countries. It aims to strengthen the Euro-Med partnership through among other things deeper eco-
nomic integration. See for example http://ec.europa.eu/trade/policy/countries-and-regions/regions/euro-
mediterranean-partnership/ for more information.
3
the 1970s through the Cooperation Agreements. The rules of origin had previously only
allowed for bilateral cumulation between the EU and the signatory country which made
them rather restrictive. If for example Egypt used intermediate inputs from the EU in
the production of a final good it did not affect the preferential access of the Egyptian final
good to the EU market but imported intermediate inputs from any other source coun-
try could potentially jeopardise the preferential access. When the more liberal cumulation
rules were introduced, southern Mediterranean countries could use imported intermediates
from all countries in the Pan-Euro-Med zone (the original PECS area plus the southern
Mediterranean countries) given that an FTA with the common set of ROO was in place be-
tween the importer and exporter. It hence became easier to utilise cross-border production
sharing in the region.
Access to more efficient suppliers is likely to have a positive effect on the southern Mediter-
ranean countries’ possibilities to expand exports to the EU and to diversify production
structures. This could be of great importance for the future development process of the
region. Brenton et al. (2006) have shown that the southern Mediterranean countries have
yet not fully utilised the trade potential of being located close to the EU and that these
countries tend to be dependent on few export industries. The southern Mediterranean
countries have for example the lowest share of non-oil exports to GDP of all development
regions. Intra-regional trade has also been very low in an international perspective.5 More
liberal cumulation rules which allow for intra-regional production sharing could hence be
especially important for the southern Mediterranean countries’ export performance.
To estimate the effect of introducing the southern Mediterranean countries into the diago-
nal cumulation system we use a fixed effects specification that controls for detailed levels of
unobserved heterogeneity. We focus our attention on export flows of final goods between
the southern Mediterranean countries and the EU15 during the period 2000-2010. Our
results indicate that introducing the southern Mediterranean countries into the Pan-Euro-
Med zone of diagonal cumulation and thereby expanding the set of available suppliers had
a positive effect on export intensity measured as the value of exports of final goods from
the southern Mediterranean countries to EU15. The relationship is robust to very detailed
controls for unobserved heterogeneity in the form of importer-exporter-product fixed ef-
fects as well as to controls for multilateral resistance and zero trade flows. Moreover it
is found that there is a positive and highly statistically significant relationship not only
between export intensity and being a part of the Pan-Euro-Med diagonal cumulation zone
but also between export intensity and the number of countries you can cumulate diago-
nally from. Thirdly, importing more intermediate inputs from countries one can cumulate
diagonally from in the Pan-Euro-Med zone is also found to be positively related to export
intensity. No robust statistically significant relationship can on the other hand be found
between the more liberal cumulation rules and export diversification.
5http://ec.europa.eu/trade/policy/countries-and-regions/regions/euro-mediterranean-partnership/
4
The paper is structured as follows. Section 2 describes previous research on trade effects
of ROO. Section 3 digs deeper into the complexity of ROO and explains what effects ROO
are likely to have on trade. Section 4 presents the empirical framework and the data
used while section 5 presents the results of the empirical estimations. Finally, section 6
concludes.
2 Literature review
A slowly growing literature on ROO has attempted to measure the restrictiveness of ROO
and their impact on trade. One strand of this literature has focused on measuring util-
isation of preferences of different FTAs and PTAs. To not utilise the preferences given
means that the costs of requesting preferential status are seen as higher than the benefit
of using the preferential tariff rate. Low utilisation rates, i.e. that a relatively large share
of exports within the preferential area pays the non-preferential tariff, is therefore often
claimed to be due to restrictive ROO.
Utilisation of preferences has been examined for example in the seminal paper by Herin
(1986) which shows that a surprisingly large share of exports from EFTA to the EC paid
the non-preferential tariff despite that they should have been able to enter the EC tariff
free. That strict rules of origin lead to an underutilisation of preferences has also been
suggested by, among others, Brenton and Manchin (2003), Brenton and Ikezuki (2006)
and Manchin (2006). Manchin (2006), for example, compares the utilisation of different
EU preferential schemes, Cotonou and GSP. It is shown that countries tend to request
Cotonou preferences over GSP preferences when exporting to the EU. Differences in ROO,
and especially differences in the possibilities for cumulation, is mentioned as a reason why
Cotonou preferences are preferred.
Besides looking at utilisation of preferences, previous papers have tried to measure the re-
strictiveness of ROO by constructing indices of restrictiveness based on cost-raising effects
of different types of ROO (Estevadeordal, 2000) or of facilitation based on mechanisms
that add flexibility to ROO, for example cumulation (Estevadeordal and Suominen, 2006).
The restrictiveness index has been used in regression analysis in for example Anson et al.
(2005) who find that restrictive ROO are negatively related to trade. The same authors
also calculate the average compliance costs of the NAFTA ROO to 6% in ad valorem
equivalent which is higher than the average tariff preference granted of 4%. That NAFTA
ROO risk negating much of the preferences given to final-good producers is a result that
is confirmed by Carrere and de Melo (2006). Estevadeordal and Suominen (2008) have
conducted a panel study where they estimate the trade effect of ROO of major prefer-
ential trade agreements. It is shown that restrictive ROO and high degrees of sectoral
selectivity in ROO have a negative impact on trade flows and that restrictive ROO create
trade diversion in intermediate inputs. However, exporters also tend to learn to comply
5
with strict ROO over time.
Sectoral studies and ROO is another branch of literature where the studies of Portugal-
Perez (2008) and Bureau et al. (2007) can be mentioned. They look at two sectors that
according to Estevadeordal and Suominen (2006) have relatively strict ROO: textiles and
apparel, and agriculture. Portugal-Perez (2008) studies the differences in EU and US
trade preferences for African apparel exporters. He finds a significant increase of apparel
exports to the US due to a ROO liberalisation which in practice meant that inputs could
be sourced from anywhere in the world.
Bureau et al. (2007) examine the agrifood sector and the utilisation of trade preferences
for developing countries. They find that utilisation is generally high except for the poorest
countries that tend to export small volumes. Interestingly it is found that ROO have a
minor role in explaining the small export flows from the poorest countries. Explanations
are instead found in the technical and sanitary standards required by developed countries
and private standards required by importers and retailers. It is further possible that
fragmentation of production is more important in the textile sector which makes access to
efficient producers more relevant in the textile sector than the agrifood sector. This result
shows the importance of taking sectoral differences into account when analysing ROO and
their effects on trade.
Work on ROO more closely related to the current paper is Augier et al. (2005), Gasiorek
et al. (2009) and Bombarda and Gamberoni (2013). These papers assess the trade impact
of the introduction of the PECS in 1997, i.e. before the inclusion of the southern Mediter-
ranean countries. Augier et al. (2005) provide empirical evidence that shows that switching
from bilateral to diagonal cumulation with the introduction of PECS had a positive effect
on trade between non-EU PECS participants. Gasiorek et al. (2009) confirm these results
also on a sector level. Bombarda and Gamberoni (2013) use a different methodology that
addresses zero trade flows and heterogeneous firms but still find a positive trade effect of
diagonal cumulation. Benassi et al. (2011) examine trade effects of the Barcelona process
on North African countries. In doing so they take the change of cumulation rules into
account and find a positive effect of diagonal cumulation on total trade.
By providing a first evidence of a positive trade effect of introducing the southern Mediter-
ranean countries into the European system of diagonal cumulation, Benassi et al. (2011)
highlight the importance of cross-border production sharing for these countries and open
up to further research on the issue. This paper extends the analysis in Benassi et al. (2011)
in several ways in an attempt to get a wider picture of the importance of efficient interme-
diate input sourcing. First, we specifically focus on effects of cumulation liberalisation on
trade in final goods and not effects on total trade. Second, we use a substantially larger
sample that includes the entire Pan-Euro-Med zone and all southern Mediterranean coun-
tries in the analysis. Lastly, different estimation strategies are used to examine the trade
effect of cumulation. We use a detailed fixed-effects specification that takes multilateral
6
resistance into account and control for zero trade flows. Differences in possibilities to use
the diagonal cumulation rules are also taken into consideration.
3 Rules of origin and their effects on trade
Preferential ROO are used as instruments to prevent trade deflection. Trade deflection
occurs when goods from non-FTA members are shipped through an FTA-member with
a low tariff to a member country with a higher tariff. It is hence a way to avoid paying
higher tariffs.6 ROO hinder trade deflection by making sure that only products originating
in countries eligible for trade preferences are given tariff cuts. Without ROO much of the
idea behind preferential market access would be lost. That being said ROO have at times
also been criticised of being unnecessarily strict and a way to export protection of high-cost
domestic industries through supply-switching effects (Krueger, 1993).
ROO determine origin using different criteria. Goods containing foreign intermediate in-
puts generally have to go through substantial transformation to achieve originating status.
The definition of substantial transformation can be more or less strict but often means
a change in tariff classification, that a certain percentage of value is added to the good,
that the good undergoes a specific production process or a combination of these. Com-
plementary rules used in combination with the requirement on substantial transformation
can make ROO less restrictive. One example of such a complementary rule is cumulation.
Cumulation rules allow producers to cumulate value, i.e. to use intermediate inputs, from
certain countries without losing originating status of the final good. Bilateral cumulation
is standard in most trade agreements and is applied between two FTA (or PTA) members.
The two partners can use originating intermediate inputs from each other as if they were
their own without affecting the originating status of the final good. Diagonal cumulation
means that countries tied together by the same preferential rules can use originating in-
termediate inputs from each other and maintain preferential access for the final good. Full
cumulation extends diagonal cumulation and allows countries in the same preferential area
to use intermediate inputs produced in the area whether they are classified as originating
or not.
In order to meet the ROO, producers tend to switch suppliers from outside the preferential
area to suppliers inside the area. This supply-switching leads to an extra element of trade
diversion. In the ordinary trade diversion case which occurs when preferential trade is in-
troduced, producers switch to partner country suppliers because it becomes cheaper when
preferential tariffs between partners are introduced. In the case of complying with ROO,
6Imagine for example, that a free trade agreement is signed between country A and B that makes it
possible to ship all goods tariff free between the two countries. Country C must however pay a tariff for
accessing the markets in both A and B. The tariff country C has to pay to country A is substantially
smaller than the tariff country C has to pay to country B. If the free trade agreement does not have ROO
it would be possible for country C to ship goods to country B through country A to reduce the tariffs paid.
7
producers switch to suppliers inside the preferential area even if it means switching to more
expensive suppliers. To restrict access to efficient suppliers increase production costs of
final-good producers and reduces the preferential area’s potential for welfare enhancing
trade creation.
The impact of ROO tend be larger in industries where cross-border production sharing is
important and for small countries lacking domestic suppliers. The trade distorting effects
of the ROO are however limited by the size of the non-preferential tariff. Producers can
always choose to disregard the ROO and pay the non-preferential tariff. In our case the
southern Mediterranean countries should generally benefit from the preferential access
since the there tends to be a clear difference between the preferential tariff rate and the
most favoured nation (MFN) tariff rate. The minimum value of preferences needed for
exporters to request preferences has been calculated to 4% by Manchin (2006). Tarrifs
on consumption goods tend to be higher than that. For example in 2007 Egypt faced an
average EU preferential tariff of 0.6% on consumer goods while the average MFN tariff was
6.43%.7 Taking an example from the apparel sector, the most important export sector in
the sample used for the empirical estimations, the differences between preferential tariffs
and MFN tariffs are even bigger. Apparel (HS sector 62) from Tunisia could for example
enter the EU tariff free in 2007 while the MFN tariff was more than 11%. Nilsson (2011)
has also shown that the southern Mediterranean countries are relatively good at using their
EU preferences, preference utilisation is about 90% for all trade flows from the southern
Mediterranean countries to the EU.
3.1 Trade effects of cumulation
Allowing for diagonal cumulation instead of standard bilateral cumulation means a liberal-
isation of the ROO. Producers are given a larger choice of suppliers which could reduce the
trade distorting effects of the ROO. Several trade effects are expected from more liberal
cumulation rules. The focus of this paper is on how export performance is affected when
intermediate goods become more easily available.
To be able to use intermediate inputs from more different foreign suppliers without affect-
ing the final good’s originating status potentially means better access to efficient suppliers
who produce cheaper inputs or inputs that were not previously available. Better access
to cheaper inputs thanks to more liberal cumulation rules reduces production costs and
makes final-good producers more competitive which in turn could make them expand their
foreign market shares.8 Existing exporters would then be able to export larger volumes
due to the introduction of diagonal cumulation.
In a Melitz (2003) style setting with heterogeneous firms and fixed export costs one can
7Tariff rates are gathered from the TRAINS database8Amiti and Konings (2007) have for example found a positive relationship between access to foreign
inputs and firm competitiveness through improvements in productivity.
8
think that cheaper inputs not only make it possible for existing exporters to export more
but also increase the probability of firms to enter the export market. If more efficient
input sourcing reduces firm marginal cost more firms could be able to afford the fixed
cost of exporting. This has previously been argued by Bas (2012) who also found a
positive relationship between input tariff reductions and firm export decisions. If more
firms become exporters it is further likely that the number of exported products increases.
Input trade liberalisation such as introduction of diagonal cumulation would then have a
positive effect on export diversification.
Moreover, as shown by Goldberg et al. (2010), input trade liberalisation can affect the
product scope of final-good producers which in turn would affect the potential to export
more different kinds of products. Product scope is affected both by cheaper inputs and
newly available inputs. Firms can start producing previously unprofitable products when
intermediate inputs become cheaper. Newly available intermediate inputs can also give
firms new opportunities to produce other products than before. According to Goldberg
et al. (2010) newly available inputs are more important than a lower input price for
expanding product scope. Thus, more liberal cumulation rules could affect both export
intensity, i.e. how much you export, and export diversification, i.e. how many products
you export.
Both export intensity and export diversification are, according to above reasoning, ex-
pected to be positively affected when the southern Mediterranean countries were intro-
duced into the European system of diagonal cumulation. Whether the effect on export
intensity or export diversification is most prevalent is mainly an empirical question. It
should however be noted that diagonal cumulation expands the set of available suppliers
but does not make the administrative burden of proving originating status lighter. This
could in turn mean that the effect of cumulation rule liberalisation can be expected to be
larger on export intensity than export diversification since fixed costs (such as administra-
tive costs) should be more important for how many products you export than how much
you export.
An alternative effect on the number of exported products of diagonal cumulation has been
mentioned by Bombarda and Gamberoni (2013). They show theoretically that diagonal
cumulation may have a negative impact on the number of exported products given certain
conditions. The main condition needed for this negative impact is to introduce diagonal
cumulation in a strict hub-and-spokes system. Since we do not consider a situation with
a strict hub-and-spokes system a negative impact on export diversification is here seen as
unlikely. You could see the EU as the ”hub” of the Pan-Euro-Med zone and the other
countries as ”spokes”. In a strict hub-and-spokes system the spokes are however not
connected by FTAs. Diagonal cumulation in the Pan-Euro-Med zone requires an FTA not
only between the exporter and importer of final-goods but also between the exporter and
importer of intermediate goods. The spokes are hence connected with FTAs as well which
disqualifies the Pan-Euro-Med zone as a strict hub-and-spokes system.
9
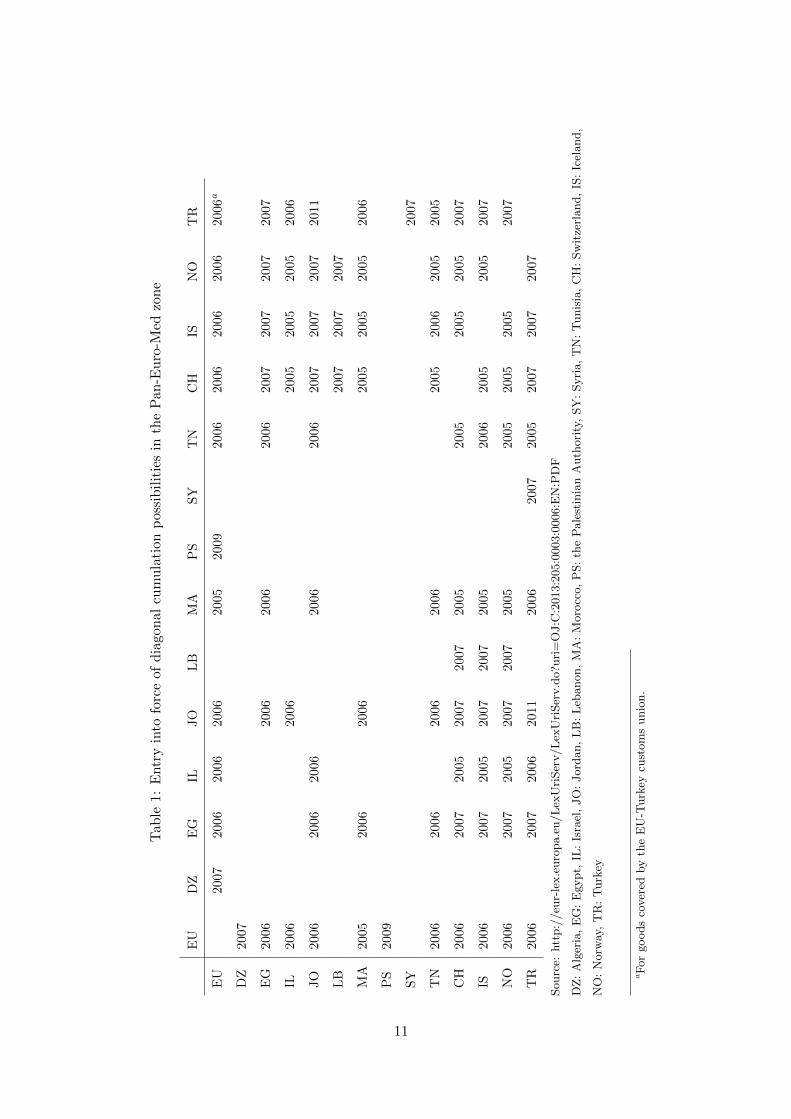
3.2 Cumulation in the Pan-Euro-Med zone
Diagonal cumulation was introduced at different points in time for different southern
Mediterranean countries but mainly during 2005-2007. Yet diagonal cumulation is not
possible between all countries in the Pan-Euro-Med zone since diagonal cumulation pos-
sibilities is based on what is called a variable geometry rule.9 Cumulation of originating
status is only possible between countries of an FTA with a Pan-Euro-Med origin protocol.
A country in the zone not linked to the others by such an FTA is therefore outside the
cumulation system. Syria and the Palestinian Authority are for example basically outside
the diagonal cumulation system while Lebanon only has diagonal cumulation possibilities
with the EFTA countries. Algeria, Morocco and Tunisia can on the other hand apply full
cumulation rules between themselves and the EU. This is a special rule that is outside the
PECS. In practice the variable geometry rule and the special full cumulation rule create
big differences in countries’ possibilities to cumulate value from each other. Diagonal cu-
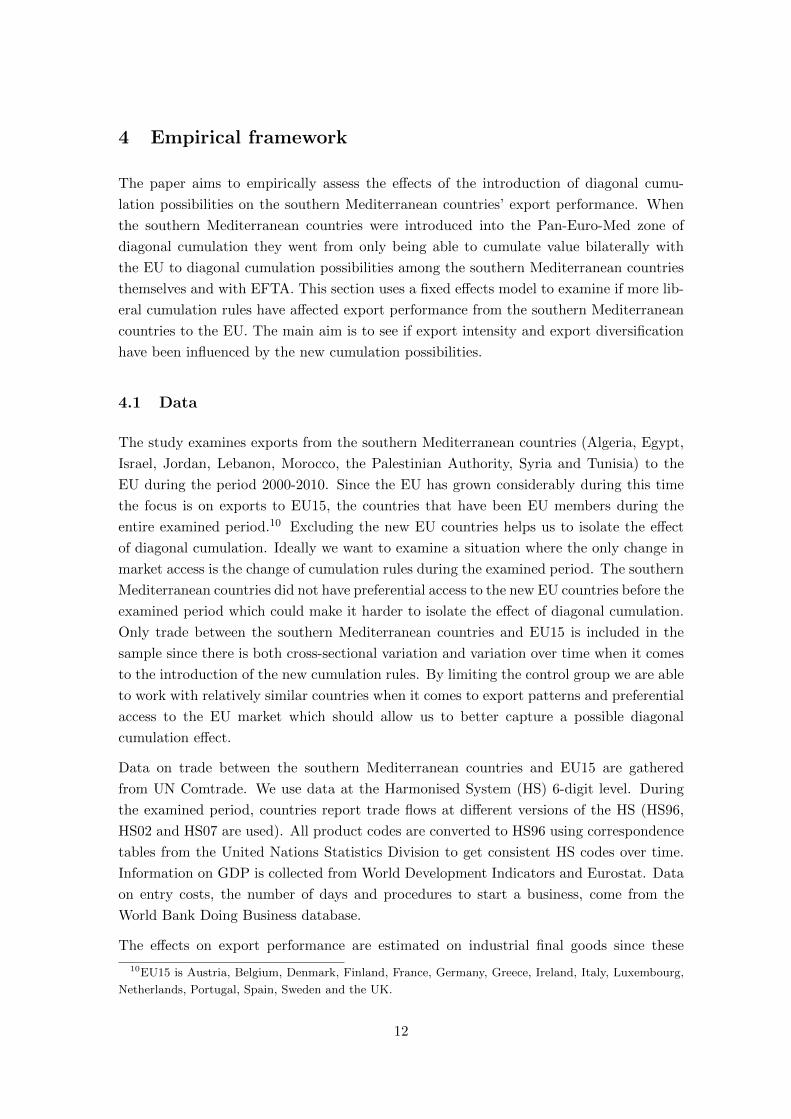
mulation benefits in the Pan-Euro-Med zone can be found in Table 1 below. Note that
the Faroe Islands and the participants in the EU’s stabilisation and association process
are excluded from the table since they do not have any diagonal cumulation possibilities
with the southern Mediterranean countries. The differences in cumulation possibilities
should be taken into account when estimating the effect of cumulation on exports to the
EU. To get an accurate picture of the effect of diagonal cumulation it is not enough to
only account for whether or not a certain southern Mediterranean country has diagonal
cumulation possibilities with the EU, you also have to see to what extent the cumulation
possibilities can be used.
9Countries included in the Pan-Euro-Med zone are: the EU, Switzerland, Iceland, Norway, Algeria,
Egypt, Israel, Jordan, Lebanon, Morocco, the Palestinian Authority, Syria, Tunisia, Turkey, The Faroe
Islands, Albania, Bosnia and Herzegovina, Kosovo, Montenegro, Macedonia and Serbia.
10
Tab
le1:
Entr
yin
tofo
rce
ofd
iago
nal
cum
ula
tion
pos
sib
ilit
ies
inth
eP
an-E
uro
-Med
zon
e
EU
DZ
EG
ILJO
LB
MA
PS
SY
TN
CH
ISN
OT
R
EU
2007
2006
2006
2006
2005
2009
2006
2006
2006
2006
2006a
DZ
2007
EG
2006
2006
2006
2006
2007
2007
2007
2007
IL20
0620
062005
2005
2005
2006
JO
2006
2006
2006
2006
2006
2007
2007
2007
2011
LB
2007
2007
2007
MA
2005
2006
2006
2005
2005
2005
2006
PS
2009
SY
2007
TN
2006
2006
2006
2006
2005
2006
2005
2005
CH
2006
2007
2005
2007
2007
2005
2005
2005
2005
2007
IS20
0620
0720
0520
072007
2005
2006
2005
2005
2007
NO
2006
2007
2005
2007
2007
2005
2005
2005
2005
2007
TR
2006
2007
2006
2011
2006
2007
2005
2007
2007
2007
Sourc
e:htt
p:/
/eu
r-le
x.e
uro
pa.e
u/L
exU
riSer
v/L
exU
riSer
v.d
o?u
ri=
OJ:C
:2013:2
05:0
003:0
006:E
N:P
DF
DZ
:A
lger
ia,
EG
:E
gypt,
IL:
Isra
el,
JO
:Jord
an,
LB
:L
ebanon,
MA
:M
oro
cco,
PS:
the
Pale
stin
ian
Auth
ori
ty,
SY
:Syri
a,
TN
:T
unis
ia,
CH
:Sw
itze
rland,
IS:
Icel
and,
NO
:N
orw
ay,
TR
:T
urk
ey
aF
or
goods
cover
edby
the
EU
-Turk
eycu
stom
sunio
n.
11
4 Empirical framework
The paper aims to empirically assess the effects of the introduction of diagonal cumu-
lation possibilities on the southern Mediterranean countries’ export performance. When
the southern Mediterranean countries were introduced into the Pan-Euro-Med zone of
diagonal cumulation they went from only being able to cumulate value bilaterally with
the EU to diagonal cumulation possibilities among the southern Mediterranean countries
themselves and with EFTA. This section uses a fixed effects model to examine if more lib-
eral cumulation rules have affected export performance from the southern Mediterranean
countries to the EU. The main aim is to see if export intensity and export diversification
have been influenced by the new cumulation possibilities.
4.1 Data
The study examines exports from the southern Mediterranean countries (Algeria, Egypt,
Israel, Jordan, Lebanon, Morocco, the Palestinian Authority, Syria and Tunisia) to the
EU during the period 2000-2010. Since the EU has grown considerably during this time
the focus is on exports to EU15, the countries that have been EU members during the
entire examined period.10 Excluding the new EU countries helps us to isolate the effect
of diagonal cumulation. Ideally we want to examine a situation where the only change in
market access is the change of cumulation rules during the examined period. The southern
Mediterranean countries did not have preferential access to the new EU countries before the
examined period which could make it harder to isolate the effect of diagonal cumulation.
Only trade between the southern Mediterranean countries and EU15 is included in the
sample since there is both cross-sectional variation and variation over time when it comes
to the introduction of the new cumulation rules. By limiting the control group we are able
to work with relatively similar countries when it comes to export patterns and preferential
access to the EU market which should allow us to better capture a possible diagonal
cumulation effect.
Data on trade between the southern Mediterranean countries and EU15 are gathered
from UN Comtrade. We use data at the Harmonised System (HS) 6-digit level. During
the examined period, countries report trade flows at different versions of the HS (HS96,
HS02 and HS07 are used). All product codes are converted to HS96 using correspondence
tables from the United Nations Statistics Division to get consistent HS codes over time.
Information on GDP is collected from World Development Indicators and Eurostat. Data
on entry costs, the number of days and procedures to start a business, come from the
World Bank Doing Business database.
The effects on export performance are estimated on industrial final goods since these
10EU15 is Austria, Belgium, Denmark, Finland, France, Germany, Greece, Ireland, Italy, Luxembourg,
Netherlands, Portugal, Spain, Sweden and the UK.
12
commodities are considered to be the most interesting ones when it comes to dependence on
access to intermediate inputs and cross-border production sharing. Agricultural products
are furthermore inappropriate to include in the analysis since many of them are excluded
from the Euro-Med agreements and are therefore not affected by preferential rules of origin.
Final goods are identified with the aid of the Broad Economic Categories (BEC) clas-
sification. This study considers goods that BEC classifies as consumption goods to be
final goods. The BEC categories 51, 522 and 6 are hence considered to be final goods.11
The BEC classifies goods according to their main end-use. There is hence no guarantee
that products classified as consumption goods are only used as consumption goods. Us-
ing a product classification scheme as the BEC to identify final and intermediate goods
is therefore not unproblematic since some goods can have multiple end-uses. However,
since no better data is available to classify goods according to their end-use, for example
firm-level data, the BEC classification is the best option in this case despite its limitations.
The BEC classification is also used to identify intermediate goods to construct one of the
independent variables, see below. BEC codes 2, and 53 are used to identify intermediate
goods used for production of consumption goods.12
4.2 Definition of variables of interest
Exports of final goods from the southern Mediterranean countries to EU15 are used to
construct the two dimensions of export performance investigated: export intensity and ex-
port diversification. Export intensity is here defined as the value of exported final goods.
This is a straightforward definition that does not need further explanation. For the def-
inition of export diversification we choose to follow Dennis and Shepherd (2011) among
others who define export diversification as an increase in the range of exported products.
An intuitive approach to measure export diversification is thus to count the number of
products exported.13 The number of exported products is here calculated in two ways.
The first measure, LINES, counts the number of exported 6-digit HS lines. The second
measure, LINES HS2, counts the number of exported 6-digit HS lines by each 2-digit
HS industry. Both measures are bilateral meaning that the first measure, LINES, gives
one observation for every importer-exporter-year triad. The second measure, LINES HS2,
gives one observation for every importer-exporter-industry-year group. The second mea-
sure is perhaps more interesting since it makes it possible to use more observations and
to control for sectoral fixed effects.
11Category 51 is passenger motor cars, category 522 is non-industrial transport equipment and category
6 is consumer goods not elsewhere specified.12Category 2 is industrial supplies not elsewhere specified, and category 53 is parts and accessories for
transport equipment.13Export diversification is commonly measured either as the number of products exported or as an
export specialisation or concentration index in the empirical literature. As Dennis and Shepherd (2011)
argues, the number of exported products is a more intuitive measure and more in line with the theoretical
explanation of the range of countries’ export bundles.
13
Independent variables of special interest are variables that should capture the differences in
diagonal cumulation possibilities between the southern Mediterranean countries. The first
variable used to capture diagonal cumulation possibilities is a dummy variable, CUM,
which takes the value 1 if the southern Mediterranean country in question has a trade
agreement with the EU that allows for diagonal cumulation in the Pan-Euro-Med zone
and zero otherwise. This variable is based on the information in row 1 in Table 1. The
second variable used to capture diagonal cumulation possibilities, CUM2, is a variable that
counts the number of non-EU countries a southern Mediterranean country can cumulate
diagonally from when the country in question has a trade agreement with the EU that
allows for diagonal cumulation in the Pan-Euro-Med zone. This variable is also based on
the information found in Table 1 but on a combination of the information on the southern
Mediterranean countries rather than only row 1. Since the effect on export performance of
diagonal cumulation should go through imports of intermediate goods from new suppliers
the third variable that tries to capture diagonal cumulation, CUM3, measures the value of
imported intermediate goods from non-EU countries in the Pan-Euro-Med zone with which
diagonal cumulation possibilities exists. Note that if no trade agreement with diagonal
cumulation possibilities exist between the southern Mediterranean country and the EU
both CUM2 and CUM3 take the value 0.
The first measure, CUM, is the most general one and tries to examine if having diagonal
cumulation possibilities at all has an effect on export performance. CUM2, on the other
hand, tries to take the differences between the Mediterranean countries’ possibilities to
take advantage of diagonal cumulation into account. Here, we try to see if being able
to cumulate diagonally from more countries in the Pan-Euro-Med zone affects export
performance. Lastly, CUM3, also tries to take different countries cumulation possibilities
into account but the focus is now on if it is possible to see a relationship between more
imported intermediate inputs from countries one can cumulate diagonally from and export
performance.
4.3 Model specification
The empirical estimations of the effect of more liberal cumulation rules on export intensity
and export diversification is based on a gravity model. Being founded in both traditional
and modern trade theory the gravity model has become immensely popular for analysing
bilateral trade flows.14 In order to control for unobserved heterogeneity and possible
endogeneity bias the main estimation strategy used is fixed effects. This means that many
of the traditional non-time varying gravity variables are dropped from the estimated model
since they are controlled for by the fixed effects.
14See Anderson (1979), Deardorff (1998), Feenstra (2002), Anderson and van Wincoop (2003) and Help-
man et al. (2008).
14
4.3.1 Export intensity
To estimate the effects of the introduction of diagonal cumulation possibilities on export
intensity, the following specification is used as the baseline specification:
lnXijkt =β0 + β1ln(GDPitGDPjt) + β2FTAit + β3CUMit + δijk + λt + εijkt (1)
where lnXijkt measures the value of exports of good k from country i to country j in
year t. GDPitGDPjt is the product of country i’s and country j’s GDPs in year t. The
product of GDPs is a proxy for economic mass and measures the trade potential between
two countries. A larger economic mass is expected to be associated with higher levels of
trade since larger economies can be expected to both have higher supply of and demand
for traded products. FTAit is a dummy variable that takes the value 1 if country i has an
association agreement with the EU in time t and zero otherwise. Even if the Mediterranean
countries have had preferential access to the EU market through PTAs since the 1970s the
association agreements of the Barcelona process took the economic partnership deeper.
The association agreements are progressively making trade preferences bilateral rather
than unilateral as a step on the way to a Euro-Mediterranean free trade area. As the
association agreements have deepened economic integration the FTA variable is expected
to have a positive effect on trade volumes.15 By controlling for the association agreements
the effect of the different trade policy changes (association agreements and cumulation
rules) are separated. CUMit is the main variable of interest in the baseline specification
and is the cumulation dummy variable described above that takes the value 1 if country i in
time t has a trade agreement with the EU that allows for diagonal cumulation in the Pan-
Euro-Med zone. The other cumulation variables, CUM2 and ln(CUM3+1), are later also
used as alternative ways to capture diagonal cumulation possibilities. Note that 1 is added
to CUM3 before the term is logged. This is done in order to avoid truncation. Lastly, δijk
and λt are exporter-importer-product fixed effects and time fixed effects respectively and
εijkt is a random error term.
As can be seen, the baseline specification misses many of the traditional gravity variables
that measure bilateral trade costs. This is because the inclusion of bilateral fixed effects
controls for all non-time varying bilateral characteristics such as bilateral distance or a
common colonial past. The inclusion of the bilateral fixed effect is here important since it is
likely that unobservable factors are correlated with the regressors. Some of this unobserved
heterogeneity can further influence the likelihood of implementing trade policies such as
cumulation rule changes. Trade policy has traditionally been treated as an exogenous
variable but it is hard to argue that that actually is the case. Trade policy changes require
an active political decision and countries only implement liberalising trade policy they
believe will increase welfare through trade creation effects. Baier and Bergstrand (2007)
15Association agreements were implemented before the change in cumulation rules. Some were imple-
mented already in the 1990s while others in the beginning of the 2000s. See appendix for the implementation
dates of the association agreements.
15
argue that unobserved heterogeneity, for example in the form of domestic policy-related
barriers, is associated with the likelihood of implementing trade policy.
The bilateral fixed effect helps us to come to terms with this source of endogeneity since
it controls for unobserved heterogeneity among country pairs. The main option to adjust
for endogeneity of trade policy is to find a suitable instrument for the trade policy in
question that is not correlated with trade flows. Since no such suitable instrument is
available in this case we choose to follow the recommendation of Baier and Bergstrand
(2007) and introduce bilateral fixed effects to refine our model specification. Since the data
set used contains information on product level, a further refinement of the fixed effects
can be done. Instead of only introducing exporter-importer fixed effects, we will introduce
exporter-importer-product fixed effects. These detailed controls make it possible to focus
on within exporter-importer-product variation since all time-invariant exporter-importer-
product characteristics are held constant. Time fixed effects are also introduced to control
for time specific events.
As highlighted by Anderson and van Wincoop (2003), bilateral trade does not only depend
on bilateral trade barriers but also on barriers to the rest of the world, or the multilateral
resistance. We will therefore estimate an alternative specification that includes multilateral
resistance controls. In practice multilateral resistance is controlled for by importer-and-
time and exporter-and-time fixed effects when using panel data.16 Exporter-and-time fixed
effects are unfortunately not suitable to use in this case since they would wipe out our
variables of interest, the cumulation variables, that are time-varying exporter specific vari-
ables. We therefore choose to construct three terms as in Baier and Bergstrand (2009) to
capture multilateral resistance. The terms constructed are MRDISTijt, MRLANGijt and
MRCOLONYijt and they control for trade costs between the importer and the exporter
relative to both countries’ trade barriers to other partners over time. The multilateral
resistance terms are calculated as follows:
MRTCijt =
M∑m=1
θmtTCim +
M∑m′=1
θm′tTCjm′ −M∑
m=1
M∑m′=1
θmtθm′tTCmm′ (2)
where m and m′ are country indices and θmt is country m’s share in world GDP. TC
stands for trade costs and is the log of bilateral distance or dummy variables for common
language and a common colonial past.
The alternative specification to be estimated which includes the multilateral resistance
terms then becomes:
lnXijkt =β0 + β1ln(GDPitGDPjt) + β2FTAit + β3CUMit + β4MRDISTijt+
β5MRLANGijt + β6MRCOLONYijt + δijk + λt + εijkt (3)
16Anderson and van Wincoop (2003) originally derived price indices to account for multilateral resistance.
These are however computationally difficult to estimate which means that the inclusion of fixed effects is
usually preferred in practice.
16
where all variables are defined as above.
If zero trade flows are present in the sample used the above model specifications may result
in biased estimates. The main problem is that the dependent variable is logged which
makes all the possible zero trade flows undefined. All zero trade flows would therefore be
dropped from the estimations which could create selection problems. Zero trade flows are
common in reality and become increasingly frequent when more disaggregated data are
used. To use data on the 6-digit HS level as is done here results in a relatively large share
of zero trade flows. Taking into account all the industrial final goods at the 6-digit HS96-
level that have the potential to be traded between the southern Mediterranean countries
and EU15, the sample consists of 88.5% zeros.
To address the zero trade flows in the sample we use a Heckman two-step selection
model adjusted to panel data that controls for unobserved heterogeneity as described
in Wooldridge (2008). In short the panel Heckman method entails first estimating sepa-
rate selection probit equations for each year which predict the probability to export and
second estimating the intensity of exports given that exports actually takes place. Cor-
recting for bias due to unobserved heterogeneity when estimating the probit equations is
done by introducing the Mundlak-Chamberlain device, i.e. by adding group means of all
time-varying explanatory variables to the existing set of explanatory variables, to avoid
the incidental parameters problem.17 The selection variable used to capture selection into
trade is a bilateral binary variable that measures entry costs in the export and import
country. If entry costs, measured as the sum of the number of days and procedures to
start a business, are greater than the median for both the exporter and importer the se-
lection variable equals 1, otherwise it takes the value zero. As previously highlighted by
Helpman et al. (2008) entry costs reflect regulatory fixed costs. These costs are likely to be
related to the choice of exporting or not but unlikely to be related to export volumes. The
entry cost variable therefore satisfies the exclusion restriction in the two-step Heckman
model. When testing if entry costs actually are a suitable selection variable for the data
used here it is found that they indeed affect selection into trade but not export intensity.
4.3.2 Export diversification
We measure export diversification as the number of exported products per country. The
dependent variable hence consists of non-negative count data. Using a linear model as
above would therefore be inappropriate for estimating export diversification. We will
instead opt for a Poisson model since it, unlike a linear model, takes into account that the
dependent variable can take on only non-negative integer values. We will assume that the
17Including standard fixed effects in a probit model yields biased estimates due to the incidental param-
eters problem.
17
expected value of Yijt given zijt is:
E(Yijt|zijt) = exp(z′ijtβ) (4)
where Yijt is the number of exported products from country i to country j at time t and
z′ijt is a vector of explanatory variables. As described above, we use two different ways to
count the number of exported products, LINESijt and LINES HS2ijst. LINESijt counts
the number of exported 6-digit HS lines from country i to country j in times t while
LINES HS2ijst counts the number of exported 6-digit lines by each 2-digit industry.
The number of traded products and the trade value are generally expected to be affected
by the same set of variables. The selection of explanatory variables is therefore again
based on the gravity model but, as above, all bilateral non-time varying variables are con-
trolled for by using a fixed effects specification to come to terms with possible unobserved
heterogeneity and endogeneity issues. The following two models will be estimated:
LINESijt = exp(β0 + β1ln(GDPitGDPjt) + β2FTAit + β3CUMit + δij + λt + εijt) (5)
LINES HS2ijst = exp(β0 + β1ln(GDPitGDPjt) + β2FTAit + β3CUMit + δijs + λt + εijst)
(6)
where all variables are defined as above except for the bilateral fixed effect. In equation 5
the bilateral effect δij is a simple importer-exporter fixed effect since the definition of the
dependent variable does not allow for any product or sector controls. LINES HS2ijst has
a sector dimension which makes it possible to control for sector-specific characteristics,
δijs in equations 6 is hence an importer-exporter-sector fixed effect. As above the product
of GDPs, FTA and diagonal cumulation are expected to have a positive relationship to
export diversification. Multilateral resistance is expected to influence export diversification
as well as export intensity. The multilateral resistance terms MRDISTijt, MRLANGijt
and MRCOLONYijt, are included in z′ijtβ in alternative specifications of both equation 5
and equation 6.
4.4 Descriptive statistics
The dataset used for the estimations on export intensity contains 138,181 observations.
Note that only positive trade flows are considered here since the baseline estimations for
export intensity exclude zero trade flows.18 When the focus of the estimations is export
diversification the number of observations is naturally reduced to 1,485 when LINESijt
is the dependent variable and to 80,190 when LINES HS2ijst is the dependent variable.
Table 2 shows descriptive statistics of the variables used.
18If zero trade are included the number of observations reaches 1,208,049.
18
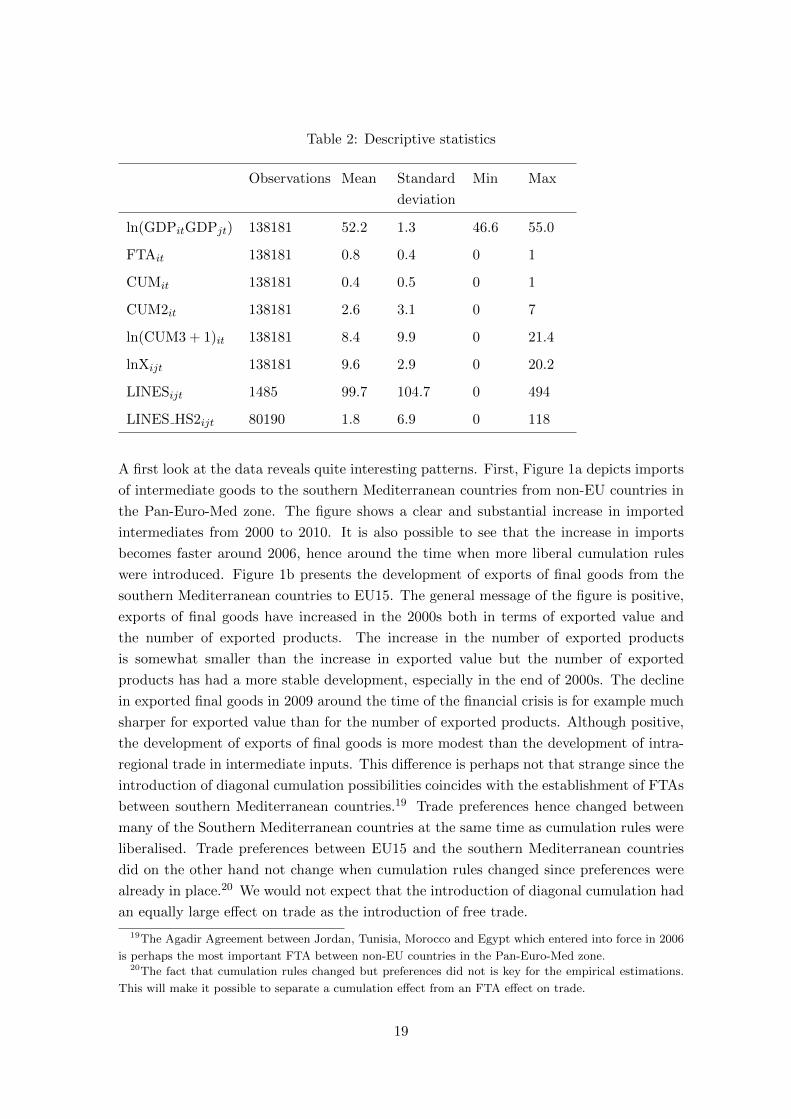
Table 2: Descriptive statistics
Observations Mean Standard
deviation
Min Max
ln(GDPitGDPjt) 138181 52.2 1.3 46.6 55.0
FTAit 138181 0.8 0.4 0 1
CUMit 138181 0.4 0.5 0 1
CUM2it 138181 2.6 3.1 0 7
ln(CUM3 + 1)it 138181 8.4 9.9 0 21.4
lnXijt 138181 9.6 2.9 0 20.2
LINESijt 1485 99.7 104.7 0 494
LINES HS2ijt 80190 1.8 6.9 0 118
A first look at the data reveals quite interesting patterns. First, Figure 1a depicts imports
of intermediate goods to the southern Mediterranean countries from non-EU countries in
the Pan-Euro-Med zone. The figure shows a clear and substantial increase in imported
intermediates from 2000 to 2010. It is also possible to see that the increase in imports
becomes faster around 2006, hence around the time when more liberal cumulation rules
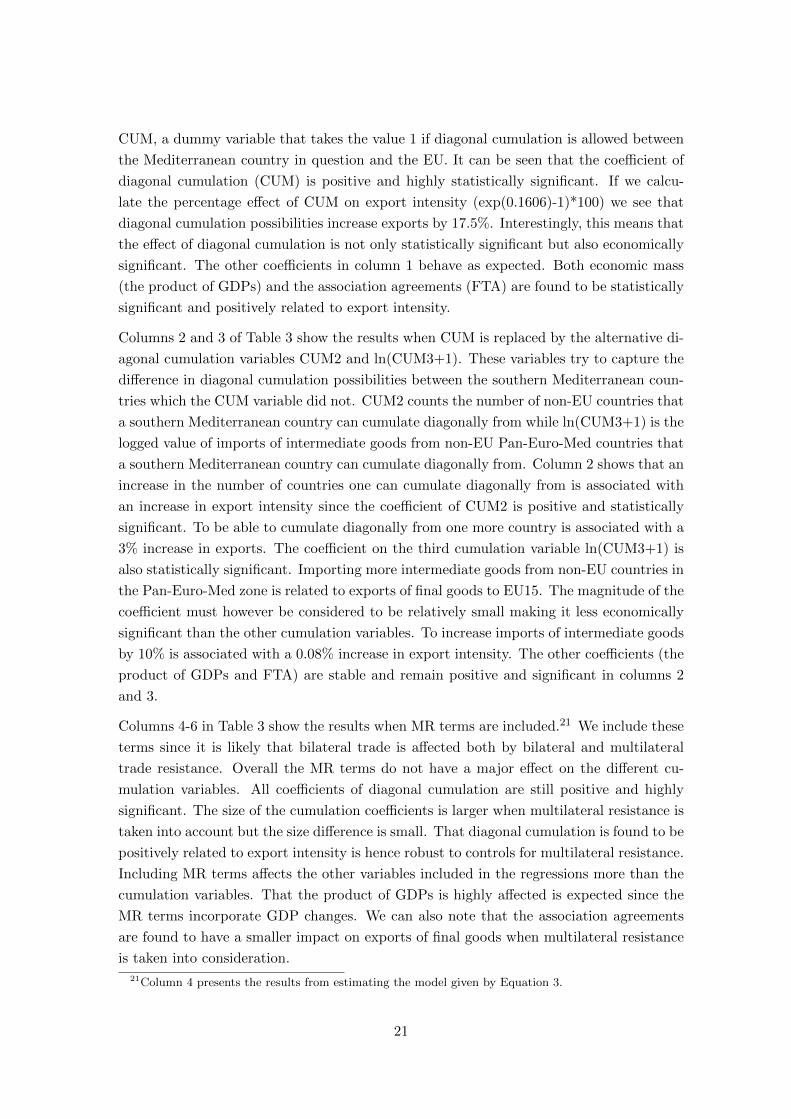
were introduced. Figure 1b presents the development of exports of final goods from the
southern Mediterranean countries to EU15. The general message of the figure is positive,
exports of final goods have increased in the 2000s both in terms of exported value and
the number of exported products. The increase in the number of exported products
is somewhat smaller than the increase in exported value but the number of exported
products has had a more stable development, especially in the end of 2000s. The decline
in exported final goods in 2009 around the time of the financial crisis is for example much
sharper for exported value than for the number of exported products. Although positive,
the development of exports of final goods is more modest than the development of intra-
regional trade in intermediate inputs. This difference is perhaps not that strange since the
introduction of diagonal cumulation possibilities coincides with the establishment of FTAs
between southern Mediterranean countries.19 Trade preferences hence changed between
many of the Southern Mediterranean countries at the same time as cumulation rules were
liberalised. Trade preferences between EU15 and the southern Mediterranean countries
did on the other hand not change when cumulation rules changed since preferences were
already in place.20 We would not expect that the introduction of diagonal cumulation had
an equally large effect on trade as the introduction of free trade.
19The Agadir Agreement between Jordan, Tunisia, Morocco and Egypt which entered into force in 2006
is perhaps the most important FTA between non-EU countries in the Pan-Euro-Med zone.20The fact that cumulation rules changed but preferences did not is key for the empirical estimations.
This will make it possible to separate a cumulation effect from an FTA effect on trade.
19
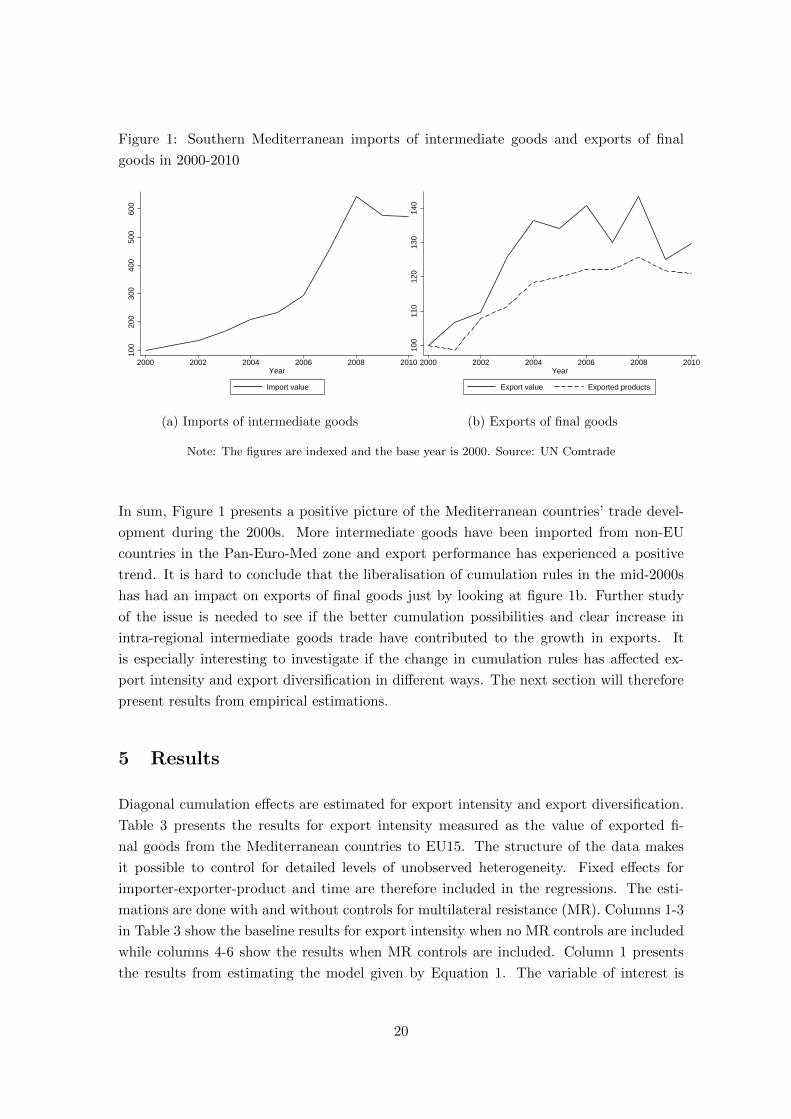
Figure 1: Southern Mediterranean imports of intermediate goods and exports of final
goods in 2000-2010
100
200
300
400
500
600
2000 2002 2004 2006 2008 2010Year
Import value
(a) Imports of intermediate goods10
011
012
013
014
0
2000 2002 2004 2006 2008 2010Year
Export value Exported products
(b) Exports of final goods
Note: The figures are indexed and the base year is 2000. Source: UN Comtrade
In sum, Figure 1 presents a positive picture of the Mediterranean countries’ trade devel-
opment during the 2000s. More intermediate goods have been imported from non-EU
countries in the Pan-Euro-Med zone and export performance has experienced a positive
trend. It is hard to conclude that the liberalisation of cumulation rules in the mid-2000s
has had an impact on exports of final goods just by looking at figure 1b. Further study
of the issue is needed to see if the better cumulation possibilities and clear increase in
intra-regional intermediate goods trade have contributed to the growth in exports. It
is especially interesting to investigate if the change in cumulation rules has affected ex-
port intensity and export diversification in different ways. The next section will therefore
present results from empirical estimations.
5 Results
Diagonal cumulation effects are estimated for export intensity and export diversification.
Table 3 presents the results for export intensity measured as the value of exported fi-
nal goods from the Mediterranean countries to EU15. The structure of the data makes
it possible to control for detailed levels of unobserved heterogeneity. Fixed effects for
importer-exporter-product and time are therefore included in the regressions. The esti-
mations are done with and without controls for multilateral resistance (MR). Columns 1-3
in Table 3 show the baseline results for export intensity when no MR controls are included
while columns 4-6 show the results when MR controls are included. Column 1 presents
the results from estimating the model given by Equation 1. The variable of interest is
20
CUM, a dummy variable that takes the value 1 if diagonal cumulation is allowed between
the Mediterranean country in question and the EU. It can be seen that the coefficient of
diagonal cumulation (CUM) is positive and highly statistically significant. If we calcu-
late the percentage effect of CUM on export intensity (exp(0.1606)-1)*100) we see that
diagonal cumulation possibilities increase exports by 17.5%. Interestingly, this means that
the effect of diagonal cumulation is not only statistically significant but also economically
significant. The other coefficients in column 1 behave as expected. Both economic mass
(the product of GDPs) and the association agreements (FTA) are found to be statistically
significant and positively related to export intensity.
Columns 2 and 3 of Table 3 show the results when CUM is replaced by the alternative di-
agonal cumulation variables CUM2 and ln(CUM3+1). These variables try to capture the
difference in diagonal cumulation possibilities between the southern Mediterranean coun-
tries which the CUM variable did not. CUM2 counts the number of non-EU countries that
a southern Mediterranean country can cumulate diagonally from while ln(CUM3+1) is the
logged value of imports of intermediate goods from non-EU Pan-Euro-Med countries that
a southern Mediterranean country can cumulate diagonally from. Column 2 shows that an
increase in the number of countries one can cumulate diagonally from is associated with
an increase in export intensity since the coefficient of CUM2 is positive and statistically
significant. To be able to cumulate diagonally from one more country is associated with a
3% increase in exports. The coefficient on the third cumulation variable ln(CUM3+1) is
also statistically significant. Importing more intermediate goods from non-EU countries in
the Pan-Euro-Med zone is related to exports of final goods to EU15. The magnitude of the
coefficient must however be considered to be relatively small making it less economically
significant than the other cumulation variables. To increase imports of intermediate goods
by 10% is associated with a 0.08% increase in export intensity. The other coefficients (the
product of GDPs and FTA) are stable and remain positive and significant in columns 2
and 3.
Columns 4-6 in Table 3 show the results when MR terms are included.21 We include these
terms since it is likely that bilateral trade is affected both by bilateral and multilateral
trade resistance. Overall the MR terms do not have a major effect on the different cu-
mulation variables. All coefficients of diagonal cumulation are still positive and highly
significant. The size of the cumulation coefficients is larger when multilateral resistance is
taken into account but the size difference is small. That diagonal cumulation is found to be
positively related to export intensity is hence robust to controls for multilateral resistance.
Including MR terms affects the other variables included in the regressions more than the
cumulation variables. That the product of GDPs is highly affected is expected since the
MR terms incorporate GDP changes. We can also note that the association agreements
are found to have a smaller impact on exports of final goods when multilateral resistance
is taken into consideration.
21Column 4 presents the results from estimating the model given by Equation 3.
21
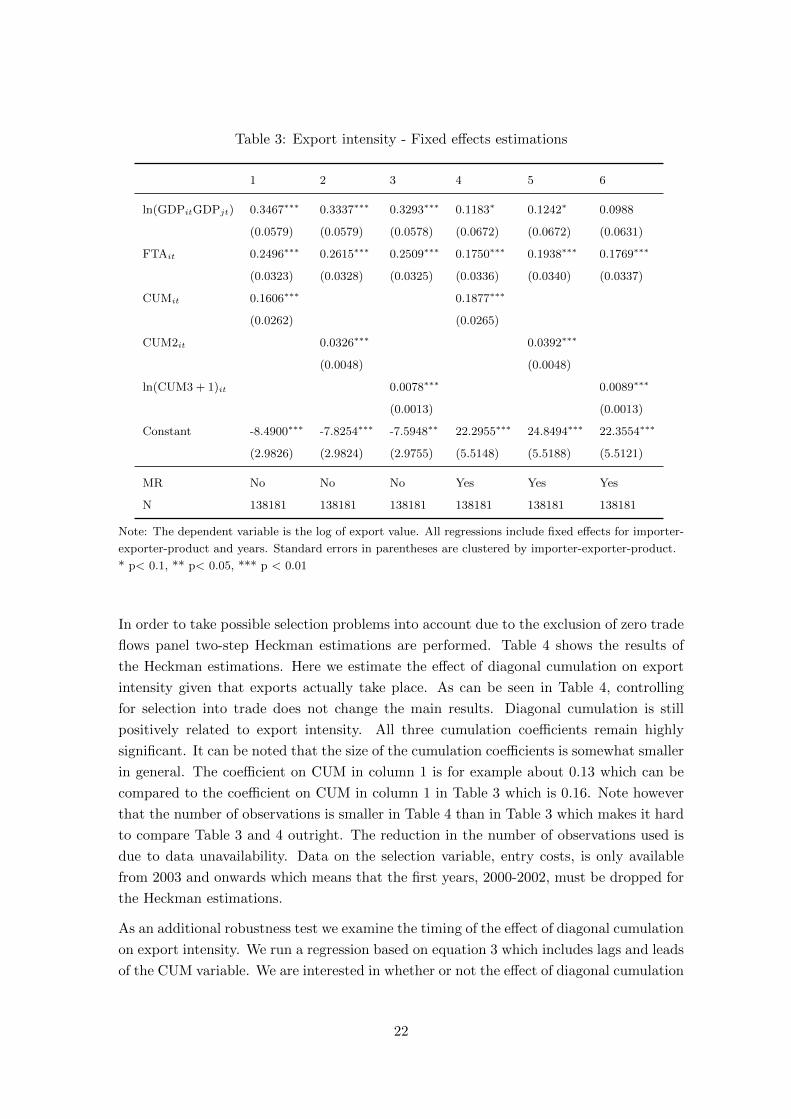
Table 3: Export intensity - Fixed effects estimations
1 2 3 4 5 6
ln(GDPitGDPjt) 0.3467∗∗∗ 0.3337∗∗∗ 0.3293∗∗∗ 0.1183∗ 0.1242∗ 0.0988
(0.0579) (0.0579) (0.0578) (0.0672) (0.0672) (0.0631)
FTAit 0.2496∗∗∗ 0.2615∗∗∗ 0.2509∗∗∗ 0.1750∗∗∗ 0.1938∗∗∗ 0.1769∗∗∗
(0.0323) (0.0328) (0.0325) (0.0336) (0.0340) (0.0337)
CUMit 0.1606∗∗∗ 0.1877∗∗∗
(0.0262) (0.0265)
CUM2it 0.0326∗∗∗ 0.0392∗∗∗
(0.0048) (0.0048)
ln(CUM3 + 1)it 0.0078∗∗∗ 0.0089∗∗∗
(0.0013) (0.0013)
Constant -8.4900∗∗∗ -7.8254∗∗∗ -7.5948∗∗ 22.2955∗∗∗ 24.8494∗∗∗ 22.3554∗∗∗
(2.9826) (2.9824) (2.9755) (5.5148) (5.5188) (5.5121)
MR No No No Yes Yes Yes
N 138181 138181 138181 138181 138181 138181
Note: The dependent variable is the log of export value. All regressions include fixed effects for importer-
exporter-product and years. Standard errors in parentheses are clustered by importer-exporter-product.
* p< 0.1, ** p< 0.05, *** p < 0.01
In order to take possible selection problems into account due to the exclusion of zero trade
flows panel two-step Heckman estimations are performed. Table 4 shows the results of
the Heckman estimations. Here we estimate the effect of diagonal cumulation on export
intensity given that exports actually take place. As can be seen in Table 4, controlling
for selection into trade does not change the main results. Diagonal cumulation is still
positively related to export intensity. All three cumulation coefficients remain highly
significant. It can be noted that the size of the cumulation coefficients is somewhat smaller
in general. The coefficient on CUM in column 1 is for example about 0.13 which can be
compared to the coefficient on CUM in column 1 in Table 3 which is 0.16. Note however
that the number of observations is smaller in Table 4 than in Table 3 which makes it hard
to compare Table 3 and 4 outright. The reduction in the number of observations used is
due to data unavailability. Data on the selection variable, entry costs, is only available
from 2003 and onwards which means that the first years, 2000-2002, must be dropped for
the Heckman estimations.
As an additional robustness test we examine the timing of the effect of diagonal cumulation
on export intensity. We run a regression based on equation 3 which includes lags and leads
of the CUM variable. We are interested in whether or not the effect of diagonal cumulation
22
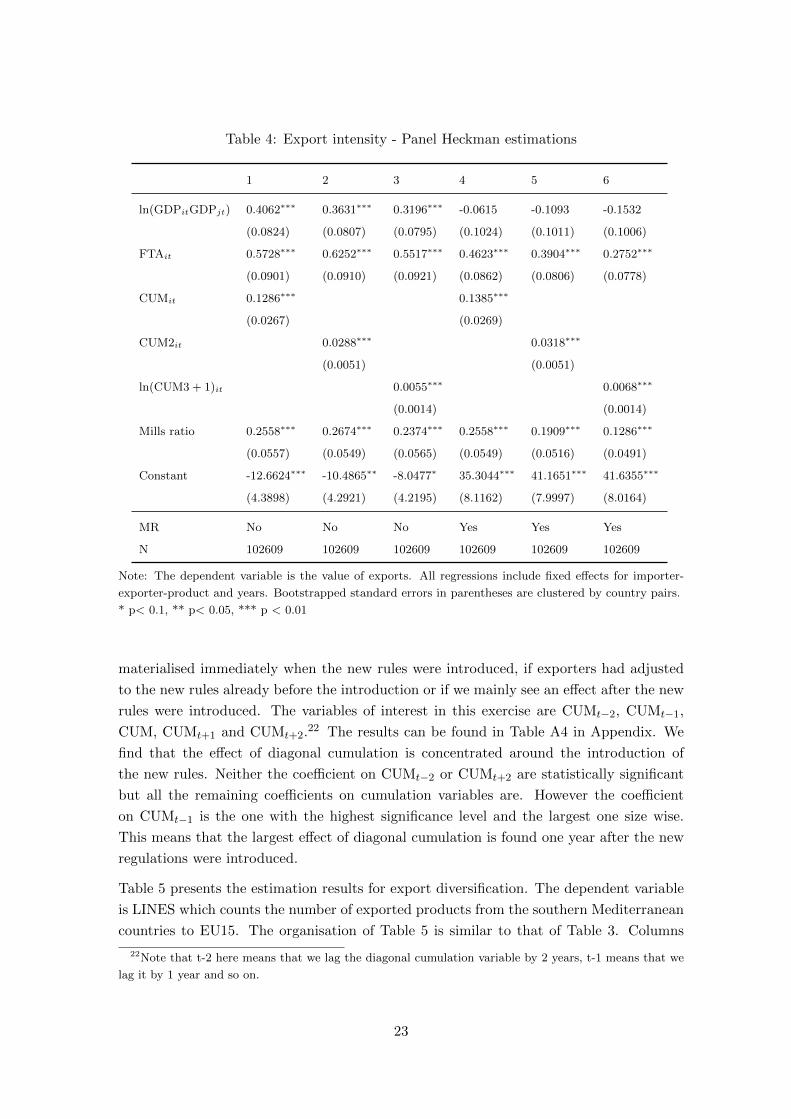
Table 4: Export intensity - Panel Heckman estimations
1 2 3 4 5 6
ln(GDPitGDPjt) 0.4062∗∗∗ 0.3631∗∗∗ 0.3196∗∗∗ -0.0615 -0.1093 -0.1532
(0.0824) (0.0807) (0.0795) (0.1024) (0.1011) (0.1006)
FTAit 0.5728∗∗∗ 0.6252∗∗∗ 0.5517∗∗∗ 0.4623∗∗∗ 0.3904∗∗∗ 0.2752∗∗∗
(0.0901) (0.0910) (0.0921) (0.0862) (0.0806) (0.0778)
CUMit 0.1286∗∗∗ 0.1385∗∗∗
(0.0267) (0.0269)
CUM2it 0.0288∗∗∗ 0.0318∗∗∗
(0.0051) (0.0051)
ln(CUM3 + 1)it 0.0055∗∗∗ 0.0068∗∗∗
(0.0014) (0.0014)
Mills ratio 0.2558∗∗∗ 0.2674∗∗∗ 0.2374∗∗∗ 0.2558∗∗∗ 0.1909∗∗∗ 0.1286∗∗∗
(0.0557) (0.0549) (0.0565) (0.0549) (0.0516) (0.0491)
Constant -12.6624∗∗∗ -10.4865∗∗ -8.0477∗ 35.3044∗∗∗ 41.1651∗∗∗ 41.6355∗∗∗
(4.3898) (4.2921) (4.2195) (8.1162) (7.9997) (8.0164)
MR No No No Yes Yes Yes
N 102609 102609 102609 102609 102609 102609
Note: The dependent variable is the value of exports. All regressions include fixed effects for importer-
exporter-product and years. Bootstrapped standard errors in parentheses are clustered by country pairs.
* p< 0.1, ** p< 0.05, *** p < 0.01
materialised immediately when the new rules were introduced, if exporters had adjusted
to the new rules already before the introduction or if we mainly see an effect after the new
rules were introduced. The variables of interest in this exercise are CUMt−2, CUMt−1,
CUM, CUMt+1 and CUMt+2.22 The results can be found in Table A4 in Appendix. We
find that the effect of diagonal cumulation is concentrated around the introduction of
the new rules. Neither the coefficient on CUMt−2 or CUMt+2 are statistically significant
but all the remaining coefficients on cumulation variables are. However the coefficient
on CUMt−1 is the one with the highest significance level and the largest one size wise.
This means that the largest effect of diagonal cumulation is found one year after the new
regulations were introduced.
Table 5 presents the estimation results for export diversification. The dependent variable
is LINES which counts the number of exported products from the southern Mediterranean
countries to EU15. The organisation of Table 5 is similar to that of Table 3. Columns
22Note that t-2 here means that we lag the diagonal cumulation variable by 2 years, t-1 means that we
lag it by 1 year and so on.
23
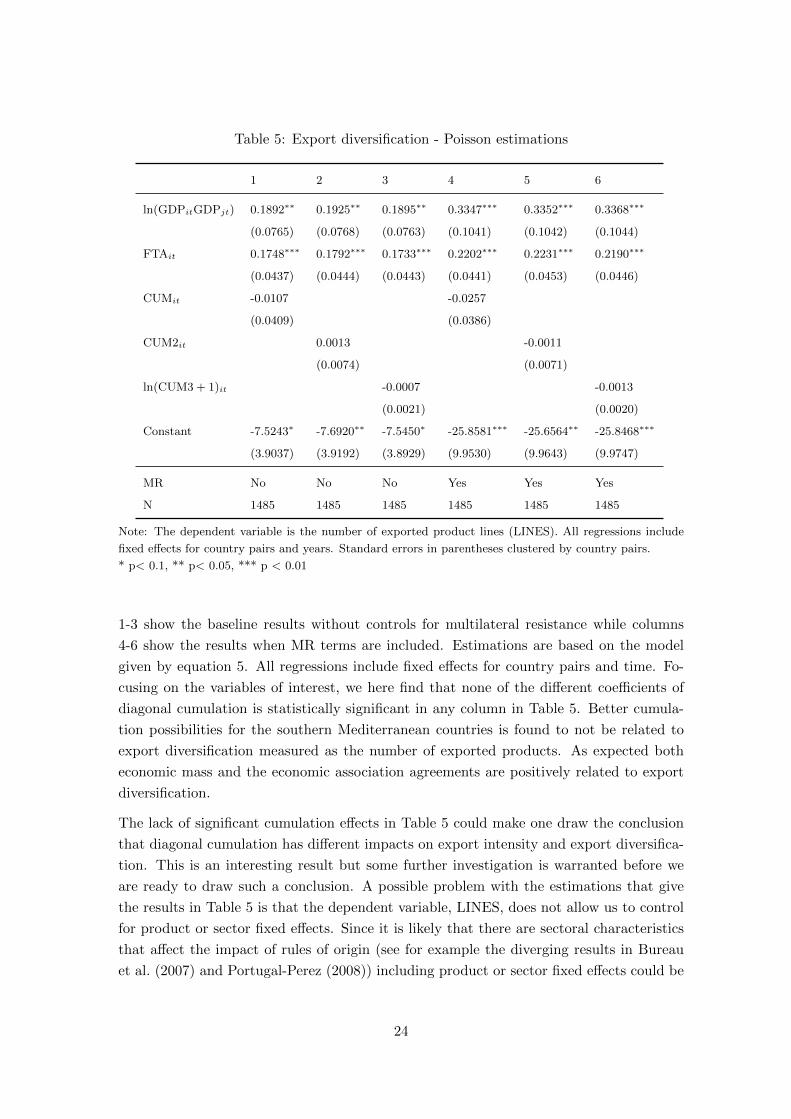
Table 5: Export diversification - Poisson estimations
1 2 3 4 5 6
ln(GDPitGDPjt) 0.1892∗∗ 0.1925∗∗ 0.1895∗∗ 0.3347∗∗∗ 0.3352∗∗∗ 0.3368∗∗∗
(0.0765) (0.0768) (0.0763) (0.1041) (0.1042) (0.1044)
FTAit 0.1748∗∗∗ 0.1792∗∗∗ 0.1733∗∗∗ 0.2202∗∗∗ 0.2231∗∗∗ 0.2190∗∗∗
(0.0437) (0.0444) (0.0443) (0.0441) (0.0453) (0.0446)
CUMit -0.0107 -0.0257
(0.0409) (0.0386)
CUM2it 0.0013 -0.0011
(0.0074) (0.0071)
ln(CUM3 + 1)it -0.0007 -0.0013
(0.0021) (0.0020)
Constant -7.5243∗ -7.6920∗∗ -7.5450∗ -25.8581∗∗∗ -25.6564∗∗ -25.8468∗∗∗
(3.9037) (3.9192) (3.8929) (9.9530) (9.9643) (9.9747)
MR No No No Yes Yes Yes
N 1485 1485 1485 1485 1485 1485
Note: The dependent variable is the number of exported product lines (LINES). All regressions include
fixed effects for country pairs and years. Standard errors in parentheses clustered by country pairs.
* p< 0.1, ** p< 0.05, *** p < 0.01
1-3 show the baseline results without controls for multilateral resistance while columns
4-6 show the results when MR terms are included. Estimations are based on the model
given by equation 5. All regressions include fixed effects for country pairs and time. Fo-
cusing on the variables of interest, we here find that none of the different coefficients of
diagonal cumulation is statistically significant in any column in Table 5. Better cumula-
tion possibilities for the southern Mediterranean countries is found to not be related to
export diversification measured as the number of exported products. As expected both
economic mass and the economic association agreements are positively related to export
diversification.
The lack of significant cumulation effects in Table 5 could make one draw the conclusion
that diagonal cumulation has different impacts on export intensity and export diversifica-
tion. This is an interesting result but some further investigation is warranted before we
are ready to draw such a conclusion. A possible problem with the estimations that give
the results in Table 5 is that the dependent variable, LINES, does not allow us to control
for product or sector fixed effects. Since it is likely that there are sectoral characteristics
that affect the impact of rules of origin (see for example the diverging results in Bureau
et al. (2007) and Portugal-Perez (2008)) including product or sector fixed effects could be
24
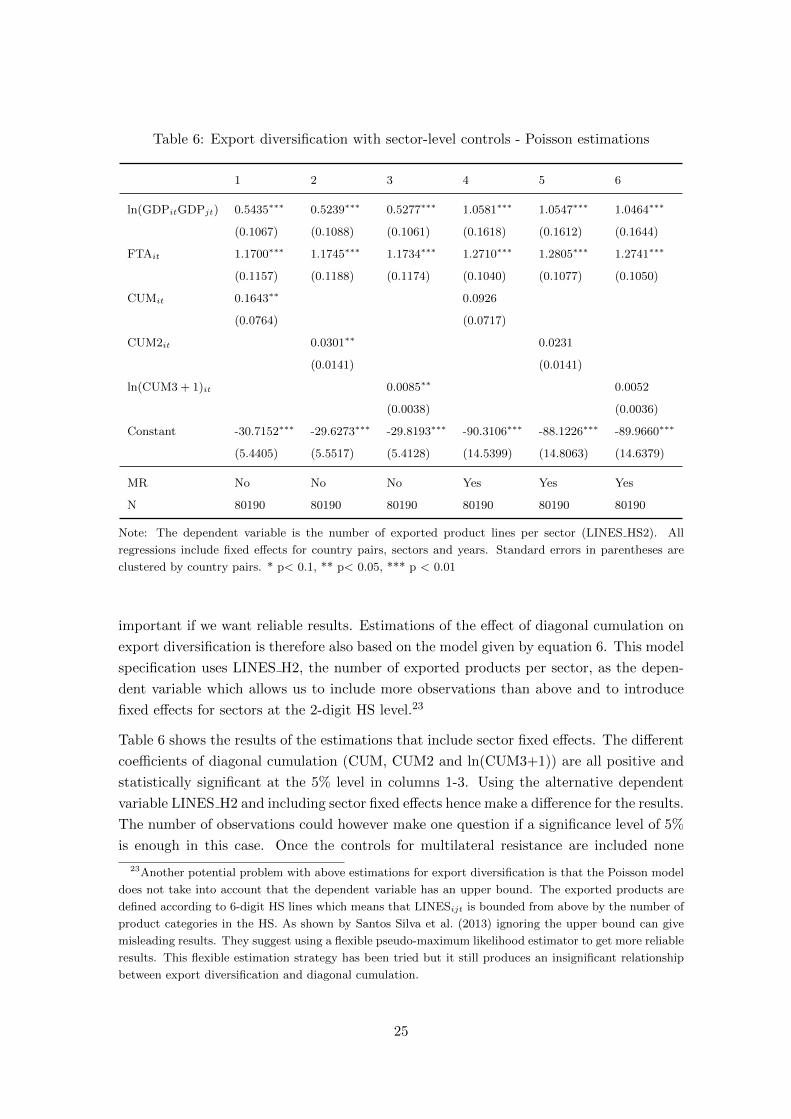
Table 6: Export diversification with sector-level controls - Poisson estimations
1 2 3 4 5 6
ln(GDPitGDPjt) 0.5435∗∗∗ 0.5239∗∗∗ 0.5277∗∗∗ 1.0581∗∗∗ 1.0547∗∗∗ 1.0464∗∗∗
(0.1067) (0.1088) (0.1061) (0.1618) (0.1612) (0.1644)
FTAit 1.1700∗∗∗ 1.1745∗∗∗ 1.1734∗∗∗ 1.2710∗∗∗ 1.2805∗∗∗ 1.2741∗∗∗
(0.1157) (0.1188) (0.1174) (0.1040) (0.1077) (0.1050)
CUMit 0.1643∗∗ 0.0926
(0.0764) (0.0717)
CUM2it 0.0301∗∗ 0.0231
(0.0141) (0.0141)
ln(CUM3 + 1)it 0.0085∗∗ 0.0052
(0.0038) (0.0036)
Constant -30.7152∗∗∗ -29.6273∗∗∗ -29.8193∗∗∗ -90.3106∗∗∗ -88.1226∗∗∗ -89.9660∗∗∗
(5.4405) (5.5517) (5.4128) (14.5399) (14.8063) (14.6379)
MR No No No Yes Yes Yes
N 80190 80190 80190 80190 80190 80190
Note: The dependent variable is the number of exported product lines per sector (LINES HS2). All
regressions include fixed effects for country pairs, sectors and years. Standard errors in parentheses are
clustered by country pairs. * p< 0.1, ** p< 0.05, *** p < 0.01
important if we want reliable results. Estimations of the effect of diagonal cumulation on
export diversification is therefore also based on the model given by equation 6. This model
specification uses LINES H2, the number of exported products per sector, as the depen-
dent variable which allows us to include more observations than above and to introduce
fixed effects for sectors at the 2-digit HS level.23
Table 6 shows the results of the estimations that include sector fixed effects. The different
coefficients of diagonal cumulation (CUM, CUM2 and ln(CUM3+1)) are all positive and
statistically significant at the 5% level in columns 1-3. Using the alternative dependent
variable LINES H2 and including sector fixed effects hence make a difference for the results.
The number of observations could however make one question if a significance level of 5%
is enough in this case. Once the controls for multilateral resistance are included none
23Another potential problem with above estimations for export diversification is that the Poisson model
does not take into account that the dependent variable has an upper bound. The exported products are
defined according to 6-digit HS lines which means that LINESijt is bounded from above by the number of
product categories in the HS. As shown by Santos Silva et al. (2013) ignoring the upper bound can give
misleading results. They suggest using a flexible pseudo-maximum likelihood estimator to get more reliable
results. This flexible estimation strategy has been tried but it still produces an insignificant relationship
between export diversification and diagonal cumulation.
25
of the cumulation coefficients remain significant, see columns 4-6. This means that it is
hard to say that there is a robust positive relationship between export diversification and
diagonal cumulation possibilities. There are nonetheless indications of such a relationship
when sectoral characteristics are taken into consideration.
6 Conclusion
This paper has investigated how exports of final goods are affected by the access to inter-
mediate inputs. The main aim has been to empirically test if expanding the set of available
suppliers through the introduction of diagonal cumulation affect i) export intensity mea-
sured as the value of exports of final goods, and ii) export diversification measured as the
number of exported final goods.
To examine the relationship between diagonal cumulation and export performance we
took advantage of the recent introduction of the southern Mediterranean countries into
the Pan-Euro-Med zone of diagonal cumulation. We found that introducing diagonal
cumulation possibilities for the southern Mediterranean countries has had a positive effect
on how much final goods they export to EU15. To be a part of the Pan-Euro-Med zone of
diagonal cumulation increases southern Mediterranean exports of final goods to EU15 by
about 17%. There is hence a positive relationship between export intensity and expanding
the set of available suppliers through an introduction of diagonal cumulation rules. We also
found that an increase in the number of countries you can cumulate value diagonally from
and that an increase in imports of intermediate goods from countries you can cumulate
diagonally from in the Pan-Euro-Med zone have positive effects on export intensity.
A relationship between diagonal cumulation possibilities and export diversification, i.e.
the number of exported products, was on the other hand harder to find. That there is
a difference between the effects of diagonal cumulation on export intensity and export
diversification may have several reasons. First, as a positive and significant effect is found
on export intensity there appears to be an effect on production costs when the set of
available suppliers is expanded due to a liberalisation of cumulation rules. When cheaper
suppliers become available production costs are reduced which boosts export volumes.
This effect on production costs may however not be large enough for non-exporting firms
to be able to afford the fixed costs of exporting.
Second, the lack of an effect on export diversification may be related to the level of
differentiation of the exported products. As Chaney (2008) argues, effects of trade barriers
are related to the elasticity of substitution of the traded goods. The impact of trade
barriers is expected to be large (small) on the intensive (extensive) margin for goods with
high elasticity of substitution. A reduction of trade barriers, such as liberalisation of
cumulation rules, makes new less productive firms enter the export market. The lower
productivity is however an important drawback when consumers easily substitute from
26
one good to another meaning that the new firms only are able to capture a small share of
the market. The effect on trade of these new firms will therefore be small. If the southern
Mediterranean countries mainly trade relatively homogeneous products, i.e. products
with a high elasticity of substitution, we would expect to find an effect of trade policy
changes on export intensity rather than export diversification. According to the Rauch
(1999) definition of differentiated and homogeneous goods the sample used here consists
almost solely of differentiated goods. Looking closer at what type of goods that are
important export goods for the southern Mediterranean countries we however find that
these goods tend to be simpler low-technological content goods such as textiles that are
easy to substitute even if they are defined as differentiated. This could help us understand
why we found an effect on export intensity but not on export diversification.
Third, export diversification is likely to be more reliant on access to new types or varieties
of intermediate inputs than export intensity. As mentioned above, expanding product
scope has been found to mainly be related to newly available inputs instead of cheaper
inputs (Goldberg et al., 2010). If the newly available suppliers produce similar products
as the old suppliers, diagonal cumulation will not lead to an increase in the number of
available intermediate inputs. One possible explanation to why export intensity but not
export diversification is found to be positively related to diagonal cumulation is then that
the newly available non-EU suppliers in the Pan-Euro-Med zone are not different enough
from the old suppliers. The effect on product scope could therefore be limited which in
turn would mean that the possibility to export new products is reduced. Since we do
not have access to firm-level production data we are unfortunately not able to further
examine the relationship between a liberalisation of cumulation rules and product scope.
This would be interesting to investigate in future research.
Lastly, it may take more time for the effect on export diversification to materialise. Even if
access to cheaper inputs or new inputs make it profitable for firms to export new products
there are still sunk costs related to exporting such as finding buyers or perhaps adjusting
products to local tastes. This is a process that is likely to take some time. The effect on
export diversification may therefore need to be re-examined with a longer panel.
References
Amiti, M. and Konings, J. (2007). Trade liberalisation, intermediate inputs, and produc-
tivity: Evidence from Indonesia. American Economic Review, 97(5):1611–1638.
Anderson, J. E. (1979). A theoretical foundation for the gravity model. The American
Economic Review, 69(1):106–116.
Anderson, J. E. and van Wincoop, E. (2003). Gravity with gravitas: A solution to the
border puzzle. The American Economic Review, 93(1):170–192.
27
Anson, J., Cadot, O., Estevadeordal, A., de Melo, J., Suwa-Eisenmann, A., and Tu-
murchudur, B. (2005). Rules of origin in North-South preferential trading arrangements
with an application to NAFTA. Review of International Economics, 13(3):501–517.
Augier, P., Gasiorek, M., Lai Tong, C., Martin, P., and Prat, A. (2005). The impact of
rules of origin on trade flows. Economic Policy, 20(43):567+569–624.
Baier, S. L. and Bergstrand, J. H. (2007). Do free trade agreements actually increase
members’ international trade? Journal of International Economics, 71(1):72–95.
Baier, S. L. and Bergstrand, J. H. (2009). Bonus vetus OLS: A simple method for approx-
imating international trade-cost effects using the gravity equation. Journal of Interna-
tional Economics, 77(1):77–85.
Bas, M. (2012). Input-trade liberalisation and firm export decisions. Evidence from Ar-
gentina. Journal of Development Economics, 97:481–493.
Benassi, S., Marquez-Ramos, L., and Martınez-Zarazoso, I. (2011). Economic integration
and the two margins of trade: The impact of the Barcelona process on North African
countries’ exports. Journal of African Economics, 21(2):228–265.
Bombarda, P. and Gamberoni, E. (2013). Firm heterogeneity, rules of origin and rules of
cumulation. International Economic Review, 54(1):307–328.
Brenton, P., Baroncelli, E., and Malouche, M. (2006). Trade and investment integration
of the Maghreb. Middle East and North Africa Working Paper Series 44. The World
Bank.
Brenton, P. and Ikezuki, T. (2006). The value of trade preferences for Africa. In Newfarmer,
R., editor, Trade, Doha and Development: A window into the issues, pages 223–229.
The World Bank, Washington D.C.
Brenton, P. and Manchin, M. (2003). Making EU trade agreements work: The role of
rules of origin. The World Economy, 26(5):755–769.
Bureau, J.-C., Chakir, R., and Gallezot, J. (2007). The utilisation of trade preferences
for developing countries in the agri-food sector. Journal of Agricultural Economics,
58(2):175–198.
Carrere, C. and de Melo, J. (2006). Are different rules of origin equally costly? estimates
from NAFTA. In Cadot, O., Estevadeordal, A., Suwa-Eisenmann, A., and Verdier,
T., editors, The origin of goods: Rules of origin in regional trade agreements. Oxford
University Press, Oxford.
Chaney, T. (2008). Distorted gravity: the intensive and extensive margins of international
trade. American Economic Review, 98(4):1707–1721.
Chevassus-Lozza, E., Gaigne, C., and Le Mener, L. (2013). Does input trade liberal-
28
ization boost downstream firms’ exports? Theory and firm-level evidence. Journal of
International Economics, 90:391–402.
Deardorff, A. (1998). Detrminants of bilateral trade: Does gravity work in a neoclassical
world? In Frankel, Jeffrey, A., editor, The Regionalisation of the World Economy, pages
7–32. University of Chicago Press, Chicago.
Dennis, A. and Shepherd, B. (2011). Trade facilitation and export diversification. The
World Economy, 34(1):101–122.
Estevadeordal, A. (2000). Negotiating preferential access: The case of the North American
Free Trade Agreement. Journal of World Trade, 34:141–166.
Estevadeordal, A. and Suominen, K. (2006). Mapping and measuring rules of origin
around the world. In Cadot, O., Estevadeordal, A., Suwa-Eisenmann, A., and Verdier,
T., editors, The origin of goods: Rules of origin in regional trade agreements. Oxford
University Press, Oxford.
Estevadeordal, A. and Suominen, K. (2008). What are the trade effects of rules of origin.
In Estevadeordal, A. and Suominen, K., editors, Gatekeepers of global commerce: Rules
of origin and international economic integration. Inter-American Development Bank,
Washington D.C.
Feenstra, R. C. (2002). Border effects and the gravity equation: Consistent methods for
estimation. Scotish Journal of Political Economy, 49(5):491–506.
Gasiorek, M., Augier, P., and Lai-Tong, C. (2009). Multilateralizing regionalism: lessons
from teh eu experience in relaxing rules of origin. In Low, P. and Baldwin, R., editors,
Multilateralizing regionalism: Challenges for the global trading system, pages 146–181.
Cambridge University Press, Cambridge.
Goldberg, P. K., Khandewal, A. K., Pavcnik, N., and Topalova, P. (2010). Imported
intermediate inputs and domestic product growth: Evidence from India. The Quarterly
Journal of Economics, 125(4):1727–1767.
Helpman, E., Melitz, M., and Rubinstein, Y. (2008). Estimating trade flows: Trading
partners and trading volumes. The Quarterly Journal of Economics, 123(2):441–487.
Herin, J. (1986). Rules of origin and differences between tariff levels in EFTA and in the
EC. Occasional Paper 13. EFTA.
Krueger, A. O. (1993). Free trade agreements as protectionist devices: Rules of origin.
NBER Working Paper Series 4352. NBER.
Manchin, M. (2006). Preference utilisation and tariff reduction in EU imports from ACP
countries. The World Economy, 29(9):1243–1266.
29
Melitz, M. J. (2003). The impact of trade on intra-industry reallocations and aggregate
industry productivity. Econometrica, 71(6):1695–1725.
Nilsson, L. (2011). Small trade flows and preference utilisation: the case of the European
Union. South African Jornal of Economics, 79(4):392–410.
Portugal-Perez, A. (2008). The costs of rules of origin in apparel: African preferential
exports to the United States and the European Union. Policy Issues in International
Trade and Commodities Study Series 39. UNCTAD.
Rauch, J. E. (1999). Networks versus markets in international trade. Journal of Interna-
tional Economics, 48:7–35.
Santos Silva, J., Tenreyro, S., and Wei, K. (2013). Estimating the exten-
sive margin of trade. Journal of International Economics, available online, in
press(http://dx.doi.org/10.1016/j.jinteco.2013.12.001).
Wooldridge, J. M. (2008). Econometric analysis of cross section and panel data. MIT
Press, 2nd edition.
http://eur-lex.europa.eu/LexUriServ/LexUriServ.do?uri=OJ:C:2013:205:0003:0006:EN:PDF
2014-05-28
http://ec.europa.eu/trade/policy/countries-and-regions/regions/euro-
mediterranean-partnership/ 2014-05-28
30
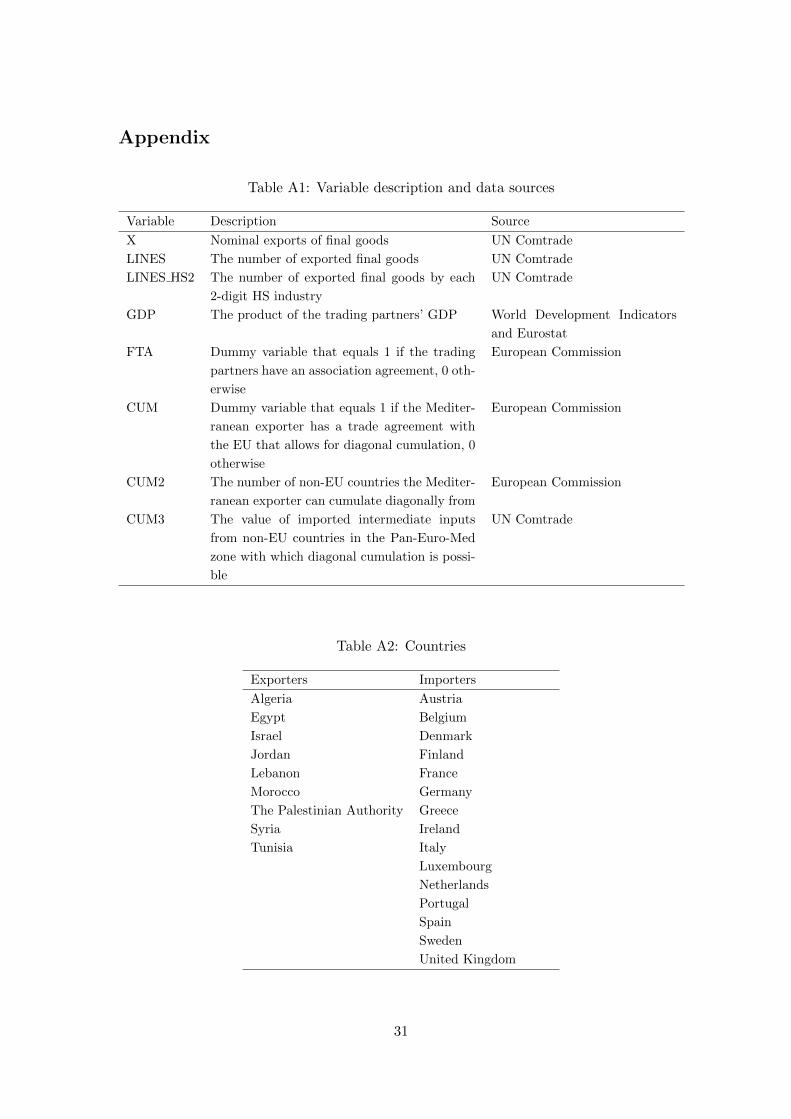
Appendix
Table A1: Variable description and data sources
Variable Description Source
X Nominal exports of final goods UN Comtrade
LINES The number of exported final goods UN Comtrade
LINES HS2 The number of exported final goods by each
2-digit HS industry
UN Comtrade
GDP The product of the trading partners’ GDP World Development Indicators
and Eurostat
FTA Dummy variable that equals 1 if the trading
partners have an association agreement, 0 oth-
erwise
European Commission
CUM Dummy variable that equals 1 if the Mediter-
ranean exporter has a trade agreement with
the EU that allows for diagonal cumulation, 0
otherwise
European Commission
CUM2 The number of non-EU countries the Mediter-
ranean exporter can cumulate diagonally from
European Commission
CUM3 The value of imported intermediate inputs
from non-EU countries in the Pan-Euro-Med
zone with which diagonal cumulation is possi-
ble
UN Comtrade
Table A2: Countries
Exporters Importers
Algeria Austria
Egypt Belgium
Israel Denmark
Jordan Finland
Lebanon France
Morocco Germany
The Palestinian Authority Greece
Syria Ireland
Tunisia Italy
Luxembourg
Netherlands
Portugal
Spain
Sweden
United Kingdom
31
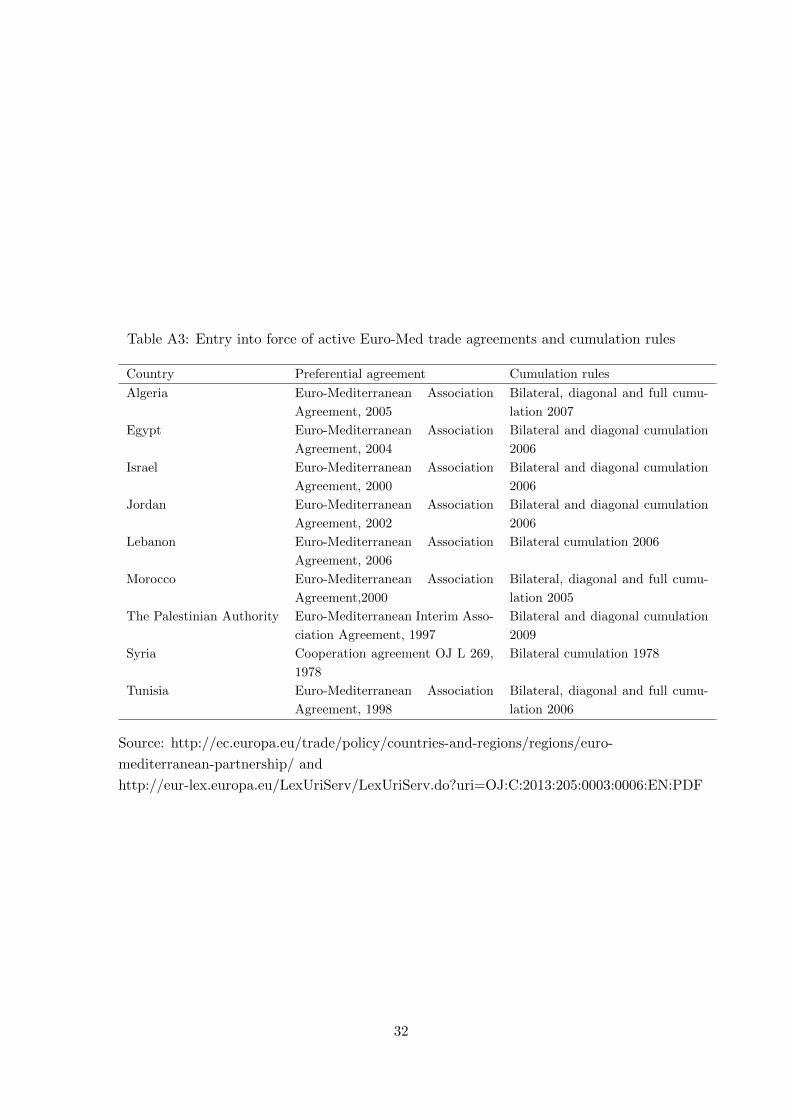
Table A3: Entry into force of active Euro-Med trade agreements and cumulation rules
Country Preferential agreement Cumulation rules
Algeria Euro-Mediterranean Association
Agreement, 2005
Bilateral, diagonal and full cumu-
lation 2007
Egypt Euro-Mediterranean Association
Agreement, 2004
Bilateral and diagonal cumulation
2006
Israel Euro-Mediterranean Association
Agreement, 2000
Bilateral and diagonal cumulation
2006
Jordan Euro-Mediterranean Association
Agreement, 2002
Bilateral and diagonal cumulation
2006
Lebanon Euro-Mediterranean Association
Agreement, 2006
Bilateral cumulation 2006
Morocco Euro-Mediterranean Association
Agreement,2000
Bilateral, diagonal and full cumu-
lation 2005
The Palestinian Authority Euro-Mediterranean Interim Asso-
ciation Agreement, 1997
Bilateral and diagonal cumulation
2009
Syria Cooperation agreement OJ L 269,
1978
Bilateral cumulation 1978
Tunisia Euro-Mediterranean Association
Agreement, 1998
Bilateral, diagonal and full cumu-
lation 2006
Source: http://ec.europa.eu/trade/policy/countries-and-regions/regions/euro-
mediterranean-partnership/ and
http://eur-lex.europa.eu/LexUriServ/LexUriServ.do?uri=OJ:C:2013:205:0003:0006:EN:PDF
32
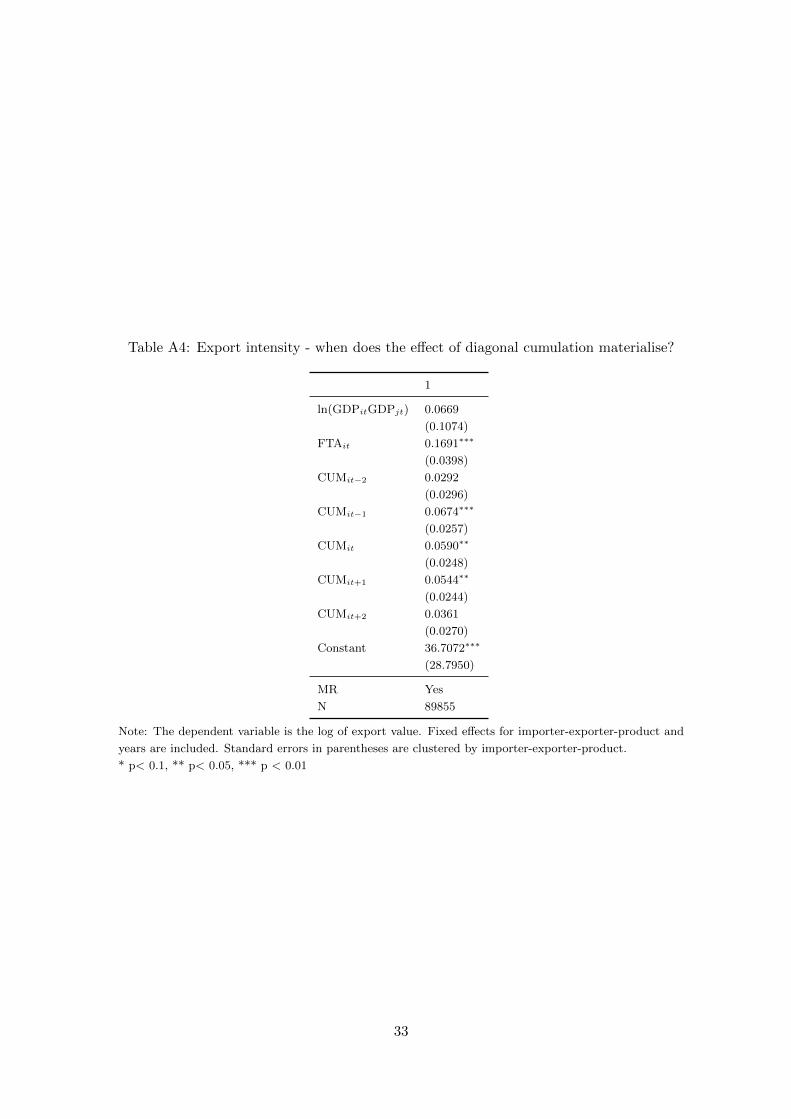
Table A4: Export intensity - when does the effect of diagonal cumulation materialise?
1
ln(GDPitGDPjt) 0.0669
(0.1074)
FTAit 0.1691∗∗∗
(0.0398)
CUMit−2 0.0292
(0.0296)
CUMit−1 0.0674∗∗∗
(0.0257)
CUMit 0.0590∗∗
(0.0248)
CUMit+1 0.0544∗∗
(0.0244)
CUMit+2 0.0361
(0.0270)
Constant 36.7072∗∗∗
(28.7950)
MR Yes
N 89855
Note: The dependent variable is the log of export value. Fixed effects for importer-exporter-product and
years are included. Standard errors in parentheses are clustered by importer-exporter-product.
* p< 0.1, ** p< 0.05, *** p < 0.01
33