Experimental Investigation of Laser Welding Process in...
14
World Journal of Engineering and Technology, 2017, 5, 77-89 http://www.scirp.org/journal/wjet ISSN Online: 2331-4249 ISSN Print: 2331-4222 DOI: 10.4236/wjet.2017.51007 February 22, 2017 Experimental Investigation of Laser Welding Process in Butt-Joint Configurations Laurent Jacques, Abderrazak El Ouafi Engineering Department, University of Quebec at Rimouski, Rimouski, Canada Abstract This paper presents an experimental investigation of laser welding low carbon galvanized steel in butt-joint configurations. The experimental work is fo- cused on the effects of various laser welding parameters on the welds quality. The investigations are based on a structured experimental design using the Taguchi method. Welding experiments are conducted using a 3 kW Nd:YAG laser source. The selected laser welding parameters (laser power, welding speed, laser fiber diameter, gap between sheets and sheet thickness) are com- bined and used to evaluate the variation of four weld quality attributes (bead width, penetration depth, underfill and hardness) and to identify the possible relationship between welding parameters and weld physical and geometrical attributes. The effects of these parameters are studied using ANOVA to find their contributions to the variation of different weld characteristics. Plots of the main effects and the interaction effects are also used to understand the in- fluence of the welding parameters. The results reveal that all welding parame- ters are relevant to bead width (BDW) and depth of penetration (DOP) with a relative predominance of laser power and welding speed. The effect of laser fiber diameter on penetration depth is insignificant. Typical gap-dependent weld shapes show that a small gap results in a narrower and deeper weld. Due to the standard sheared edge, an underfill between 5% and 10% occurs for no-gap experiments. The resulting hardness values are relatively similar for all the experimental tests. Keywords Laser Welding, Nd:YAG, Low Carbon Galvanized Steel, Taguchi Method, Butt-Joint 1. Introduction Laser welding is used in the automotive industry for welding bodies with up to How to cite this paper: Jacques, L. and El Ouafi, A. (2017) Experimental Investiga- tion of Laser Welding Process in Butt-Joint Configurations. World Journal of Engi- neering and Technology, 5, 77-89. https://doi.org/10.4236/wjet.2017.51007 Received: November 30, 2016 Accepted: February 19, 2017 Published: February 22, 2017 Copyright © 2017 by authors and Scientific Research Publishing Inc. This work is licensed under the Creative Commons Attribution International License (CC BY 4.0). http://creativecommons.org/licenses/by/4.0/ Open Access
Transcript of Experimental Investigation of Laser Welding Process in...

World Journal of Engineering and Technology, 2017, 5, 77-89 http://www.scirp.org/journal/wjet
ISSN Online: 2331-4249 ISSN Print: 2331-4222
DOI: 10.4236/wjet.2017.51007 February 22, 2017
Experimental Investigation of Laser Welding Process in Butt-Joint Configurations
Laurent Jacques, Abderrazak El Ouafi
Engineering Department, University of Quebec at Rimouski, Rimouski, Canada
Abstract This paper presents an experimental investigation of laser welding low carbon galvanized steel in butt-joint configurations. The experimental work is fo-cused on the effects of various laser welding parameters on the welds quality. The investigations are based on a structured experimental design using the Taguchi method. Welding experiments are conducted using a 3 kW Nd:YAG laser source. The selected laser welding parameters (laser power, welding speed, laser fiber diameter, gap between sheets and sheet thickness) are com-bined and used to evaluate the variation of four weld quality attributes (bead width, penetration depth, underfill and hardness) and to identify the possible relationship between welding parameters and weld physical and geometrical attributes. The effects of these parameters are studied using ANOVA to find their contributions to the variation of different weld characteristics. Plots of the main effects and the interaction effects are also used to understand the in-fluence of the welding parameters. The results reveal that all welding parame-ters are relevant to bead width (BDW) and depth of penetration (DOP) with a relative predominance of laser power and welding speed. The effect of laser fiber diameter on penetration depth is insignificant. Typical gap-dependent weld shapes show that a small gap results in a narrower and deeper weld. Due to the standard sheared edge, an underfill between 5% and 10% occurs for no-gap experiments. The resulting hardness values are relatively similar for all the experimental tests.
Keywords Laser Welding, Nd:YAG, Low Carbon Galvanized Steel, Taguchi Method, Butt-Joint
1. Introduction
Laser welding is used in the automotive industry for welding bodies with up to
How to cite this paper: Jacques, L. and El Ouafi, A. (2017) Experimental Investiga-tion of Laser Welding Process in Butt-Joint Configurations. World Journal of Engi-neering and Technology, 5, 77-89. https://doi.org/10.4236/wjet.2017.51007 Received: November 30, 2016 Accepted: February 19, 2017 Published: February 22, 2017 Copyright © 2017 by authors and Scientific Research Publishing Inc. This work is licensed under the Creative Commons Attribution International License (CC BY 4.0). http://creativecommons.org/licenses/by/4.0/
Open Access

L. Jacques, A. El Ouafi
78
30 m of welds length per vehicle. In order to design lighter cars for reduced fuel consumption, the most recent developments use tailor-welded blank, requiring various metals types and thicknesses to be welded together before the forming process. Such blank can have the right properties located precisely where they are needed, minimizing the use of materials and reducing the weight and cost [1] [2]. Laser welding currently used to assemble this new kind of blank performs very well than other welding methods in terms of speed, cost, and welding qual-ity. In automotive bodies, no other process has shown an equivalent versatility with steel grades developed to meet the specific requirements of these applica-tions.
The welding of thin steel sheets is mainly done with overlap welding or butt- joint welding. Galvanized sheets are used for corrosion prevention, but the zinc vaporizes at a lower temperature (1180 K) than that at which the steel fuses (1730 K). Due to this discrepancy, problems occur during overlap laser welding of galvanized sheets: vaporization of the zinc might displace liquid steel, and vapour can get trapped in the weld and create porosities [3] [4]. Several studies have dealt with this problem by creating a gap between sheets to enable off-gassing of the vapour without disturbing the weld pool, or by adjusting other parameters to reduce the size and the number of defects [5] [6].
Butt-joint welding is commonly used to avoid these kinds of problems, but this configuration requires very precise positioning. A vertical gap of only 15% of the thickness and a horizontal gap of 10% of the thickness can be tolerated to ensure quality and filling of the weld. For sheets thinner than 3 mm, this means less than a 0.5 mm gap on along more than 10 cm of weld. Since laser welding is an autogenous process, the residual stress developed during cooling is used to fill the gap up to at least 80% of the thickness, which is generally required in the automotive industry. Another requirement is that the laser diameter (about 0.4 mm) be two times larger than the gap to avoid defects. To reach positioning re-quirements, laser cutting, precision die blanking, or edge preparation are com-monly used for linear welding [7]. To avoid the filling problem in butt-joint configurations, filler metal in the form of wire or powder can be used in con-junction with laser welding. Such methods can fill up to 1 mm gaps for 2 mm thickness sheets, but reduce the advantage of the laser welding process [8].
Neural networks have been used to determine the maximum gap that can be welded depending on the welding speed, the laser power and the sheet thickness [9]. Another study has been conducted on the impact of the gap and edge roughness on penetration for high power laser welding (10 kW to 14 kW) [10]. Effects on depth of penetration and others welds quality are established for various welding parameters. Works on welding parameters optimization for tailor blank welding reveal that the use of a small gap between 0.1 mm and 0.15 mm gives a relatively accepted welds quality [11] [12]. Many experimental others investiga-tions find the use of a small gap can produce a best weld. But no relationships can be found to quantify the gap impact on the weld dimension, nor its interac-tion with the other welding parameters.

L. Jacques, A. El Ouafi
79
Based on all these works and observations, it is clear that positioning and welding parameters need to be controlled precisely to produce the desired weld-ing quality especially in the case of butt-joint welding of automotive bodies and tailor blank. A structured experimental investigation is required to understand the effects and the interaction of various parameters in orders to build an effi-cient weld quality predictive modeling.
The paper presents an experimental investigation of laser welding low carbon galvanized steel in butt-joint configurations. The effects of welding parameters and conditions (laser power, welding speed, laser fiber diameter, gap between sheets and sheet thickness) on the variation of weld quality attributes (bead width, penetration depth, underfill and hardness) are studied. Analysis of vari-ance is executed to quantify the impact of each parameter on the welds quality and assess the parameters interactions. The combination of welding parameters and conditions that can give the best welds quality for various thickness with or without gap are identified.
2. Materials and Experimental Procedure 2.1. Materials
The experimental investigations were conducted using galvanized steel ASTM A635CS with galvanneal A40 coating. The sheet thickness was chosen to fit within the thickness range usually used for automotive bodies (0.8 - 3.6 mm). Three different thicknesses are taken: gauges 11, 14 and 20, respectively 3.132 mm, 1.994 mm and 1.006 mm. The chemical compositions of all sheets are shown in Table 1. Specimens were cut to 30 mm × 50 mm using hydraulic shear. The edge did not receive further treatment. The small differences in chemical composition are neglected.
2.2. Laser Experimental Procedure
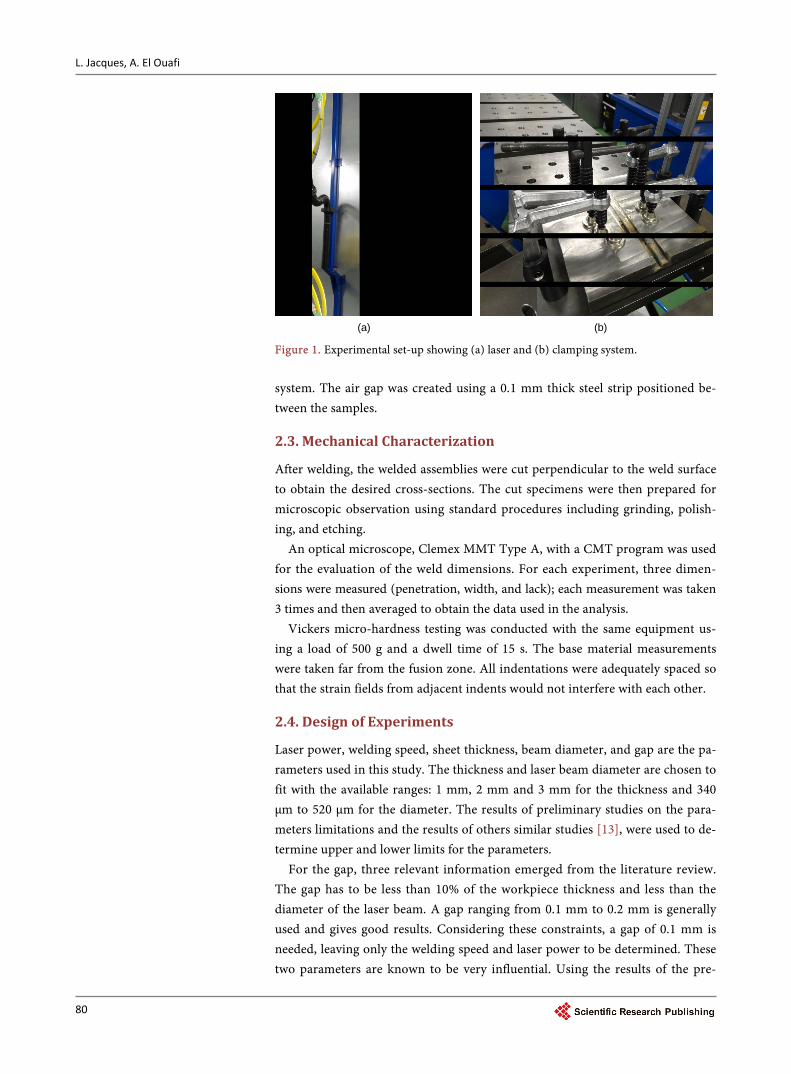
The welding equipment was a six-axis-robotic system FANUC M-710ic equipped with a fiber Laser source IPG YLS-3000-ST2 and a laser head HIGHYAG BIMO. The Nd:YAG laser source emits light with a wavelength of 1070 nm and a maximum power of 3 kW. The power is transferred through an optical fiber, with a diameter of 200 µm, to the laser head, with a focal length of 300 mm. A collimator allows the user to adjust the beam diameter between 340 µm and 520 µm. Figure 1 shows the laser welding setup with the laser and the clamping Table 1. Chemical composition of the metal.
Component C Mn P S Si Cu Ni Cr Al N
Gauge 11 (3 mm)
0.04 0.19 0.005 0.002 0.01 0.01 0.02 0.009 0.038 0.0039
Gauge 14 (2 mm)
0.09 0.35 0.005 0.01 0.02 0.05 0.04 0.06 0.03 0.0029
Gauge 20 (1 mm)
0.05 0.24 0.009 0.013 0.007 0.029 0.012 0.037 0.04 0.004
L. Jacques, A. El Ouafi
80
(a) (b)
Figure 1. Experimental set-up showing (a) laser and (b) clamping system. system. The air gap was created using a 0.1 mm thick steel strip positioned be-tween the samples.
2.3. Mechanical Characterization
After welding, the welded assemblies were cut perpendicular to the weld surface to obtain the desired cross-sections. The cut specimens were then prepared for microscopic observation using standard procedures including grinding, polish-ing, and etching.
An optical microscope, Clemex MMT Type A, with a CMT program was used for the evaluation of the weld dimensions. For each experiment, three dimen-sions were measured (penetration, width, and lack); each measurement was taken 3 times and then averaged to obtain the data used in the analysis.
Vickers micro-hardness testing was conducted with the same equipment us-ing a load of 500 g and a dwell time of 15 s. The base material measurements were taken far from the fusion zone. All indentations were adequately spaced so that the strain fields from adjacent indents would not interfere with each other.
2.4. Design of Experiments
Laser power, welding speed, sheet thickness, beam diameter, and gap are the pa-rameters used in this study. The thickness and laser beam diameter are chosen to fit with the available ranges: 1 mm, 2 mm and 3 mm for the thickness and 340 µm to 520 µm for the diameter. The results of preliminary studies on the para- meters limitations and the results of others similar studies [13], were used to de-termine upper and lower limits for the parameters.
For the gap, three relevant information emerged from the literature review. The gap has to be less than 10% of the workpiece thickness and less than the diameter of the laser beam. A gap ranging from 0.1 mm to 0.2 mm is generally used and gives good results. Considering these constraints, a gap of 0.1 mm is needed, leaving only the welding speed and laser power to be determined. These two parameters are known to be very influential. Using the results of the pre-

L. Jacques, A. El Ouafi
81
liminary tests, the upper and lower limits are taken to respect the weld penetra-tion constraint. This means that the lowest speed with the highest power can re-sult in full weld penetration for a 3 mm thickness specimen, and the highest speed with lowest power can result in partial weld for a 1 mm thickness speci-men. Three levels are chosen to assess the nonlinear components of the parame-ter effects: speed between 3 and 9 m/min, and power between 2 and 3 kW. The factors and levels chosen can be seen in Table 2.
These factors and levels are used to generate an experiment design that will yield the maximum data with the minimum experimentation efforts. The Ta-guchi method is used to achieve an efficient statistical analysis. An explanation of this method can be found in [14]. An orthogonal array L54 is used allowing the combination of factors with 2 or 3 levels. In this case one factor with 2 levels and four factors with 3 levels are needed. Welding tests are carried out in a ran-dom order to avoid any systematic error in the experiment. In addition, repeat-ability tests are done using the median values from the experiment design (2500 W power, 2 mm thickness, 6 m/min speed and 450 µm diameter). Since the po-sitioning of the gap experiment requires different handling, 12 repeatability tests are done with a gap and 12 without gap, for a total of 24 supplementary tests.
3. Results and Discussion 3.1. Repeatability
During the repeatability tests, the depth of penetration, bead width, and underfill are precisely measured. In order to evaluate the total measurement error result-ing from non-studied parameters such as workpiece positioning, parameter sta-bility and change in environment during the experiments, average of quality at-tributes, standard deviations, and the relative errors are estimated.
The results in Table 3 indicated the good precision for the measurement of the penetration and the width, showing that with a normal distribution, 68% of observations will be within one standard deviation and 95% will be within two standard deviations. This means that the penetration and the width can be esti-mated with less than 5% error and the underfilling can be estimated with less than 15% error. The underfill dimensions are relatively small generating higher error percentages. The standard deviations are similar for all parameters. The Table 2. Factors and levels for experimentations.
Factors Levels
1 2 3
Gap (mm) 0 0.1 -
Thickness (mm) 1 2 3
Power (kW) 2 2.5 3
Speed (m/min) 3 6 9
Diameter (µm) 340 450 520

L. Jacques, A. El Ouafi
82
Table 3. Results of repeatability test (a) no gap and (b) with gap.
(a) no gap DOP (µm)
BDW (µm)
Undercut (µm)
(b) with gap DOP (µm)
BDW (µm)
Undercut (µm)
Min 1493 971 154 Min 1167 713 360
Max 1612 1080 254 Max 1353 922 507
Mean 1542 1023 212 Mean 1253 822 422
Standard deviation
38 32 30 Standard deviation
43 42 39
Relative error 2% 3% 12% Relative error 3% 3% 7%
standard deviation is slightly higher for the gap test. That means there is lower repeatability in the gap positioning.
An underfill of 10% of the thickness is present in the case of experimentation without gap. This must be caused by the edge morphology of the sheared edge. Flat or concave welds are produced using laser cutting or precision die blanking. A small gap exists when two sheared specimens are connected, as only the 2 burnished zone are in contact, the rest of the edge are spaced. The underfilling becomes about 20% of the thickness with the gap experiment. Figure 2 shows the morphology of the edge of the specimen used for the experiment. The di-mensions of the sheared edge have been measured and are relatively close for the 3 mm thickness. The rollover accounts for about 10% of the thickness, the bur-nished zone between 40% and 45%, and the fractured zone for 50%. The fracture angle ranges from 12˚ to 15˚.
3.2. Micro Hardness
Figure 3 shows the distribution of micro-hardness across the laser welding zone for the repeatability test. According to the hardness test, the hardness of the sub-strate (150 Hv) was much lower than that of the welded region (330 Hv), which agreed with the results found for low carbon steel [8]. The increase in hardness is caused by grain refinement, formation of hard phases and generation of re-sidual stress in the weld region due to rapid solidification [11]. The microhard-ness is comparable in all tests, with and without gap.
3.3. Taguchi
To obtain the effects of each factor on the weld dimensions, ANOVA were car-ried out based on the measured results as illustrated in Table 4 and Table 5. The p value is used to determine if the factor has an impact on a given parameter, and the percentage represents the risk of concluding that an influence exists when there is no actual influence. The percentage contribution is the variation caused by an individual factor over the total variation.
Any factor whose p-value is under 10% will be considered meaningful. Ac-cording to the results for the BDW, every factor is found to be meaningful. The gap is the least meaningful factor, with a p-value of 7%. For the DOP, the range of variation in diameter is found to not be an impacting factor, while all the

L. Jacques, A. El Ouafi
83
(a) (b)
Figure 2. Sheared edge specimens (a) front view, (b) side view.
Figure 3. Micro hardness profile of the welded joint.
Table 4. ANOVA table for BDW.
Source Sum of squares
dof Mean square
F value p value
Prob > F Percent
contribution
Gap 57,537 1 57,537 8.07 7% 2%
Thickness 53,538 2 26,769 3.76 3% 2%
Power 65,022 2 32,511 4.56 2% 2%
Diameter 237,072 2 118,536 16.63 0% 13%
Speed 1,336,393 2 668,197 93.74 0% 63%
Error 313,653 44 7128 - - 18%
Total 2,313,027 53 - - - 100%
Table 5. ANOVA table for DOP.
Source Sum of squares
dof Mean square
F value p value
Prob > F Percent
contribution
Gap 227,587 1 227,587 3.32 8% 2%
Thickness 4,009,900 2 2,004,950 29.26 0% 39%
Power 922,458 2 461,229 6.73 0% 8%
Diameter 239,568 2 119,784 1.75 19% 1%
Speed 2,522,684 2 1,261,342 18.41 0% 24%
Error 2,014,932 44 45,794 - - 24%
Total 9,937,129 53 - - - 100%
210-1-2
350
300
250
200
150
Distance from weld center (mm)
Vic
kers
mic
roha
rdne
ss (H
v)

L. Jacques, A. El Ouafi
84
other factors are meaningful. The percentage contribution for the BDW attrib-utes 18% of variation to non-studied factors, with the two main factors being speed (63%) and diameter (13%). The major factors for the DOP are speed (24%) and thickness (39%), while non-studied factors represent 24% of varia-tion.
3.4. Effect and Interaction
Figure 4 shows the effects of each of the 5 factors. The direction and steepness of the slope are used to determine the impact. We can see that the use of a gap re-duces the width and increases the penetration. The diameter, contrary to the gap, increases the width and reduces the penetration. Thickness and power have a positive impact on the width and the penetration, while speed has the opposite impact, reducing the penetration and the width. Every line is roughly straight, so the effect of the parameter does not change as it increases. The speed seems to have a stronger effect because it has a wide range of variation. In conclusion, three factors have a similar impact on penetration and width, while two factors have the opposite. The results for power, diameter and speed fit with [15].
To visualize whether the effect of one factor depends on the level of another factor, we used an interaction plot. Parallel lines in an interaction plot indicate no interaction; otherwise, the greater the difference in slope between the lines, the higher the degree of interaction. Only one significant difference in slope is found for the BDW. As can be seen in Figure 5, the thickness tends to increase the width without gap, but when using gap, thickness variation has insignificant impact on the bead width. This means that the weld done using a gap would stay thinner for thicknesses greater than 1 mm.
Figure 4. Main effect plot for BDW and DOP.
0.10.0
1200
1100
1000
900
800
300025002000 321 520450340 963
Gap (mm)
Bead
wid
th m
ean
(µm
) Power (W) Thickness (mm) Diameter (µm) Speed (m/min)
0.10.0
14001300120011001000900800700
300025002000 321 520450340 963
Gap (mm)
Dep
th o
f pen
etra
tion
mea
n (µ
m)
Power (W) Thickness (mm) Diameter (µm) Speed (m/min)

L. Jacques, A. El Ouafi
85
Interaction seems to be found between the thickness and the other factors for the DOP. Figure 6 shows the graph for speed and thickness. The interaction found is that using a greater thickness, with the values of the other factors giving the best penetration, allows a deeper weld, which is a logical interaction. For example, welding a 1 mm thickness sheet at low speed gives a full penetration weld that is about 1 mm, but using a 3 mm sheet gives a 3 mm weld, and when welding at a high speed both thicknesses have the same low penetration. This explains the change in the slope steepness, and is the same for all of the factors.
3.5. Weld Shape
The shape of the weld is mainly determined by the welding mode conduction or keyhole. As we can see in Assuncao study [16] [17], there is not a sharp transi-tion between conduction mode and keyhole mode. The mode is dependent on the interaction time and power density. In our experiments the interaction time varies between 2 ms and 10 ms, and the power density between 0.95 MW/cm2 and 3.3 MW/cm2. Given those values, the experiment’s range must be in the transition mode and the keyhole mode. The results give an aspect ratio between 0.5 and 2.2, which fits with these modes.
The weld shape is supposed to be from small and round to thin and deep, which is what we observe. Four weld shapes are considered: 1) round welds are
Figure 5. Interaction plot between thickness and gap for BDW.
Figure 6. Interaction plot between speed and thickness for DOP.
321
1080
1060
1040
1020
1000
980
960
940
920
Thickness (mm)
Bead
wid
th m
ean
(µm
)
0.0 mm0.1 mm
Gap
963
2000
1750
1500
1250
1000
750
500
Speed (m/min)
Dep
th o
f pen
etra
tion
mea
n (µ
m)
1 mm2 mm3 mm
Thickness

L. Jacques, A. El Ouafi
86
the welds almost in conduction mode (U weld), 2) wide V welds are the welds in transition mode (HV weld), 3) sharp V welds are those between transition mode and keyhole mode 4) weld), and 5) parallel edge welds are those with full pene-tration done in keyhole mode (H weld). Figure 7 gives a picture for each of the four morphologies.
Figure 8 represents the weld shape according to the DOP, the gap and the thickness. We notice that the round and wide V welds are only found in experi-ments without gap. The shape depends on the penetration of the weld, with the lowest penetration weld being round shaped, then wide V shaped, then sharp V shaped and finally parallel edge with the no-gap experiments. This order can be found for all three thicknesses. The penetration is directly linked to power den-sity and interaction time. The experiments with gap only produce sharp V shaped welds for partial welds, and mainly parallel edge welds for full penetra-tion. However, sometimes there can be a V shaped full penetration weld, which does not appear without gap.
Figure 7. Shape of the weld (a) round shape, (b) wide V shape, (c) sharp V shape, (d) parallel edge.
Figure 8. Weld shape according to the DOP, the gap and the thickness.
100908070605040302010
0.1
0.0
Depth of penetration (% of
Gap
(mm
)
HH VUV
Shape
thickness)

L. Jacques, A. El Ouafi
87
The use of a gap tends to make only sharp V shaped welds in the case of par-tial penetration welds. The assumption can be made that the gap allows an easier penetration for the weld because the melted metal can flow into the gap. The deepest penetrations achieved with gap are deeper than penetrations without gap because of this easier penetration. The higher penetrations achieved with gap are shallower than those without gap, because there is more underfilling caused by the gap. We can also remark that all sharp V welds without gap have more than 50% penetration, which is where the burnished zone and the fracture zone begin forming an unintended gap between the pieces.
3.6. Underfill
The experimental results reveal that tests with gap have more underfill than those with no gap. Figure 9 presents the distribution of the underfill versus the DOP in % of specimens’ thickness. Excluding the alignment on the right, the figure reveals the presence of an underfill of about 5% for the experiments without gap. The underfill tends to grow slightly after 50% penetration. This is certainly due to the fracture zone. An underfill between 10% and 15% is present when using gap. When looking at the alignment on the right, a trend appears with depth of penetration plus underfill equal 100%. Furthermore, the points on that line were for full penetration welds. Only the underfill on the upper face has been measured. That is why when underfill exists on the bottom face, the sums are slightly less than 100%. This suggests the question why all the full penetra-tion welds do not have the same underfill.
Figure 10 presents the BDW versus the underfill for full penetration weld. This figure shows that the width decreases when the underfill increases. This observation fits with the refillable gap formula: g = A*B*ΔT*w proposed in [18], where A is constant, B is the coefficient of thermal dilatation, ΔT is the tem-perature differential, and w is the width. The measurements in the bottom right corner reveal the weld with the least underfill. The use of gap moves this point upward by about 10%, but maintains the same slope, and the underfill is sub-stantially greater for the same width. This means that when using a gap the un-derfill is bigger for the same bead width. The largest number of full penetration welds are achieved using 1 mm sheet thickness explains the larger number point
Figure 9. Shape of the weld according to the DOP, the gap and the thickness.
100908070605040302010
25
20
15
10
5
0
Depth of penetration (% of
Und
erfil
l (%
of t
hick
ness
)
5
12
0.0 mm0.1 mm
Gap
thickness)

L. Jacques, A. El Ouafi
88
Figure 10. Shape of the weld according to the DOP, the gap and the thickness. in the graph. The underfill also increases slightly with the thickness because of the sheared edge that creates more gap with increased thickness. In order to achieve good weld on thicker plate, wider weld have to be done if there’s no ad-ditional edge preparation.
4. Conclusion
This paper presents an experimental investigation of laser welding low carbon galvanized steel in butt-joint configurations. The experimental work is focused on bead width, penetration depth, underfill and hardness using various laser welding parameters such as laser power, welding speed, laser fiber diameter, gap between sheets and sheet thickness. There are 54 experimental tests taken all factors known to have an influence on welds quality to conduct a systematic study using Taguchi methods. ANOVA analysis and effect plot diagrams are also used to evaluate the effects and the percentage contribution of the laser welding parameters on the characteristics of the weld. The micro hardness measurements show coherent results with an increase in the weld hardness from 150 Hv to 330 Hv. The ANOVA analysis reveals that the welding parameters that have signifi-cant effects on the weld quality are laser power, welding speed, laser fiber di-ameter and sheet thickness. The gap between sheets has a positive effect on the weld dimensions by making the weld thinner and deeper permitting the higher speeds for the same penetration. The use of a gap decreases the thickness effect on the bead width and facilitates the formation of V shaped welds. An underfill between 5% and 10% is observed for no-gap experiments and increases by about 10% when using gap. The sheared edges explain several observations on the un-derfill and the shape of the weld. Finally, the welding parameters that can give the best welds quality for various thickness with or without gap are identified.
References [1] Ribolla, A., Damoulis, G.L. and Batalha, G.F. (2005) The Use of nd:Yag Laser Weld
for Large Scale Volume Assembly of Automotive Body in White. Journal of Materi-als Processing Technology, 164-165, 1120-1127. https://doi.org/10.1016/j.jmatprotec.2005.02.104
[2] Mei, L., Yan, D., Chen, G., Xie, D., Zhang, M. and Ge, X. (2015) Comparative Study on CO2 Laser Overlap Welding and Resistance Spot Welding for Automotive Body

L. Jacques, A. El Ouafi
89
in White. Materials & Design, 78, 107-117. https://doi.org/10.1016/j.matdes.2015.04.031
[3] Uchihara, M. (2011) Joining Technologies for Automotive Steel Sheets. Welding International, 25, 249-259. https://doi.org/10.1080/09507111003655341
[4] Schmidt, M., Otto, A. and Kägeler, C. (2008) Analysis of yag Laser Lap-Welding of Zinc Coated Steel Sheets. CIRP Annals-Manufacturing Technology, 57, 213-216. https://doi.org/10.1016/j.cirp.2008.03.043
[5] Zhao, Y., Zhang, Y., Hu, W. and Lai, X. (2012) Optimization of Laser Welding Thin-Gage Galvanized Steel via Response Surface Methodology. Optics and Lasers in Engineering, 50, 1267-1273. https://doi.org/10.1016/j.optlaseng.2012.03.010
[6] Amo, J.M., Durán, J., Chao, J. and Fernández-Sáez, J. (1996) Laser Welding of Al55-Zn Coated Steel Sheet. Journal of Materials Science, 31, 6595-6607. https://doi.org/10.1007/BF00356267
[7] Spöttl, M. and Mohrbacher, H. (2014) Laser-Based Manufacturing Concepts for Ef-ficient Production of Tailor Welded Sheet Metals. Advances in Manufacturing, 2, 193-202. https://doi.org/10.1007/s40436-014-0088-8
[8] Sun, Z. and Kuo, M. (1999) Bridging the Joint Gap with Wire Feed Laser Welding. Journal of Materials Processing Technology, 87, 213-222. https://doi.org/10.1016/S0924-0136(98)00346-X
[9] Jeng, J.-Y., Mau, T.-F. and Leu, S.-M. (2000) Prediction of Laser Butt Joint Welding Parameters Using Back Propagation and Learning Vector Quantization Networks. Journal of Materials Processing Technology, 99, 207-218. https://doi.org/10.1016/S0924-0136(99)00424-0
[10] Sokolov, M. and Salminen, A. (2012) Experimental Investigation of the Influence of Edge Morphology in High Power Fiber Laser Welding. Physics Procedia, 39, 33-42. https://doi.org/10.1016/j.phpro.2012.10.011
[11] Suh, J., Kim, T., Yu, B. and Lee, K. (1998) A Study of Tailored Blank Welding be-tween Mild Steel Sheet and Zn-Coated Steel Sheet by CO2 Laser Beam. Metals and Materials, 4, 157-163. https://doi.org/10.1007/BF03026033
[12] Park, J. and Kim, T. (1999) Tailored Blank Welding between Low Carbon Steel Sheet and STS 304 Stainless Steel Sheet by CO2 Laser Beam. Metals and Materials, 5, 55-62. https://doi.org/10.1007/BF03026005
[13] America, L.I., Ready, J.F. and Farson, D.F. (2001) Lia Handbook of Laser Materials Processing. Laser Institute of America, Magnolia Publishing, Orlando.
[14] Ross, P.J. (1996) Taguchi Techniques for Quality Engineering: Loss Function, Or-thogonal Experiments, Parameter and Tolerance Design. McGraw-Hill, New York.
[15] Khan, M.M.A., Romoli, L., Fiaschi, M., Sarri, F. and Dini, G. (2010) Experimental Investigation on Laser Beam Welding of Martensitic Stainless Steels in a Con-strained Overlap Joint Configuration. Journal of Materials Processing Technology, 210, 1340-1353. https://doi.org/10.1016/j.jmatprotec.2010.03.024
[16] Assuncao, E., Williams, S. and Yapp, D. (2012) Interaction Time and Beam Diame-ter Effects on the Conduction Mode Limit. Optics and Lasers in Engineering, 50, 823-828. https://doi.org/10.1016/j.optlaseng.2012.02.001
[17] Assuncao, E. and Williams, S. (2013) Comparison of Continuous Wave and Pulsed Wave Laser Welding Effects. Optics and Lasers in Engineering, 51, 674-680. https://doi.org/10.1016/j.optlaseng.2013.01.007
[18] Steen, W.M. and Mazumder, J. (2010) Laser Material Processing. Springer, London. https://doi.org/10.1007/978-1-84996-062-5

Submit or recommend next manuscript to SCIRP and we will provide best service for you:
Accepting pre-submission inquiries through Email, Facebook, LinkedIn, Twitter, etc. A wide selection of journals (inclusive of 9 subjects, more than 200 journals) Providing 24-hour high-quality service User-friendly online submission system Fair and swift peer-review system Efficient typesetting and proofreading procedure Display of the result of downloads and visits, as well as the number of cited articles Maximum dissemination of your research work
Submit your manuscript at: http://papersubmission.scirp.org/ Or contact [email protected]