Expanding Bernard Pinatel petrochemicals€¦ · Expanding worldclass petrochemicals in the US...
12
Expanding petrochemicals Bernard Pinatel President Refining & Chemicals
Transcript of Expanding Bernard Pinatel petrochemicals€¦ · Expanding worldclass petrochemicals in the US...
Expanding petrochemicals
Bernard Pinatel
President Refining & Chemicals

Line 1
Base for all bar charts
axis labels base
Line 1 Text under charts
Line 2 Text under charts
Line 2
Disclaimer
This document may contain forward-looking information on the Group (including objectives and trends), as well as forward-looking statements within the meaning of the Private Securities Litigation Reform Act of 1995, notably with respect to the financial condition, results of operations, business, strategy and plans of TOTAL. These data do not represent forecasts within the meaning of European Regulation No. 809/2004.
Such forward-looking information and statements included in this document are based on a number of economic data and assumptions made in a given economic, competitive and regulatory environment. They may prove to be inaccurate in the future, and are subject to a number of risk factors that could lead to a significant difference between actual results and those anticipated, including currency fluctuations, the price of petroleum products, the ability to realize cost reductions and operating efficiencies without unduly disrupting business operations, environmental regulatory considerations and general economic and business conditions. Certain financial information is based on estimates particularly in the assessment of the recoverable value of assets and potential impairments of assets relating thereto.
Neither TOTAL nor any of its subsidiaries assumes any obligation to update publicly any forward-looking information or statement, objectives or trends contained in this document whether as a result of new information, future events or otherwise. Further information on factors, risks and uncertainties that could affect the Company’s financial results or the Group’s activities is provided in the most recent Registration Document filed by the Company with the French Autorité des Marchés Financiers and annual report on Form 20-F filed with the United States Securities and Exchange Commission (“SEC”).
Financial information by business segment is reported in accordance with the internal reporting system and shows internal segment information that is used to manage and measure the performance of TOTAL. Performance indicators excluding the adjustment items, such as adjusted operating income, adjusted net operating income, and adjusted net income are meant to facilitate the analysis of the financial performance and the comparison of income between periods. These adjustment items include:
(i) Special itemsDue to their unusual nature or particular significance, certain transactions qualified as "special items" are excluded from the business segment figures. In general, special items relate to transactions that are significant, infrequent or unusual. However, in certain instances, transactions such as restructuring costs or asset disposals, which are not considered to be representative of the normal course of business, may be qualified as special items although they may have occurred within prior years or are likely to occur again within the coming years.
(ii) Inventory valuation effectThe adjusted results of the Refining & Chemicals and Marketing & Services segmentsare presented according to the replacement cost method. This method is used to assess the segments’ performance and facilitate the comparability of the segments’ performance with those of its competitors.
In the replacement cost method, which approximates the LIFO (Last-In, First-Out) method, the variation of inventory values in the statement of income is, depending on the nature of the inventory, determined using either the month-end price differentials between one period and another or the average prices of the period rather than the historical value. The inventory valuation effect is the difference between the results according to the FIFO (First-In, First-Out) and the replacement cost.
(iii) Effect of changes in fair value The effect of changes in fair value presented as an adjustment item reflects for some transactions differences between internal measures of performance used by TOTAL’s management and the accounting for these transactions under IFRS.
IFRS requires that trading inventories be recorded at their fair value using period-end spot prices. In order to best reflect the management of economic exposure through derivative transactions, internal indicators used to measure performance include valuations of trading inventories based on forward prices.
Furthermore, TOTAL, in its trading activities, enters into storage contracts, which future effects are recorded at fair value in Group’s internal economic performance. IFRS precludes recognition of this fair value effect.
The adjusted results (adjusted operating income, adjusted net operating income, adjusted net income) are defined as replacement cost results, adjusted for special items, excluding the effect of changes in fair value.
Cautionary Note to U.S. Investors – The SEC permits oil and gas companies, in their filings with the SEC, to separately disclose proved, probable and possible reserves that a company has determined in accordance with SEC rules. We may use certain terms in this presentation, such as resources, that the SEC’s guidelines strictly prohibit us from including in filings with the SEC. U.S. investors are urged to consider closely the disclosure in our Form 20-F, File N° 1-10888, available from us at 2, Place Jean Millier – Arche Nord Coupole/Regnault- 92078 Paris-La Défense Cedex, France, or at our website: total.com. You can also obtain this form from the SEC by calling 1-800-SEC-0330 or on the SEC’s website: sec.gov.
Line 1
2017 Field Trip
Base for all bar charts
axis labels base
Line 1 Text under charts
Line 2 Text under charts
Line 2
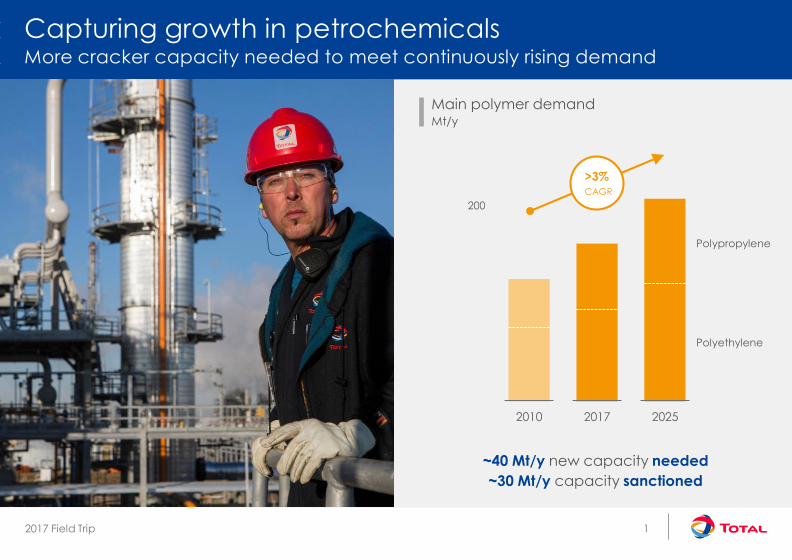
Capturing growth in petrochemicalsMore cracker capacity needed to meet continuously rising demand
~40 Mt/y new capacity needed
~30 Mt/y capacity sanctioned
200
2010 2017 2025
Main polymer demandMt/y
Polypropylene
Polyethylene
>3%
CAGR
1

Line 1
2017 Field Trip
Base for all bar charts
axis labels base
Line 1 Text under charts
Line 2 Text under charts
Line 2
500
1,000
2000 2017
Polymer price is oil-linked US shale underpinning ethane and LPG discount
A clear path to creating valueProfitability driven by access to cheap feedstock
Feedstock prices$/t
Main polymer feedstocks
NaphthaEthane
LPG
Distillates
Coal
Naphtha
Ethane
Oil
LPG
2

Line 1
2017 Field Trip
Base for all bar charts
axis labels base
Line 1 Text under charts
Line 2 Text under charts
Line 2
Expanding gas-basedcracker capacity
US ethane market
Middle East long-term contracts
Implementing a two-pillar strategyExpanding gas-based cracker capacity, increasing naphtha cracker flexibility
Increasing flexibilityof historic naphthacrackers
Leveraging integration to valorize refinery off-gas
Converting to cheaper, increasingly available LPG
3

Line 1
2017 Field Trip
Base for all bar charts
axis labels base
Line 1 Text under charts
Line 2 Text under charts
Line 2
Upgraded European platforms cracking LPG and ethaneAntwerp and Normandy positioned among leaders
Normandy cracker processing up to 60% LPG
Antwerp modernization completed
• 60% ethane, off-gas & LPG cracker feedstock
• Shut down oldest cracker and polymers
Shut down Carling cracker
Carling cracker
Antwerp: 1 cracker + 1 polymer line
Feyzin JV
Lavera JV
Cracker shutdownIntegrated platform
Antwerp platform: 340 kb/d refinery1.1 Mt/y crackers1.7 Mt/y polymers
Normandy platform: 240 kb/d refinery0.6 Mt/y cracker0.6 Mt/y polymers
Cracker
4

Line 1
2017 Field Trip
Base for all bar charts
axis labels base
Line 1 Text under charts
Line 2 Text under charts
Line 2
Houston Port Arthur
La PorteBayport
Carville
Expanding worldclass petrochemicals in the USTotal-Borealis-Nova joint venture, an integrated polyethylene leader
Low-cost ethane to high-end polyethylene
50% interest in a best-in-class JV
• 1.7 B$ Capex for 1 Mt/y ethane cracker
• Low-cost expansion, maximum synergies
with existing cracker and refinery
• Expanding Bayport polymer to 1 Mt/y
~1 B$ CFFO from US R&C operations
Evaluating further growth prospects in
land of opportunity for petrochemicals
Port Arthur Bayport Bayport
1.2 Mt/y styrene (50%)
0.6 Mt/y polystyrene
1.2 Mt/y polypropylene
World largest
Total
La Porte CarvillePort Arthur
200 kb/d refinery and
1 Mt/y cracker (40%)
New 1 Mt/y crackerexisting 0.4 Mt/y
polyethyleneNew > 0.6 Mt/y polyethylene
Borealis-Nova JV, Total 50%
5
Line 1
2017 Field Trip
Base for all bar charts
axis labels base
Line 1 Text under charts
Line 2 Text under charts
Line 2
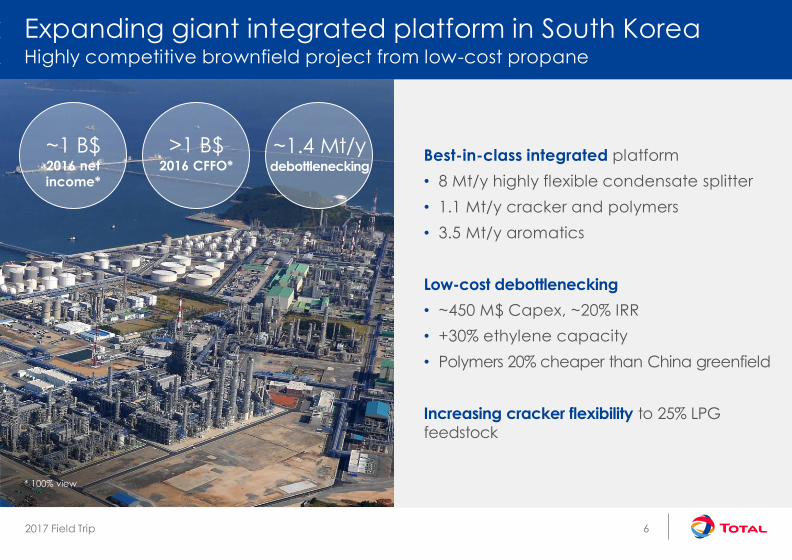
Expanding giant integrated platform in South KoreaHighly competitive brownfield project from low-cost propane
Best-in-class integrated platform
• 8 Mt/y highly flexible condensate splitter
• 1.1 Mt/y cracker and polymers
• 3.5 Mt/y aromatics
Low-cost debottlenecking
• ~450 M$ Capex, ~20% IRR
• +30% ethylene capacity
• Polymers 20% cheaper than China greenfield
Increasing cracker flexibility to 25% LPG feedstock
>1 B$ 2016 CFFO*
~1.4 Mt/ydebottlenecking
~1 B$2016 net
income*
* 100% view
6

Line 1
2017 Field Trip
Base for all bar charts
axis labels base
Line 1 Text under charts
Line 2 Text under charts
Line 2
Growing Qatar petrochemicals by up to 40%
• 100% ethane cracking
• Ras Laffan debottlenecking to ~1.4 Mt/y
• New 0.8 Mt/y Qapco side cracker
Building on SATORP refinery success
• Evaluating 1 Mt/y cracker
• >75% off-gas, ethane and LPG feedstock
Memorendum of Understanding to study
Iran and Algeria petrochemicals
Expanding worldclass operations in the Middle EastEvaluating 3 projects to double cracking capacity to >4 Mt/y
* In 2016, 100% viewNorth Dome (> 1200 tcf gas)
Qatar (20-49%):1.3 Mt/y Ras Laffan cracker0.8 Mt/y Qapco cracker1.3 Mt/y polymers
Al Jubail1 Mt/y cracker
Ras LaffanCracker debottlenecking
Qapco Mesaieed0.8 Mt/y side cracker
~1.8 B$CFFO*
~2.2 Mt/ycracking*
1 B$net income*
SATORP (37.5%): >440 kb/d debottlenecking
0.8 Mt/y aromatics
Petrochemical project
Iran
United Arab EmiratesSaudi Arabia
7

Line 1
2017 Field Trip
Base for all bar charts
axis labels base
Line 1 Text under charts
Line 2 Text under charts
Line 2
Developing high-end polymersTailor-made solutions supporting margins
Specialty polyethyleneLightweight solutionsPolypropylene compound
High performance bioplastics75 kt/y polylactic acid JV
#1 in China for orange pressurized gas & water pipes
6% per year demand growthfor metallocene grades
Antwerp investment
5% per year demand growth
Doubling compoundingcapacity 2016-22
Polyblend, Carling investments
>10% per year demand growth
Biosourced, biodegradable
Thailand JV, world #2 player
8

Line 1
2017 Field Trip
Base for all bar charts
axis labels base
Line 1 Text under charts
Line 2 Text under charts
Line 2
Expanding high return petrochemicalsStrong business taking advantage of favorable outlook
Relentlessly improving competitiveness
Capturing >3% per year demand growth
Best-in-class projects adding >20% capacity
• Maximizing synergies on giant platforms
• Adding value to advantaged feedstock
• Securing low cost energy
~30%ROACE
in 2017
~20%CFFO growth
2017-22*
~1.8 B$CFFO
in 2017
* In constant petrochemical environment
9

Line 1
2017 Field Trip
Base for all bar charts
axis labels base
Line 1 Text under charts
Line 2 Text under charts
Line 2
Increasing R&C organic free cash flow by >30%Expanding petchems, selectively upgrading platforms, reducing costs
R&C organic free cash flowB$
+1 B$ Free cash flow
2017-22
>25%ROACE
3 B$Free cash flow
in 20174
2012 2017 2022
ERMI $/t 37 35
* In 2017 petrochemical environment
36
> 30%
10


![Jean Pinatel Teoria Personalidad Criminal[1]](https://static.fdocuments.net/doc/165x107/5571fb1e4979599169940031/jean-pinatel-teoria-personalidad-criminal1.jpg)