

EWEC 02/2006 Dr.-Ing. Kurt Rohrig Institut für Solare Energieversorgungstechnik Verein an der...
27
EWEC 02/2006 Dr.-Ing. Kurt Rohrig Institut für Solare Energieversorgungstechnik Verein an der Universität Kassel e. V. www.iset.uni-kassel.de Introduction Wind power integration in Germany Wind Farm Cluster Management XLS Virtual Power Plants Extra Large Scale Virtual Power Plants – New Concepts to Integrate German Wind Potential into Electrical Energy Supply EWEC 2006, Athens Business, Science & Technology
-
Upload
helen-brown -
Category
Documents
-
view
212 -
download
0
Transcript of EWEC 02/2006 Dr.-Ing. Kurt Rohrig Institut für Solare Energieversorgungstechnik Verein an der...

EWEC 02/2006
Dr.-Ing. Kurt Rohrig
Institut für Solare Energieversorgungstechnik Verein an der Universität Kassel e. V.
www.iset.uni-kassel.de
Introduction
Wind power integration in Germany
Wind Farm Cluster Management
XLS Virtual Power Plants
Extra Large Scale Virtual Power Plants – New Concepts to Integrate German Wind Potential into Electrical Energy Supply
EWEC 2006, AthensBusiness, Science & Technology

EWEC 02/2006
Wind Energy in Germany
18300 MW17400 WT
as of 12/2005
wind generation
25,9 TWh in 200426,3 TWh in 2005
Introduction

EWEC 02/2006
0
10000
20000
30000
40000
50000
60000
0 24 48 72 96 120 144
Hours
Po
we
r [M
W]
load w/o wind
Typical load profile in Germany 1.-7. May
yesterday: konv. generation = load
Introduction

EWEC 02/2006
0
10000
20000
30000
40000
50000
60000
0 24 48 72 96 120 144
Hours
Po
we
r [M
W]
load w/o wind
load incl. wind
Load profile & wind generation today
today: konv. generation = load – wind generation
Introduction

EWEC 02/2006
Step 1: Online model calculates from few measured windfarms the current power for all plants
Step 2: Prediction model calculates on the basis of the current power of all plants and the weather forecast the future wind power feed-in
Accuracy in the statistical averageover 95 % for the D+1 forecastover 96 % for the 4 hours forecast
Applications: E.ON-Netz Vattenfall Europe Transmission RWE Transportnetz Strom
EnBW Transportnetze
Forecast for the current wind power feed-in
Wind Power Integration in Germany

EWEC 02/2006
Wind Power Measurement Network
Measurements at representative
wind farms (substations)
E.ON: 69 sites 2356 MW (33,2 %)
VE-T: 17 sites 725 MW (11,4 %)
RWE: 16 sites 461 MW (15,2 %)
EnBW: 7 sites 108 MW (41,3 %)
Total: 111 sites 3650 MW (21,8 %)
Wind Power Integration in Germany

EWEC 02/2006Wind Power Integration in Germany
Wind generation – online, day-ahead forecast
0
2000
4000
6000
8000
10000
12000
14.1 15.1 16.1 17.1 18.1 19.1 20.1 21.1
Day
Po
wer
[M
W]
Online
Forecast D+1

EWEC 02/2006Wind Power Integration in Germany
Wind generation – online, 4 hour forecast
0
2000
4000
6000
8000
10000
12000
14.1 15.1 16.1 17.1 18.1 19.1 20.1 21.1
Day
Po
wer
[M
W]
Online
Forecast 4H
EWEC 02/2006
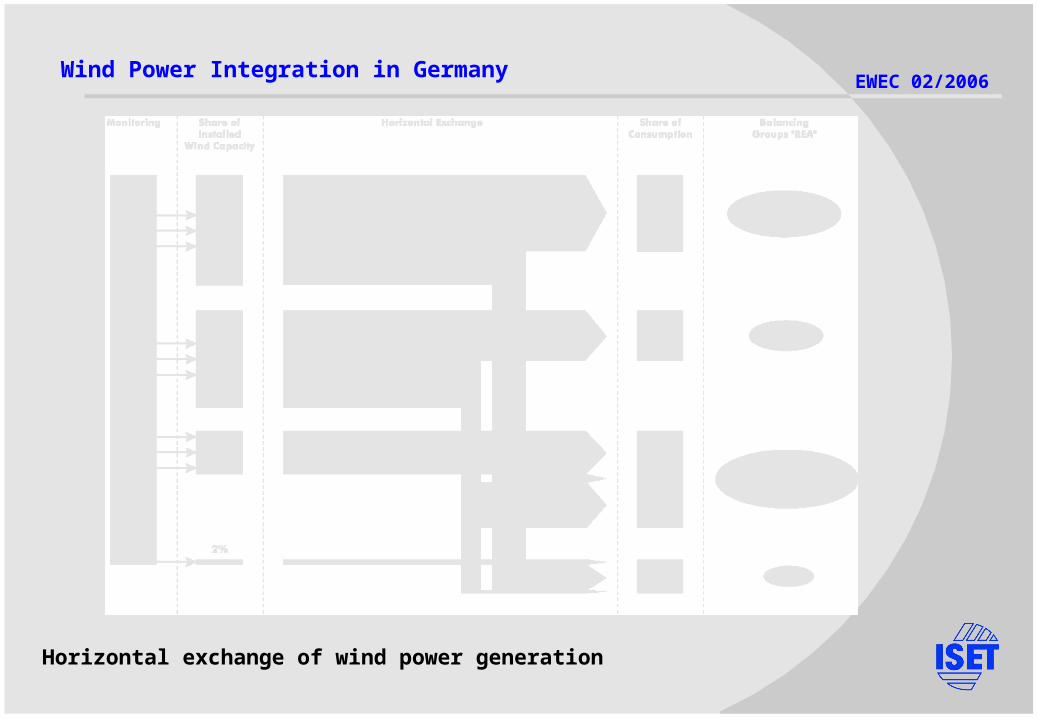
Horizontal exchange of wind power generation
Wind Power Integration in Germany

EWEC 02/2006I/Ro 1/2002
Wind Power Integration in Germany

EWEC 02/2006
0
10000
20000
30000
40000
50000
60000
0 24 48 72 96 120 144
Hours
Po
we
r [M
W]
load w/o wind
load incl. wind
Load profile & wind generation today
today: konv. generation = load – wind generation
Wind Power Integration in Germany

EWEC 02/2006
0
5.000
10.000
15.000
20.000
25.000
30.000
35.000
40.000
45.000
50.000
55.000
1993 1995 1997 1999 2001 2003 2005 2007 2009 2011 2013 2015 2017 2019
Year
acc.
Po
wer
[M
W]
Onshore Repowering Offshore
Considering plannedinstallations offshorefurther growth up to 40 GWis expected
Wind Power Integration in Germany

EWEC 02/2006
Traditional
CHP
Hydro
Wind
Bio fuel
Photovoltaic
EC- Targets 2010 - generation
40 %
Peak Load contribution
60 %
6 12 18 24
100
25
50
75
P, %
-25
Pump storage generation
Pump load Average renewable & CHP generation
Traditional generation
MAX
How to handle the surplus? Source SIEMENS
Wind Power Integration in Germany

EWEC 02/2006
0
10000
20000
30000
40000
50000
60000
0 24 48 72 96 120 144
Hours
Po
we
r [M
W]
load w/o wind
load incl. wind
Load profile & wind generation 2015
tomorrow: konv. generation = load – wind generation = 0 !!
Wind Power Integration in Germany

EWEC 02/2006
The intermittent generation in range of several (tenth) GW has increasing influence on two important areas of TSOs tasks:
Wind Farm Cluster Management
grid management
frequency control
and requires new concepts and strategies for management and control of WTs, wind farms and wind farm clusters

EWEC 02/2006
Cluster ManagementAggregation of large on- and offshore wind farms allows innovative control strategies
Functions:•Consideration of data from online acquisition and prediction•Aggregation and distribution of predicted power generation to different clusters (scheduling)•Consideration of network restrictions arising from network topology•Consideration of restrictions arising from power plant scheduling and electricity trading•Scaling of threshold values •Allocation of target values to different clusters
Wind Farm Cluster Management

EWEC 02/2006
equivalent circuitdiagram
Wind Farm Cluster Management

EWEC 02/2006
Wind farm control with 11 Enercon E 66
reactive power provision
default maximum active power feed
schedule setting
voltage control on high/extra-high voltage level
control power provision
ability for primary control
Wind Farm Cluster Management

EWEC 02/2006
Reserve power supply (500 MW)
0
1000
2000
3000
4000
5000
6000
06.10.2003 07.10.2003 08.10.2003 09.10.2003 10.10.2003
Time
Po
wer
[M
W]
Reserve PowerReduced Power
Wind Farm Cluster Management

EWEC 02/2006Index
0
20
40
60
80
100
120
140
160
180
23:15 01:15 03:15 05:15 07:15 09:15 11:15 13:15 15:15
Time
Po
wer
[M
W]
cluster
cluster new
wind farm
wind farm control
Wind Farm Cluster Management

EWEC 02/2006
Cluster-Management
W PRBE-Kopfstation
Funkm odem -kom m unikation
WP-Sollwerte P, Q
W PCC
W PC M S
Netzberechnungs-
tool
W etter-prognosedaten
Prognose-Tool
t, P, Q
Windleistungs-prognose
GU I
HSL
GSL
HS-Ebene ÜKL
ÜNB-Leittechnik
Leit-technik
Leit-technik
Leit-rechner
Windpark
W indpark 1
W indpark n
Leit-rechner
Windpark
Um spannwerk (U W 1)
Um spannwerk (U W 2)
Um spannwerk (U W n)
W P-RBE
1
W P-RBE
2
W P-RBE
n
Funk-Modem
Funk-Modem
Funk-Modem
WP-Istwerte (P, Q, P )verf.
Wind Farm Cluster Management

EWEC 02/2006
Future Scenarios• wind power generation in 10th GW range effects prediction errors in GW range• large wind power fluctuations cannot be compensated only by control power• interventions (control strategies) of WTs are limited
Extra Large Scale Virtual Power Plants• pooling of wind, CHP, storage devices and special conventional power plants to generation clusters• fast and precise adjustment with modern ICT and innovative generation management• continental energy exchange with consideration of RE generation of all partners
Control Centre 2010• active integration of generation pools into grid management• active contribution of next generation WTs to system reliability
XLS Virtual Power Plants

EWEC 02/2006
0
10000
20000
30000
40000
50000
60000
0 24 48 72 96 120 144
Stunden
Le
istu
ng
[M
W]
Last ohne WindPoolkonv. Erzeugung
Make intermittend wind power generation compilant to electrical supply system
and minimize the need of reserve and control power
XLS Virtual Power Plants

EWEC 02/2006XLS Virtual Power Plants

EWEC 02/2006XLS Virtual Power Plants
Generation-Pooling by extra large virtual power Plantswith consideration of grid security and supply reliability

EWEC 02/2006
Control Centre 2010
0
10000
20000
30000
40000
50000
60000
0 24 48 72 96 120 144
Stunden
Le
istu
ng
[M
W]
Last ohne WindPoolkonv. Erzeugung
XLS Virtual Power Plants


