Evaluating radiation-induced noise effects on pixelated ... · Evaluating radiation-induced noise...
19
Evaluating radiation-induced noise effects on pixelated sensors for the National Ignition Facility Evaluating radiation-induced noise effects on pixelated sensors for the National Ignition Facility CASIS Workshop 2014 A. Manuel, P. Datte, M. Eckart, H. Khater Lawrence Livermore National Laboratory
Transcript of Evaluating radiation-induced noise effects on pixelated ... · Evaluating radiation-induced noise...

Evaluating radiation-induced noise effects on pixelated sensors for the National Ignition Facility
Evaluating radiation-induced noise effects on pixelated sensors for the National Ignition Facility
CASIS Workshop 2014
A. Manuel, P. Datte, M. Eckart, H. KhaterLawrence Livermore National Laboratory
beauchamp4
Typewritten Text
LLNL-PRES-654737
beauchamp4
Typewritten Text
beauchamp4
Typewritten Text

National Ignition Facility (NIF)
• The National Ignition Facility (NIF) is a 192 beam laser facility designed to support the Inertial Confinement Fusion (ICF) program.
• The facility was designed to have the capability of producing a deuterium-tritium (D-T) target shot in excess of 20 MJ of energy or 7.1E18 neutrons at 14 MeV.
• A (D-T) target shot will generate 14 MeV neutrons at Target Chamber Center that propagate through the chamber into the Target Bay with multiple scatters, resulting in a high fluence, broad energy band of neutrons.
2
National Ignition Facility intro
National Ignition Facility
NIF Target Chamber
High fluence of 14MeV neutrons during a NIF yield shot is a very unique environment!

All Target Bay components exposed to high fluence 14MeV neutron radiation
• Neutrons emanating from the target chamber scatter as the propagate outwards.
— When neutrons are absorbed, physical changes to the material or device can occur.
• Neutron Project IPT looks at effect on many different systems in the target bay.
— Gives guidance to system for yield shots.
Types of systems in target bay:Determining shot guidance:
3
Planning for neutron radiation

4
NIF radiation can degrade many alignment and diagnostic cameras
The high fluence of 14MeV neutrons during a NIF yield shot degrades image quality (increased dark current) and can cause communication upsets in CCD/CMOS imagers. In this presentation we develop a new method to evaluate camera system exposed to neutrons.
Camera system locations
• Camera systems exist on all levels of NIF
• Facility systems include:• Target Alignment Sensor
(TAS)• Chamber Center Reference
System (CCRS)• Chamber Interior Viewing
System (CIVS)• Final Optics Damage
Inspection System (FODI)
• Diagnostics systems include:• VISAR• Backscatter (FABS & NBI)• SXI• Gated Imagers
Sectional view of the target bay at the equator

NIF radiation increases dark current in cameras
• Monitoring the performance of the camera is important to tracking its health and planning.
— Background (dark field) images are captured before and after every high yield shot.
5
A sensor exposed to 14 MeV neutrons exhibits short and long term damage that is manifested by “stars” (pixels with increased dark current).
Background images
A histogram of a 12 bit CCD sensor exposed to a cumulative fluence of greater than 1×10¹⁰
14MeV neutrons/cm2 shows the positive growth in dark noise.

100 101 102 103100
101
102
103
104
105
106
Pixel Counts +1
Num
ber o
f pix
els
Neutron damage for CIVS 90_278_Narrow, Camera model: Basler A641f, SN# E71241
N110201 POSTN111103 PREN120316 PREN120422 POSTN120920 POSTN130505 PREN130802 POSTN140128 POSTN140225 PREN140225 POSTN140304 PREN140304 POSTN140304 POSTN140311 PREN140311 POSTN140511 PREN140511 POSTN140511 POST
10-3 10-2 10-1 100
10-6
10-5
10-4
10-3
10-2
10-1
100
Normalized pixel counts
Frac
tion
of p
ixel
s
90% of well depthavailable for 99% of pixels
Normalized reverse sum histogram plot with same data
Alternative plot to view pixel damage
• A normalized reverse sum histogram plot in log-log space shows changes well to small numbers of pixels.
— This is the “inverse cumulative probability function” for the histogram of pixel ADC dark noise counts.
Knee (mean dark
current)
(Almost) new camera
100% of pixels are fully saturated
Dark current increases with increasing yield
100% of pixels have count 0 or higher
6Can we predict how these curves are going to move as the cumulative yield increases?
0 0.1 0.2 0.3 0.4 0.5 0.6 0.7 0.8 0.9 10
0.1
0.2
0.3
0.4
0.5
0.6
0.7
0.8
0.9
1
Fraction of pixels
Ava
ilabl
e w
ell d
epth
Neutron damage for CIVS 90_278_Narrow, Camera model: Basler A641f, SN# E71241
N110201 POSTN111103 PREN120316 PREN120422 POSTN120920 POSTN130505 PREN130802 POSTN140128 POSTN140225 PREN140225 POSTN140304 PREN140304 POSTN140304 POSTN140311 PREN140311 POSTN140511 PREN140511 POSTN140511 POST
Available well depth decreases with increasing yield
7
Available well depth
100% of pixels are fully saturated
Dark noise limits available
well depth
0.9 0.91 0.92 0.93 0.94 0.95 0.96 0.97 0.98 0.99 10.85
0.9
0.95
1
Fraction of pixels
Ava
ilabl
e w
ell d
epth
Neutron damage for CIVS 90_278_Narrow, Camera model: Basler A641f, SN# E71241
• The histograms of pixel values in the dark field images can be plotted as curves of available well depth vs. fraction of pixels to provide information as to the health of the sensor through time.
• Every pixel has dark noise, so the available well depth can never be 100% (i.e. With a 12-bit camera and 100 counts of dark noise: ) = =98%
Available well depth decreases with increasing yield

How do we predict noise at a future date?
• Steps to predict the noise after additional neutron exposure:— Find a function that fits the observed data.— Determine how the fit coefficients depend on yield for the
images captured so far.
• You will see in the slides to come:— For a new camera, the pixel dark current follows one
distribution function.— During a yield shot, some fraction of pixels are affected by
neutrons, and will subsequently follow a different distribution.
— The total distribution of pixels is a weighted distribution of the two functions:
— This weighting factor is linearly dependent on yield.
Author—NIC Review, December 2009 8NIF-0000-00000s2.ppt
1
Predicting noise

Histogram of undamaged sensor
9
Sensor histogram
; ,12
For an undamaged sensor the dark current can be represented by a Gaussian function. The mean value of the dark current is , with standard deviation .
• A histogram representation of an undamaged 12 bit CCD sensor dark field image where the horizontal axis represents the pixel intensity values in counts. The same data is displayed in each graph; however the plot on the right is shown in log-log space.
Log-LogLinearDark Current-Mean value: Standard deviation:

Gaussian function and the normalized reverse sum histogram.
10
; , 1 ; ,
; , ; ,12 1 erf
2
erf2
The reverse sum histogram for a Gaussian distribution with no radiation damage is:
where Φ(x;μ,σ) is the cumulative probability distribution function for a Gaussian equation
The error function above is given by the following equation
Gaussian function represents undamaged pixel dark current in counts. A reverse sum histogram for this function can be described as the Error function.
Gaussian Representation of Dark Current

Example Gaussian probability distributions for undamaged pixels
11
A. Gaussian probability distribution functions which represent the dark current in undamaged CCD pixels
B. Normalized reverse sum histograms on linear plot C. Normalized reverse sum histograms on a log-log
plot
B
CA
Example Gaussian probability and the associated normalized reverse sum histograms for undamaged pixels representing the sensor dark current. The mean and standard deviation are chosen to describe a typical undamaged sensor.
Reverse Sum Histogram of a Gaussian

Equations describing a damage curve after being exposed to neutrons
• When a sensor is exposed to neutrons, more pixels have more dark noise• There are exponentially fewer pixels of very high ADC counts than
pixels lower counts (true for the values above the mean dark noise)• The probability distribution function for just the damaged pixels is a well-
described by an exponential function convolved with a Gaussian
12
; , ,12 1 erf
2
; , , 1 ; 0, ⁄ ; ,
Ex-Gauss Function Description
Ex-Gauss function is described as:
x- represent the dark current amplitude- mean dark current- standard deviation of the Gaussian – is the exponential decay coefficient
The reverse sum histogram for the Ex-Gauss is:
Where u = (x-)/, v = / and (x;,) is the cumulative probability for a Gaussian discussed earlier

Example of Ex-Gauss probability distributions for damaged pixels
13
A
B
C
A. An exponentially modified Gaussian probability distribution function representing sensors with damaged pixels.
B. Normalized reverse sum histograms for this function displayed linearly.
C. Normalized reverse sum histograms for this function displayed in log-log.
• The sample values chosen for the mean, standard deviation and exponential decay are typical of those found describing the damaged pixels for our CCDs.
Ex-Gauss Function Reverse Sum Histograms

Parameters describing sensor pixel damage based on reverse sum histogram
14
; , , , ; , 1 ; , ,
; , , , ; , 1 ; , ,
Analytical Solution to Reverse Sum Histogram
• The total probability distribution function is the sum of the Gaussian and exponentially-modified Gaussian functions for the observed statistics. Each function separately describes the undamaged and damaged pixels.
• A weighting factor (0≤ ≤1) changes that fraction of pixels that follow each distribution, so the net probability distribution function can be described by the following equation:
The reverse sum histogram for this function is then:
• The four parameters (μ,σ,,a) represent the pixel parameters of the graph in relation to well depth capacity and pixel damage population in relation to neutron yield.

Plot describing probability of lost well depth as a function of counts for different cumulative yields
15
Cumulative Yields
Data 1 - Yield: 1.1E15
Data 2 - Yield: 4.3E15
Data 3 - Yield: 7.6E15
Normalized Reverse Sum Histogram (real data)
Reverse sum histogram data with best fit curves for three images taken after increasing yields. Point “A” represents at least 50% of the well depth is occupied for 0.001% of the pixels in the array.
Fit values are: (μ,σ,,a) =
1- (138.4,28.1,567.9,0.99971)
2- (137.8,28.2,506.4,0.99822)
3- (138.1,28.2,565.7,0.99674)
A
50% Occupied

Plot to predict the sensor pixel damage as a function of neutron yield
• With the best fit parameters , , , known, the fourth parameter “ ”, which describes the weighting between undamaged and damaged pixels has a linear dependence on yield.
• This parameter “ ” can be used to describe the number of damaged pixels by the equation:
• A plot can be generated describing the linear representation of damaged pixels vs. shot yield
Plot to Predict Sensor Damage
1
The plot of damaged pixels as a function of yield can now be used to predict future camera damage. For this camera, the slope is 90.8 damaged pixels per 1E14, 14 MeV neutron yield.

Summary
17
Summary
• We have described a series of algorithms for a two dimensional representation of graphic data that allow for the succinct visual evaluation of an image sensor performance when exposed to a neutron radiation field.
• Several figures-of-merit can be easily track over time leading to a quantitative relationship between exposure to radiation damage and the performance of the imaging sensor array.
• Also we have implemented a novel technique that allows for the prediction of future image sensor performance based on the response function of existing radiation exposures.
• Information that can be extracted from the plot include but not limited to dark current and well depth values based on pixel population, charge transfer efficiency failures, and radiation damage performance effects over time.

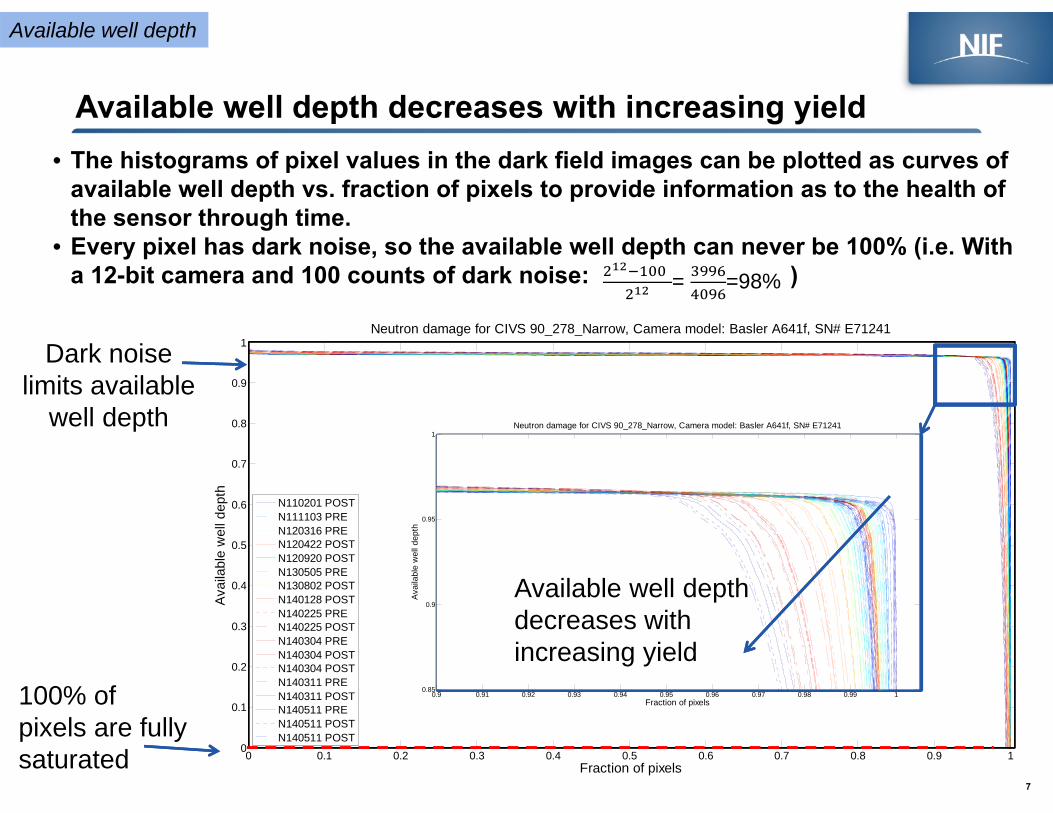
Test Program
Radiation Rate Notes
Ohio test accelerator
14MeV neutron(nearly mono energetic)
CW 10 Rads/day (very slow)
Test instrumentation, electronics subsystems and components
LLNL gamma test well
Gamma (wrong energy)
CW 1.54kRad/min at source (wet)1.5kRad/hour in the dry well
Cobolt-60 source
LLNL NIF test well
14MeV neutron Pulsed 10 Si Rads/shot at 1E16 Yield at TCC
Unshielded in target chamber, 4.5m from TCC
LLNL NIF operation
14MeVneutron
Pulsed Shielded by target chamber, >6m from TCC
Test Program