ETHEKWINI ELECTRICITY Us/Documents... · • 132 kV Bus sections - Preliminary design stage on a...
66
ETHEKWINI ELECTRICITY ANNUAL REPORT 2018
Transcript of ETHEKWINI ELECTRICITY Us/Documents... · • 132 kV Bus sections - Preliminary design stage on a...
ETHEKW
INI ELEC
TRICITYAN
NU
AL REPO
RT2018

EXECUTIVES
HEAD: Electricity UnitMaxwell Mthembu
Deputy Head:CommercialJohannes Kekae (Acting)
Deputy Head:MV/LV OperationsVeer Ramnarain
Deputy Head:Customer & Retail ServicesPhumzile Sibisi
Deputy Head:Technical SupportRaj Dhrochand
Senior Manager:Human ResourcesSthembile Tobo
Deputy Head:HV OperationsRoy Wienand
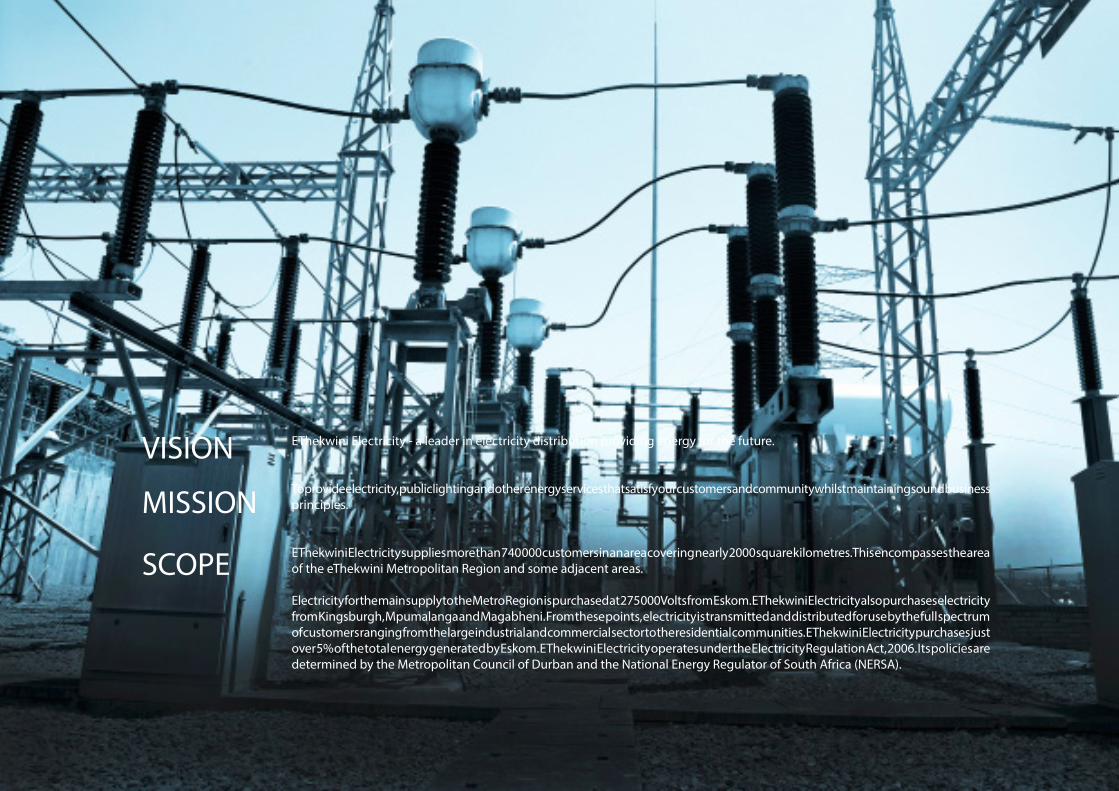
EThekwini Electricity - a leader in electricity distribution providing energy for the future.
To provide electricity, public lighting and other energy services that satisfy our customers and community whilst maintaining sound business principles.
EThekwini Electricity supplies more than 740 000 customers in an area covering nearly 2000 square kilometres. This encompasses the area of the eThekwini Metropolitan Region and some adjacent areas.
Electricity for the main supply to the Metro Region is purchased at 275 000 Volts from Eskom. EThekwini Electricity also purchases electricity from Kingsburgh, Mpumalanga and Magabheni. From these points, electricity is transmitted and distributed for use by the full spectrum of customers ranging from the large industrial and commercial sector to the residential communities. EThekwini Electricity purchases just over 5% of the total energy generated by Eskom. EThekwini Electricity operates under the Electricity Regulation Act, 2006. Its policies are determined by the Metropolitan Council of Durban and the National Energy Regulator of South Africa (NERSA).
VISION
MISSION
SCOPE
GRAPHSSystem Maximum DemandEnergy Sales per AnnumGrowth of Bulk CustomersAverage MWh per Bulk CustomerGrowth of Business and General CustomersAverage kWh per Business and General CustomerGrowth of Credit Residential CustomersAverage kWh per Credit Residential CustomerGrowth of Prepayment CustomersAverage kWh per Prepayment CustomerOverall Growth of CustomersOverall Average kWh per CustomerNumber of EmployeesEnergy Sold per EmployeeFree Basic Electricity Claims per MonthAverage Monthly Free Basic Electricity ClaimsDistribution of Energy SalesDistribution of Revenue from SalesDistribution of ExpenditureNew Connections per Region
39 -54ANNUAL FINANCIAL STATEMENTSStatement of Financial Position at 30 June 2017Statement of Financial Performance for the year ended 30 June 2017Statement of Financial Changes in net assets for the year ended 30 June 2017Notes to the Financial Statements or the year ended 30 June 2017
55-57 STATISTICAL DATACustomer Base StatisticsMaximum Demand andEnergy Sales per annum
HV OPERATIONSDEPARTMENTDepartment Overview HV Planning BranchHV Projects BranchHV Substations BranchHV Lines BranchHV Cables BranchHV Network Control Branch
MV/LV OPERATIONSDEPARTMENTDepartment OverviewConstruction Planning and Works BranchMaintenance BranchLighting Planning BranchLighting Works BranchNetwork Control Branch
TECHNICAL SUPPORTDEPARTMENTDepartment OverviewCommunication Networks BranchElectrical Workshops BranchMechanical Workshops BranchNetwork Drawing Officeand Survey BranchProtection and Test BranchTechnology Services Branch
2-6 17-21 28-38
12-16
CUSTOMER AND RETAILSERVICES DEPARTMENTDepartment OverviewPricing and Marketing BranchContact Centre BranchMeter Engineering BranchCustomer Services BranchRevenue Protection Branch
HUMAN RESOURCESDEPARTMENTDepartment OverviewHuman Resources Branch
COMMERCIAL DEPARTMENTDepartment OverviewAdministration & Transport BranchInformation & CommunicationTechnology BranchFinance BranchSupply Chain Management BranchProductivity BranchBusiness Risk Control Branch
C O N T E N T S
7- 11 22-23
24-27

1
EThekwini Electricity Annual Report | 2016/17
HEAD’S OVERVIEW
“I take comfort in knowing that my team of executives, managers and staff in general will join me on this journey by being determined and more focused in our efforts to deliver our essential service to the citizens of Durban.”
HEAD: Electricity UnitMaxwell Mthembu
1
I have always held the view that electricity is a fundamental contributor to the economy and the well-being of its citizens. It is with this view that I have spent my career in various roles within the electricity industry, which has culminated in my current role as Head of EThekwini Electricity. My vision is to steer the unit to embark on various drives and programs that will enable eThekwini Electricity to provide safe, affordable and reliable electricity connections to each home within our City, as I believe that access to electricity is one of the major keys to a better life for all of our people. I take comfort in knowing that my team of executives, managers and staff in general will join me on this journey by being determined and more focused in our efforts to deliver our essential service to the citizens of Durban.
Although the previous financial year was a very tough one, considering the country’s economic climate, I am pleased to report that the unit was able to uphold its promise of tangible service delivery by electrifying both formal and informal homes for the first time. My dedicated team was able to deliver on numerous electrification programs completed during the financial year.
This is a notable achievement and testament to the unit’s commitment to the city’s vision 2030 and to our people. The National Energy Regulator of South Africa (NERSA) approved our application for an increase of 6.84 % for our customers on active tariff structures as well as for our customers who remain on our obsolete tariffs. The unit noted a decrease of 0.5% year-on-year in the energy sold by the unit. This is in line with the national energy sales and is a clear indication that the traditional electricity business is in need of reform to ensure its sustainability going into the future.
Eskom Bulk electricity purchases accounted for 64 % of the total expenditures. With sound expertise, we were able to keep our electrical infrastructure in good operating order with expenditure of over R 1 billion or 8.4 % spent in the repair and maintenance of. The balance was spent on human resources, general expenses and contracted services. Work on various new substations is in progress and expected to come on line in the coming years. This will add an additional strength to our network and reassure our security of supply to our customers.
As we find ourselves on the brink of the fourth industrial revolution, I am proud to announce that the unit has grown with the realization of the new Asset Management Branch, which is dedicated to optimizing the use of our assets throughout their lifecycle. Furthermore, the SMART Metering project is a mere breathe away from being made available to all our customers and enabling us to take a step forward in the journey to becoming a SMART City. Currently, various pilot projects are in their final stages and preliminary results show a great potential for the residents of eThekwini Municipality. This is a notable achievement and testament to the unit’s commitment to the city’s vision 2030 and to our people.
In closing, I would like to thank all the staff of the Unit for their efforts during year. Their contribution and hard work brings the city of eThekwini a step closer to being Africa’s most caring and livable city. I welcome the many achievements and challenges of the coming years with open arms as I believe my team at eThekwini Electricity will continue to shine and bring much needed light to our people.
2
EThekwini Electricity Annual Report | 2016/17
The HV Operations Department is responsible for the planning, construction, operation and maintenance of eThekwini Electricity’s primary network of high voltage cables, lines and substations. The projects undertaken by this Department are to provide for increased bulk capacity and to improve the reliability of the regions HV electricity supply. Accordingly they are typically large, high cost projects which require considerable time and attention to satisfy environmental legislation in the first instance and then 30 months or more in the construction phase. Our Department prides itself in reliable, state of the art solutions for the delivery of high voltage power from our intake points to our customers and secondary networks.
• 132/11 kV Longcroft Substation• 132/11kV Phoenix North Switching Station 132 kV Oil Filled Cable Replacement (CBD)
New Technologies•Bentley3DSubstationSoftwareacquired
• Progress on existing projects• 132/11 kV Cornubia 1 Substation – Land acquisition stage• 132/11 kV Inyaninga 1 Substation – Budget estimate stage• 132/11 kV Inyaninga 2 Substation – Budget estimate stage• 132/11 kV Morelands Substation Upgrade – Final design
stage• 132/11 kV Moriah Substation – Land acquisition stage• 132/11 kV Sibaya Substation – Preliminary design stage• 132/11 kV Verulam Substation – Land acquisition stage• 132 kV Oil Filled Cable Replacement to Sapref Refinery –
Servitude acquisition stage• 275 kV Durban North Substation Yard Upgrade – Budget
estimate stage• 132/11 kV Waterfall Substation Yard Upgrade – Budget
estimate stage• 275 kV Durban South Transformer replacement and
Switchgear Upgrade – Final design stage• 132 kV Bus sections - Preliminary design stage on a few• 132/11 kV Redfern Substation – Land acquisition stage• 132/11 kV Roberts Substation expansion – Land
acquisition stage• 132/11 kV Reservoir Hill SS – Preliminary design stage• 132/11 kV Phoenix Industrial Substation bus section –
Preliminary Design Stage
Key challenges• Delays in obtaining clearance for new high voltage
infrastructure in the immediate vicinity of King Shaka International Airport from Civil Aviation Authority
• Expansion of high voltage networks in the northern and western suburbs are dependent on Eskom’s strengthening its network to the City which risk delays due to resource constraints at Eskom
• Maintaining servitudes due to unplanned excavations by other various service providers. This may cause an interruption in electricity supply due to damage to
electrical infrastructure.• Acquisition of sites and servitude within the city central
due to lack of vacant sites available for construction of new supporting substations
Achievements • Updated geographical load forecasting model• High voltage master plan – Updated• Appointed support staff in drawing office
HV PROJECTS BRANCH • The HV Projects Branch is responsible for the detailed
design, specification of equipment and management of major system reinforcement projects which includes cables, lines and substations with voltages ranging from 275 to 11 kV.
Highlights
• Completion of the project to replace the 132 kV oil filled double circuit cables from Rossburg to Congella substations with XLPE cables.
• Completion of the project to replace the 132 kV oil filled double circuit cables from Grosvenor sealing end to Dalton Substation with XLPE cables.
• Replacement of the two 275/132 kV Durban North Substation transformers within four months thereby significantly reducing the risk to the city grid.
• Completion of various Branch Codes of Practice.
New Technologies
• Installation of the first double busbar fixed pattern switchgear in the network at Umlazi Substation.
• Introduction of arc protection to replace the conventional buszone protection for the new 11 kV switchboards.
H V O P E R A T I O N S
HV PLANNING BRANCH
OVERVIEW
The HV Planning Branch is responsible for planning the unit’s primary network of high voltage cables, lines, switching stations and substations. The timelines for providing HV infrastructure spans several years and therefore necessitates careful planning so as to ensure that there is sufficient HV infrastructure in place to meet the demand of all customers in a sustainable manner. The HV Planning Branch is the custodian of the transmission network master plan which is inclusive of a 20 year capital program that allows for HV network development, reliability requirements and refurbishment requirements. Analysis of the transmission network is carried out using system analysis software for network load flows and voltage stability and fault level analysis. Key initial capital project life cycle processes; namely application for Council funding, acquisition of land and servitudes, environmental impact assessment approvals and completion of preliminary designs is also completed by the branch.
Highlights • Handed over the following to HV Projects Branch
for execution:• 132/11 kV Isipingo Substation
EThekwini Electricity Annual Report | 2017/18
2 2
3
EThekwini Electricity Annual Report | 2016/17
Key Challenges
• Delays and costs due to servitude co-use requiring different construction methodologies
• Delays and costs due to theft of materials such as copper remains a huge challenge.
• Delays due to increased trend of communities rioting for increased quotas of local labour.
• Network constraints dictate the availability of existing plant and sometimes affect progress especially at
brownfield sites.
Progress with current projects • Addington Transformer: Replacement of the 132/11 kV
transformer. Transformer ready for commissioning.
• Alice Street 132/11 kV Substation: Upgrade of the substation with two additional transformers and replacement of the existing 11 kV board. Civils design underway.
• Austerville 132/11 kV Substation: New 132/11 kV substation aimed at relieving the aged 33/11 kV substations in the Jacobs area and further reinforcing the 11 kV network. Civil design completed. Procurement of civil works in progress.
• Avoca 132/11 kV Substation: The commercial and residential load demand in the area has increased and the firm capacity needs to be upgraded from 30 MVA to 60 MVA. Two new transformers 30 MVA transformers have been delivered and are currently in commissioning stages.
• Bulwer 132/11 kV Substation: The commercial and residential load demand in the Glenwood area has increased and the 11 kV system needs to be reinforced. Civil works completed and critical equipment procured.
• Congella Transformer: Replacement of the 132/11 kV transformer. Transformer ready for energising.
• Dalton-Cathedral 132 kV Cable Replacement: Replacement of old oil filled cables spanning 2 km with XLPE cables. Installation of the cables in progress.
• Durban North Transformers: Replacement of the two 275/132 kV transformers. Completed.
• Durban South 275 kV Bus Section: Required to improve the security of supply at this strategic substation. Installation of plant and equipment pending network constraints.
• Grosvenor-Dalton Road 132 kV Cable replacement: Replacement of old oil filled cables spanning 5.3 km with XLPE cables. Cable installation completed.
• Hillcrest Transformer: Replacement of the 132/11 kV transformer. Transformer ready for commissioning.
Jacobs 132/11 kV Substation: Addition of the 132 kV GIS to provide switching flexibility and reinforce the Jacobs 132 kV network by creating links between HV substations in the area. Civil works underway and 80% completed.
• Jameson Park 132/11kV Substation: The commercial and residential load demand in the area has increased resulting in the need to upgrade the existing 33/11kV Substation and replace it with two new 30 MVA 132/11 kV transformers and associated plant and equipment. Civil works and installation of the GIS completed. Cable works in progress.
• K E Masinga 132/11 kV Substation: The commercial and residential load demand in the city area has increased and the 11 kV system needs to be reinforced. Major plant installed. Cable works completed.
• Kingsburg 132/11 kV Substation: The commercial and residential load demand in the area has increased and the firm capacity needs to be upgraded from 30 MVA to 60 MVA. Detailed civil design in progress.
• Klaarwater 275/132 kV Substation: Upgrade current four 250 MVA transformers to 315 MVA due to the increase in load. First transformer commissioned. Installation of the second transformer underway. Two transformers have been relocated.
• Kloof Substation 132/11 kV Substation: New 132/11 kV substation aimed at replacing the ageing Kloof Substation and increasing reliability in the area. Civil designs completed. Procurement of the civil works in progress.
• La Mercy 132/11 kV Substation Reinforcement: The commercial and industrial load demand in the area has increased and the firm capacity needs to be upgraded from 30 MVA to 60 MVA. Additional transformers have been installed. Commissioning in progress.
• Mahogany Ridge 132/11 kV Substation: The commercial
and residential load demand in the Westmead and Mahogany Ridge areas has increased and the 11 kV system needs to be reinforced with additional 60 MVA firm capacity. Detailed civil designs completed. Procurement of civil works underway.
• Ntuzuma Transformer: Replacement of the 132/11 kV transformer. Transformer ready for commissioning.
• Old Fort-Addington 132 kV Cable Replacement: Replacement of old oil filled cables spanning 3 km with XLPE cables. Installation of the cables in progress.
• Ottawa 132/11 kV Substation: The commercial and industrial load demand in the area has increased and the firm capacity needs to be upgraded from 30 MVA to 60 MVA. Additional transformers have been delivered. Commissioning underway.
• Plangweni 132/11 kV Substation: Due to load growth the existing substation is required to be upgraded from 30 MVA to 60 MVA. Commissioning completed.
• Rossburg-Congella 132 kV Cable Replacement: Replacement of old oil filled cables spanning 3 km with XLPE cables. Completed.
• Rossburgh 132/11 kV Substation: New 11 kV capacity to replace the 33 kV network that is being phased out. Civil works completed. Awaiting delivery of the equipment.
• Springpark 132/11 kV Substation: The commercial and industrial load demand in the Springpark area has increased and the 11 kV system needs to be reinforced. Civil works completed and critical equipment has been delivered.
• Stockville 132 kV Switching Station: New switching station proposed to feed the new proposed substations in the Mahogany Ridge and Kloof areas. This switching station will also feed the existing Westmead, Marrianridge, Hillcrest and Waterfall Substations which will eliminate security of supply risks and operational limitations which apply to existing circuits. Site works about 30% complete.
• Umdloti Beach 132/11 kV Substation: The commercial and residential load demand in the area has increased and the firm capacity needs to be upgraded from 30 MVA to 60 MVA. Transformers previously relocated. New replacement transformers have been installed. Commissioning underway.
HV OPERATIONS EThekwini Electricity Annual Report | 2017/18
33
4
EThekwini Electricity Annual Report | 2016/17HV OPERATIONS
• Umlazi 132/11 kV Substation: Replacement of the damaged 11 kV switchboard. First phase of the board ready for commissioning. Installation of the second phase
to commence shortly.
• Underwood 132/11 kV Substation: The commercial and residential load demand in the Pinetown area has increased and the 11 kV system needs to be reinforced. Civil works completed and critical equipment has been delivered.
• Verulam 33/11 kV Substation: The two aged transformers need to be replaced with new ones to improve security of supply in this area. Both transformer shave been delivered and are currently being commissioned.
• Westmead 132 kV Bus Section and Transformer: Required to improve the security of supply at this substation. Detailed design of the bus section completed. Transformer has been energised.
• Woodlands 132/11 kV Substation: Upgrade of the current 132/33 kV substation. Civils design underway.
• Replacement of the old 11 kV withdrawable switchboards with new fixed pattern type at Alice Street, Bayhead, Esplanade, Isipingo, Prospecton and Toyota substations: Replacement plans completed. Procurement of temporary switchboards to facilitate the replacements is in progress.
Future Plans• Continue with the acceleration of the replacement of oil
filled underground cables constituting the bulk of the city’s cable network.
• Prioritize the procurement schedule to facilitate completion of the projects in commissioning stages.
HV SUBSTATIONS BRANCHThe HV Substations Branch is responsible for the operation and maintenance of equipment that has voltage ranging from 11 kV up to 275 kV. There are four National Key Point substations that import energy from Eskom at 275 kV. The 275 kV is then transformed to 132 kV, 132 kV transformed to 33 kV and 11 kV, and 33 kV is then transformed to 11 kV and in few cases to 6,6 kV.
The types of equipment that the HV Substation Branch is responsible for includes, but not limited to, busbars, capacitors, circuit breakers, instrument transformers, isolators, lightning masts, power line carriers, power transformers and surge arresters.
Highlights• The condition assessment undertaken on the eThekwini
Electricity’s high voltage power transformer fleet revealed that a number of transformers require oil conditioning work with the aim of reducing the short term risk of failures due poor oil condition and also to extend the remaining life of these transformers. In order to address this, the Branch has purchased two online power transformer drying units to ensure that transformers are dried out without having to take them out of service, thereby ensuring continued equipment availability. The deployment of these units to various sites is expected to improve the condition of the power transformers thereby minimising the risk of failure.
• Significant progress was made in the compilation and implementation of some of the once-off and periodic Network Reliability Programmes (NRPs).
• The decommissioning of old substations with oil switchgear, namely the Engen Tara 1 Substation and Sydenham Substation.
• The Branch managed to fill three critical posts, namely the Superintendent post, Clerk of Works post
• The Branch also made significant progress with staff development. All the Electricians who were pre-competent in 2016-17 are now competent and one other Electrician also attained his 11 kV Switching Authorisations. This will assist the Branch in terms of efficient maintenance work planning and execution.
Lowlights
• The incidents of copper theft in HV substations are on
the rise and they are threatening the functionality of
substations.
• The delay in the installation of CCTV cameras in substations to deter the prospective copper thieves.
• The failures of two 275 kV power transformer in Durban
North Substation.
Challenges
• The oil circuit breakers are of old technology that render
themselves uneconomical to maintain and unsafe to
operate. Consequently they are gradually being phased
out and replaced by vacuum and gas circuit breakers.
However there is still a large number of oil circuit breakers
present in substations especially at 11 kV and also at 33
kV. As a result more resources (staff, labour, material, and
time) are spent on maintaining this type of switchgear.
There are frequent problems associated with their old
age such as shortage of spares, mal-operation and severe
failures. The decision was taken to phase out 33 kV plant
and equipment because of age and other associated
problems such as unavailability of spares and multi
transformation. The decommissioning of such plant and
equipment has been made possible by construction of
new 132/11 kV substations.
• The difficulty in filling a number of vacant crucial positions within the Branch also continues to be a challenge. This is limiting the Branch’s capability in undertaking maintenance work effectively and efficiently and thus exposes the equipment to increased risk of failure.
Future Plans
• The replacement of 132kV breakers that are not
performing well especially those that are gas insulated.
• The installation of 132kV bus section breakers in existing substations to enhance the ability to swing the load efficiently during fault conditions and during maintenance activities.
• The creation of safe zones on substation entrances to enhance the security of personal.
• The installation of bund walls around power transformers to protect the environment from spilled oil.
• To increase the number of staff personnel in order to meet the challenges of increasing plant and equipment
HV OPERATIONS EThekwini Electricity Annual Report | 2017/18
4
5
EThekwini Electricity Annual Report | 2016/17
and to reduce backlog in maintenance.
HV LINES BRANCHThe HV Lines Branch is responsible for the operation and maintenance of the high voltage overhead lines network consisting of 141 circuit kilometres of 275 kV, 478 circuit kilometres of 132 kV and 13 circuit kilometres of 33 kV overhead line.
Progress on existing Projects• Continuous detailed condition assessment to determine
the remaining life of existing 132 kV and 275 kV overhead lines and needs analysis for refurbishment.
Refurbishment of the following assets:
• Klaarwater - Umgeni 132 kV Double Circuit Line: Painting of structures
• Klaarwater - Woodlands 132 kV Double Circuit Line: Painting of structures and re-insulation
• Klaawater - Quary 132 kV Double Circuit Line: Re-insulation
• Quary - Bellair 132 kV Double Circuit Line: Re-insulation
Uprated the following assets:• Klaawater – Hillcrest 132 kV Double Circuit Line section
between Tower 31 to 57 was uprated from single to twin ELM which increased the capacity from 100 MVA to 206 MVA.
• Klaawater-Umgeni 132 kV Double Circuit Line was uprated with High Temperature Low Sag Conductors (HTLS) which increase capacity from 206 MVA to 350 MVA. By using this type of conductor the existing structures were used which saved the municipality millions of rands and reduced the project time frame. This was the first of its kind project for eThekwini Electricity and second in the country.
Relocation of the following assets:• The relocation of Tower 18 to 20 of the Parlock - Mzinyathi
132 kV Double Circuit Line to accommodate the construction of the new Westridge Mall in Newlands is in progress and anticipated completion by the end of year 2018.
Challenges• Encroachment of asset servitude and corridors still remain
the highest risk to the infrastructure: This challenge need proper enforcement of Municipal laws and policies.
• Illegal electricity connections making use of high voltage towers to attach wires for elevation hence delaying/preventing inspection and maintenance of these infrastructures. Many cases officials are intimidated and threatened.
• Illegal dumping preventing access for inspection and maintenance.
• Difficulty in meeting employment equity targets hence results in an increase in vacancies: A program to train and upskill personnel, specifically the target group as per the employment equity plan will need to be developed and implemented urgently.
• Suitable off road (4×4) vehicles is still a challenge as the access roads are becoming more difficult to negotiate with the encroachment of informal settlements and developments within the power line corridors: This will be mitigated by working with Roads and City Fleet Department to build suitable access roads and procure suitable vehicles respectively.
Successes Received • Phase one of the vegetation management plan was
implemented successfully and for this reason, no vegetation related disruption to the HV Lines network was experienced.
• The branch won the South African Asset Management Association (SAAMA) best team award on Asset management improvement at the SAAMA June 2018 conference in Cape Town.
Future Plans• Conduct research and development of new technologies
such as the implementation of Line Monitoring System that will provide online data to allow immediate and better decision to be made on the management and operation of the high voltage network.
• Focus on access roads maintenance.
• Continue with asset construction and refurbishments project.
• Participate on national and international technical platform to learn and share knowledge with other utilities.
• Conduct research on the use of satellite images to monitor and control servitude encroachments.
• Use of weather information systems to analyse electrical network disruptions and improve response times during adverse weather conditions.
HV CABLES BRANCHThe HV Cables branch is responsible for operation and maintenance of the 132 kV and 33 kV underground power cable assets that forms part of the primary network. The construction and the maintenance of 11 kV cables within the boundaries of major substations is also part of HV Cables responsibility.
Key Challenges• The maintenance of 33 kV pressurised cables and 132 kV
& 33 kV fluid-filled cables continues to be a problem. A number of leaks and faults had to be located and repaired on several strategic cables which have now been in service in excess of 40 years. Minor leaks are maintained by pressurising these circuits before they reach minimum operating pressures. Several 33 kV circuits have already been decommissioned with the new 132 kV substations being commissioned.
• Supply Chain challenges on the maintenance and excavation contracts have had a negative impact on the operations. Cable Serving faults and cable damage by third parties are still a major problem. The Legal department are exploring the amendment of bylaws prohibiting excavation without authority.
• A number of cables had to be relocated to suit major development projects within the city i.e. (Bus Rapid Transport System, new Umhlanga interchange and bridge)
• Copper theft of loop cables has grown at an alarming rate. There have been incidents at both substations with permanent security guards and without. Cables are being stolen whilst the circuits are off, being repaired or awaiting the replacement of transformers.
HV OPERATIONS EThekwini Electricity Annual Report | 2017/18
35
6
EThekwini Electricity Annual Report | 2016/17
New Technologies• The new 132kV XLPE cables have been designed with full
conductor and metallic sheath water blocking advantages. This eliminates the replacement of long length of cables due to damage of faults in waterlogged areas.
• The newly laid circuits all have DTS (Distributed Temperature Sensing) laid on the white phase, to monitor temperature variation along the length of the cable. This is an optoelectronic device that measures temperatures by means of optical fibres functioning as linear sensor. Temperatures will now be recorded along the optical sensor cable, thus not at points, but as a continuous profile. This will mean that we are able to notice areas of concern and attend to them as preventative maintenance tasks, and that the thermal restrictions on cables can be effectively monitored.
Progress on existing Projects• We currently have eight replacement projects of 132kV
Cable circuits. We are changing from the existing fluid filled and pressure filled cables to XLPE. Projects in progress are Bellair-Dalton, Dalton-Cathedral, Old fort Addington, and Pinetown-Underwood. Complete projects include, Rossburgh-Congella, Old Fort-K E Masinga, and the Durban North-Spring Park substation cut in.
• We intend installing HV Cables road markers for the circuits within the urban areas and at low risk of theft. This will help in identification of the cable route by other services when excavating, thus eliminating a problem we currently have of cable damage by third parties.
Challenges
• The lack of 132 kV skills is a concern within the department and training of electricians to become competent in HV Cables maintenance, jointing and terminating up to 132kV is planned to overcome this challenge. The implementation of the skills development plan is aimed at up skilling the staff in order to ensure effective and correct maintenance and installation of all cables under our care. This is a structured approach to evaluate an electrician at different stages in their careers.
• Re-advertisement of new contract E 9436. Serving tests, location and repair of faults is one of the key areas in
this contract which will ensure integrity of HV Cables to eliminate future faults through water ingress and dielectric breakdown of electrical insulation.
HV NETWORK CONTROL BRANCHThe Network Control Branch comprises of four Divisions: HV Network Control, System Performance, Network Management and Control Systems.
The HV Network Control Division is responsible for the safe operation and efficient performance of the High Voltage Network, which incorporates a 24-hour, manned HV network control centre with remote control and alarm facilities. EThekwini Electricity’s primary transmission network, being the supply from 275 000 kV down to 6 600 kV, is monitored and controlled from the HV Control Room using a sophisticated Supervisory Control and Data Acquisition (SCADA) system.
The System Performance Division is responsible for network optimisation, ensuring the HV network can meet the demand for electricity, statistical reporting and quality of supply to the bulk supply points for the 11 000/6 600 kV distribution system and large industrial customers that are connected directly to the HV network.
The HV Network Management and Control Systems Divisions are responsible for the installation and maintenance of systems that are required for the efficient monitoring and control of the Unit’s critical infrastructure.
Highlights and Lowlights
• The new automatic load shedding suite is currently being utilised to implement planned rotational load shedding, when required by Eskom
• The branch has successfully completed their In-house development of Internet-of-Things (IoT) solution which will be utilised as part of their remote monitoring strategy.
New Technologies
• The Branch will be procuring the latest technology power quality instruments and a new Power Quality Management Analysis System (PQMAS) to manage power quality near real time and improve situational awareness and decision making in the HV Network Control Centre.
• The Branch is researching the need for an Energy Management System (EMS) to perform real time power flow analysis to improve the quality of supply to customers.
• The branch is currently deploying Internet-of-Things (IoT) technology as part of their remote monitoring strategy. This allows for early remote detection of possible failures to high valued critical assets in locations with limited access to power such as road side oil gauge pressure systems. This disruptive technology has allowed the branch to extend grid visibility to power constrained assets at remote locations.
• The branch has procured a Switchplan module to streamline electrical switching operations. This allows for improved outage restoration times and record keeping. Switchplan is designed to enforce and to document the audit trail of the life cycle of a switch plan/procedure, as it transitions through eThekwini Electricity’s structured internal processes
Challenges
• The shortage of HV Control Officers who are required to monitor and control the HV Network continues to be a challenge. These posts require that suitably qualified persons undergo extensive training in managing and operating electrical networks before they can deemed competent to operate on their own. These skills are in demand nationally given that Eskom and other municipalities compete for a very small pool of these scarce skilled employees.
HV OPERATIONS EThekwini Electricity Annual Report | 2017/18
6
7
EThekwini Electricity Annual Report | 2016/17
MV/LV OPERATIONSDEPARTMENT
OVERVIEW
The MV/LV Operations department is responsible for the planning, construction, operation and maintenance of the Unit’s medium and low voltage network. The Department plays a major role in connecting new customers to the electrical grid, thus helping to spread electrical services to all sectors of the Community. The Department is also responsible for providing public/street lighting technologies into the City. Further to the above roles, the Department manages and controls all medium to low voltage substations. Advancements in technology with the benefit of cost/operational optimization is driving significant changes in the electricity supply industry and the MV/LV Department is strategically embracing these advancements to improve the overall operation, stability and reliability of the network. The Department has embraced the Internet of Things and the 4th Industrial Revolution, and is working on various strategies towards the implementation of a Smart Grid, so that we can better serve our customers.
CONSTRUCTION PLANNING & WORKS The core functions of this branch is to design and construct electrical infrastructure to connect new customers to the grid. Demands on the electrical network increase with the addition of new customers, and the higher consumption from existing customers. The network has to be upgraded to ensure adequate reliability and quality of supply.
There has been increasing expectations with regards to service delivery during the year. This branch continuously strives in delivering towards these increasing expectations.
Highlights/Lowlights• Planning and Construction Branch has made progress
with the filling of vacancies. However, much more effort has to be put towards the filling of consequential vacancies due to progression and promotion of existing employees.
• Newly appointed electricians require additional training and experience in specific disciplines for them to be deemed competent to enable them to work independently and safely.
• On adjudication of contracts our rate of delivery improves as our internal resources are supplemented by contractors. The achievements of the branch is acknowledged and appreciated by management, as well as our customers.
• Electrification of formal, informal and rural settlements has continued, although at a lower rate due to a shortage of material and expired contracts. The backlog of dwellings without electricity has reduced from 24.83% to 23.70%. With all the challenges, the branch electrified 9’873 prepaid connection. A grant of R35 million from the Integrated National Electrification Program, funded 3’896 of these connections. This has resulted in a lot more residents of eThekwini can now enjoy a better life.
• This dedicated team wades through all the obstacles and challenges, and at the end of it all, spends its entire capital budgets. This branch was subjected to scrutiny by auditors, and fortunately there were no adverse findings.
Challenges• The inadequate integration between systems hampers
the effective co-ordination of projects between the different role players
• The shortage of materials has resulted in delays in service delivery.
• A large number of projects are implemented by contractors, due to limitation of in-house capacity.
• Illegal connections results in an unsafe working environment. Extreme caution is taken in areas with such hazards, so as to prevent injuries.
Our contracts are in the process of being adjudicated and we look forward to serving our customers more efficiently.
New Technologies• New and modern equipment is introduced into our
networks on an ongoing basis to improve the reliability of the network, and for it to be safer to work on.
New and existing projects• Commissioning of substations for business customers at
89 Barrier Lane; 1445 South Coast Road; 37 Gillitts Road; 9 Trafford Road; 53 Old Main Road; 90 Ashley Drive; 2 Meyrickton Place; 94 Cannon Avenue; 310 Bhejane Road; 2 Sundew Road; Piazza Place; 63 Darby Road; 429 Anton Lembede Road 24 Centenary Boulevard; 20 street 610911; 22 Totum Road; 2 Heleza Boulevard; 4 Duiker Road and 3 Arbour Road
• Installation of infrastructure to supply formal residential developments at 46 St. Ives Road; 109 Padfield Park, 10 Hampshire Road; 24 Josiah Gumede Road; Oakford Housing; Etafuleni Housing and Siren Street
• Installation of infrastructure for the electrification of informal settlements at Damede; Madiba Village; Woodyglen; Foreman Road; Candover Road; Burnwood Road; Howell Road; Dunston Gardens; Blackburn Village; Smithfield; Legacy Road; Bhambayi; Malukazi; Emalendeni; Burlington Station; Bhubesi Road and Hans Dettman Road.
• Switchgear replacement and commissioning at 28 Essex Terrace DSS; 171 Rodger Sishi Road DSS; Earl Haig Road DSS; 5 Walnut Road DSS; Adrienne Avenue DSS; Lotus Park DSS; Quality Street DSS; 60 Milner Street DSS; 91 Somtseu Road DSS; Palmfield & Ashfield DSS; 57 Tomango Road DSS and 81 Teakwood Road DSS.
• Relocation of electrical infrastructure on the Integrated Rapid Public Transport Network route
EThekwini Electricity Annual Report | 2017/18
7
8
MAINTENANCE PLANNING & WORKS BRANCH The Maintenance Planning and Works Branch is responsible for inspection, maintenance planning and maintenance implementation on all medium and low voltage apparatus, as well as repair of associated faults on the electrical distribution network within the municipal supply area. This Branch comprises of six regional Maintenance Works Depots, and a Maintenance Planning Division based at the Electricity Headquarters. The Branch consists of a Senior Manager, Managers, Specialist Engineer, Engineers, Technicians, Electricians and the various levels of administration and assistant staff.
The maintenance of eThekwini Electricity’s distribution network is vital in ensuring the integrity and reliability of supply to our large customer base. This Division prides high standards and strives to comply with various national standards and the Power Quality Charter in order to meet the requirements of customers.
With the ever-growing and ever-aging Electricity Unit’s distribution network, the Maintenance Planning Division is constantly seeking strategies to better manage and maintain all the assets installed on the distribution network to ensure reliable electricity supply to the customers of eThekwini Electricity.
Projects Undertaken
• Copper clad steel earthing conductor project Year on year, the magnitude of copper theft has been increasing and eThekwini Electricity’s substations have been the victims of vandalism. The fundamentals of an electric circuit for distribution require a well-defined electrical system with earth reference. The removal of this reference poses significant risk to eThekwini customers for a number of reasons (Health and Safety, Electrostatic and Lightning Protection). The Branch has spent R1.5 million to procure Copper Clad Steel (CCS) and in particular, discoloured CCS (Camo), as a suitable replacement for earthing. The Maintenance Technicians are currently in the process of installing this conductor to hot spot area. The Branch has a proactive plan to install CCS through the distribution network.
• Replacement of aging overhead line switchgear The Division has replaced over 30 auto-reclosers and over 20 sectionalisers in 2016/17 financial year with the aim of not only replacing due to age and reliability but Smart Grid and most importantly public safety. The current auto-reclosers and sectionalisers are equipped with sensitive earth fault (SEF). For the next two years, the Division has planned to replace all mechanical auto-reclosers and sectionalisers.
• Condition based preventive maintenance The Engineering Support Division has procured four (4) extra partial discharge detection (with TEV and Ultrasonic measurements) equipment from EA Technology. This Division is in the final process of procuring Auto-recloser and Sectionalizer control box testers and two (2) circuit breaker analysers (CBA). The Branch’s Technicians and Engineers are currently being trained by the supplier. The Division has made available R 3.5 million for year 2017/18 to procure 2 sophisticated infrared cameras to detect hot spots and SF6 leaks in the distribution network equipment which forms part of condition monitoring.
Challenges for Forthcoming Year
Reyrolle (LMS, LMT/R), Hawker Siddely (R41, Type V, V41, VBA, VSI) and GEC Power (Oil, Brush gear, Jowison & Phillips) switchgear have reached end of their life and availability of spares and skills to undertake repairs and maintenance are a challenge. This means a replacement plan and capital budget should be in place already. This replacement plan will include replacement of MV underground cables, upgrade of Pad mounted transformers and refurbishment of overhead lines. The replacement of these assets will increase the reliability of the distribution network.
LIGHTING PLANNING BRANCHThe planning, design, inspection and maintenance planning of the public lighting infrastructure for the eThekwini Municipality is undertaken by the Lighting Planning Branch. This includes the planning and design of new lighting installations, upgrading of existing lighting infrastructure, maintenance and maintenance planning of existing installations, research and investigation into new lighting technologies and bulk lamp replacements.
The Lighting Planning Branch comprises 3 Divisions, which are as follows:
• Lighting Planning & Design
• Lighting Research & Investigation
• Lighting Maintenance Planning
The annual operating budget of the Branch is approximately R75 million, which includes a provision of R50 million for street light consumption costs within the municipal area.
The remaining R25 million is allocated to salaries, allowances, general expenses, repairs and maintenance. Repairs and maintenance accounts for 80 percent of the general operating budget and this is further broken down into planned lighting maintenance, bulk lamp replacement and pole painting. There are currently approximately 213 000 streetlight installations, 250 parks, 12 beaches, 17 subway lanes, 31 swimming pools and 93 stadia and sports fields for which the municipality is responsible and provides lighting for.
The Branch has filled 100% of posts within its structure and continues to work on building their skills and experience. The long-term goal of the Branch are to implement modern, energy efficient and effective public lighting systems that are vandal proof and systems that could be easily monitored and controlled.
Lighting Planning & Design Division:
Planning and design of capital projects form a major part of the Branch’s responsibility The annual capital budget for the financial year under review was approximately R5m and projects were planned for upgrades from conventional technologies to LED streetlighting, major route improvements, new major routes, lighting of parks and sundry lighting. Various grant funding options are being evaluated for the installation of LED streetlights to replace the 80W mercury vapour luminaires in residential areas, 150W high pressure sodium (HPS) luminaires on secondary roads and 250W high pressure sodium luminaires on main arterial roads. These funding option include EEDSM, Department of Energy, Swiss and German donor funding. Other major projects for the current and future financial years include; Bridge City to Pinetown on the Integrated Rapid Public Transport Network (IRPTN) route, Illovu Road (Kwamashu), Umgeni Road/N2 Interchange, completion of MR 577 (Kwadebeka), School Road (Verulam), M4 Ruth First
MV/LV OPERATIONS EThekwini Electricity Annual Report | 2017/18
8
9
Northern Freeway, Inanda Road (Waterfall), LED floodlighting and Solar lighting for ablution facilities in informal settlements. The lighting for all High Voltage (HV) substations is currently being audited and upgraded in a phased approach from HPS (orange light) to LED (white light) to cater for the requirements of CCTV cameras. Other significant projects include:
• Redesigned street lighting circuits by removing 9m gum poles and replacing with 9m steel poles and concreting of underground cables where large scale theft and vandalism have occurred in the following areas: Shallcross, La Mercy, Tongaat, Bellair, Verulam and Isipingo.
• Installed 7% LED streetlights mainly in the 36W range to replace the 80W HPMV lamps as part of our commitment to reduce our carbon footprint.
• The following major capital projects were completed; Harinagar Road, Outer Circuit Road, Esselen Crescent, Rose Height Road, Harry Gwala Road, High Terrace, Embuthweni Road, Skyridge Circle, Sishi Main Road, Umdloti Link Road, Izichwe Road, Shezi Road, Inanda Newtown Sportsfield, Cornubia Retail Park, Matabetula Road and Umkumbaan Road.
Many of the projects undertaken by the Branch involves liaison and interaction with other units within the municipality and external entities such as Roads Provision, Architectural Department, Parks, Leisure & Cemeteries, Roads and Stormwater, Strategic Projects, Tongaat Huletts and a host of developers and external electrical consultants. The Branch plans and designs conventional and special lighting projects for these entities, and takes into account any specific requirements for each of them.
Arguably, the most significant change was the implementation of the LED technology strategy across the whole spectrum of the luminaire range. In other words, no older technology HID luminaires will be used, with the exception of 400w HPS and HQI streetlights. By implementing this strategy, we plan to greatly reduce our carbon footprint.
Plans are also underway to replace many of the ageing high mast structures such as 15m, 18m, 30m, 40m and 45m in various areas such as Lamontville, Blue Lagoon, Durban CBD, Mustering Fields, Kings Park Diving Pool and Phoenix Industrial Park.
Lighting Research & Investigation Division:
The Lighting Research and Investigation Division is responsible for all activities related to the Electricity Procurement Forum as well as the Bid Specification, Bid Evaluation and Bid Adjudication Committees. The following contracts totaling R196 820 000 were handled by this Division:
E.9388: Supply, delivery and off-loading of steel frames, galvanised steel enclosures, Photo-Electric Control Units (PECU) boxes and concrete bases for streetlight switch pillars. R4M
E.9312: Supply, delivery and offloading of photoelectric control units and associated items. R6M.
E.9362: Supply, delivery, off-loading and stacking of fibre glass street-lighting poles. R0.72M
E.9320: Supply, delivery and off-loading of decorative Christmas lighting material for Dr Pixley KaSeme Street (formerly West Street) and Dr Yusuf Dadoo Street (formerly Grey Street). R8M
E.9412:Inspection and Maintenance of High Masts with Raising and Lowering Mechanisms. R4M
E.9555: Painting of steel poles, arms and attachments. R2M
E.9199:Supply, delivery, off-loading and stacking of pre-stressed and reinforced concrete poles. R8M
E.9364:Removal and disposal of potentially hazardous lamps. R0.6M
E.9194: Supply, delivery and off-loading of street light and floodlight luminaires. R140M
E.9292: Supply, delivery and off-loading of electrical discharge lamps and incandescent electric lamps. R6M
E.9375:Supply, delivery, off-loading and stacking of steel street-lighting poles. R17.5M
EThekwini Electricity is facing a major problem with copper theft and has a negative impact on all citizens. The estimated loss due to copper theft is approximately R5 billion per year with eThekwini Electricity contributing R60 million to that loss. It has an impact on the City’s communication network, electricity supply, and railway and traffic services. To add to the seriousness of the situation, areas such as Edwin Swales, Bellair, Cato Manor, Shallcross, Clermont, M4 and Higginson Highway have been significantly affected by the felling of street light poles to access the cable routes, thus stealing the copper. In an effort to minimise the cutting down of steel poles in these areas, an Anti-theft solution was investigated and
implemented.
Maintenance Planning Division:
The Maintenance Planning Division continues to Inspect and identify hazards on the public lighting system. Major challenges are illegal connections and infrastructure theft. The use of modern technology various methods are being investigated to assist with these challenges. A summary of the Division’s activities are as follows:
• Continued inspections of street light poles, arms, fittings and infrastructure to identify hazardous conditions.
• Preventative maintenance due to identifying and hazards and repairing and redesign in advance
• Poles testing of all poles along highways, freeways and major routes
• Identifying losses due to cable theft
• Different methods of supplying street lighting due to these conditions
• High mast inspections along the beaches, townships and roads
• Inspections of sport fields, park and footpaths.
Over the past financial year the Division has done the following:
• Maintenance Division has inspected total of 114002 lighting installations
• Highway Inspections totaling 7895 were done, identified hazards and reported.
• Sport fields totaling 631 Inspected and reported
• Bulk lamping routes of 104 866 installations inspected
• Identified 610 hazards in beaches
• A total of 770 lighting installations inspected in Eskom areas
MV/LV OPERATIONS EThekwini Electricity Annual Report | 2017/18
9
10
EThekwini Electricity Annual Report | 2016/17
Challenges
Amongst the major challenges faced by the branch for the year under review was the inability to get material and labour contracts timeously approved and implemented, which potentially had a negative impact on service delivery. This reflected negatively on the projected capital spend, since crucial projects could not be completed due to the relevant contracts not being in place. Theft, vandalism and illegal connections remain as the Electricity Unit’s major challenges as remedial work usually result in repeat offences and thus wasteful expenditure. The municipality is viewing these issues as a larger socio-economic challenge, rather than a problem specific to the Electricity Unit, and are looking at longer term, over-arching mechanisms and solutions to overcome these challenges
Anticipated Challenges
The Electricity Unit has engaged in various multi-year contracts for material and labour provision and hence may ease some of the challenges faced in the previous years. The municipality, however receives a multitude of request for the streetlight poles to be used for the mounting and installation of communication equipment, both by internal and external clients. The major challenge is for the unit to devise a consistent approach to handle these requests as the maintenance challenges and demand for the use of capacity sometimes outweigh the potential customer benefits and revenue generating capacity. The Electricity is, however in the process of exploring all options and are in the process of addressing these matters.
New Technologies Applied
1. Lighting Telemanagement Project:
Continuous research and investigation into new lighting technologies and electrical apparatus is conducted by the branch. All of the available technologies are evaluated to assess for the ideal solutions for the city’s needs. eThekwini is currently in the process of rolling out a lighting telemanagement system. A pilot project for the implementation of an Owlet Telemanagement system for 20 light fittings on Umgeni Road is currently underway. The cost of the project is R200 000. The benefits of telemanagement are summarized below:
• Dimming capability
• Adjustable on/off timing
• Lamp failure detection
• Energy consumption monitoring
• Open circuit detection
• Lamp-burning hours monitoring
The Owlet lighting telemanagement system is used to manage, control, monitor and meter outdoor lighting systems. The main objectives of the system are to reduce greenhouse gas emissions, reduce energy consumption, improve reliability and minimize maintenance costs. Individual lighting points can be controlled and the system is based on open technologies. A central repository collects and stores date and time stamped critical information such as energy consumption, operating states and failures which could also be geographically categorized.
2. LED Street lighting:
The use of LED for various applications has increased exponentially over the past few decades and is even being hailed as the future of lighting by many. The suppliers and manufacturers are claiming various advantages which include a compact size, longer life spans, lower maintenance, improved design capabilities, color rendering features and increased luminous efficacies, amongst others. LEDs are changing the tradition of photometry and are being continuously improved to maximize benefits.
The benefits of LEDs are as follows:
• Lower energy costs
• Reduce power consumption
• Improved controllability
• Improved lumen constancy
• Longer life
• Predictable life span
• Redirection of light emissions
• Improved reliability
• Quick turn on/off
• Dimming capability
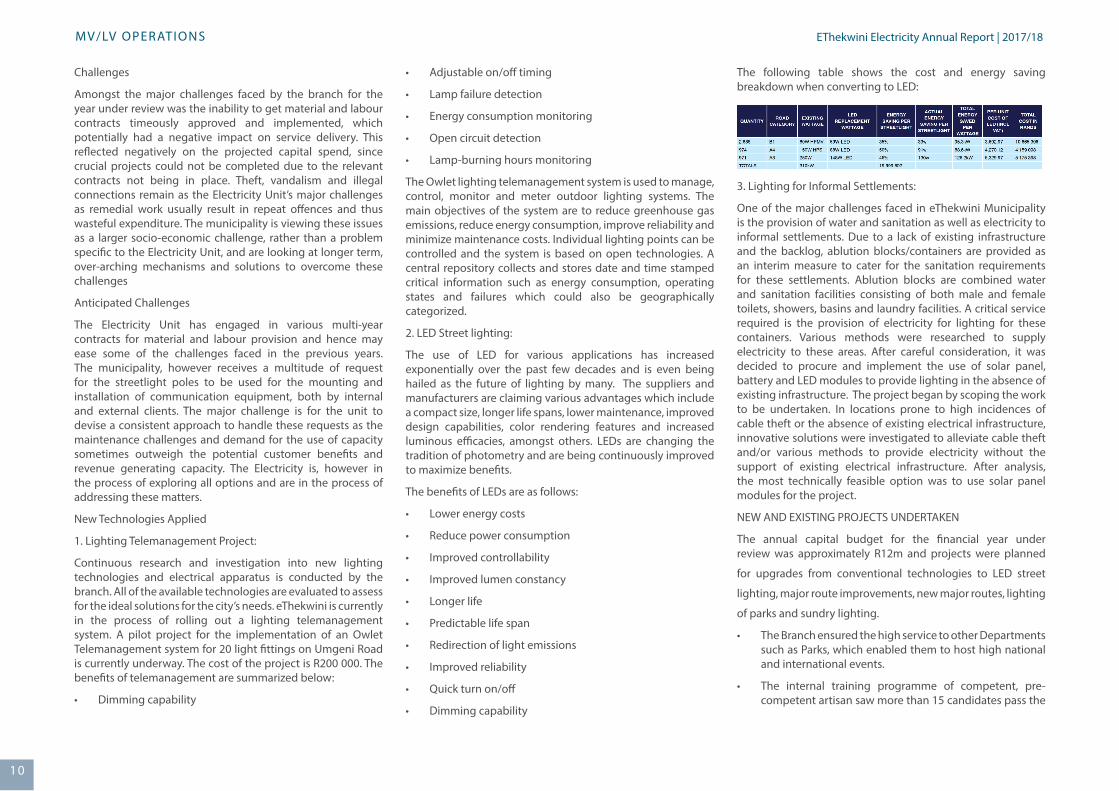
The following table shows the cost and energy saving breakdown when converting to LED:
3. Lighting for Informal Settlements:
One of the major challenges faced in eThekwini Municipality is the provision of water and sanitation as well as electricity to informal settlements. Due to a lack of existing infrastructure and the backlog, ablution blocks/containers are provided as an interim measure to cater for the sanitation requirements for these settlements. Ablution blocks are combined water and sanitation facilities consisting of both male and female toilets, showers, basins and laundry facilities. A critical service required is the provision of electricity for lighting for these containers. Various methods were researched to supply electricity to these areas. After careful consideration, it was decided to procure and implement the use of solar panel, battery and LED modules to provide lighting in the absence of existing infrastructure. The project began by scoping the work to be undertaken. In locations prone to high incidences of cable theft or the absence of existing electrical infrastructure, innovative solutions were investigated to alleviate cable theft and/or various methods to provide electricity without the support of existing electrical infrastructure. After analysis, the most technically feasible option was to use solar panel modules for the project.
NEW AND EXISTING PROJECTS UNDERTAKEN
The annual capital budget for the financial year under review was approximately R12m and projects were planned
for upgrades from conventional technologies to LED street
lighting, major route improvements, new major routes, lighting
of parks and sundry lighting.
• The Branch ensured the high service to other Departments such as Parks, which enabled them to host high national and international events.
• The internal training programme of competent, pre-competent artisan saw more than 15 candidates pass the
MV/LV OPERATIONS EThekwini Electricity Annual Report | 2017/18
10 10
11
EThekwini Electricity Annual Report | 2016/17
lighting, major route improvements, new major routes, lighting
of parks and sundry lighting. Various grant funding options
are being evaluated for the installation of LED streetlights
to replace the 80W mercury vapour luminaires in residential
areas, 150W high pressure sodium (HPS) luminaires on
secondary roads and 250W high pressure sodium luminaires
on main arterial roads. These funding option include EEDSM,
Department of Energy, Swiss and German donor funding.
Grant funding from the Department of Energy (DoE) on their
EEDSM program for R8m was received for the installation of
LED streetlights to replace the 250W high pressure sodium
luminaires on main arterial roads. Other major projects for
the current and future financial years include; Bridge City to
Umhlanga on the Integrated Rapid Public Transport Network
(IRPTN) route, Illovu Road (Kwamashu), completion of MR 577
(Kwadebeka), KwaMashu Highmast Lighting, LED floodlighting
and Solar lighting for ablution facilities in informal settlements.
The lighting for all 132kV/33kV substations is currently being
audited and upgraded in a phased approach from HPS (orange
light) to LED (white light) to cater for the requirements of CCTV
cameras.
Other significant projects include:
• Redesigned street lighting circuits by removing 9m gum poles and replacing with 9m steel poles and concreting of underground cables where large scale theft and vandalism have occurred in the following areas; Shallcross Link Rd, RK Khan Circle, Damarosa Crescent, Chatham Place, Dilkoosh Road and Park Avenue.
• Installed 15% LED streetlights mainly in the 36w range to replace the 80w HPMV lamps as part of our commitment
to reduce our carbon footprint.
• The following major capital projects were completed; Bartlett Rd, Badedele Place, Burman Drive, KwaDukuza Road, Valley Drive, Westmead Road, Sheridan Street,
Ablution floodlighting sites across the whole metro region, Ulwandle Drive, Roger Sishi Road, Malandela/Musa Road and Cornubia Interchange.
Many of the projects undertaken by the branch involves liaison and interaction with other units within the municipality and external entities such as Roads Provision, Architectural Department, Parks, Leisure & Cemeteries, Roads and Stormwater, Strategic Projects, Tongaat Huletts and a host of developers and external electrical consultants. The branch plans and designs conventional and special lighting projects for these entities, and takes into account any specific requirements for each of them.
Arguably, the most significant change was the implementation of the LED technology strategy across the whole spectrum of the luminaire range. In other words, no older technology HID luminaires will be used, with the exception of 400w HPS and HQI streetlights. By implementing this strategy, we plan to greatly reduce our carbon footprint.
Plans are also underway to replace many of the ageing high mast structures such as 15m, 18m, 30m, 40m and 45m in various areas such as Lamontville, Blue Lagoon, Durban CBD, Mustering Fields, Kings Park Diving Pool and Phoenix Industrial Park.
LIGHTING WORKSLighting Works Branch is responsible for the construction and maintenance of streetlights in the whole of the eThekwini Municipality area of supply. Other than complaints from the public, Lighting Works Branch is responsible for the maintenance repairs of inspections conducted by our Lighting Planning inspectors.
Highlights and Lowlights
Highlights:
• The branch managed to fill seven vacant posts of supervisor handyman by a way of promotion using the council recruitment policy. Furthermore to that all electrician posts were filled and the last incumbent to be recruited is a pre-competent electrician currently undergoing his competency training.
• The branch managed to keep the operational budget within the budgeted parameters of 2017/2018.
• The branch maintained a five star NOSA rating as per DFIIR report on Health and Safety Environment.
• The branch managed to keep the operational budget within the budgeted parameters of 2017/2018.
• The branch ensured the high service level to other departments such as Parks Department (parks, pools and stadia) lighting, which enabled them to host high profile national and international events.
• The Isipingo Precinct clean-up which was a major success as well the maintenance upkeep thereof the area.
• Through the Workplace Skills Plan programme over 90% of Lighting Works Branch staff attended the First Aid Course as a priority on safety first.
Lowlights
• The theft of streetlight cables and cutting of streetlight poles dampens the effort of service delivery.
• Non availability of material as and when required due to controls beyond the branch affected service delivery.
• The Supply Chain Management process of acquiring additional resources to compliment the internal resources poses a challenge in terms of the long lead time
• Mobility in terms of truck repairs and licensing delays hampers service delivery targets as set out to a maximum of five working days turnaround time.
Challenges
Improving the cable fault location skills of our electricians as well as looking at ways to secure the street lighting infrastructure especially along the main roads and highways. The new set targets of 1-5 days turnaround time for the repairs to street lighting complains by the public, which in turn improve the branches performance check on its operations.
Anticipated Challenges
• The technically involved process to address theft related restoration of streetlights against the cost factor which is normally three times more.
• Fast tracking the skills development of the newly appointed supervisor handyman in dealing with LED fittings as oppose to normal HID fittings.
MV/LV OPERATIONS EThekwini Electricity Annual Report | 2017/18
1111
12
EThekwini Electricity Annual Report | 2016/17
approved to cater for the foreseen influx of Independent Power Producers (IPPs) at the residential level which may challenge the electrical stability of the network. This transition to distributed generation is an inevitability and we are investigating more methodologies and technologies to secure the grid. We endeavour to be compliant with the NRS 047 Quality of Supply regulations and continuously improve our operations to serve our City.
Highlights:
• The Network Control branch forms the interface between the customer’s first point of contact with the business and the depot field staff and is therefore instrumental in the service delivery value chain. The branch has faced 5 079 faults on the MV network and 162 970 faults on the LV network during the 2017/2018 fiscal year. Considering that our staff operate around the clock to attend to these faults which may often be during periods of inclement weather conditions, we are grateful to have no reported disabling incidents.
• Network Control continues to strive towards improved service delivery through the application of new technologies to improve network visibility and introduce a higher degree of automation at the distribution level. However, the pervasive socio-economic issues of theft and vandalism of various Electricity assets continue to plague the organisation. These issues together with the growing rate of illegal connections continue to threaten the stability of the electrical network, resulting in more frequent disruptions in supply. Another challenge that leads to disruptions in the network availability is aging electrical infrastructure and a backlog of maintenance.
• The Municipality as an organisation is actively advocating for the filling of vacancies as well as improving the gender representation at all levels. At Network Control, our vision is aligned with that of the City’s and we strive to fill all vacancies to ensure optimum operation within the branch. Furthermore, our branch fully supports the City’s vision of improving gender representation and this is evident in our diverse and representative complement of staff.
Challenges
• The common challenges faced by all branches within the Unit over the past financial year include community protests related to service delivery, the growing prevalence of illegal connections, and theft and vandalism of electrical infrastructure. Vagrants have also been found living in substations leading to unfortunate fatalities and community unrest. While the impact of these issues are technical in nature, the root lies in deep-seated socio-economic inequalities.
• An issue that was faced specifically by Network Control over the 2017/2018 year and continues to present a challenge, is the problem of cellular network availability. The Distribution Automation project is ongoing and communication to the Remote Terminal Units (RTUs) that have been installed on site is achieved through the use of Internet Protocol (IP) modems which utilise General Packet Radio Services (GPRS) and fibre. Subscriber Identification Modules (SIM) cards from two network providers have been procured and installed in the IP modems, however the GPRS communication links that are supplied by these network providers are often unreliable due to the inability to prioritise data over the network, the location of substations, the variation in weather conditions and unexpected routing of traffic.
Anticipated Challenges
• The electricity value chain is facing disruptions globally. The traditional model of monopolised electricity generation, transmission, distribution and retail is systematically becoming destabilised due to the prevalence of IPPs at both the transmission and distribution levels. Electricity utilities historically responsible for the transmission and distribution of electricity are steadily experiencing low revenue growth due to a declining demand. This decline is associated with the growth of two sectors: demand-side management technology and alternative sources of energy. In the particular case of eThekwini Municipality, loss of revenue is also attributed to pervasive illegal connections. This revenue decline begs the question on whether the current electricity business model adopted by eThekwini Municipality will be financially sustainable in the future. Redundant cables are returned to the
• appointed supervisor handyman in dealing with LED fittings as oppose to normal HID fittings.
• Keeping within the Operational budget due to the 300% increase in cost of the LED fittings.
New technologies Applied
LED fitting as an energy efficient initiative.
New and existing projects undertaken
Cornubia development street lighting project.
NETWORK CONTROL BRANCHThe Network Control branch operates Medium Voltage (MV) and Low Voltage (LV) regional Control Rooms to manage our City’s electricity supply. Our operations are shift based and service over 730 000 customers in our area of supply. Our diverse customers range from households at 220 Volts to bulk customers at 11 000 Volts. Many sites are monitored and controlled remotely, which allows for efficient fault finding and outage restoration. We also utilise the field data to drive internal business processes for tactical maintenance and informed decision making.
Our customer profile is changing and hence our current business model may not be sustainable in the future. Customers will soon turn to alternative energy sources and even become energy producers or prosumers in a highly competitive market. Evidence of this energy revolution is already prevalent in the increasing number of queries regarding renewable energy installations, in particular solar photovoltaic installations. Our future customer retention strategy will be to provide a customer centric solution, using advanced technology to connect with the customer and ensure that our service meets their changing expectations.
In response to this trend of declining electricity demand, eThekwini Electricity’s tariff for residential embedded small scale generation has since been
12 12
MV/LV OPERATIONS EThekwini Electricity Annual Report | 2017/18
13
EThekwini Electricity Annual Report | 2016/17
Reclamation Division for processing. The cables which have been returned from site due to failure or new network developments are processed by this Division for disposal. These cables are cut into one metre lengths to prevent being utilised unlawfully.
• The Network Control branch is particularly concerned with the embedded generation at the distribution level. This new technology poses associated concerns with respect to grid stability. Distributed generation must comply with standards as specified by the National Energy Regulator of South Africa (NERSA), this poses a challenge in terms of assessing the adherence to such standards. The presence of distributed generation may also result in switching implications due to alternative sources of supply present within the grid. There is another risk posed by low-quality products that are infiltrating the market. Such technology may not comply with the grid code and shall pose a risk to the grid stability.
New Technologies Applied
• Visibility of the network is paramount in ensuring service delivery as well as safety. With this interest in mind web-based electronic dashboards have been developed and implemented by the MV/LV Network Control branch. Two primary dashboards have been implemented; the MV/LV Outage Management and Distribution Automation Dashboards. These dashboards have been developed in addition to the existing electronic dashboards that have been introduced in the LV Control Rooms to display the work outstanding and completed as per the Enterprise Resource Planning system.
• The MV/LV Outage Management System collates relevant data from the Enterprise Resource Planning system to display statistics on current faults such as: Open LV Work Requests, Open MV Work Requests, Planned Interruptions, Open Emergency Work Requests, etc. The objective of this dashboard is to provide an overview of the faults currently reported and in-work faults in our area of supply. A heat map has been added to the dashboard to geographically indicate the locations of these faults. This dashboard has been instrumental in increasing the visibility of hazardous faults requiring immediate attention. Furthermore, the dashboard allows management to take quick decisions,
escalate and prioritise larger faults and also monitor the performance of the network.
• The Distribution Automation Dashboard provides a portal for the management of the RTUs installed on site as part of the Distribution Automation project. The dashboard mines data from the database stored on the Redundant Open Virtual Private Network (VPN) server and displays all data related to the RTUs. The dashboard also indicates whether the particular site is online or offline by monitoring the traffic on the communication link. The data from the Field Audit is used to update and/or populate the Distribution Automation database with information as gathered from site visits. We are currently expanding the functionality of the dashboard to improve the usability of the acquired data.
New and Existing Projects Undertaken
The branch is making promising progress with the Distribution Automation project. The project forms part of the Smart Grid initiative and aims to provide remote control and monitoring of the electrical distribution system operations. The project shall increase the visibility of the distribution network thereby leading to more efficient and effective workflow. This shall enable us to reduce our response time to faults as well as to reduce the restoration time. This will serve to satisfy customers who are growing increasingly sensitive to power quality issues and outages. Currently, we are involved in Phase 1 and 2 of the project. Phase 1 involves the automation of Distributor Substations (DSSs), Autoreclosers (ARs) and Ring Main Units (RMUs). This phase is ongoing as new-build DSSs are introduced to the network. We commenced with Phase Two in the previous financial year. This phase entails the remote monitoring of the indoor brick built substations (kiosks) and through fault indicators. Network Control is presently involved
in the retrofitting of mini RTUs in the existing kiosks.
The great benefit of this phase of the project is that LV circuits may be monitored, thereby enabling the detection of multiple LV outages. This facilitates outage detection and improves restoration times. While we have experienced challenges with the GPRS communication links, the project continues to bear fruit. The data acquired remotely from site is available to the Control Officers via the technical network which improves their visibility of the network to aid in fault finding. The data
is also available to the other branches within the Unit through the ACS Prism Portal. This data is utilised by the planning and construction divisions to assist in load flow studies and to inform their strategic planning for network reinforcement and expansion.
Network Control is concurrently involved in the Field Audit project in addition to the Distribution Automation project. This project was initiated as Network Control identified a gap in the records of site details as the site records were outdated and missing key information. The aim of the Field Audit is to record all visible site details and all network information such as IP addresses and SIM card information. The audit of all DSSs on site is almost complete after which the audit of the kiosks shall commence. The data from site is used to populate the Distribution Automation database and is accessible via the Distribution Automation Dashboard.
The challenge of offline sites has necessitated the creation of a portal to monitor and thereafter troubleshoot these offline sites. The Network Control engineering team is presently working on expanding the functionality of the Distribution Automation Dashboard to include a Supervisory Control and Data Acquisition (SCADA) dashboard that will highlight the offline sites per region in terms of those offline for the longest period. This will assist in prioritising that the communication to these sites is restored to increase network visibility.
The Distribution Automation project has served to provide the backbone for the implementation of ADMS. The objective of ADMS is to aid in realising the Smart Grid vision. The systems shall improve situational awareness of the electrical network thereby increasing efficiency and effectiveness of both in-station staff and field staff. The aim of this is to improve restoration times and thus service delivery. ADMS improves communication with the customer regarding outages thereby improving customer service. The implementation of this system shall also aid in realising the City’s vision of making eThekwini the most caring and liveable city in Africa by 2030.
Network Control has endeavoured to initiate a number of projects with the common interest of improving service delivery to our customers through the application of new technology and systems. We aim to be proactive at adapting to our customers changing electricity profiles and expectations so that we may aid in future-proofing the organisation.
1313
MV/LV OPERATIONS EThekwini Electricity Annual Report | 2017/18
14
EThekwini Electricity Annual Report | 2016/17
The Technical Support Department provides a diverse range of specialist services within the Electricity Unit. These services contribute towards the Vision of the Unit, which is to be a leader in electricity distribution providing energy for the future. The department comprises of eight branches, namely, Communication Networks Branch, Electrical Workshops Branch, Infrastructure Asset Management Branch, Mechanical Workshops Branch, Network Drawing Office and Survey Branch, Protection and Test Branch, SHERQ and Training Branch and Technology Services Branch. Collectively, these branches ensure that all resources are effectively and efficiently utilised so that value is added to all the customers that the Electricity Unit currently supplies.to our customers and secondary networks.
and copper pilot communication network links, ruggedised carrier class dense wave division multiplexer (DWDM) and synchronous digital hierarchy (SDH) access multiplexers, optical switches/routers/media converters, wireless mesh and wireless point-to-multipoint equipment.
Highlights and Lowlights
Highlights
• Ninety eight percent of the Branch’s organogram was successfully filled in April 2018.
• The following presentations for public consumption were conducted by staff from the Branch:
• SAIEE: Smart Grid Conference - Understanding the Benefits of Smart grid in Distribution Networks (T.N Biyela)
• SAIEE: SAUPEC - Energy Decomposition of Industry in South Africa (T. N. Biyela)
• ABB FOX User Group: Implementation of Wireless Mesh Technology (S. Jagannath)
Lowlights
• The drafting of a Smart Grid Implementation Plan (SGIP) was delayed by another year due to operational challenges.
• The release of an expression of interest into Gigabit Passive Optical Network (GPON) solutions was withheld due to resource constraints.
Key challenges
• The Unit continued to experience a delay in drafting a Smart Grid Implementation Plan. The Branch provided assistance by facilitating the drafting of a Technology Deployment Framework to function as an integrator between the smart grid strategy and smart grid project initiatives.
• The Branch experienced challenges on how to design a forward compatible network to meet the Unit’s smart grid aspirations. Research into a unified communication network architecture was undertaken. A report was compiled which detailed future work.
• The Branch experienced challenges in determining whether an existing communication system using third party cellular networks should be absorbed within its list of approved technologies. The Branch undertook an evaluation exercise to determine if the solution met industry norms.
• Departments within Unit expressed their interest to expand on the implementation of IEC 61850 technology. The Branch undertook a review of past implementations to gain an understanding of the technology and skills gaps present within the Unit. Research was undertaken into the establishment of a local lab in conjunction with the University of KwaZulu-Natal.
New Technologies
• The Branch researched and developed a customisation of the Survey123 Connect tool for ArcGIS to support the capturing of data online. The Branch intends piloting this technology in 2018-19 to improve the accuracy of its information databases.
• Research into the Internet of Things (IoT) communication technologies was undertaken. The Branch supported the deployment of a pilot project to test the use of LoRa wireless data communication technology to support telemetry applications.
• A new generation of Digital Subscriber Line (DSL) technology was tested for compatibility with the existing copper pilot network. The test was a success and the Branch intends rolling out a small scale deployment to key legacy substations
• The Municipality has recently procured a mission critical TETRA radio communication network. The Branch undertook a research project which piloted the use of the TETRA network to provide machine-to-machine communications.
TECHNICAL SUPPOR T
COMMUNICATION NETWORKS BRANCH
OVERVIEW
This Branch provides and maintains secure and reliable communication links for all technical systems that monitor, control and protect all electrical plant and equipment in the Transmission and Distribution networks from which all customers are supplied. In addition the Branch provides communication channels for other support services required to operate an electrical utility such as Information Technology (IT) wide area network (WAN) links, closed circuit television (CCTV) and access control. Support is also provided to other municipal communication requirements where possible.
This is achieved by researching, designing, planning, procuring, operating and maintaining the required communication networks that ultimately enhance the security and quality of electricity supply in the most effective manner and provide other users with communication links for the effective operation of their systems. The Branch utilises a wide range of technologies such as fibre optic, data, wireless
EThekwini Electricity Annual Report | 2017/18
14 14
15
EThekwini Electricity Annual Report | 2016/17TECHNICAL SUPPOR T
New Projects
• Installation of a redundant solution of Solarwinds, a network management system used to manage all IP based devices used on the Unit’s operational technology network.
• Implementation of an enhanced telecommunication data model to support the future planning of telecommunication systems on a GIS platform.
• Implementation a Cyber Security Management System (CSMS) within the Branch.
Expected Challenges
• The National Department of Telecommunications and Postal Services has expressed an intent to recommend an amendment to the Electronic Communications Act. The amendment is focused to enable the rapid deployment of telecommunications. The Communication Networks Branch will offer its services to assist in drafting municipal policies and conduct awareness presentations to support this initiative.
• A gap in strategic direction with respect to Telecommunications and the Smart City concept within the municipality was noted. Recommendations for integrated city planning were presented to the City’s Information Management Unit. Comments on the Spatial Development Framework (SDF) and Integrated Development Plan (IDP) regarding strategic management of telecommunications were prepared and submitted to the City’s Strategy Office, to address this gap. The Branch intends to follow up to determine what assistance can be provided.
• The Unit will proceed to implement the Technology Deployment Framework drafted in 2017-18. The Branch intends to support this initiative.
• • Consistent productivity reports are not available tomeasure Branch performance. The Branch intends to focus on productivity measurement by revising its implementation of standing work orders, mobility and introducing better reports.
• Installation• TheBranchcurrentlydoesnothaveremote
network access in place to support timeous notification of faults from its network management systems. The Branch intends on introducing remote access to the network as well as system automated reporting to enhance awareness and decision making regarding network performance.
ELECTRICAL WORKSHOP BRANCHThis Branch was established to ensure that all equipment received from the manufacturers are tested prior to installation into the electricity network. It is responsible for repairing equipment which have failed. This Branch is also responsible to supply other Departments with mineral oil which is utilised as an insulating and coolant medium in transformers, autoreclosers, etc. Over the years this Branch has evolved to undertake specialised intrusive maintenance on MV switchgear and transformers.
Routine Activities
• Acceptance testing on all new equipment purchased, i.e. mini-substations, transformers, ring main panels, autoreclosers, sectionalisers and motors in the workshop, prior to it being handed over to stores and on site.
• Repairs and overhauls to transformers, mini-substations, circuit breakers in the workshop and on site.
• Provision of a breakdown service to attend to faulted transformers, mini-substations, circuit breakers, autoreclosers and sectionalisers within the MV/LV Operations Department network in the workshop and on site.
• Processing, storage and supply of oil to the MV/LV Operations Department and HV Operations Department.
• Reclamation of waste and scrap by the Reclamation Division, which mainly includes the disposal of reclaimed cables which failed and have returned from site. These cables are cut into one metre lengths to prevent being utilised unlawfully.
Highlights and Lowlights
Highlights
• A new procedure was created for disposal of switchgears,
transformers and cables. The disposal process is now more streamlined and efficient
• Reduced accumulated overtime while ensuring work output remained the same.
Lowlights
• Industrial action by employees resulted in a lower output than was initially forecast.
Achievements
• One Electrician had successfully completed the transformer competency.
Challenges
• Malfunction of overhead crane restricted and reduced the work output as initially planned and targeted.
• Delay from transport section during vehicle servicing reduced work productivity.
• Oil plant required repairs which lowered work output.
New Technologies
• Installation of a pneumatic pump to increase oil pumping capacity within the Oil Store.
• Installation high quality moisture evaporators to allow for better pneumatic tool aids within the Electrical Workshops.
New Projects
• Remove existing high pressure sodium lamps and install LED overhead lamps in the Electrical Workshops. This project was to aid in the reduction of electricity consumption.
Challenges Expected
• New employees were employed. This has created a challenge in equipping employees with required tools and vehicles to accommodate additional work that could be undertaken by the Electrical Workshops. Budgets have to be revised to accommodate new employees.
EThekwini Electricity Annual Report | 2017/18
1515
16
EThekwini Electricity Annual Report | 2016/17TECHNICAL SUPPOR T
scanning service for the Electricity Unit.
• Provide resources towards the City’s vision to implement an electronic wayleave process and make the GIS data available for this platform.
The unavailability of new desktop computers for new and existing staff is compromising service delivery.
New Technologies • Appended the customer information from Ellipse ERP,
to the property information in GIS, to achieve spatial awareness on customer location, for both credit and prepaid customers.
• Customized a tool to capture addresses to assist Customer Services staff to locate and register new customer locations, in the ArcGIS Viewer.
New Projects• Currently procuring additional GIS software to enhance
the model and functionality, to support the action items in the Units GIS strategy.
• Developed the HV data model and modelled 132 Major Substation sites. This ongoing project is to provide incremental updates to the HV SCADA via DASMAP (SCADA CAD package) to extract data from the GIS.
Highlights and Lowlights
The GIS Roadmap for the Unit was developed and adopted by the ICT Technical Committee in March 2017. The integration of the GIS data with other systems is a project that is being managed by the ICT Branch as a Unit strategy.
PROTECTION AND TEST BRANCHThe Protection and Test Branch compromises of four technical Divisions, namely Protection Engineering, Test, Protection Maintenance and DC Systems. These Divisions are collectively responsible for the forward planning, analysis, design, updating, setting, configuring, testing, commissioning, auditing, maintenance and repair of all Protection and DC systems in the electrical network. The optimal operation of the Protection and DC systems is vital as it is these systems that will ensure the rapid and selective isolation of the electrical supply under fault conditions thereby reducing risk to plant, people and
environment. The Branch is also responsible for the investigation of all Protection or DC related mal-operations. In addition, the Branch provides other crucial services like cable fault location as well as various equipment testing, commissioning and repair services to the entire Electricity Unit.
Challenges
Relay failures remained the biggest challenge for the year. After comprehensively analysing the failures, determining the failure mode and analysing trends the Branch implemented various solutions to mitigate against the specific failures. The mitigation strategies employed included replacement of the entire relay with different versions or types, replacement of relay modules or relay components, repairing relays, reconfiguring relays, implementing patches or firmware changes. In case were trends were identified, the specific devices were flagged and the mitigation strategy applied to all affected devices.
Other challenges included the switchboard failures at Umlazi and Alice Street substations. Together with the primary equipment, most of the protection equipment was damaged and staff had to commission temporary boards, as well as engineer and configure ancillary protection panels in order to restore supply in the shortest possible period.
New Projects
A number of new Transmission substations were successfully commissioned during the financial year, including the new Sapref and Mobeni South substations.
• Temporary switchboards were commissioned at Alice Street and Umlazi substations following the failures at those substations.
• Refurbishment and upgrade projects were undertaken at Klaarwater, Ottawa, Ridgeview, Phoenix Industrial and Parlock substations.
• The use of hydrogen monitoring in battery rooms was investigated and a system design has been proposed for piloting in the 2017/18 financial year.
• Re-engineering and modification of the MV schemes utilising the MICOM P123 relay were undertaken to eliminate closing reliance on opto-isolator. The modification has been successfully completed on 388 panels.
• Portable play and plug differential relay modules were developed for use under emergency conditions. These modules can be installed and commissioned in a very short space of time.
New Technologies
The use of solar technology as a supplementary method of charging inverter batteries in the Fault location and Pressure testing vehicle is being investigated. The system design has been completed and the system will be piloted in one vehicle and tested to determine its feasibility.
Expected Challenges
Addressing the high relay failures that are occurring by working together with relevant manufacturers to identify the root causes of failure and then formulating solutions to mitigate against these failure modes.
• Addressing the reliance on contractors for technical expertise on substations commissioned on the new ICAP contract by ensuring that the protection personnel are trained and kept abreast with the latest version of the IEC 61850 standard.
• Addressing the maintenance backlogs that were created by staff shortages and the high rate of relay failures.
Highlights and Lowlights
• Nine battery banks and 8 battery chargers were replaced at Transmission substations and at Distribution substations 32 battery banks and chargers were replaced during the year as part of the Branch’s upgrade programme to replace aged and failure prone DC equipment.
• The DC systems at 36 transmission stations were audited during the year to ensure that all the DC loads were correctly wired and labelled to facilitate troubleshooting and the safe isolation of control equipment.
• The protection settings at 10 Transmission substations were also audited by the Branch to ensure that the settings and relay configuration at the substations is optimised to provide proper discrimination as well as fast and accurate fault determination and fault clearance.
•
EThekwini Electricity Annual Report | 2017/18
16 16
17
EThekwini Electricity Annual Report | 2016/17TECHNICAL SUPPOR T
The Network Records Division is responsible to update and maintain an accurate geo-spatial representation of the underground and overhead Electrical Network in the GIS to provide information for operations and technical systems. The Division also provides Draughtspersons at the Unit’s Construction and Maintenance Depots, to assist the technical staff with reticulation information from the GIS
The Special Projects Division uses CAD technology to update and maintain the Low Voltage Circuit Diagram database and make these diagrams available on the Unit’s scanned document repository. This Division produces design and documentation for the Unit and also updates the Code of Practice, drawings and illustrations for the Technology Services Branch.
The Survey Division provides survey services to internal
and external customers by;
• confirming survey information and servitude boundaries to avoid encroachments;Acheivements
• surveying overhead lines, underground cables and equipment location for the Unit;
• locating cable and pole encroachments for insurance claims;
• Tracing cables for accurate cable location.
The Division also surveys and creates layout plans for the electrification of informal settlement projects. The Utility Plans Division attends to all way leaves, provides network information to internal and external customers and responds to written correspondence received by the Branch.
Highlights and Lowlights
• New appointments: two Draughtspersons, two Survey Technicians, two Survey Attendants, GIS Officer and GIS
• Seven Draughtspersons were progressed to Senior Draughtspersons.
• Participated in the development of GIS Graduate Trainees from Corporate GIS Department.
• Two staff obtained BCom degrees in Information Technology.
• Two staff obtained diplomas in Project Management.
• The Branch achieved a five star NOSA rating.
• The Branch had two resignations.
Challenges
• Inability to fill vacant posts that require changes to Job Descriptions.
• Inability to upgrade existing and to acquire additional computer hardware.
• Delays in approval of the revised organogram.
• Delays and unavailability of information (as-built drawings and master data change documents), to update the electrical network reticulation database.
• Unavailability of NDM vehicles to perform tasks in the field.
• Poor maintenance of buildings and offices.
• Change Schneider’s ArcFM data model and work flow manager in the GIS Enhancement project will be a challenge in the future.
New Technologies
• Deployed new web map viewer running on the new ArcGIS Javascript API and FontAwesome.
New Projects
• Implementation of Schneider’s ArcFM software and data model to support the GIS Strategy of the Unit.
• Audit of the MV network reticulation in the GIS.
• Provided GPS coordinates for credit customers to be migrated to the Revenue Management System (RMS).
Progress on Existing Projects
• Created schema for survey layer in the GIS. Data still to be migrated.
• A total of sixteen informal settlements surveyed, with a total of 3 718 dwellings.
• Completed the modelling of HV substation sites.
• Started the procurement of a colour wide format printing machine. Technical specification approved by the EE Procurement Forum.
• Scanned images of all as-built drawings and master data change documents are being uploaded to the Unit’s image repository.
• Providing GPS coordinates for pre-paid customers to be migrated to the RMS.
PROTECTION AND TEST BRANCHThis Branch compromises of four technical Divisions, namely: DC Systems, Protection Engineering, Protection Maintenance and Test. These Divisions are collectively responsible for the forward planning, analysing, designing, updating, setting, configuring, testing, commissioning, auditing, maintaining and repairing of all protection and d.c. systems in the eThekwini electrical network. The optimal operation of the protection and d.c. systems is vital as it is these systems that will ensure the rapid and selective isolation of the electrical supply under fault conditions thereby reducing risk to plant, people and the environment. The Branch is also responsible for the investigation of all protection and d.c. system related mal-operations. In addition, the Branch provides other crucial services like cable fault location as well as various equipment testing, commissioning and repair services to the entire Electricity Unit.
Highlights and Lowlights
• As part of the Branch’s upgrade programme to replace aged and failure prone d.c. equipment, six battery banks and six battery chargers were replaced at Transmission substations and 12 battery banks and chargers were replaced at Distribution substations during the year.
• The d.c. installations at 20 Transmission substations were audited during the year to ensure that all the d.c. loads were correctly wired and labelled to facilitate troubleshooting and the safe isolation of control equipment.
• The protection settings at 10 Transmission substations was also audited by the Branch to ensure that the settings and relay configuration at the substations is optimised to
EThekwini Electricity Annual Report | 2017/18
17
18
EThekwini Electricity Annual Report | 2016/17
• provide proper discrimination as well as fast and accurate fault determination and fault clearance.
• Fault locations for a total of 2 512 HV/MV cable faults, 1 917 LV cable faults and 1 887 house service cable faults were provided by Test Division staff during the year. Test Division staff also performed dielectric withstand voltage testing on 396 pieces of equipment to confirm the integrity of the equipment insulation.
• The Branch made good progress with the filling of vacant posts. A total of seven appointments were made during the year.
• The establishment of the Construction Division within the Branch was approved and the associated posts have been graded. The outcome of the locomotion allowance for certain posts within the Division is still outstanding and the biggest obstacle in advertising these posts will be the lack of accommodation to house the Division.
• System constraints due to loading of the network and equipment failures are still preventing protection maintenance being performed in certain areas and backlogs are developing.
• Relay failures again plague the Branch and the Branch had to undertake major module and relay replacements at 21 Transmission substations. Two hundred protection relay modules were replaced and all these schemes had to be retested. In addition 40 failed overcurrent protection relay front faces had to be replaced. These failures claimed a significant amount of Branch resources resulting in backlogs in some maintenance areas.
Challenges
• Relay failures remained the biggest challenge for the year. Comprehensive analysis of the failures and trends was undertaken to determine the failure modes of these devices. Thereafter, the Branch implemented various solutions to mitigate against the specific failures. The mitigation strategies employed included replacement of the entire relay with different versions or types, replacement of relay modules or relay components, repairing relays, reconfiguring relays, implementing patches or firmware changes. The Branch will continue to address the relay failures that occur by working together
with relevant manufacturers to identify the root causes of failure and then formulate solutions to mitigate against these failure modes.
• The transformer failures at Durban North Substation and 11 kV transformer breaker failure at Toyota Substation that placed a number of major industrial customers at risk required significant input and resources from the Branch at short notice. The Branch had to reshuffle its resources and divert staff to these sites to work in conjunction with contractors to modify and recommission the necessary protection schemes as soon as possible so that the security of supply to these important areas could be restored in the shortest possible period.
• The capacity of the Branch became a challenge when Branch resources became overextended during the year due to the increasing number of operational issues that staff were called upon to attend to following the failures of a number of 132 kV circuit breakers and other equipment in the network that resulted in the need to bypass the failed equipment. These situations required protection schemes to be modified or alternative protection installed and commissioned to ensure that the electrical network was still protected.
• The prevalent theft of cables, busbars and other equipment in substations resulted in an increased number of protection mal-operations, all of which required investigation and repair. This placed further strain on the already overextended resources.
• The reliance on contractors for technical expertise on IEC 61850 substations is also a challenge that has to be overcome by ensuring the protection personal are trained and kept abreast with the latest version of the IEC 61850 standard.
• The maintenance backlogs that were created by the various issues indicated above will also pose a challenge to overcome especially with the current strain on resources.
New Technologies
• The use of solar technology as a supplementary method of charging inverter batteries in the fault location and pressure testing vehicle was piloted. The feedback and the results of performance tests on the piloted system
have been positive and it has been recommended that the system be implemented in the balance of these vehicles.
• The new MV switchgear contract introduced the first composite fibre differential relay into the Distribution network which allows for the implementation of fibre differential functionality at this level. The introduction of this technology will aid in improving protection performance of these networks as this modern fibre differential relay will overcome many of the deficiencies inherent with the older generation pilot differential relays. The first installation as already been completed at 94 Cannon Road distributor substation.
New Projects
• Refurbishment and upgrade projects were undertaken at Plangweni, Jacobs, Greenbury, Mobeni South, Durban North, Parkhill and Umlazi substations.
• The use of hydrogen monitoring in Transmission substation battery rooms as both an early warning risk identifier and a means of controlling the air extraction devices was investigated. A system design has been proposed for piloting in the 2018-19 financial year.
• Re-engineering and modification of the MV schemes utilising the SPAA relay were undertaken to address mal-operations resulting from failed output tripping contacts on the relay. The modification has been successfully completed on 32 relays.
• The development of portable plug and play relay modules for use under emergency conditions continued with multi-feeder overcurrent protection modules been developed this year. Each of these modules are capable of providing overcurrent and earth fault protection to three feeder bays and can be installed and commissioned in a very short space of time.
18 18
TECHNICAL SUPPOR T EThekwini Electricity Annual Report | 2017/18
19
EThekwini Electricity Annual Report | 2016/17
SHERQ AND TRAINING BRANCHThis Branch was established to support strategic objectives of the municipality through skills development and promotion of a positive health and safety culture in the workplace. The branch comprises of four Divisions, namely: Engineering Skills Development, Safety, System Operations Training and Technical Training. All the branches are collectively responsible for the planning, designing, implementation and monitoring of systems to ensure compliance with relevant standards and procedures, legislations and associated regulations. The various functions of the branch include, but are not limited to:
• the monitoring of health and safety services;
• the development of risk assessments;
• the undertaking of safety and environmental inspections and audits;
• the development of training and mentorship programmes;
• the accreditation of technical competencies and
• the undertaking of various skills outreach programmes that are related to the marketing of Electrical Engineering field such as career symposiums, maths and science expos, etc.
New Technologies
• The use of solar technology as a supplementary method of charging inverter batteries in the fault location and pressure testing vehicle was piloted. The feedback and the results of performance tests on the piloted system have been positive and it has been recommended that the system be implemented in the balance of these vehicles.
• The new MV switchgear contract introduced the first composite fibre differential relay into the Distribution network which allows for the implementation of fibre differential functionality at this level. The introduction of this technology will aid in improving protection performance of these networks as this modern fibre differential relay will overcome many of the deficiencies inherent with the older generation pilot differential relays. The first installation as already been completed at 94 Cannon Road distributor substation.
New Projects
• Refurbishment and upgrade projects were undertaken at Plangweni, Jacobs, Greenbury, Mobeni South, Durban North, Parkhill and Umlazi substations.
• The use of hydrogen monitoring in Transmission substation battery rooms as both an early warning risk identifier and a means of controlling the air extraction devices was investigated. A system design has been proposed for piloting in the 2018-19 financial year.
• Re-engineering and modification of the MV schemes utilising the SPAA relay were undertaken to address mal-operations resulting from failed output tripping contacts on the relay. The modification has been successfully completed on 32 relays.
• The development of portable plug and play relay modules for use under emergency conditions continued with multi-feeder overcurrent protection modules been developed this year. Each of these modules are capable of providing overcurrent and earth fault protection to three feeder bays and can be installed and commissioned in a very short space of time.
Highlights and Lowlights
Vigorous site safety inspections being carried out by safety personnel to mitigate high rate of safety related incidents.
• Task re-grade of technical training posts and introduction of Chief Training Officer level as part of progression within the post of Training Officer.
• Delays in completing the construction of the new training centre building.
• High vacancy rate of technical training posts and failure to attract suitable technical skills.
Challenges
Shortage of technical training personnel and limited training facilities.
• Solution: Embarking on aggressive marketing campaigns, introducing special incentives in order to attract suitable candidates to technical training posts and the extension of training facilities to deal with shortage of facilities.
New Projects
• Construction of the new Training Centre Building, focusing mainly on operations training, which is anticipated to be completed in December 2018.
Expected Challenges
• Challenges with legal appointments of Health and Safety Construction Agents as required by the 2014 Construction Regulations due to shortage of such agents in the country.
• Solution: Embarking on a drive campaign to register relevant staff as Construction Agents.
TECHNOLOGY SERVICES BRANCHThis Branch consists of three different Divisions, namely: the Engineering, Quality and Investigation and Library. These Divisions collectively ensure that the electrical products procured are fit for purpose by compiling the correct technical specifications, ensuring quality control at stores and investigating failed equipment.
One of the functions of the Branch is research into cost effective ways of distributing electricity. This function can be divided into two, namely, the cost of goods purchased and the costs associated with the installation, operation, maintenance and disposal of the said goods. Over and above the issues relating to construction and maintenance, safety of staff and public is high on the agenda both during the selection of a particular type of good and during its application. Technology Services has as its primary goals the adjudication of all tenders for technical equipment, material and services supplied to the Unit, and the creation and maintenance of all technical codes of practice and instructions used by Electricity Unit staff and contractors.
The Branch has continued its active participation in NRS Workgroups and SANS Workgroups in conjunction with other municipalities, Eskom, mines and major suppliers. This participation has been to promote uniform requirements for equipment and design methods for use in Distribution systems.
Highlights and Lowlights
• This Branch is responsible for compiling all tenders relating to electrical stock items. Once again the Branch managed to advertise and award all contracts timeously, some even months before the expiry of the existing contract.
1919
TECHNICAL SUPPOR T EThekwini Electricity Annual Report | 2017/18
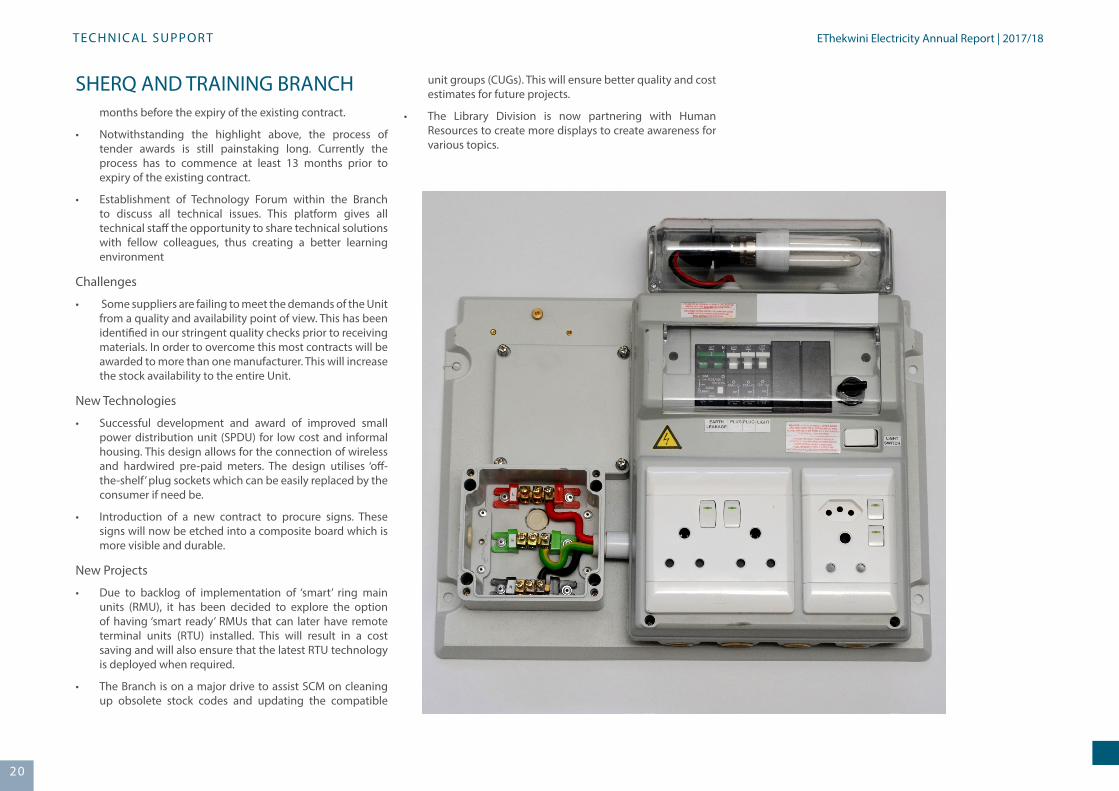
20
EThekwini Electricity Annual Report | 2016/17
SHERQ AND TRAINING BRANCH• months before the expiry of the existing contract.
• Notwithstanding the highlight above, the process of tender awards is still painstaking long. Currently the process has to commence at least 13 months prior to expiry of the existing contract.
• Establishment of Technology Forum within the Branch to discuss all technical issues. This platform gives all technical staff the opportunity to share technical solutions with fellow colleagues, thus creating a better learning environment
Challenges
• Some suppliers are failing to meet the demands of the Unit from a quality and availability point of view. This has been identified in our stringent quality checks prior to receiving materials. In order to overcome this most contracts will be awarded to more than one manufacturer. This will increase the stock availability to the entire Unit.
New Technologies
• Successful development and award of improved small power distribution unit (SPDU) for low cost and informal housing. This design allows for the connection of wireless and hardwired pre-paid meters. The design utilises ‘off-the-shelf’ plug sockets which can be easily replaced by the consumer if need be.
• Introduction of a new contract to procure signs. These signs will now be etched into a composite board which is more visible and durable.
New Projects
• Due to backlog of implementation of ‘smart’ ring main units (RMU), it has been decided to explore the option of having ‘smart ready’ RMUs that can later have remote terminal units (RTU) installed. This will result in a cost saving and will also ensure that the latest RTU technology is deployed when required.
• The Branch is on a major drive to assist SCM on cleaning up obsolete stock codes and updating the compatible
unit groups (CUGs). This will ensure better quality and cost estimates for future projects.
• The Library Division is now partnering with Human Resources to create more displays to create awareness for various topics.
TECHNICAL SUPPOR T EThekwini Electricity Annual Report | 2017/18
20 20
21
EThekwini Electricity Annual Report | 2016/17CUSTOMER AND RE TAIL SER VICES DEPAR TMENT
PRICING AND MARKETING BRANCH Electricity Pricing has been under extreme pressure in the last decade; initially owing to generation capacity and now, owing to the growth of the renewable sector. The changing generation mix together with the increase in disruptive technologies is driving a transformation in the energy sector thereby pressurizing utilities to adapt to a changing and complex environment.
The ever-present need to become energy conscious and mitigate greenhouse gases has and will be the back-drop for decades to come as environmentalists push on with the climate change agenda.
All of this in the presence of regulation, competitive pricing amongst utilities, the need to keep the economy turning and the provision of affordable services to all its’ citizens, with a particular emphasis on low income households.
It is in this convoluted, no and slow growth environment that we see the urgent need to adapt and evolve to embrace a rapidly changing distribution business.
Pricing Division
The Division designs electricity tariffs and provides tariff advice to key customers. Tariffs are designed to be cost-effective, whilst ensuring accurate cost recovery and reflectivity. The overall average tariff increase, as approved by NERSA, for the 2017/2018 financial year was 6.84 %. Tariff - design is proving to be a major challenge in the wake of the large increases from ESKOM and it has subsequently become more difficult
to design cost - reflective tariffs that are affordable to the end customer. Major emphasis has been placed on protecting the poor to ensure that they are not adversely affected by the huge increases. The tariff increases have been calculated in line with NERSA’s guideline methodology.
The Division achieved a milestone in embracing embedded generation from residential customers by providing a mechanism through which residential customers can sell their excess units generated back to the unit through the embedded generation tariff.
The section is also responsible for monitoring the key performance indicators of the Unit and maintaining a statistical database.
Marketing Division
The Marketing Division’s main purpose is to bridge the communication divide between our citizens and the Unit. Ongoing interactive events raise awareness and promote access to the Unit’s products and services. Knowledge of reducing energy consumption through behavioral changes and technology is being promoted by the marketing staff and starts at primary school level all the way to community imbizo’s and old age facilities.
The activities of the Marketing Division create a platform to engage with the public to address the following:
• Energy efficiency and demand side management (DSM),
• Climate Change and greenhouse gas emissions
• Service delivery problems and constraints
• Theft of electricity and infrastructure
• Products and Services offered
• Electrical safety and electricity hazards
A major focus area of the Unit is to electrify informal settlements. This presents a wide range of challenges, however, the commitment to surmount these barriers is commendable. The Marketing Section plays a critical communication and facilitation role between communities, councilors, contractors, consultants and within Municipality to realize this seemingly
unachievable target of electrifying each and every home within our boundaries.
CONTACT CENTRE BRANCHTo continue to assist eThekwini Electricity customers by providing multi-media and superior customer service to our potential and existing customers on a 24/7/365 basis. The Contact Centre aims to provide a one-stop hassle free faults, outage and theft reporting centre, capturing of meter readings and other general electrical queries. We will also give assistance in the use of prepaid meters, capturing of meter readings and other administration enquiries for the benefit of eThekwini Electricity’s service delivery and therefore attaining information with the aid of upgraded systems to provide our customers with correct and reliable feedback.We aim to deliver excellent service through multi-media communication, such a Voice, Email, Website, SMS and via Social Media.Our contact details are as follows:VOICE: 080 131 3111 & 080 311 1111 (toll free)SMS: 30909 EMAIL: [email protected]
Highlights
• The Contact Centre employees were part of the team that worked on a project (ONE NUMBER 080 311 1111) that was successfully launched in February 2018. EThekwini Municipality’s consumers are now able to contact just one number in order to receive assistance for multiple service requests such as Water and Sanitation, Electricity, Revenue etc. This project was so successful it was awarded a Bronze Award at the 2017/2018 KwaZulu-Natal Premier’s Service Excellence Awards held in Durban on 12 July 2018
• In January 2018 we introduced a new messaging system that sends reference numbers to consumers after they have logged a service request, this facility also sends follow up messages to update the consumer on the status of their fault till such time that it is resolved. This has given us better communication with consumers.
• In December 2017 we introduced a short code SMS line, 30909, for submission of electricity meter readings
The Customer and Retail and Services Department
provides a customer contact and retail services function
for the Electricity Unit. The Department consists of various
Branches that collectively perform a diverse range of
important functions.
OVERVIEW
EThekwini Electricity Annual Report | 2017/18
2121
22
EThekwini Electricity Annual Report | 2016/17
and other service requests. This proved to be the most popular form of submitting electricity meter readings, a total of 563 000 SMSes were processed between Dec 2017 and June 2018 via this short code channel.
Lowlights
• In the months of September and October 2017 the City of Durban experienced gale-force winds and inclement weather, including storms and heavy rains, which caused a few areas to experience repeated power failures. This in turn resulted in extremely high call volumes; calls taking longer than usual, as agents are tied up with callers and slower connections to the Contact Centre numbers. In those two months alone over 350 000 customers tried to reach our Contact Centre. The Contact Centre had to work extra hours to ensure that we assist as many consumers as possible and in the end we were able to get the calls back to normal manageable volumes.
New Technologies
• The launching of the City’s one number service. The 24-hour One Number is free. This channel of communication is aimed at integrating customer service processes and systems to deliver a robust and efficient service to all residents. This centralisation of Contact Centres will help customers to receive a more efficient service, in keeping with technological trends
Challenges
• We do not foresee any major challenges in the next financial year. We have seen a more positive relationship between Contact Centre and the Consumers, this was supported by the numerous compliments we received from customers
Achievements and awards
• KwaZulu-Natal Premier’s Service Excellence Awards 2017/2018: We were awarded with a Bronze award for the One Number Project from eThekwini Municipality.
CUSTOMER SERVICES BRANCHThis Branch is responsible for the processing of all applications for supply, registration of customers for billing purposes, meter reading services, auditing of meter readings, resolving account
queries/disputes, technical advisory service and the cashiering facilities at various electricity customer services shops.
A major challenge of the past year was the implementation of the Revenue Management System (RMS) which is still in the early phase of inception and Customer Services administration staff are still assisting when required to ensure that Electricity’s concerns are addressed. There have been delays in the RMS project and staff are working extra hours to cover up the lost time. The Customer Services Branch is bracing itself for final testing and intense training to ensure a smooth transition from Coins to RMS. Challenges with RMS and meter reading migrations have given rise to a number of customers with incorrect billing, these were identified and corrected.
In view of the high crime rate, customer services centres are always improving security for both their staff and customers. New cameras are being rolled out to all centres.
METER ENGINEERING BRANCHThe core responsibility of the Meter Engineering Branch is to ensure all metering equipment used for billing purposes are appropriately specified, tested, installed and maintained. To ensure these objectives are undertaken efficiently, the branch is sub divided into various specialized divisions, namely:-
• Advanced Metering & Projects, Metering
• Metering Workshop
• Whole Current Metering (Construction)
• Whole Current Metering (Maintenance)
• Bulk Metering division.
Advanced Metering and Projects Divisions
• This division is fundamentally accountable for the acquisition, specification and commissioning of new metering technologies. During the past year, this division has been focused on our Automated Meter Reading (AMR) systems. This AMR communication system was introduced to reduce manual readings and utilises wireless GMS technologies for the remote acquisition of metering data which is received by the master stations for billing purposes. The division is gearing towards the integration of its operation towards (AMI) Advanced Metering Infrastructure.
• The division is currently investigating new technologies such as PLC / RF and WI-FI as alternative means of communication in order to overcome technical challenges and prepare for future expansions. These technology will also allow insight into the network by maintaining contact with a greater number of our consumers.
• The advanced metering division is also responsible for ensuring that all the major customers satisfy requirements as specified in NRS, NERSA and other legal obligations for metering purposes. They ensure meter changes and maintenance of all equipment are aligned to those standards and obligations. Due to such requirements the division had embarked on a challenging process of filling vacancies in this department. The division is pleased to report the filling the majority of these vacancies and still managing to ensure we abide to the cities principle of employment equity.
Bulk Metering Division
• The Bulk Metering Division is responsible for all new applications and upgrades for the metering of large power users. This involves commissioning complex metering systems and the maintenance of such systems thereof. This division is directly responsible for the generation of metering data and the maintenance of nearly 1000 of our largest and most important customers that make up the majority of our total revenue generated by our metering department. The division also undertakes planning, forecasting and more importantly, the execution of load profile requests for tariff analysis purposes for our business customers.
• A number of challenges were faced by this division with regards to meter stocks and availability, which posed a stumbling block in delivery of service. To overcome this, the division engaged with other divisions and departments in a programme of active refurbishment of all quality meters in stock which was then used to ensure service delivery was not impeded.
Whole Current Division (Maintenance and Construction)
• The whole current metering division is further divided into maintenance and construction. This section is fundamentally responsible for all the new metering applications, upgrades, re-instatements, credit to prepaid
CUSTOMER AND RE TAIL SER VICES EThekwini Electricity Annual Report | 2017/18
22 22
23
EThekwini Electricity Annual Report | 2016/17
23
changeovers of small business, commercial and sectional title residential customers. Rectification of onsite faults and queries on all complex metering installations also forms part of the section’s responsibilities.
• These divisions has been chiefly responsible for a large ongoing operation for serving the need of change over from credit to prepaid metering. We have faced similar challenges with meter stock and availability and worked with sister departments to mitigate the impact on service delivery.
Metering Workshop Division
• The principle function of this department is to test, repair and calibrate all single and three phase meters. The division also provide critical support for equipment quality assurance by currently sample testing new meters purchased. This is achieved by making use of the recently procured test benches. Due to the new equipment purchased in the previous year, the division was well equipped to assist other divisions in ensuring meters were available during the challenging times of meter shortages. The staff have strived towards professional service to the public in.
• The Meter Engineering Branch has embarked on an exciting journey for the next few years to ensure that strategy of our city is achieved while ensuring that our new customers will have the opportunity to a wide variety of new technologies and tariff options. We intend on improving operationally and provide an efficient and effective service to all stakeholders and customers.
REVENUE PROTECTION BRANCHThe primary function for the Revenue Protection Branch is to minimize the non-technical losses in the distribution network. This is achieved through efficient disconnections of illegal connections and customers who are in arrears. This aids in enforcing credit control measures and ensures that revenue is collected timeously.
The pillars of successful revenue protection are People, Processes and Technology, need to be integrated into a Revenue Protection Strategy. The following projects or technologies are implemented by eThekwini Municipality to
enhance Revenue Protection.
• Meter Management and Operation System.
• Implementation of AMI.
• Smart Prepayment Module – Phase 1 (Suprima).
• Registration of Customers & Update of Pre Paid Property Key.
• Revenue Management (Debt and credit management) & Deployment of Super Vendors
• Installation of Prepayment Meters and the principle of debt collection via a prepaid meter i.e. 80/20 & 50/50 policy.
• Protective Structures.
• Audit of Business Customers.
Challenges
• Over the years eThekwini have embarked on projects that contributed in the success of eThekwini Electricity maintaining total losses to below 6 percent. Recently our losses are on 7.1%.
Highlights
Meter Management and Operation System
EThekwini invested in a structured Revenue Protection Department with three regional offices and field teams reporting to each office. They are focusing on reducing losses over the entire meter base, but the inherited challenges faced with the pre-payment system made it difficult to get “ahead of the game.” The following was required to address this challenge:
• One Central Master System that reconciled all records.
• A structured field audit with the aim of normalizing all pre-payment and as well as residential credit meter records.
• An integrated Work Order system to manage all follow up field operations and record updates.
• Data Reporting and Data mining to plan and execute a pro-active Revenue Protection program.
With more than 350 000 pre-payment meters under our management, field operations and data management
could quickly become a daunting task. A high level of data validation and seamless system integration would be required. Previous audits have met with limited success because of these challenges.
• The field operations consisted of two separate, but integrated actions. The first action was the physical meter audits. The primary aim of the audit was to update the meter records and to identify each meter position with an accurate GPS coordinate. The audit teams would first finish the work in a small designated area before the second action was initiated. This follow up action was to address all required remedial field work identified by the initial audit. These operations are executed by a separate specialised normalization team. The advantages of this approach include:
• The audit team focus on the data acquisition and their productivity is optimized.
• The negative impact with limited access when tamper disconnections. By first completing the audit sweep the access rate is much higher.
• Fraud is limited since there is no imputes to bribe the audit team not to report anomalies. The audit team have no direct contact with the normalization team.The normalization team’s skill set is selected towards the remedial tasks to be performed. An electrician’s time is not wasted by being held back by the overhead of a full data audit.
We embarked on a program to normalize our pre-payment data set and in parallel launched a paperless works order system to follow up on all remedial tasks identified through this project. We are now in the position to run an intelligent revenue protection program based on back office analysis and targeted inspections. The positive results are already evident and the future returns should be even greater. The success of the operation can be measure by having the correct building blocks in place comprising:
• People – A project can only be effective with committed and dedicated resources.
• Processes – The correct processes and procedures established at the start of the project are essential.
CUSTOMER AND RE TAIL SER VICES EThekwini Electricity Annual Report | 2017/18
2323
24
EThekwini Electricity Annual Report | 2016/17
• Technology – This is the last element, but it is only effective once the first two pillars are in place. Investing in technology on its own will not ensure success.
Implementation of AMI
The use of smart meters is widely viewed as effective for increasing energy efficiency and is consistent with the attempts of many countries in issues of energy efficiency and sustainable development.
A smart meter is an energy metering device with enhanced capacity to store and analyse information about energy consumption in real time. A smart meter also enables two-way communication function between energy utilities and each end user. Smart meters are a major component of next-generation smart grid because they can integrate information technology into the grid.
After collecting energy consumption data from customers using appropriate devices and communication infrastructure, eThekwini Municipality will be in a position to manage electricity demand more efficient and advise users to consume the power wisely. Based on the long-term power usage pattern, the feedback information from smart meter data analytics will offer consumers a better understanding of their energy consumption and help them increase end-use energy efficiency.
Leveraging Smart Meters
EThekwini Electricity intend to focused on integrating and optimizing information gathered by smart meters (and transmitted by AMI communications systems) and other investments in the digital grid to provide benefits and new capabilities to customers and system operators. The following are the few areas where eThekwini Electricity will be leveraging smart meters.
Systems Integration: AMI systems will be integrated with distribution management systems (DMS) to provide enhanced outage management and restoration and improved distribution system monitoring.
Operational Savings: Smart meters will result in operational savings such as reduced truck rolls, automated meter reading, and reduced energy theft.
New Customer Services: Smart meters will have enabled
services such as automated budget assistance and bill management tools; energy use notifications; and smart pricing and demand response programs.
Smart Prepayment Module – Phase 1 (Suprima)
This phase was the implementation of the smart prepayment vending module. This was intended to be implemented as the last phase. However, based on business needs since the existing vending contract was expiring, then this was pushed to the top.
This benefited the municipality in the following ways:
• The vending system is fully owned by the municipality as opposed to the previous one which was hosted.
• The management of the system in overseen by eThekwini Staff wholly.
• Legacy systems from the previous system were eliminated, thus making the management of third party vendors easy. With the new system only was super vendor is managed by the municipality.
• System reporting is another major benefit to the municipality. Relative stakeholders can access and gnat reports as per their assigned roles in the organization.
• Business processes for managing prepayment and its associated roles improved because reliance on legacy systems was eliminated.
Then central feature of Suprima is its ability to vend electricity to meters that are registered on the system. The meter needs to be registered so that the system has the details it needs to encrypt the credit transfer number (CTN) correctly.
There are 2 sets of information that are important, firstly the meter encryption details, such as the Supply Group Code (SGC), Tariff Index (TI) and Key Revision Number (KRN) that the meter is on. If these are incorrect then the meter will not be able to decrypt the content of the CTN, and it will be useless.
The second set of information is the Tariff, Tax, Arrears and Fixed Charge information associated with the meter. These details are required so that the system can calculate the appropriate amount of electricity to issue to the customer for the money they tender.
Because the CTN can only be used in the meter that it is generated for, and because there are financial details associated to the meter, the first step is to find the meter that you are vending to, before you can do anything else.
Registration of Customers / Pre-paid Property Key
EThekwini Electricity embarked on Customer Data Cleaning exercise that ensures that all prepayment customers are registered and this exercise was very critical in successfully implementation of Suprima prepayment vending system.
Before being able to vend to a meter there are a number of items that need to be registered on the system. This is so that Suprima can correctly determine the meter’s configuration so that the correct encryption parameters can be applied and so that it can calculate the charges that are to be applied, and other amounts that need to be recovered.
The registration is also needed to be able to manage your meter park correctly, so that you can determine who the consumers are, where they live and how much electricity they use.
The thing to remember about the registration process is that the old Information Technology adage GIGO (Garbage In Garbage Out) applies. If a bare minimum of data is carelessly entered into the system, then that is all you will have, garbage.
Fixing this after the fact is nearly impossible, so you should spend the time to make sure that it is done properly when the meters are being installed.
EThekwini Electricity is also embarking on a project of collecting the Pre-Paid Property Keys in order to have the Pre-Paid Service introduced on the new Revenue Management System (RMS).
Revenue Management (Debt and Credit Management)
This is based on the Smart Prepayment Vending System as it has been fully deployed since January 2016. The following are the benefits thus far:
• The system is fully owned by the Municipality as opposed to the previous system that was hosted by its supplier. The unit is set to break even in October 2016, this is based on comparing the monthly hosting fee that was paid by the municipality versus the capital cost of the system.
• The relevant municipality staff has full access to the system as per their relevant roles, as opposed to having an
24 24
CUSTOMER AND RE TAIL SER VICES EThekwini Electricity Annual Report | 2017/18
25
EThekwini Electricity Annual Report | 2016/17
individual running the system with the supplier.
• Debt management (arrears collection) is integrated in the prepayment system. This is implemented using open standards as opposed to bespoke/legacy methodology.
With the introduction of the system, the municipality now deals with three super vendor for selling electricity to the customers as opposed to one in the past years. Utilizing three super vendor will enabled the Municipality to improve on the collection on electricity sales and to maintain stability.
The three super vendors are Cigi Cell, Sandulela and Contour.
Installation of Prepayment Meters and the principle of debt collection via a prepaid meter i.e. 80/20 & 50/50 policy
• The reinstatement / inclusion of the 80/20 debt recovery programme in the Credit Control Policy was of great importance as it helped to accommodate the customers who cannot afford to settle the Municipal debt.
• The installation of a prepayment metering system and the principle of debt collection via a prepaid meter played a crucial role in affording the poorest of the poor access to basic services, in the process partly alleviating the problem of non-payment of services. It is critical that one devise strategies that are complementing each other to ensure sustainability. We strategically targeted poor customers who are struggling to pay for their services to install prepayment meters, the majority of them are exempted to pay rates and their water consumption are low, as a result, they pay very little for Water or they don`t pay at all due to the 6klrs free that they qualify for. So, it make sense to encourage these customer to install prepayment meters due to the following advantages for a prepayment metering system:- Can budget for the cost of the usage of electricity; can purchase electricity for as little as R5; there are no shocking bills at the end of the month; you use only what you can afford, and pay for it in advance, your meter indicates which appliances use a lot of electricity, your meter indicates the credit you have left in your meter; when your electricity runs out, your meter switches off automatically. Thus, you will not incur any debt by using electricity for which you have no money for, as with the credit meters. Also there will not be any reconnection fees, penalties and interest charges, as there will not be any
arrears; etc.
Protective Structures/Enclosures
In some instances Meter Room doors (Steel) are vandalised. As a result, customers were continuously tampering with electricity meters and illegally or dangerously connecting cables onto our electricity supply network.
In areas where vandalism is rife we decided to install Vandal Proof Meter Room Doors or Protective Structures with an electronic locking system. These Structures are designed with external hinges and an internal locking system. The design is such that with the hinges removed the door cannot be opened.
Benefits:
• Asset Protection to ensure minimal energy losses (non-technical)
• To prevent unauthorized access and damage.
• Enclosure has a high security features.
• It can be monitored and controlled remotely.
The Protective Structure Contract was awarded to two Service Providers as opposed to one to maintain stability.
Audit of Business Customers (CT Driven Installations)
The annual financial losses to energy suppliers caused by connection errors in meter installations are not to be neglected. There are many possibilities in making incorrect connections during installation. In many cases, installation faults are rarely discovered at the time of billing and, sometimes, not recognised for many years. This results in considerable losses to energy suppliers.
In the energy market the meaning of correct energy billing becomes even more important, especially because more parties are involved in this process.
It is imperative that utilities provide the necessary training to the Revenue Protection and Meter Engineering staff, set out procedures for the re-commissioning and verification of measurement and metering equipment and to provide the standard tools and test equipment required by technicians to perform their tasks to ensure that the required safety and/or quality standards are practiced.
The policy that defines the criteria regarding planned maintenance on electricity metering and measurement equipment needs to be adopted to ensure that utilities comply with NRS 057 and the Electricity Metering Code of Practice.
Revenue Protection Division conduct annual audits to verify measurement and metering equipment and analyse the circuit faults found during the verification.
Challenges
• Increasing number of informal settlements contributes to the high rise on the number of Illegal Connections even though the Council has taken a resolution to electrify the informal settlements.
• Delays in the award of the contracts contributed on the increase of losses e.g. Meter Sweep.
• Shortage of resources remains a challenge in our industry even though effort is being made fill critical positions.
• Challenges in the introduction of the New Systems and Training of Staff.
Most customers are converting to a pre paid system as they feel this is a way to go in order to avoid estimated charges and this also helps the Council in collecting the revenue in advance.
252525
CUSTOMER AND RE TAIL SER VICES EThekwini Electricity Annual Report | 2017/18
26
EThekwini Electricity Annual Report | 2016/17
The Human Resource Department is responsible for providing guidance and support to the employees of eThekwini Electricity Unit. HR Staff are involved in addressing issues which impact Human Resource management for the Unit as a whole, through coordination of policy issues and involvement in labor relations activities.
HUMAN RESOURCESDERPAR TMENT
OVERVIEW
Highlights
• Sthembile Tobo was appointed into the Senior Manager HR role effective 1 February 2017.
• The total number of permanent staff is 2394.
• Talent management committee (TMC) was held successfully.
• The City’s project of retaining scarce skills as well to create succession pools for continuity, and sustainability of the business.
• Outstanding appeals from the Final Outcomes report were finalised, all employees who were eligible for back pay were paid timeously.
• The Workplace Skills Plan was signed by all stake holders. There are a number of programmes to help with upskilling of our employees such as Foundation skills programme (electrical), Superintendent Sevelopment Srogramme and Clerical Development Programme.
• Apprentice Programme is to recruit 50% from internal employees.
• Performance Management training is ongoing. There were 310 employees trained during this period of reporting.
• The capturing of e-performance plan was 100% achieved for the entire Electricity Unit.
Challenges
• Funded vacancies
• This remains a challenge within the Electricity unit. We have the highest number of funded vacancies in the City. However there is a huge recruitment drive to fill all funded and vacant posts. This will help the Unit in keeping the light on as well as reduced the excessive overtime.
• The 307 posts were advertised, appointments were made in line with the Recruitment policy and the Employment Equity Plan of the City (2014 – 2018).
Future Focus
• Filling of all funded vacant post with the appropriate demographics.
• Reducing overtime to acceptable level.
• Resolving all outstanding collective grievances.
• Change Management.
HUMAN RESOURCES BRANCH
EThekwini Electricity Annual Report | 2017/18
26 26
27
EThekwini Electricity Annual Report | 2016/17
ADMINISTRATION BRANCH
The Branch offers support services, in respect of General Administration, Fleet Management and the provision of Office and Workshop Buildings.
The Administration Section is responsible for various administrative functions, which include Document Management, Word Processing, Vehicle Monitoring System, Telephone Management System and CCTV, for site security.
The Building Section is responsible for the security, maintenance and safety, of the assets and personnel on various Buildings.
The extension of our area of supply and rapid increase of Staff numbers, necessitates the growth of available office accommodation and parking areas. The completion of the extensions, to the Control Building, a new building at our current Training Centre and completion of a new Customer Service Centre, in Pinetown, will alleviate some office space demands. Future plans being implemented, are the
restructuring of existing office space and erection of a new building.
The Fleet Section is responsible for the acquisitions, servicing, maintenance, usage, and disposal of the Electricity Service Unit Fleet. The Fleet consist of 1398 vehicles and plant, consisting of various types of Cranes, Aerial Platforms, Trucks, Bakkies, Cars, Generators, Trailers and Compressors. The majority of the fleet, are specially modified vehicles, which are adapted to best suit the operational work activities undertaken by Technical Staff.
The rapid employment of new Staff and Budget constraints impacted negatively on vehicle availability and Office Accommodation. A new Fleet Monitoring Systems (Net star) has been introduced which offers enhanced features, such as speeding reports.
INFORMATION AND COMMUNICATION TECHNOLOGY BRANCH2017 has proved to be another challenging year for the ICT Department, dominated by the number of post implementation challenges of JDE for Finance, Materials Management and SCM. The expanded use of Ellipse functionality at Electricity to support the Enterprise Asset Management Improvement Program and a number of additional business processes, has been a continuous focus area for ICT with improvements in integration methods and mechanisms now becoming a priority. The Municipalities’ standardization on Microsoft Solutions for Directory Services, File & Print Services, Collaboration and Office Productivity software has initiated a project to transition Electricity from its current Microfocus (ex Novell) technologies. Whilst in the early stages of the project, there were a number of challenges identified, which will need to be addressed to ensure a seamless and successful transition.
The first half of the year was characterized by ICT’s focus on
ensuring current systems availability, over embarking on any new major ICT initiatives, projects and system implementations, due to the uncertainty regarding alignment to IMU initiatives and city wide strategies, as well as the acute skills shortages experienced in ICT. A number failures of the cooling and UPS systems in the Main Data Centre, attributable in the main, to the extensive building renovations, resulted in significant rectification and recovery initiatives and the implementation of additional and more extensive monitoring and response systems and processes. Planning for the replacement of Electricity’s ageing ICT infrastructure to consolidate and support Electricity’s Virtualisation Strategy and address the Auditor Generals requirements regarding Business Continuity and Disaster Recovery was finalised. The initiative will result in the modernisation of our ICT Hardware platform to improve availability, reduce system administration complexity and effort, support rapid DR, improve ICT Governance whilst catering for the growth predicted for our current and future systems.
Despite the significant efforts made in terms of recruitment in ICT, the human resource capacity and ICT organizational structure limitations continue to hamper the delivery of services and affect the ability of ICT to improve in its ICT Governance maturity. The long term vacancies in key posts such as Data Centre Operations Manager and Chief ICT Support Officer, are having a significant negative impact on staff morale as the duties of these posts are having to be performed by already over-extended staff. A fundamental overhaul of the ICT Department will be required to address the structural deficiencies that are increasingly evident due to the changes in the ICT portfolio and the increasing complexities of the ICT landscape together with the increasing service demands of the Unit. Recruitment will remain a key internal focus for the Department in the forthcoming year.
BUSINESS RISK CONTROL BRANCHThe Business Risk Control Branch is responsible for the formal identification, evaluation and mitigation of risks within
27
COMMERCIAL DERPAR TMENT
The Commercial Department comprises of the Finance, Information Communication Technology, Productivity and Business Process Engineering Branches. Supply Chain Management, Business Risk and Administration play a vital support role to the EThekwini Electricity Unit. The Department also participates in numerous other Council projects and committees. The aim of the Department is to provide effective logistical support to the technical operations of the unit while ensuring that legislative practices, controls, policies and procedures are complied with.
OVERVIEW
EThekwini Electricity Annual Report | 2017/18
272727
28
EThekwini Electricity Annual Report | 2016/17
28
COMMERCIAL DERPAR TMENT
eThekwini Electricity. Compliance to policies and procedures is assessed for the different Departments within the Unit to assist to improve controls by generating appropriate solutions to resolve problems/issues.
Risk workshops were conducted during the year with all the Departments, where the Unit’s strategic and operational risks were identified and assessed. Together with the relevant stakeholders, risk mitigation strategies were designed. The workshop also led to the development of the Unit’s risk register which is considered an integral part in the effective management of the business. Regular monitoring of progress on the various tasks allocated to task owners has been conducted and it is envisaged that completion of the various tasks would meet their desired target dates and consequently support the mitigation strategies.
The vision of eThekwini Municipality is “By 2030 eThekwini will be Africa’s most caring and liveable City” hence the Enterprise Risk Management strategy was adopted to provide assurance that the risks that might hinder the City from achieving its objectives and its vision, are managed. It is our aim to conduct identification of the Unit’s future potential risks with a view to alerting management timeously to ensure that adequate time is available for the development and implementation of mitigating strategies.
FINANCE BRANCHThe Finance Branch is responsible for the financial control over all activities of the Department. This includes, inter alia, the management, monitoring and control of revenue, expenditure, capital expenditure, insurance claims, financial systems, procedures and the provision of advice and guidance on matters related to finance to all personnel. The Department’s annual and medium term budgets, annual financial statements and monthly management reports are prepared by the Finance Branch.
The Branch also monitors compliance with statutory and internal regulations. In addition the annual financial statements for the 2018/2019 year and the multiyear budgets for the 2018/2019 year onwards were prepared and approved within the stipulated deadlines.
The Regulatory Reporting Manuals (RRM) reporting required by the National Energy Regulator of South Africa (NERSA) was completed with recommendations to the regulator for some improvements and changes to the current format.
2017/18 Annual Financial Statements have been audited and the Municipality again received an unqualified audit. Management would like to express their appreciation to the dedication and enthusiasm displayed by the staff.
SUPPLY CHAIN MANAGEMENT BRANCHThe Bid Administration Section administers 71 contracts for the supply of goods and services of which 49 are labour contracts.
In the beginning of this financial year (17/18), the payment of service providers became a challenge as a new system JDE was introduced replacing the Ellipse system. For the first two months service providers could not have their invoices processed within the 30 days period as per the Municipal Finance Management Act regulations. All officials within the Bid Administration section that needed training, were trained following the implementation of the system. This was resolved during the fourth and fifth month of the year thus resulting in fewer queries related to the payment of service providers.
The section has also seen an increase in section 24 approvals, requiring SCM together with Divisions’ deputy heads or their nominees to negotiate final terms of contracts before awards are made by the Bid Adjudication Committee.
Towards the end of the financial year, the City Manager formed a new committee, the Executive Acquisition Committee. The role of this committee is to consider reports that have been approved by the BAC, and this means that awards are taking longer.
Tenders advertised (>R10 million, CM approval): 7 Tenders advertised (below R10 million : 25Awarded: 36Non awards declared : 4
Number of appeals received: 5Number of Section 24 negotiations: 10
Five appeals were received by the Appeals Committee and were successfully defended.
PRODUCTIVITY BRANCHThe Productivity Branch contributes to the upgrading of productivity and efficiency throughout the Unit by closely monitoring the productivity of both in-house and contractor teams, and ensuring that the undertaking remains cost effective whilst maintaining a high level service standard to management.With the ever increasing number of contractors working for the Unit, monitoring and verification of worked claimed is essential in ensuring that a high standard of efficiency and productivity is maintained and that any fraudulent booking of work is brought to the immediate notice of management. There were two resignations and an early retirement during the year, appointments have been made and we are awaiting for the final approval from Management, so hopefully the new incumbents will be starting early in the new year.The new Incentive Bonus programme is almost completed and testing is currently taking place. Training of staff will commence in the new- year and the roll out should be completed by the end of March 2019.Below are the average working efficiencies for the various sections recorded over the past financial year.
EThekwini Electricity Annual Report | 2017/18
2828
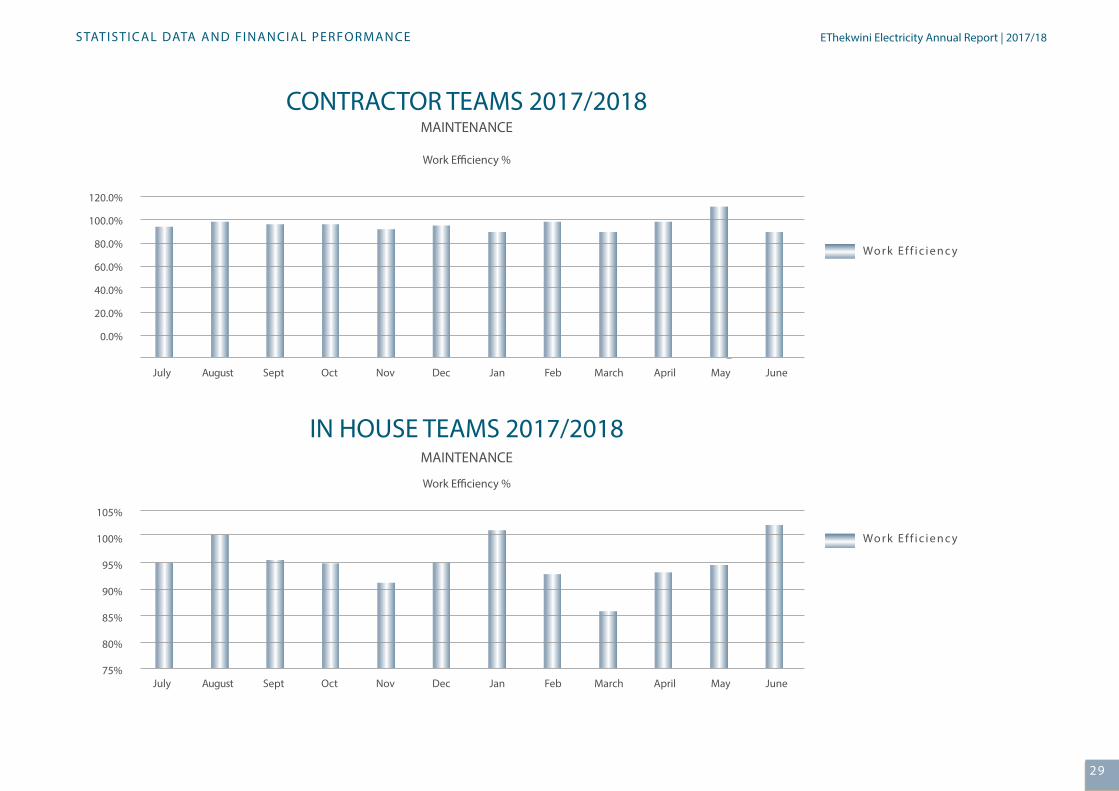
29
EThekwini Electricity Annual Report | 2016/17STATISTICAL DATA AND FINANCIAL PERFORMANCE
IN HOUSE TEAMS 2017/2018
Work Efficiency %
105%
100%
95%
90%
85%
80%
75%July OctAugust Nov Dec Feb AprilSept Jan March May June
CONTRACTOR TEAMS 2017/2018MAINTENANCE
MAINTENANCE
Work Efficiency %
120.0%
100.0%
80.0%
60.0%
40.0%
20.0%
0.0%
July OctAugust Nov Dec Feb AprilSept Jan March May June
Wo r k E f f i c i e n c y
Wo r k E f f i c i e n c y
EThekwini Electricity Annual Report | 2017/18
29292929
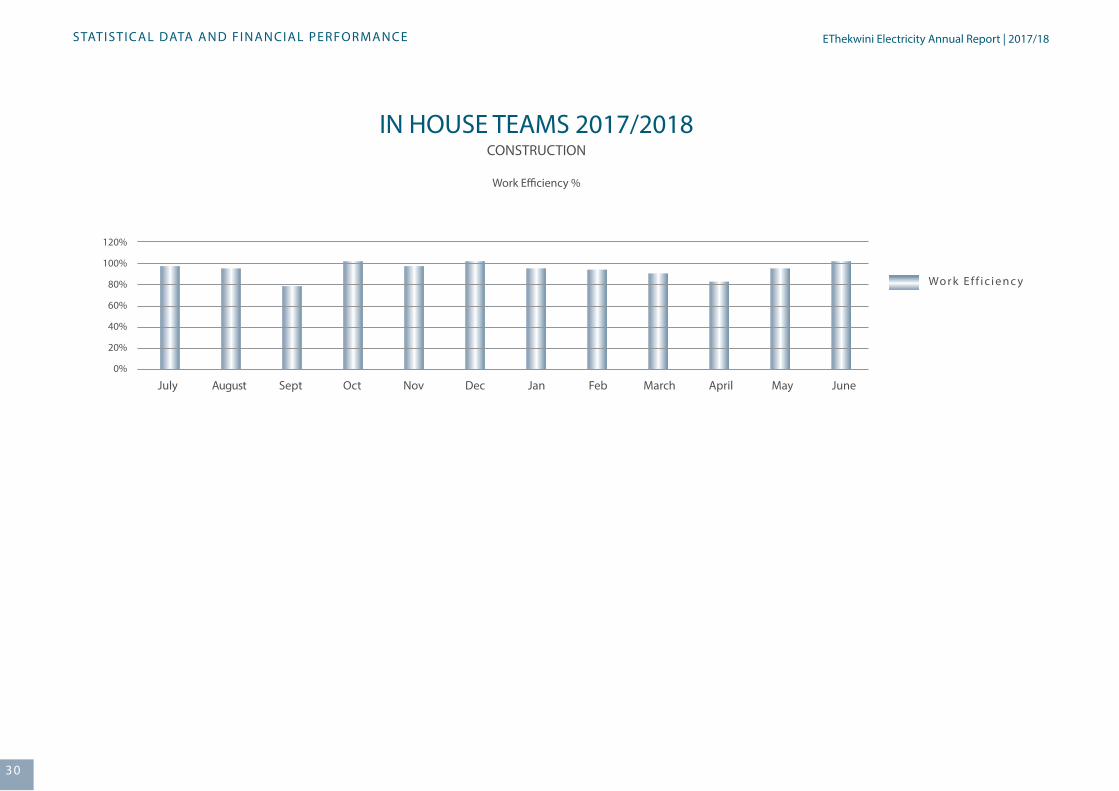
30
EThekwini Electricity Annual Report | 2016/17STATISTICAL DATA AND FINANCIAL PERFORMANCE
IN HOUSE TEAMS 2017/2018CONSTRUCTION
Work Efficiency %
120%
100%
80%
60%
40%
20%
0%
July OctAugust Nov Dec Feb AprilSept Jan March May June
Wo r k E f f i c i e n c y
EThekwini Electricity Annual Report | 2017/18
303030

31
EThekwini Electricity Annual Report | 2016/17STATISTICAL DATA AND FINANCIAL PERFORMANCE
GRAPHSFINANCIALSTATEMENTSSTATISTICALDATA
31313131
EThekwini Electricity Annual Report | 2017/18
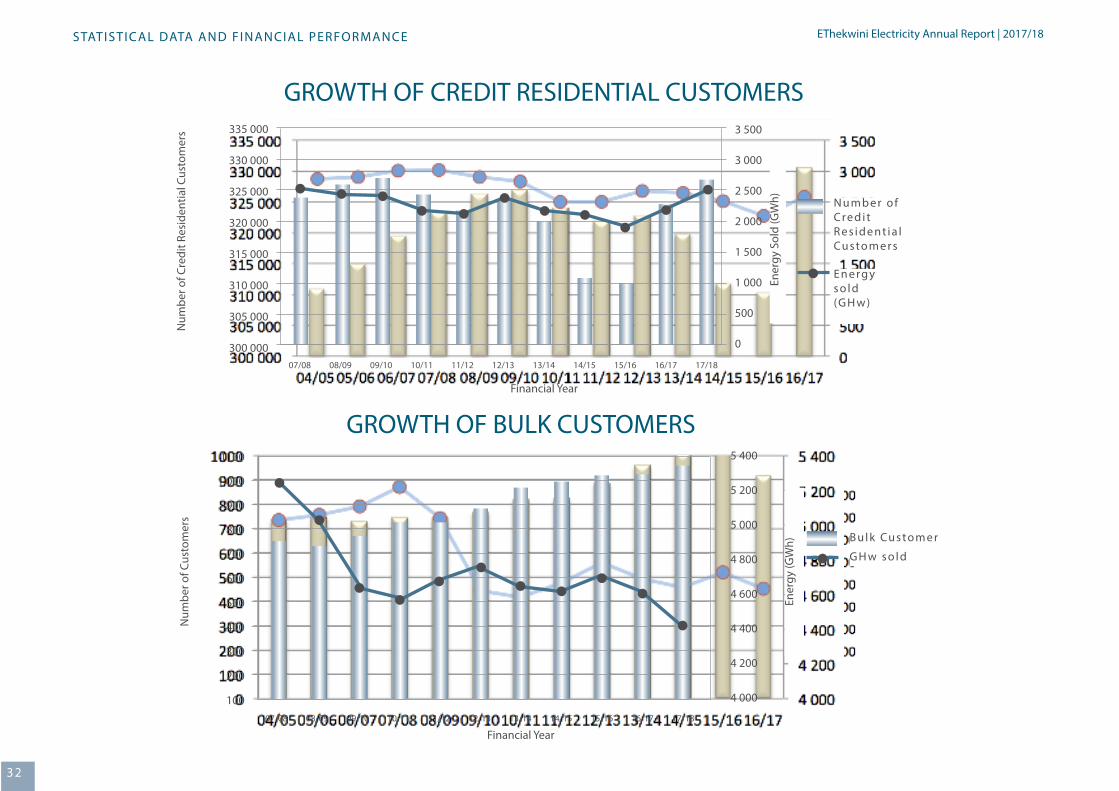
32
EThekwini Electricity Annual Report | 2016/17
AVERAGE kWh PER CREDIT RESIDENTIAL CUSTOMER/MONTH
STATISTICAL DATA AND FINANCIAL PERFORMANCE EThekwini Electricity Annual Report | 2017/18
323232
GROWTH OF CREDIT RESIDENTIAL CUSTOMERS
Financial Year
Num
ber o
f Cre
dit R
esid
entia
l Cus
tom
ers
Ener
gy S
old
(GW
h) N u m b e r o f C re d i tR e s i d e nt i a l Cu s to m e r s
E n e rg ys o l d (G H w )
07/08 10/1108/09 11/12 13/14 15/16 17/1809/10 12/13 14/15 16/17
335 000
330 000
325 000
320 000
315 000
310 000
305 000
300 000
3 500
3 000
2 500
2 000
1 500
1 000
500
0
GROWTH OF BULK CUSTOMERS
Financial Year
Num
ber o
f Cus
tom
ers
Ener
gy (G
Wh) B u l k Cu s to m e r
G H w s o l d
07/08 10/1108/09 11/12 13/14 15/16 17/1809/10 12/13 14/15 16/17
1100
1 000
900
800
700
600
500
400
300
200
100
5 400
5 200
5 000
4 800
4 600
4 400
4 200
4 000
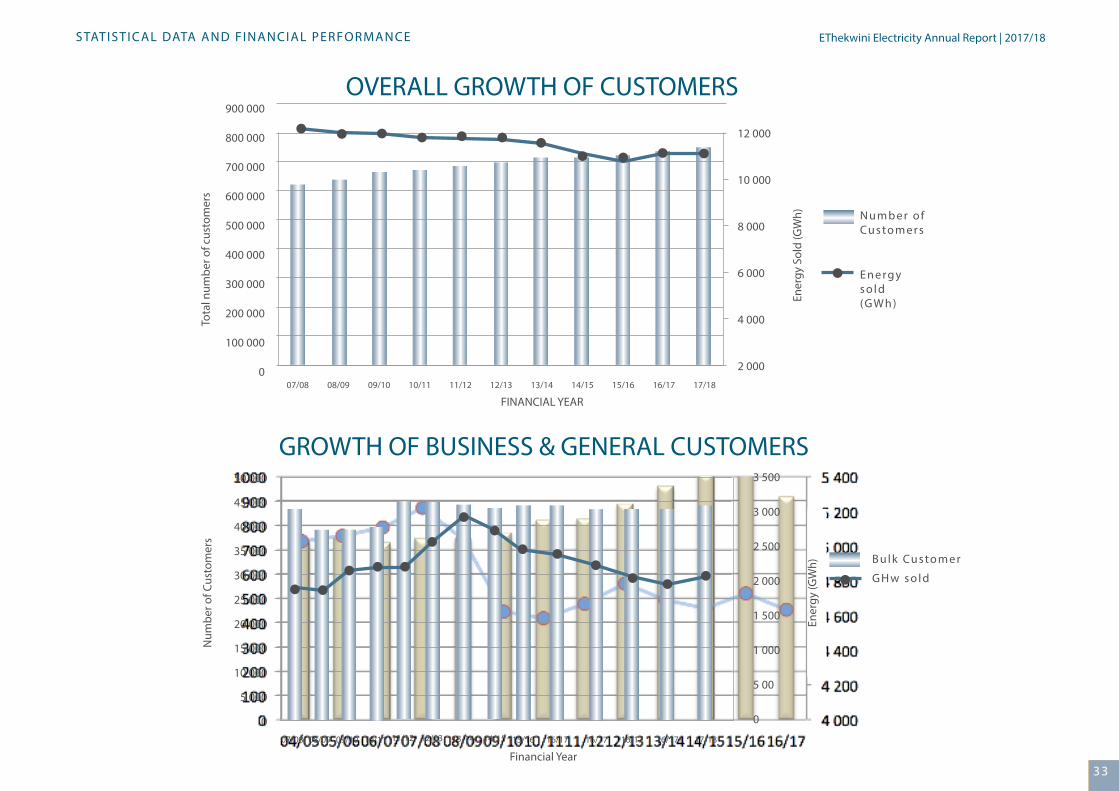
33
EThekwini Electricity Annual Report | 2016/17STATISTICAL DATA AND FINANCIAL PERFORMANCE EThekwini Electricity Annual Report | 2017/18
33333333
OVERALL GROWTH OF CUSTOMERS
FINANCIAL YEAR
Tota
l num
ber o
f cus
tom
ers
Ener
gy S
old
(GW
h) N u m b e r o f Cu s to m e r s
E n e rg y s o l d(G Wh )
12 000
10 000
8 000
6 000
4 000
2 000
900 000
800 000
700 000
600 000
500 000
400 000
300 000
200 000
100 000
007/08 10/1108/09 11/12 13/14 15/16 17/1809/10 12/13 14/15 16/17
GROWTH OF BUSINESS & GENERAL CUSTOMERS
Financial Year
Num
ber o
f Cus
tom
ers
Ener
gy (G
Wh) B u l k Cu s to m e r
G H w s o l d
07/08 10/1108/09 11/12 13/14 15/16 17/1809/10 12/13 14/15 16/17 16/17 16/17 16/17
50 000
45 000
40 000
35 000
30 000
25 000
20 000
15 000
10 000
5 000
0
3 500
3 000
2 500
2 000
1 500
1 000
5 00
0
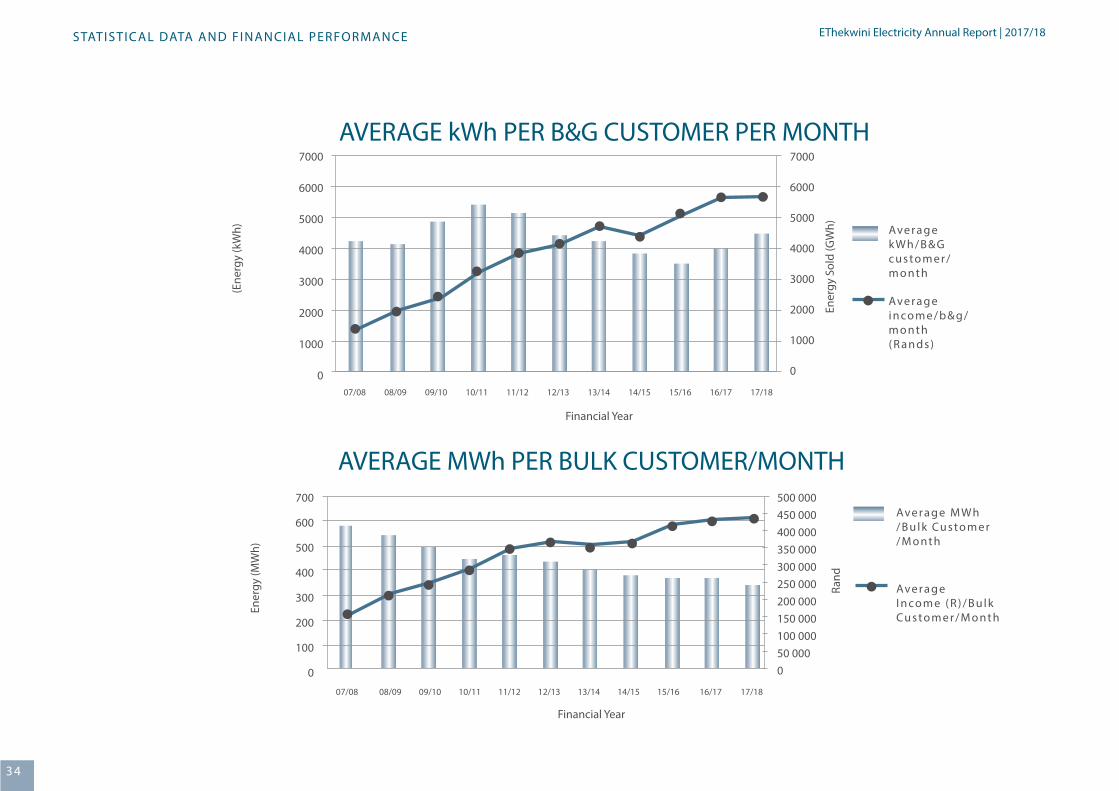
34
EThekwini Electricity Annual Report | 2016/17STATISTICAL DATA AND FINANCIAL PERFORMANCE EThekwini Electricity Annual Report | 2017/18
343434
AVERAGE kWh PER B&G CUSTOMER PER MONTH
Financial Year
(Ene
rgy
(kW
h)
Ener
gy S
old
(GW
h) Ave ra g e k Wh / B & G c u s to m e r /m o nt h
Ave ra g e i n co m e / b & g / m o nt h ( R a n d s )
07/08 10/1108/09 11/12 13/14 15/16 17/1809/10 12/13 14/15 16/17
7000
6000
5000
4000
3000
2000
1000
0
7000
6000
5000
4000
3000
2000
1000
0
Financial Year
AVERAGE MWh PER BULK CUSTOMER/MONTH
Ener
gy (M
Wh)
Rand
Ave ra g e M Wh/ B u l k Cu s to m e r/ M o nt h
Ave ra g e I n co m e ( R ) / B u l k Cu s to m e r / M o nt h
07/08 10/1108/09 11/12 13/14 15/16 17/1809/10 12/13 14/15 16/17
500 000450 000 400 000350 000300 000250 000200 000150 000100 00050 0000
700
600
500
400
300
200
100
0
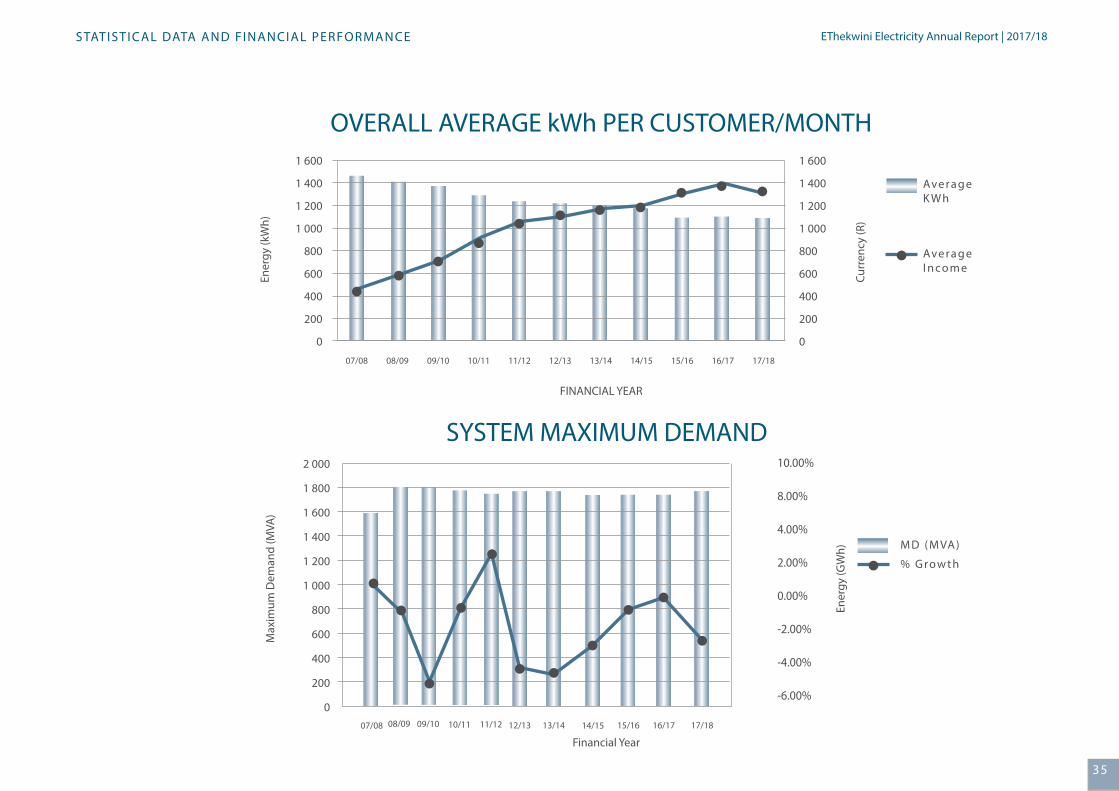
35
EThekwini Electricity Annual Report | 2016/17STATISTICAL DATA AND FINANCIAL PERFORMANCE
OVERALL AVERAGE kWh PER CUSTOMER/MONTH
FINANCIAL YEAR
Ener
gy (k
Wh)
Curr
ency
(R)
Ave ra g e K Wh
Ave ra g e I n co m e
1 600
1 400
1 200
1 000
800
600
400
200
0
1 600
1 400
1 200
1 000
800
600
400
200
0
07/08 10/1108/09 11/12 13/14 15/16 17/1809/10 12/13 14/15 16/17
EThekwini Electricity Annual Report | 2017/18
35353535
SYSTEM MAXIMUM DEMAND
Financial Year
Max
imum
Dem
and
(MVA
)
Ener
gy (G
Wh) M D ( M VA)
% G row t h
07/08 08/09 10/11 12/13 17/1809/10 11/12 13/14 14/15 15/16 16/17
2 000
1 800
1 600
1 400
1 200
1 000
800
600
400
200
0
10.00%
8.00%
4.00%
2.00%
0.00%
-2.00%
-4.00%
-6.00%
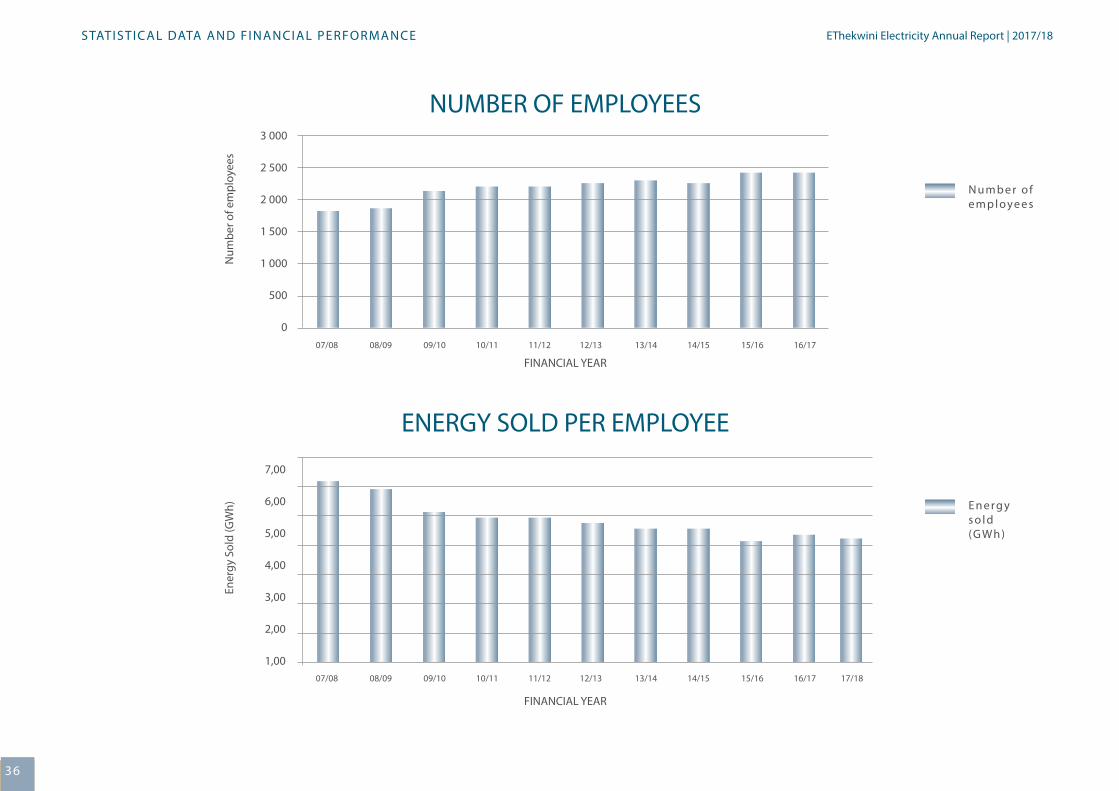
36
EThekwini Electricity Annual Report | 2016/17STATISTICAL DATA AND FINANCIAL PERFORMANCE
NUMBER OF EMPLOYEES
ENERGY SOLD PER EMPLOYEE
FINANCIAL YEAR
FINANCIAL YEAR
Num
ber o
f em
ploy
ees
Ener
gy S
old
(GW
h)
N u m b e r o f e m p l oye e s
E n e rg y s o l d(G Wh )
3 000
2 500
2 000
1 500
1 000
500
0
7,00
6,00
5,00
4,00
3,00
2,00
1,00
07/08
07/08
08/09
08/09
10/11
10/11
12/13
12/13
14/15
14/15
09/10
09/10
11/12
11/12
13/14
13/14
15/16
15/16
16/17
16/17 17/18
EThekwini Electricity Annual Report | 2017/18
36363636
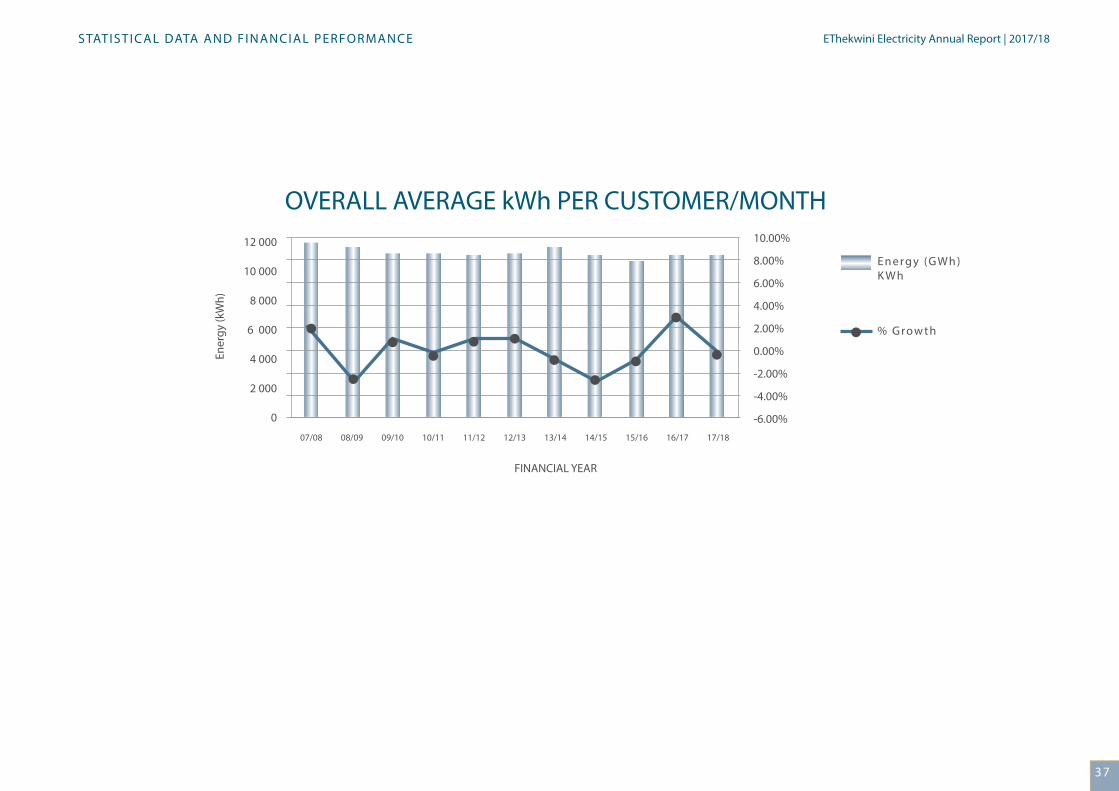
37
EThekwini Electricity Annual Report | 2016/17
363636
STATISTICAL DATA AND FINANCIAL PERFORMANCE
OVERALL AVERAGE kWh PER CUSTOMER/MONTH
FINANCIAL YEAR
Ener
gy (k
Wh)
E n e rg y (G Wh )K Wh
% G row t h
12 000
10 000
8 000
6 000
4 000
2 000
0
10.00%
8.00%
6.00%
4.00%
2.00%
0.00%
-2.00%
-4.00%
-6.00%07/08 10/1108/09 11/12 13/14 15/16 17/1809/10 12/13 14/15 16/17
EThekwini Electricity Annual Report | 2017/18
37373737
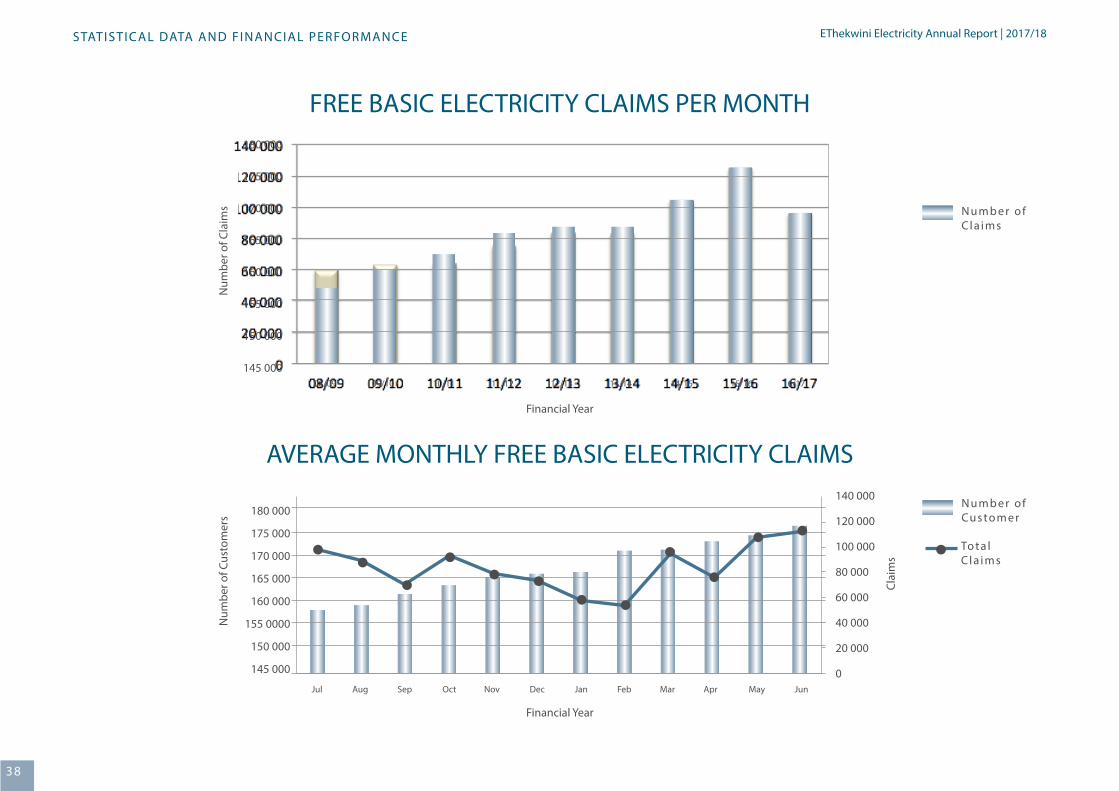
38
EThekwini Electricity Annual Report | 2016/17
FREE BASIC ELECTRICITY CLAIMS PER MONTH
AVERAGE MONTHLY FREE BASIC ELECTRICITY CLAIMS
Financial Year
Financial Year
Num
ber o
f Cla
ims
Num
ber o
f Cus
tom
ers
Clai
ms
N u m b e r o fCu s to m e r
To t a l C l a i m s
STATISTICAL DATA AND FINANCIAL PERFORMANCE
08/09
Jul Aug Sep Oct Nov Dec Jan Feb Mar Apr May Jun
10/11 12/13 14/1509/10 11/12 13/14 15/16 16/17
180 000
175 000
170 000
165 000
160 000
155 000
150 000
145 000
180 000
175 000
170 000
165 000
160 000
155 0000
150 000
145 000
140 000
120 000
100 000
80 000
60 000
40 000
20 000
0
N u m b e r o f C l a i m s
EThekwini Electricity Annual Report | 2017/18
383838
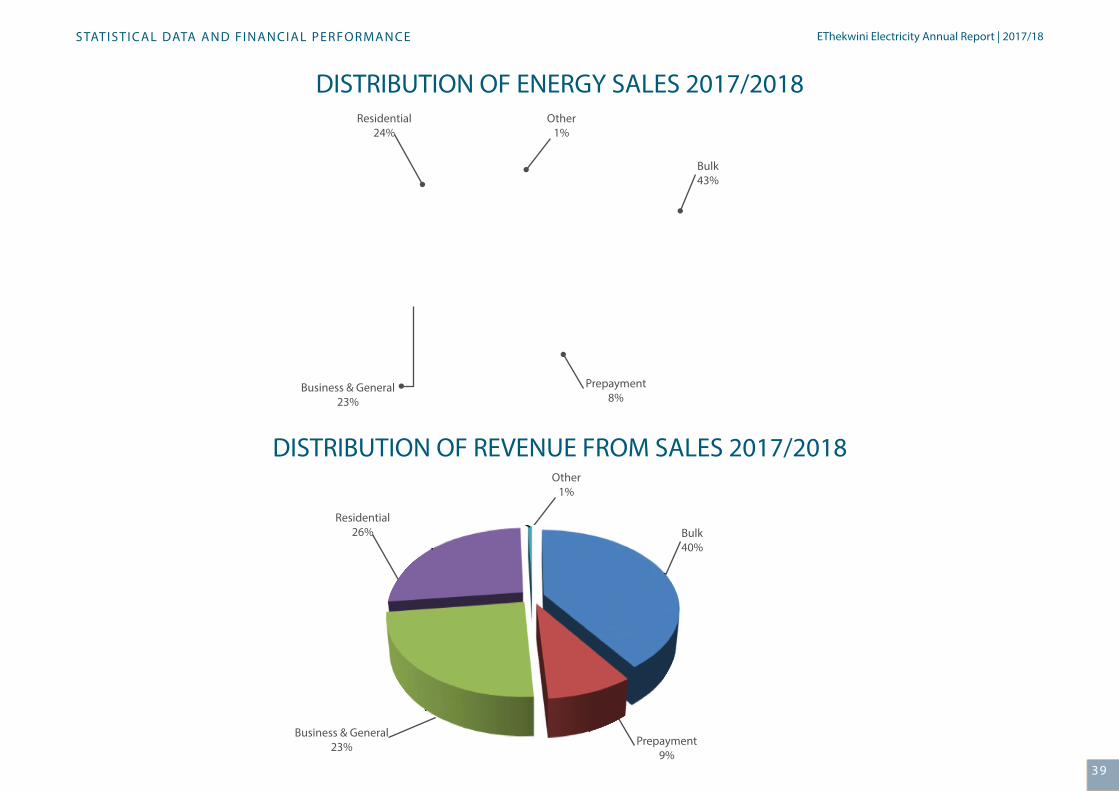
39
EThekwini Electricity Annual Report | 2016/17
39393939
DISTRIBUTION OF ENERGY SALES 2017/2018
STATISTICAL DATA AND FINANCIAL PERFORMANCE
DISTRIBUTION OF REVENUE FROM SALES 2017/2018
Bulk43%
Bulk40%
Prepayment8%
Prepayment9%
Business & General23%
Business & General23%
Other1%
Other1%
Residential24%
Residential26%
EThekwini Electricity Annual Report | 2017/18
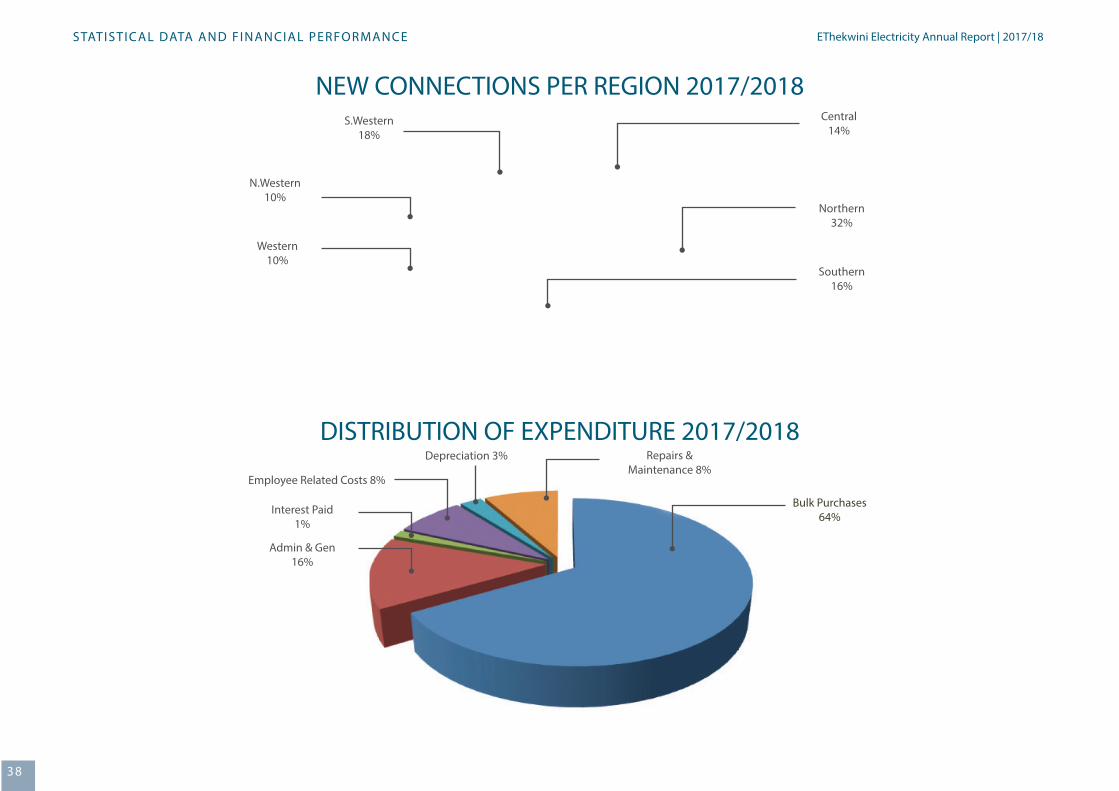
40
EThekwini Electricity Annual Report | 2016/17
NEW CONNECTIONS PER REGION 2017/2018
DISTRIBUTION OF EXPENDITURE 2017/2018
STATISTICAL DATA AND FINANCIAL PERFORMANCE
S.Western18%
N.Western10%
Western10%
Employee Related Costs 8%
Northern32%
Central14%
Southern 16%
Depreciation 3% Repairs & Maintenance 8%
Bulk Purchases 64%
Interest Paid1%
Admin & Gen 16%
404038
EThekwini Electricity Annual Report | 2017/18
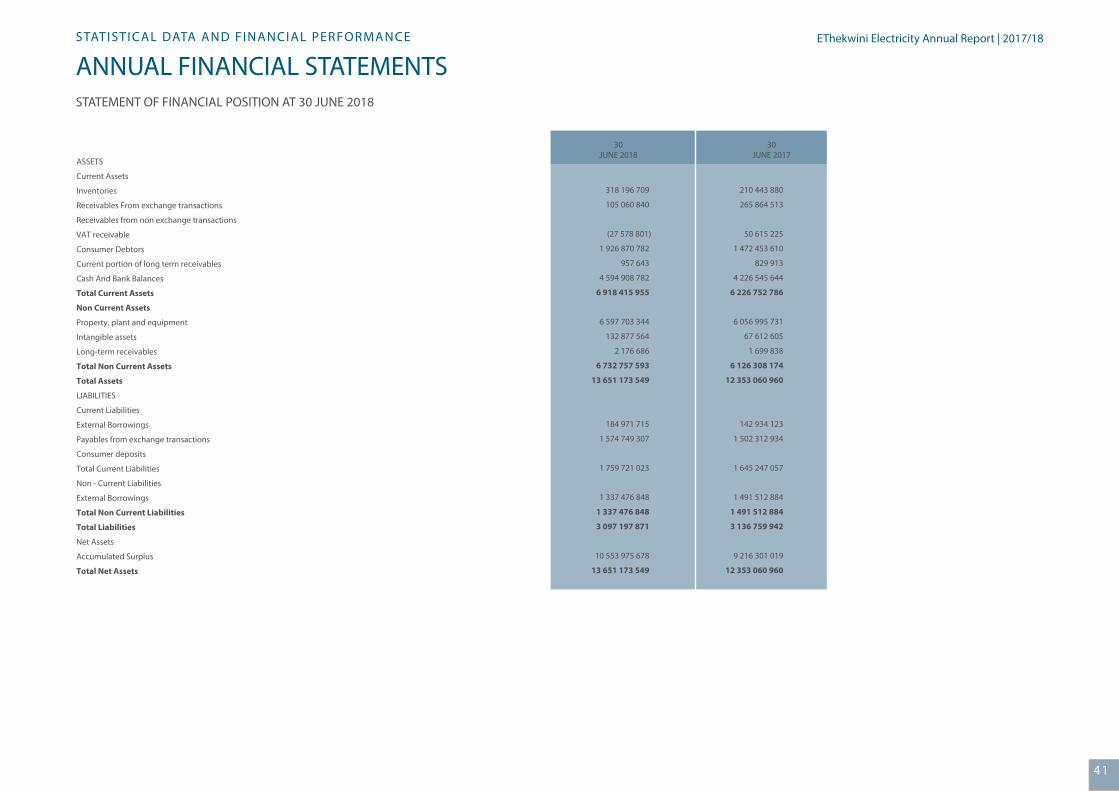
41
EThekwini Electricity Annual Report | 2016/17STATISTICAL DATA AND FINANCIAL PERFORMANCE
ANNUAL FINANCIAL STATEMENTSSTATEMENT OF FINANCIAL POSITION AT 30 JUNE 2018
41414141
EThekwini Electricity Annual Report | 2017/18
30JUNE 2018
30JUNE 2017
ASSETS
Current Assets
Inventories
Receivables From exchange transactions
Receivables from non exchange transactions
VAT receivable
Consumer Debtors
Current portion of long term receivables
Cash And Bank Balances
Total Current Assets
Non Current Assets
Property, plant and equipment
Intangible assets
Long-term receivables
Total Non Current Assets
Total Assets
LIABILITIES
Current Liabilities
External Borrowings
Payables from exchange transactions
Consumer deposits
Total Current Liabilities
Non - Current Liabilities
External Borrowings
Total Non Current Liabilities
Total Liabilities
Net Assets
Accumulated Surplus
Total Net Assets
318 196 709
105 060 840
(27 578 801)
1 926 870 782
957 643
4 594 908 782
6 918 415 955
6 597 703 344
132 877 564
2 176 686
6 732 757 593
13 651 173 549
184 971 715
1 574 749 307
1 759 721 023
1 337 476 848
1 337 476 848
3 097 197 871
10 553 975 678
13 651 173 549
210 443 880
265 864 513
50 615 225
1 472 453 610
829 913
4 226 545 644
6 226 752 786
6 056 995 731
67 612 605
1 699 838
6 126 308 174
12 353 060 960
142 934 123
1 502 312 934
1 645 247 057
1 491 512 884
1 491 512 884
3 136 759 942
9 216 301 019
12 353 060 960
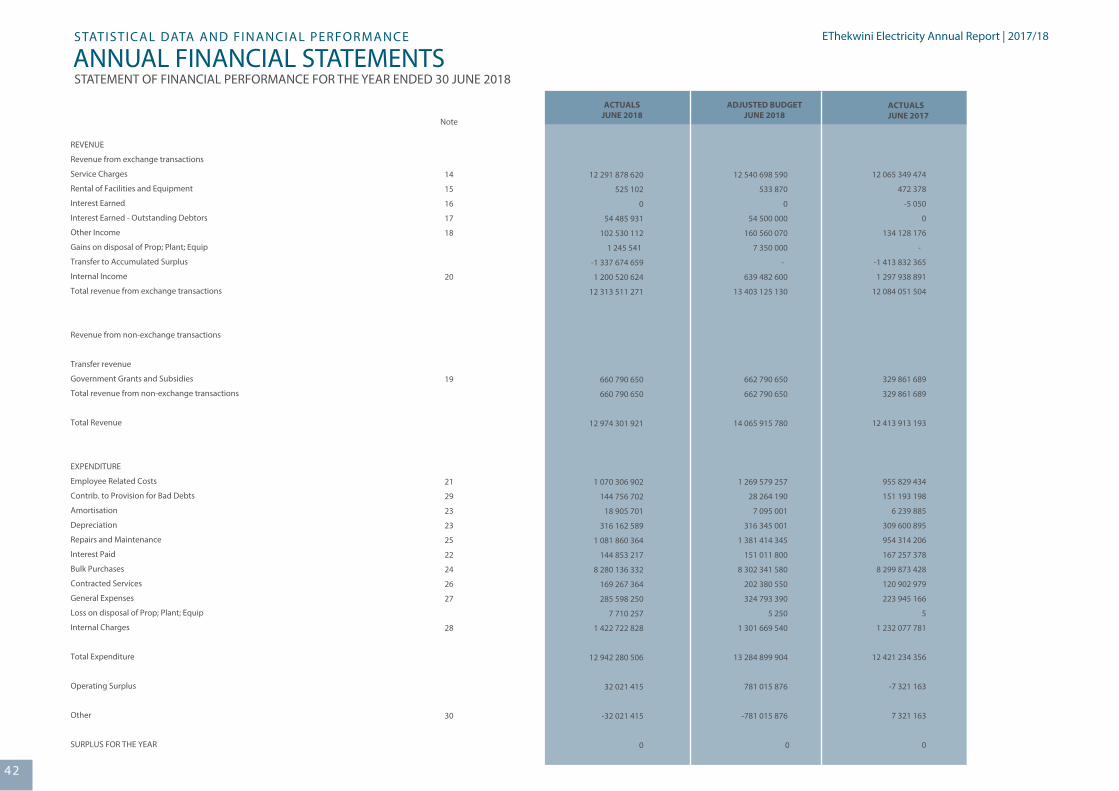
42
EThekwini Electricity Annual Report | 2016/17
ANNUAL FINANCIAL STATEMENTSSTATISTICAL DATA AND FINANCIAL PERFORMANCE EThekwini Electricity Annual Report | 2017/18
424242
ACTUALSJUNE 2018
ADJUSTED BUDGETJUNE 2018
Note
REVENUE
Revenue from exchange transactions
Service Charges
Rental of Facilities and Equipment
Interest Earned
Interest Earned - Outstanding Debtors
Other Income
Gains on disposal of Prop; Plant; Equip
Transfer to Accumulated Surplus
Internal Income
Total revenue from exchange transactions
Revenue from non-exchange transactions
Transfer revenue
Government Grants and Subsidies
Total revenue from non-exchange transactions
Total Revenue
EXPENDITURE
Employee Related Costs
Contrib. to Provision for Bad Debts
Amortisation
Depreciation
Repairs and Maintenance
Interest Paid
Bulk Purchases
Contracted Services
General Expenses
Loss on disposal of Prop; Plant; Equip
Internal Charges
Total Expenditure
Operating Surplus
Other
SURPLUS FOR THE YEAR
12 291 878 620
525 102
0
54 485 931
102 530 112
1 245 541
-1 337 674 659
1 200 520 624
12 313 511 271
660 790 650
660 790 650
12 974 301 921
1 070 306 902
144 756 702
18 905 701
316 162 589
1 081 860 364
144 853 217
8 280 136 332
169 267 364
285 598 250
7 710 257
1 422 722 828
12 942 280 506
32 021 415
-32 021 415
0
12 540 698 590
533 870
0
54 500 000
160 560 070
7 350 000
-
639 482 600
13 403 125 130
662 790 650
662 790 650
14 065 915 780
1 269 579 257
28 264 190
7 095 001
316 345 001
1 381 414 345
151 011 800
8 302 341 580
202 380 550
324 793 390
5 250
1 301 669 540
13 284 899 904
781 015 876
-781 015 876
0
12 065 349 474
472 378
-5 050
0
134 128 176
-
-1 413 832 365
1 297 938 891
12 084 051 504
329 861 689
329 861 689
12 413 913 193
955 829 434
151 193 198
6 239 885
309 600 895
954 314 206
167 257 378
8 299 873 428
120 902 979
223 945 166
5
1 232 077 781
12 421 234 356
-7 321 163
7 321 163
0
14
15
16
17
18
20
19
21
29
23
23
25
22
24
26
27
28
30
ACTUALSJUNE 2017
STATEMENT OF FINANCIAL PERFORMANCE FOR THE YEAR ENDED 30 JUNE 2018
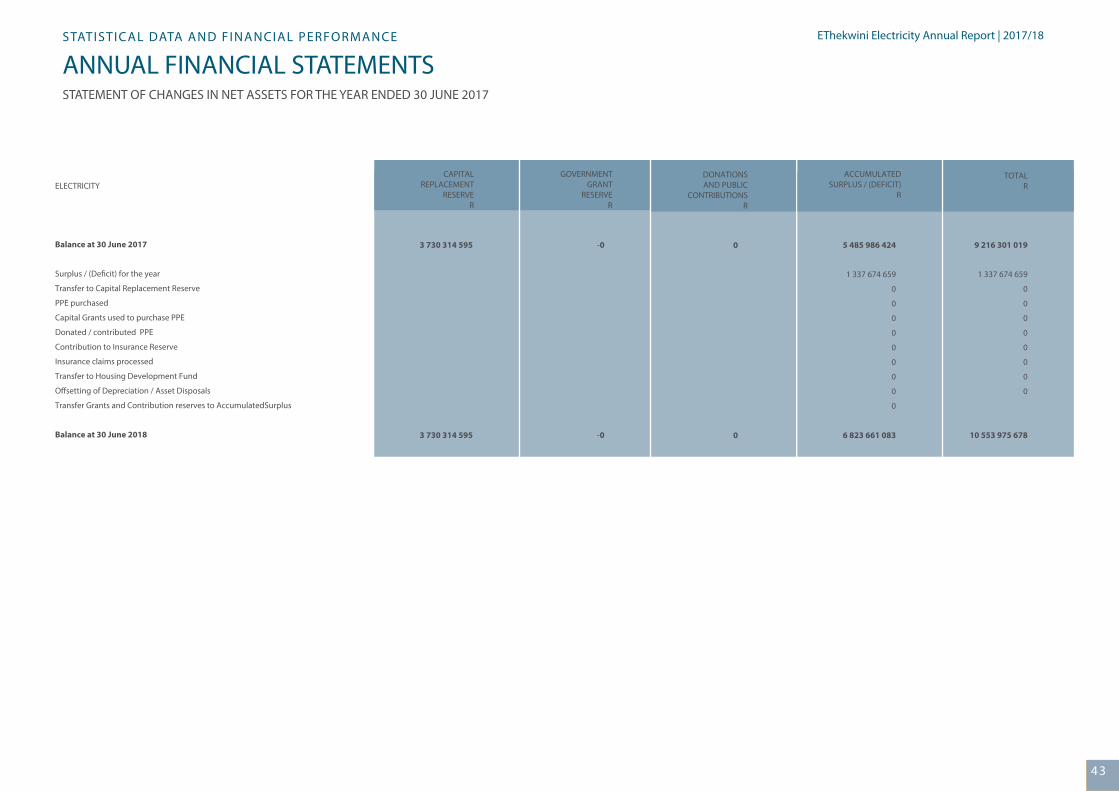
43
EThekwini Electricity Annual Report | 2016/17STATISTICAL DATA AND FINANCIAL PERFORMANCE
ANNUAL FINANCIAL STATEMENTSSTATEMENT OF CHANGES IN NET ASSETS FOR THE YEAR ENDED 30 JUNE 2017
EThekwini Electricity Annual Report | 2017/18
43434343
ELECTRICITY
Balance at 30 June 2017
Surplus / (De�cit) for the year
Transfer to Capital Replacement Reserve
PPE purchased
Capital Grants used to purchase PPE
Donated / contributed PPE
Contribution to Insurance Reserve
Insurance claims processed
Transfer to Housing Development Fund
O�setting of Depreciation / Asset Disposals
Transfer Grants and Contribution reserves to AccumulatedSurplus
Balance at 30 June 2018
3 730 314 595
3 730 314 595
-0
-0
5 485 986 424
1 337 674 659
0
0
0
0
0
0
0
0
0
6 823 661 083
9 216 301 019
1 337 674 659
0
0
0
0
0
0
0
0
10 553 975 678
0
0
CAPITALREPLACEMENT
RESERVER
GOVERNMENTGRANT
RESERVER
TOTALR
DONATIONSAND PUBLIC
CONTRIBUTIONSR
ACCUMULATEDSURPLUS / (DEFICIT)
R
TOTALR
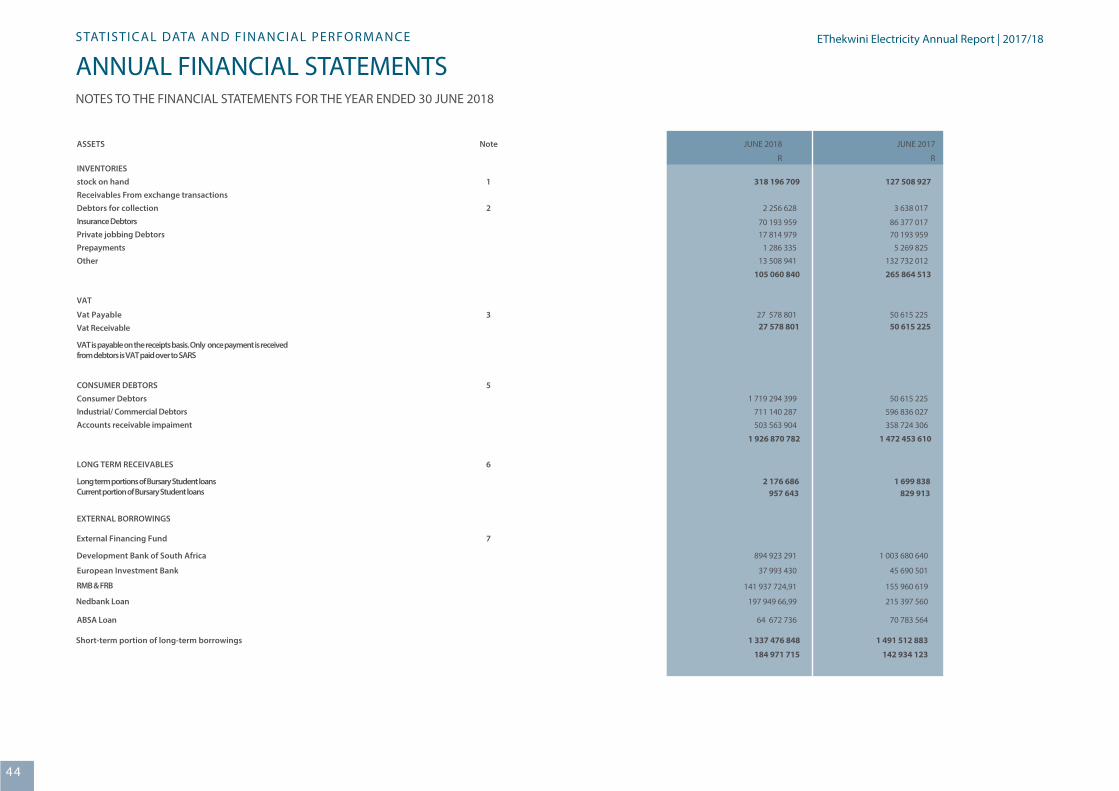
44
EThekwini Electricity Annual Report | 2016/17
ANNUAL FINANCIAL STATEMENTSSTATISTICAL DATA AND FINANCIAL PERFORMANCE
NOTES TO THE FINANCIAL STATEMENTS FOR THE YEAR ENDED 30 JUNE 2018
EThekwini Electricity Annual Report | 2017/18
444444
ASSETS JUNE 2018 JUNE 2017Note
R RINVENTORIES
318 196 709
2 256 628
70 193 95917 814 979
1 286 335
13 508 941 132 732 012
105 060 840
27 578 801 50 615 22527 578 801 50 615 225
1 719 294 399 50 615 225
711 140 287 596 836 027
503 563 904 358 724 306
1 926 870 782 1 472 453 610
2 176 686 1 699 838957 643 829 913
265 864 513
70 193 959
5 269 825
3 638 017
86 377 017
127 508 927stock on hand 1Receivables From exchange transactions
2Debtors for collectionInsurance DebtorsPrivate jobbing DebtorsPrepaymentsOther
VAT
Vat Payable 3Vat Receivable
VAT is payable on the receipts basis. Only once payment is receivedfrom debtors is VAT paid over to SARS
CONSUMER DEBTORS
Consumer Debtors
5
Industrial/ Commercial DebtorsAccounts receivable impaiment
LONG TERM RECEIVABLES 6
Long term portions of Bursary Student loansCurrent portion of Bursary Student loans
EXTERNAL BORROWINGS
External Financing Fund
37 993 430
141 937 724,91
197 949 66,99
64 672 736
215 397 560
70 783 564
1 337 476 848 1 491 512 883
184 971 715 142 934 123
45 690 501
155 960 619
894 923 291 1 003 680 640
7
Development Bank of South Africa
European Investment Bank
RMB & FRB
Nedbank Loan
ABSA Loan
Short-term portion of long-term borrowings
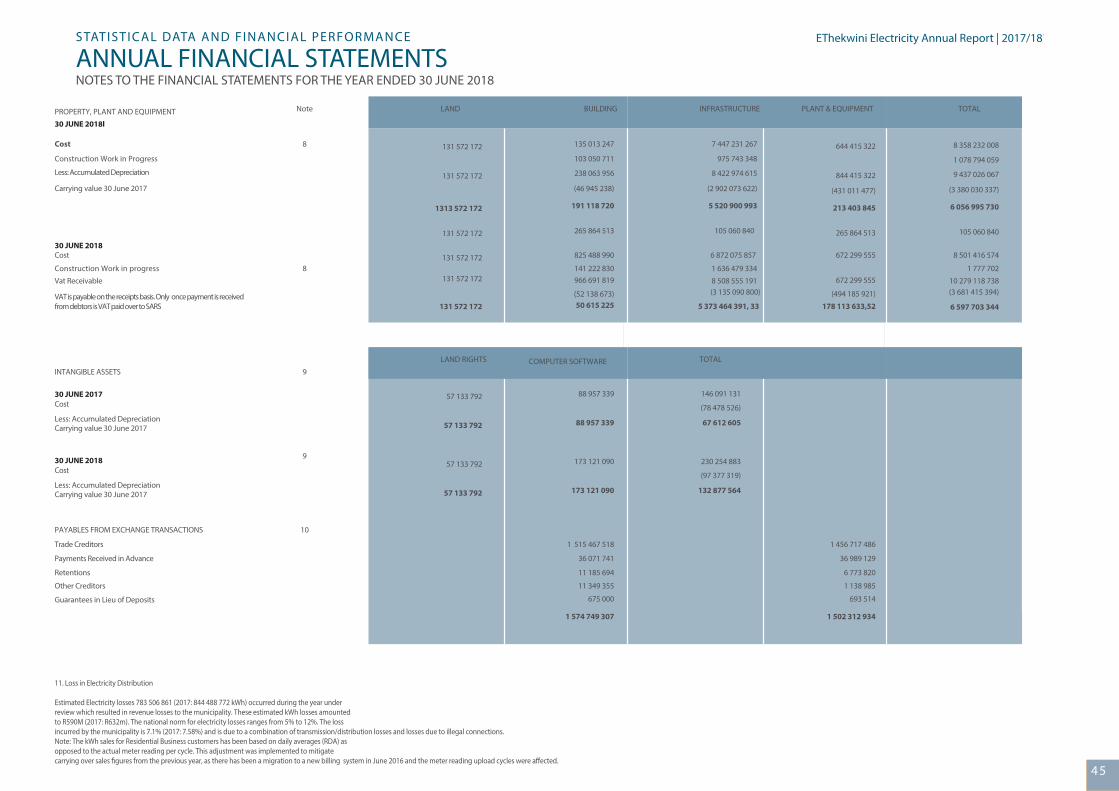
45
EThekwini Electricity Annual Report | 2016/17EThekwini Electricity Annual Report | 2017/18
45454545
NotePROPERTY, PLANT AND EQUIPMENT
131 572 172
131 572 172
1313 572 172
131 572 172
30 JUNE 2018
141 222 830
131 572 172 50 615 225
265 864 513
(46 945 238)
191 118 720
103 050 711
238 063 956
135 013 247
30 JUNE 2018l
Cost 8
Construction Work in Progress
Less: Accumulated Depreciation
Carrying value 30 June 2017
Cost
Construction Work in progress 8
Vat Receivable
VAT is payable on the receipts basis. Only once payment is receivedfrom debtors is VAT paid over to SARS
INTANGIBLE ASSETS
30 JUNE 2017
9
Cost
Less: Accumulated DepreciationCarrying value 30 June 2017
30 JUNE 2018Cost
Less: Accumulated DepreciationCarrying value 30 June 2017
9
57 133 792 88 957 339
57 133 792 88 957 339
7 447 231 267
975 743 348
8 422 974 615
(2 902 073 622)
5 520 900 993
105 060 840
1 636 479 334
5 373 464 391, 33 178 113 633,52
265 864 513
(431 011 477)
213 403 845
844 415 322
644 415 322
(78 478 526)
67 612 605
146 091 131
PAYABLES FROM EXCHANGE TRANSACTIONS 10
Payments Received in Advance
Trade Creditors
Retentions
Other Creditors
Guarantees in Lieu of Deposits
11. Loss in Electricity Distribution Estimated Electricity losses 783 506 861 (2017: 844 488 772 kWh) occurred during the year under review which resulted in revenue losses to the municipality. These estimated kWh losses amounted to R590M (2017: R632m). The national norm for electricity losses ranges from 5% to 12%. The loss incurred by the municipality is 7.1% (2017: 7.58%) and is due to a combination of transmission/distribution losses and losses due to illegal connections. Note: The kWh sales for Residential Business customers has been based on daily averages (RDA) as opposed to the actual meter reading per cycle. This adjustment was implemented to mitigate carrying over sales �gures from the previous year, as there has been a migration to a new billing system in June 2016 and the meter reading upload cycles were a�ected.
1 515 467 518
36 071 741
11 185 694
11 349 355
675 000
57 133 792 173 121 090
57 133 792 173 121 090
(97 377 319)
132 877 564
230 254 883
LAND BUILDING INFRASTRUCTURE PLANT & EQUIPMENT TOTAL
LAND RIGHTS COMPUTER SOFTWARE TOTAL
8 358 232 008
1 078 794 059
9 437 026 067
(3 380 030 337)
6 056 995 730
105 060 840
1 777 702
10 279 118 738(3 681 415 394)(52 138 673)
966 691 819 8 508 555 191(3 135 090 800) (494 185 921)
131 572 172
131 572 172
825 488 990 6 872 075 857 672 299 555
672 299 555
8 501 416 574
6 597 703 344
1 574 749 307
1 456 717 486
36 989 129
6 773 820
1 138 985
693 514
1 502 312 934
STATISTICAL DATA AND FINANCIAL PERFORMANCE
ANNUAL FINANCIAL STATEMENTSNOTES TO THE FINANCIAL STATEMENTS FOR THE YEAR ENDED 30 JUNE 2018
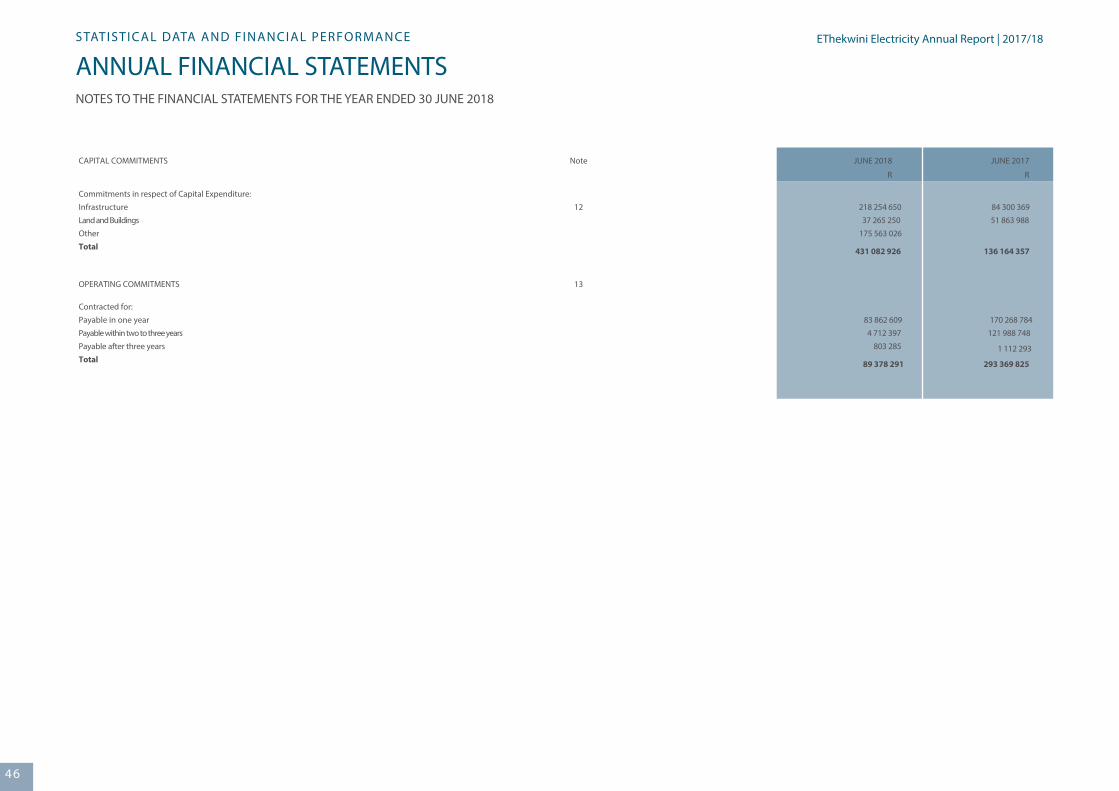
46
EThekwini Electricity Annual Report | 2016/17
ANNUAL FINANCIAL STATEMENTSSTATISTICAL DATA AND FINANCIAL PERFORMANCE
NOTES TO THE FINANCIAL STATEMENTS FOR THE YEAR ENDED 30 JUNE 2018
464646
CAPITAL COMMITMENTS JUNE 2018 JUNE 2017Note
R R
Commitments in respect of Capital Expenditure:
218 254 650
37 265 250
175 563 026
431 082 926 136 164 357
51 863 988
84 300 36912Infrastructure
Land and Buildings
Other
Total
OPERATING COMMITMENTS 13
Contracted for:
83 862 609
4 712 397
803 285 1 112 293
89 378 291 293 369 825
121 988 748
170 268 784Payable in one year
Payable within two to three years
Payable after three years
Total
EThekwini Electricity Annual Report | 2017/18
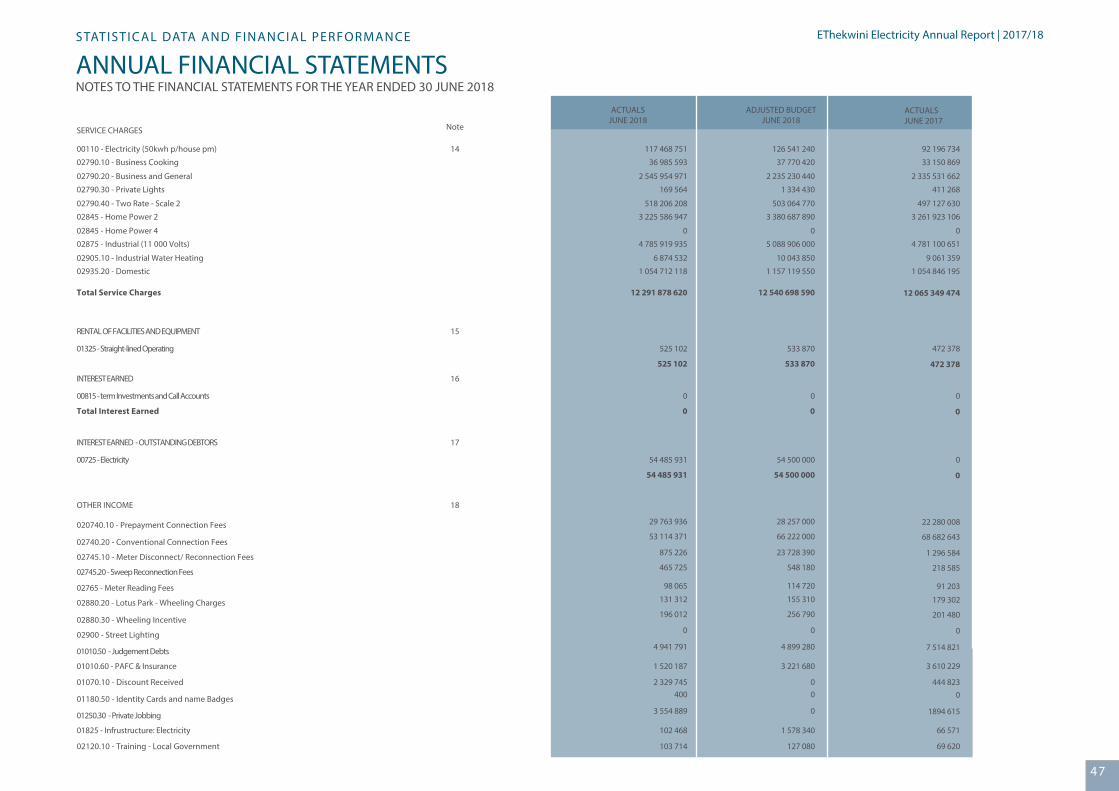
47
EThekwini Electricity Annual Report | 2016/17STATISTICAL DATA AND FINANCIAL PERFORMANCE
47474747
SERVICE CHARGES
ACTUALSJUNE 2018
ADJUSTED BUDGETJUNE 2018
Note
00110 - Electricity (50kwh p/house pm) 117 468 751
12 291 878 620 12 540 698 590
525 102 533 870
525 102 533 870
126 541 24014
Total Service Charges
RENTAL OF FACILITIES AND EQUIPMENT
01325 - Straight-lined Operating
15
OTHER INCOME
020740.10 - Prepayment Connection Fees53 114 371
875 226
465 725
98 065
548 180
114 720
66 222 000
23 728 390
29 763 936 28 257 000
18
02740.20 - Conventional Connection Fees
02745.10 - Meter Disconnect/ Reconnection Fees
02745.20 - Sweep Reconnection Fees
02765 - Meter Reading Fees
ACTUALSJUNE 2017
92 196 734
02790.10 - Business Cooking 36 985 593 37 770 420 33 150 869
02790.20 - Business and General 2 545 954 971 2 235 230 440 2 335 531 662
02790.30 - Private Lights 169 564 1 334 430 411 268
02790.40 - Two Rate - Scale 2 518 206 208 503 064 770 497 127 630
02845 - Home Power 2 3 225 586 947 3 380 687 890 3 261 923 106
02845 - Home Power 4 0 0 0
02875 - Industrial (11 000 Volts) 4 785 919 935 5 088 906 000 4 781 100 651
02905.10 - Industrial Water Heating 6 874 532 10 043 850 9 061 359
02935.20 - Domestic 1 054 712 118 1 157 119 550 1 054 846 195
12 065 349 474
472 378
472 378
0 0
0 0
INTEREST EARNED
00815 - term Investments and Call Accounts
Total Interest Earned
16
0
0
54 485 931 54 500 000
54 485 931 54 500 000
INTEREST EARNED - OUTSTANDING DEBTORS
00725 - Electricity
17
0
0
68 682 643
1 296 584
218 585
91 203
22 280 008
02880.20 - Lotus Park - Wheeling Charges196 012
0
4 941 791
1 520 187
4 899 280
3 221 680
256 790
0
131 312 155 310
02880.30 - Wheeling Incentive
02900 - Street Lighting
01010.50 - Judgement Debts
01010.60 - PAFC & Insurance
201 480
0
7 514 821
3 610 229
2 329 745 001070.10 - Discount Received 444 823400
3 554 889
102 468
0
1 578 340
001180.50 - Identity Cards and name Badges
01250.30 - Private Jobbing
01825 - Infrustructure: Electricity
0
1894 615
66 571
103 714 127 08002120.10 - Training - Local Government 69 620
179 302
ANNUAL FINANCIAL STATEMENTSNOTES TO THE FINANCIAL STATEMENTS FOR THE YEAR ENDED 30 JUNE 2018
EThekwini Electricity Annual Report | 2017/18
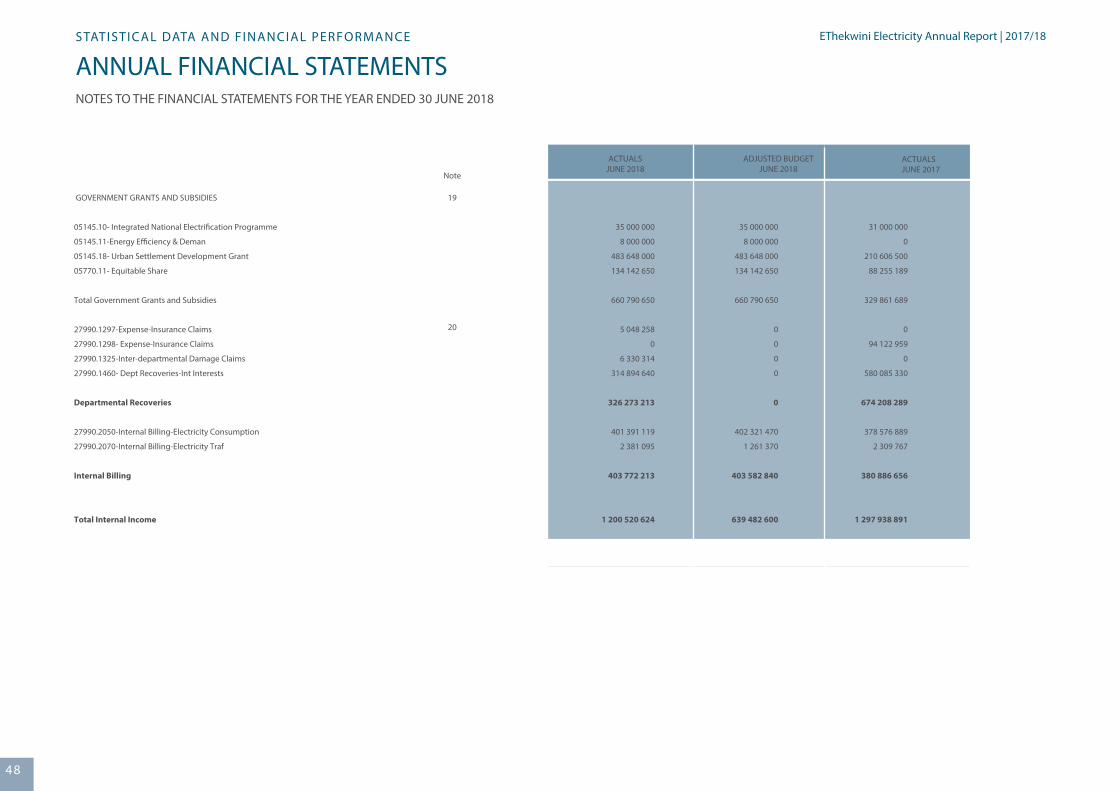
48
EThekwini Electricity Annual Report | 2016/17
ANNUAL FINANCIAL STATEMENTSSTATISTICAL DATA AND FINANCIAL PERFORMANCE
NOTES TO THE FINANCIAL STATEMENTS FOR THE YEAR ENDED 30 JUNE 2018
484848
ACTUALSJUNE 2018
ADJUSTED BUDGETJUNE 2018
Note
GOVERNMENT GRANTS AND SUBSIDIES
05145.10- Integrated National Electri�cation Programme
05145.11-Energy E�ciency & Deman
05145.18- Urban Settlement Development Grant
05770.11- Equitable Share
Total Government Grants and Subsidies
27990.1297-Expense-Insurance Claims
27990.1298- Expense-Insurance Claims
27990.1325-Inter-departmental Damage Claims
27990.1460- Dept Recoveries-Int Interests
Departmental Recoveries
27990.2050-Internal Billing-Electricity Consumption
27990.2070-Internal Billing-Electricity Traf
Internal Billing
Total Internal Income
35 000 000
8 000 000
483 648 000
134 142 650
660 790 650
5 048 258
0
6 330 314
314 894 640
326 273 213
401 391 119
2 381 095
403 772 213
1 200 520 624
35 000 000
8 000 000
483 648 000
134 142 650
660 790 650
0
0
0
0
0
402 321 470
1 261 370
403 582 840
639 482 600
31 000 000
0
210 606 500
88 255 189
329 861 689
0
94 122 959
0
580 085 330
674 208 289
378 576 889
2 309 767
380 886 656
1 297 938 891
19
20
ACTUALSJUNE 2017
EThekwini Electricity Annual Report | 2017/18
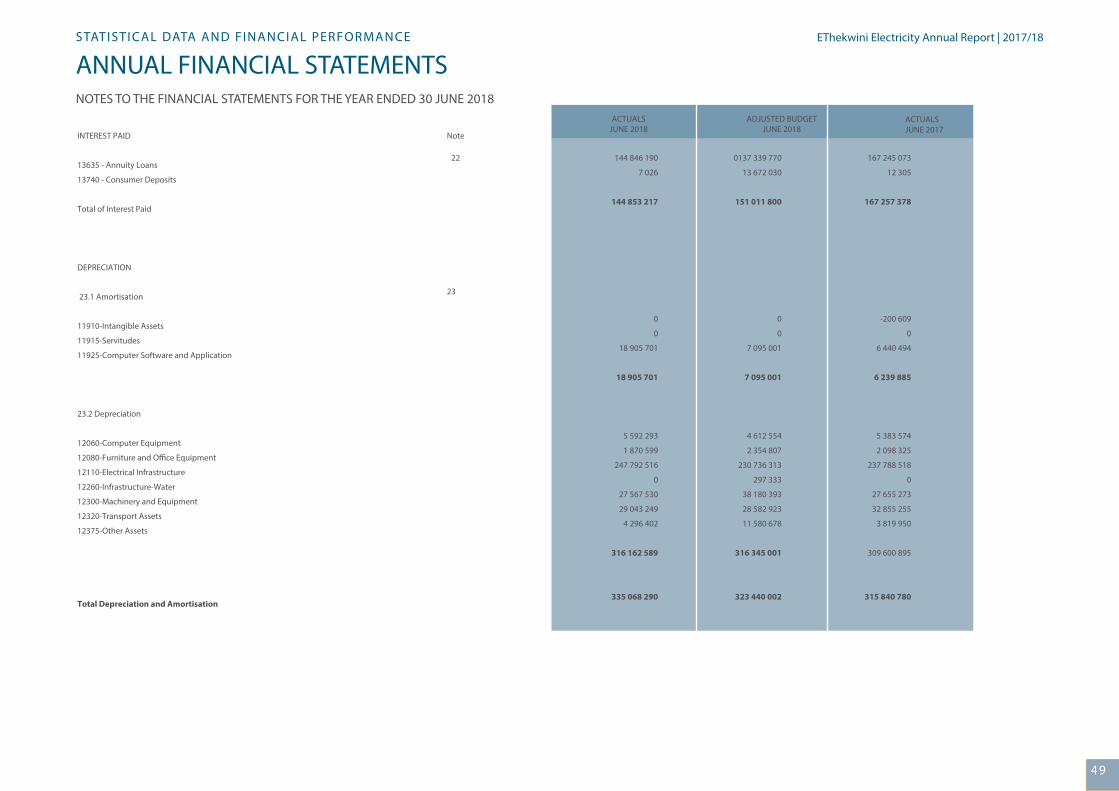
49
EThekwini Electricity Annual Report | 2016/17STATISTICAL DATA AND FINANCIAL PERFORMANCE
ANNUAL FINANCIAL STATEMENTSNOTES TO THE FINANCIAL STATEMENTS FOR THE YEAR ENDED 30 JUNE 2018
49494949
ACTUALSJUNE 2018
ADJUSTED BUDGETJUNE 2018
NoteINTEREST PAID
13635 - Annuity Loans
13740 - Consumer Deposits
Total of Interest Paid
DEPRECIATION
23.1 Amortisation
11910-Intangible Assets
11915-Servitudes
11925-Computer Software and Application
23.2 Depreciation
12060-Computer Equipment
12080-Furniture and O�ce Equipment
12110-Electrical Infrastructure
12260-Infrastructure-Water
12300-Machinery and Equipment
12320-Transport Assets
12375-Other Assets
Total Depreciation and Amortisation
144 846 190
7 026
144 853 217
0
0
18 905 701
18 905 701
5 592 293
1 870 599
247 792 516
0
27 567 530
29 043 249
4 296 402
316 162 589
335 068 290
0137 339 770
13 672 030
151 011 800
0
0
7 095 001
7 095 001
4 612 554
2 354 807
230 736 313
297 333
38 180 393
28 582 923
11 580 678
316 345 001
323 440 002
167 245 073
12 305
167 257 378
-200 609
0
6 440 494
6 239 885
5 383 574
2 098 325
237 788 518
0
27 655 273
32 855 255
3 819 950
309 600 895
315 840 780
22
23
ACTUALSJUNE 2017
EThekwini Electricity Annual Report | 2017/18
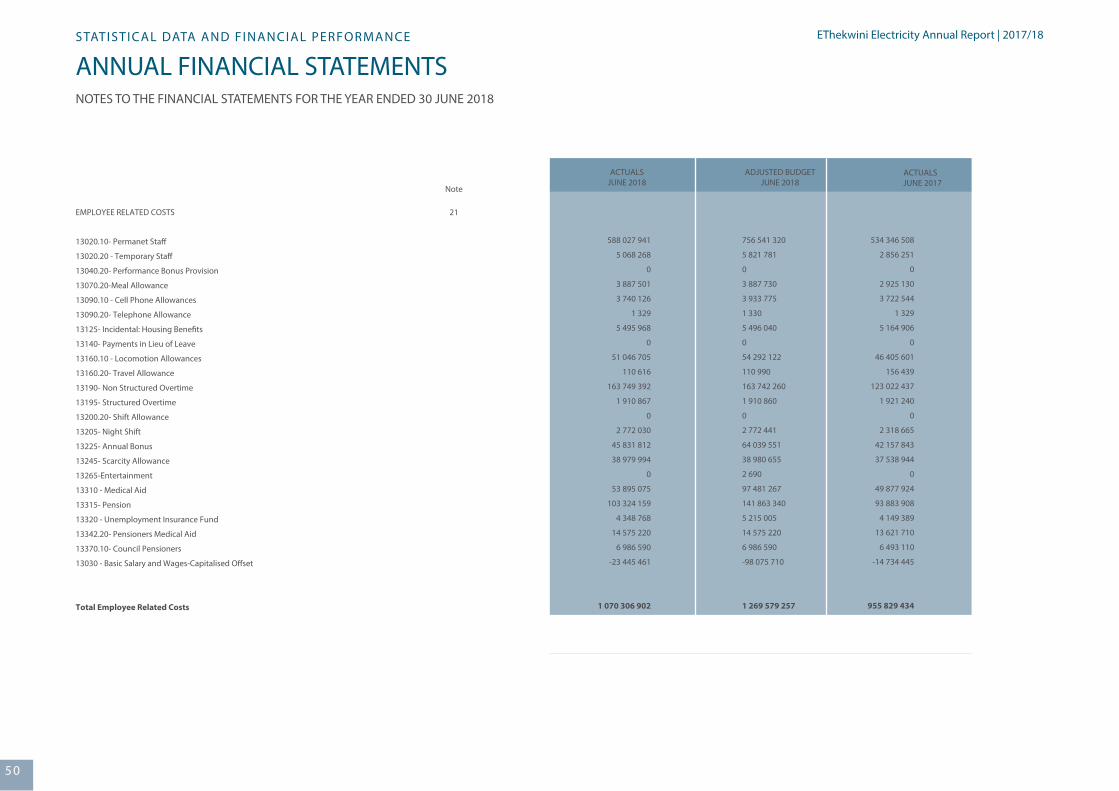
50
EThekwini Electricity Annual Report | 2016/17
ANNUAL FINANCIAL STATEMENTSSTATISTICAL DATA AND FINANCIAL PERFORMANCE
NOTES TO THE FINANCIAL STATEMENTS FOR THE YEAR ENDED 30 JUNE 2018
505050
ACTUALSJUNE 2018
ADJUSTED BUDGETJUNE 2018
Note
21EMPLOYEE RELATED COSTS
13020.10- Permanet Sta�
13020.20 - Temporary Sta�
13040.20- Performance Bonus Provision
13070.20-Meal Allowance
13090.10 - Cell Phone Allowances
13090.20- Telephone Allowance
13125- Incidental: Housing Bene�ts
13140- Payments in Lieu of Leave
13160.10 - Locomotion Allowances
13160.20- Travel Allowance
13190- Non Structured Overtime
13195- Structured Overtime
13200.20- Shift Allowance
13205- Night Shift
13225- Annual Bonus
13245- Scarcity Allowance
13265-Entertainment
13310 - Medical Aid
13315- Pension
13320 - Unemployment Insurance Fund
13342.20- Pensioners Medical Aid
13370.10- Council Pensioners
13030 - Basic Salary and Wages-Capitalised O�set
Total Employee Related Costs
588 027 941
5 068 268
0
3 887 501
3 740 126
1 329
5 495 968
0
51 046 705
110 616
163 749 392
1 910 867
0
2 772 030
45 831 812
38 979 994
0
53 895 075
103 324 159
4 348 768
14 575 220
6 986 590
-23 445 461
1 070 306 902
756 541 320
5 821 781
0
3 887 730
3 933 775
1 330
5 496 040
0
54 292 122
110 990
163 742 260
1 910 860
0
2 772 441
64 039 551
38 980 655
2 690
97 481 267
141 863 340
5 215 005
14 575 220
6 986 590
-98 075 710
1 269 579 257
534 346 508
2 856 251
0
2 925 130
3 722 544
1 329
5 164 906
0
46 405 601
156 439
123 022 437
1 921 240
0
2 318 665
42 157 843
37 538 944
0
49 877 924
93 883 908
4 149 389
13 621 710
6 493 110
-14 734 445
955 829 434
ACTUALSJUNE 2017
EThekwini Electricity Annual Report | 2017/18
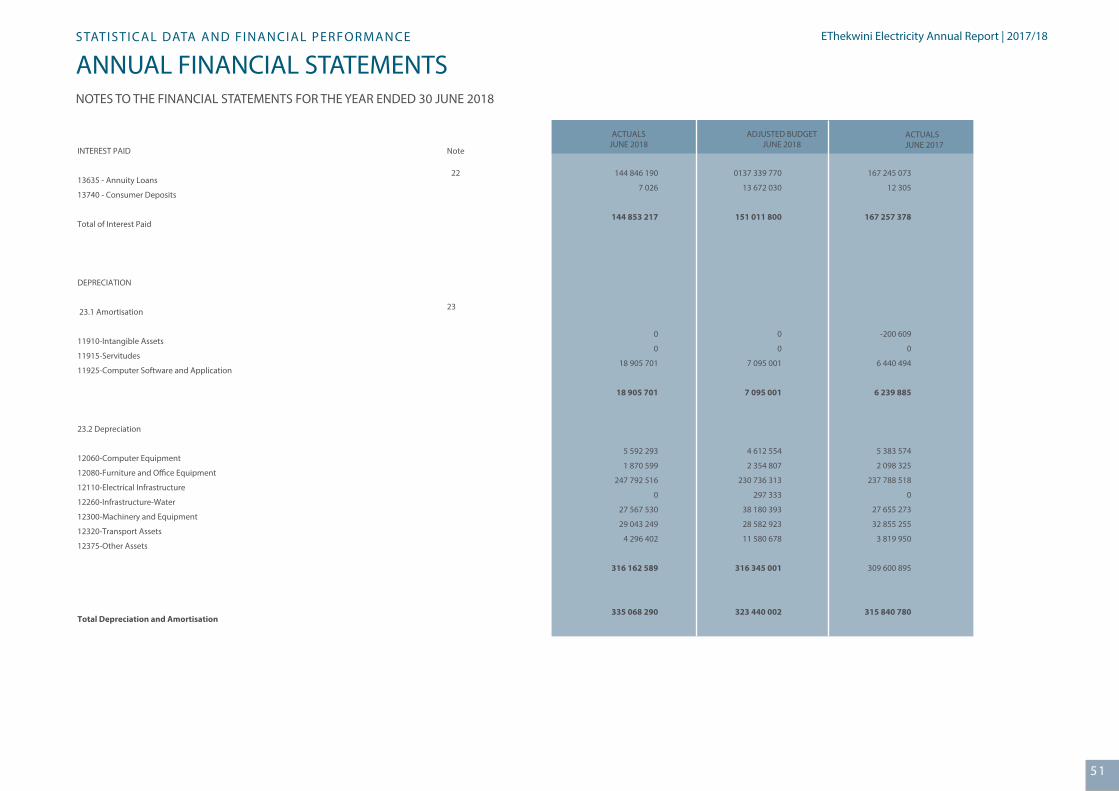
51
EThekwini Electricity Annual Report | 2016/17STATISTICAL DATA AND FINANCIAL PERFORMANCE
ANNUAL FINANCIAL STATEMENTSNOTES TO THE FINANCIAL STATEMENTS FOR THE YEAR ENDED 30 JUNE 2018
51515151
ACTUALSJUNE 2018
ADJUSTED BUDGETJUNE 2018
NoteINTEREST PAID
13635 - Annuity Loans
13740 - Consumer Deposits
Total of Interest Paid
DEPRECIATION
23.1 Amortisation
11910-Intangible Assets
11915-Servitudes
11925-Computer Software and Application
23.2 Depreciation
12060-Computer Equipment
12080-Furniture and O�ce Equipment
12110-Electrical Infrastructure
12260-Infrastructure-Water
12300-Machinery and Equipment
12320-Transport Assets
12375-Other Assets
Total Depreciation and Amortisation
144 846 190
7 026
144 853 217
0
0
18 905 701
18 905 701
5 592 293
1 870 599
247 792 516
0
27 567 530
29 043 249
4 296 402
316 162 589
335 068 290
0137 339 770
13 672 030
151 011 800
0
0
7 095 001
7 095 001
4 612 554
2 354 807
230 736 313
297 333
38 180 393
28 582 923
11 580 678
316 345 001
323 440 002
167 245 073
12 305
167 257 378
-200 609
0
6 440 494
6 239 885
5 383 574
2 098 325
237 788 518
0
27 655 273
32 855 255
3 819 950
309 600 895
315 840 780
22
23
ACTUALSJUNE 2017
EThekwini Electricity Annual Report | 2017/18
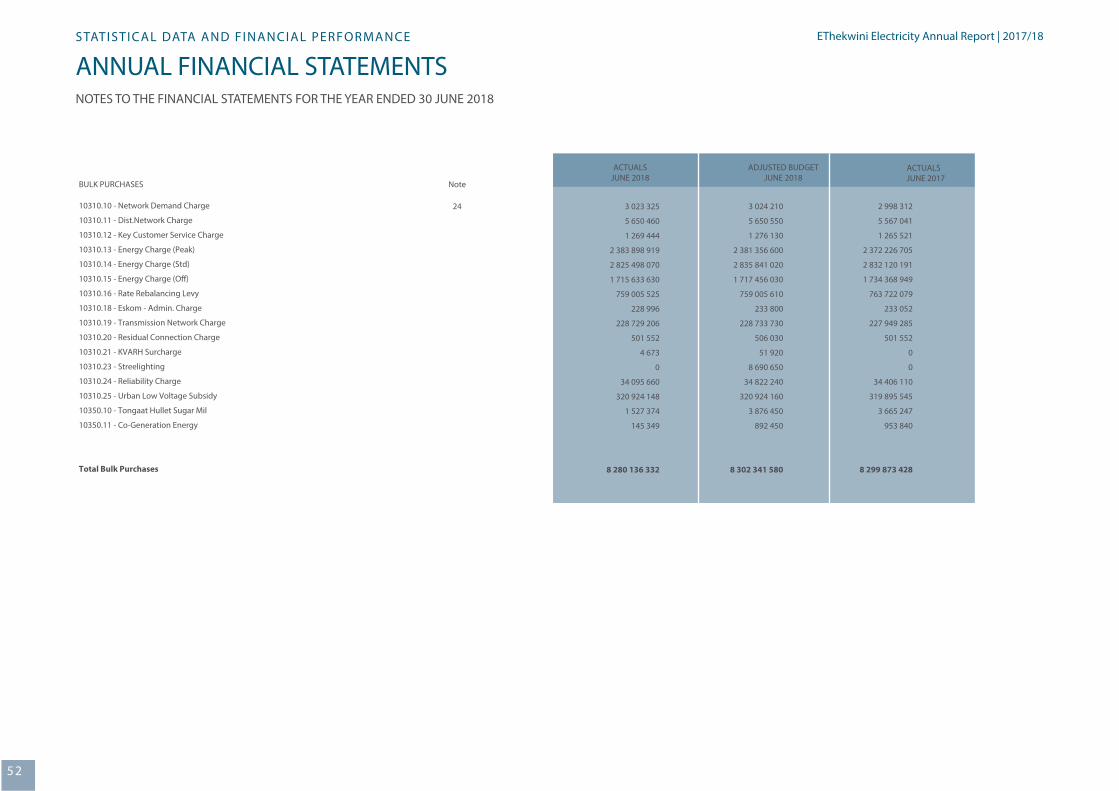
52
EThekwini Electricity Annual Report | 2016/17
ANNUAL FINANCIAL STATEMENTSSTATISTICAL DATA AND FINANCIAL PERFORMANCE
NOTES TO THE FINANCIAL STATEMENTS FOR THE YEAR ENDED 30 JUNE 2018
525252
ACTUALSJUNE 2018
ADJUSTED BUDGETJUNE 2018
NoteBULK PURCHASES
10310.10 - Network Demand Charge
10310.11 - Dist.Network Charge
10310.12 - Key Customer Service Charge
10310.13 - Energy Charge (Peak)
10310.14 - Energy Charge (Std)
10310.15 - Energy Charge (O�)
10310.16 - Rate Rebalancing Levy
10310.18 - Eskom - Admin. Charge
10310.19 - Transmission Network Charge
10310.20 - Residual Connection Charge
10310.21 - KVARH Surcharge
10310.23 - Streelighting
10310.24 - Reliability Charge
10310.25 - Urban Low Voltage Subsidy
10350.10 - Tongaat Hullet Sugar Mil
10350.11 - Co-Generation Energy
Total Bulk Purchases
3 023 325
5 650 460
1 269 444
2 383 898 919
2 825 498 070
1 715 633 630
759 005 525
228 996
228 729 206
501 552
4 673
0
34 095 660
320 924 148
1 527 374
145 349
8 280 136 332
3 024 210
5 650 550
1 276 130
2 381 356 600
2 835 841 020
1 717 456 030
759 005 610
233 800
228 733 730
506 030
51 920
8 690 650
34 822 240
320 924 160
3 876 450
892 450
8 302 341 580
2 998 312
5 567 041
1 265 521
2 372 226 705
2 832 120 191
1 734 368 949
763 722 079
233 052
227 949 285
501 552
0
0
34 406 110
319 895 545
3 665 247
953 840
8 299 873 428
24
ACTUALSJUNE 2017
EThekwini Electricity Annual Report | 2017/18
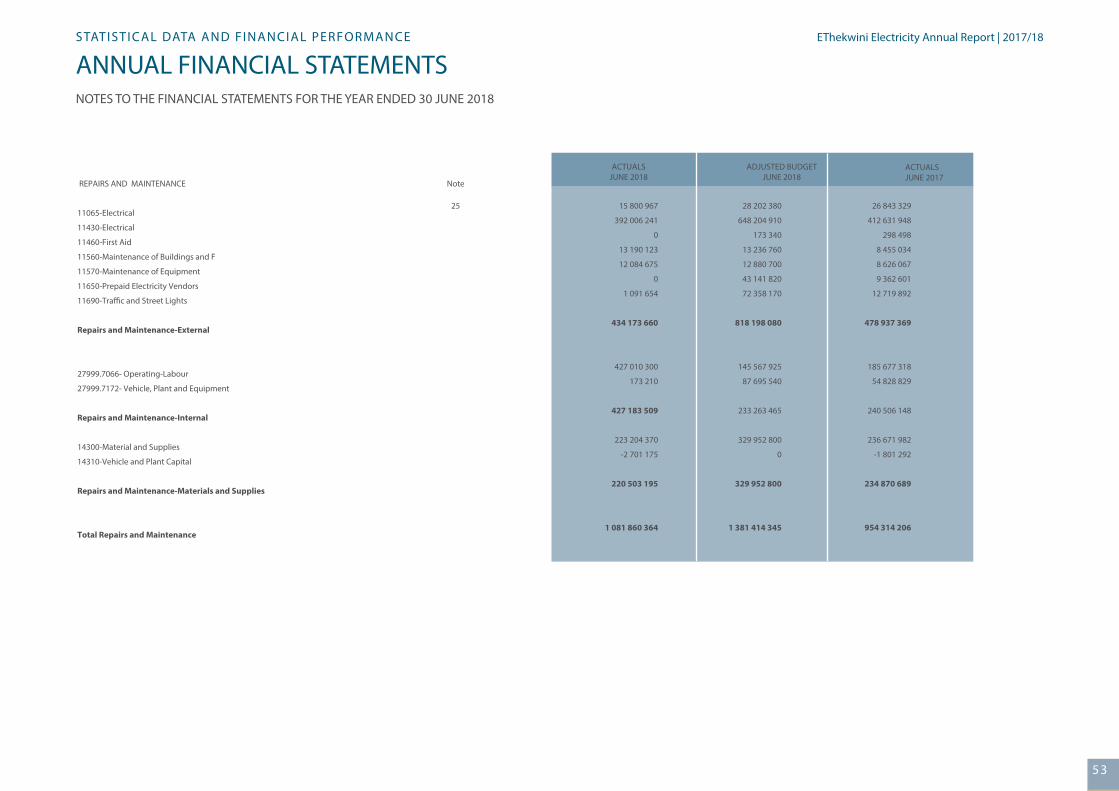
53
EThekwini Electricity Annual Report | 2016/17STATISTICAL DATA AND FINANCIAL PERFORMANCE
ANNUAL FINANCIAL STATEMENTSNOTES TO THE FINANCIAL STATEMENTS FOR THE YEAR ENDED 30 JUNE 2018
53535353
ACTUALSJUNE 2018
ADJUSTED BUDGETJUNE 2018
Note REPAIRS AND MAINTENANCE
11065-Electrical
11430-Electrical
11460-First Aid
11560-Maintenance of Buildings and F
11570-Maintenance of Equipment
11650-Prepaid Electricity Vendors
11690-Tra�c and Street Lights
Repairs and Maintenance-External
27999.7066- Operating-Labour
27999.7172- Vehicle, Plant and Equipment
Repairs and Maintenance-Internal
14300-Material and Supplies
14310-Vehicle and Plant Capital
Repairs and Maintenance-Materials and Supplies
Total Repairs and Maintenance
15 800 967
392 006 241
0
13 190 123
12 084 675
0
1 091 654
434 173 660
427 010 300
173 210
427 183 509
223 204 370
-2 701 175
220 503 195
1 081 860 364
28 202 380
648 204 910
173 340
13 236 760
12 880 700
43 141 820
72 358 170
818 198 080
145 567 925
87 695 540
233 263 465
329 952 800
0
329 952 800
1 381 414 345
26 843 329
412 631 948
298 498
8 455 034
8 626 067
9 362 601
12 719 892
478 937 369
185 677 318
54 828 829
240 506 148
236 671 982
-1 801 292
234 870 689
954 314 206
25
ACTUALSJUNE 2017
EThekwini Electricity Annual Report | 2017/18
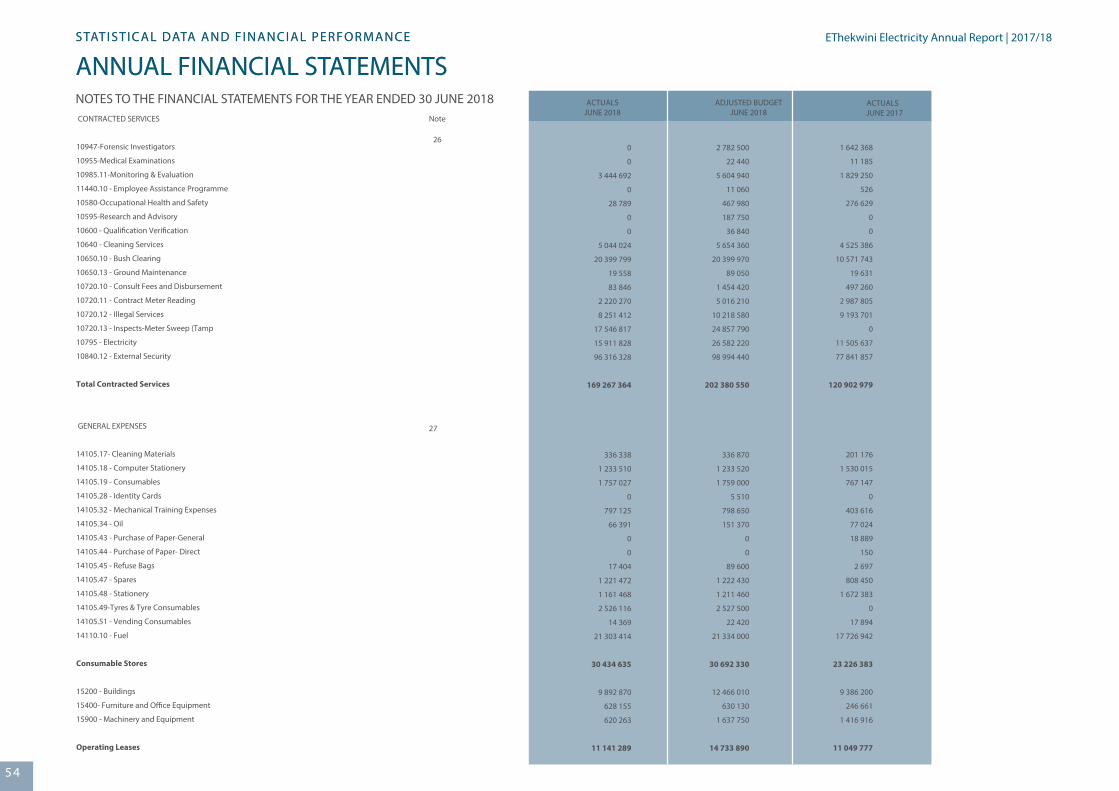
54
EThekwini Electricity Annual Report | 2016/17
ANNUAL FINANCIAL STATEMENTSSTATISTICAL DATA AND FINANCIAL PERFORMANCE
NOTES TO THE FINANCIAL STATEMENTS FOR THE YEAR ENDED 30 JUNE 2018
545454
ANNUAL FINANCIAL STATEMENTSSTATISTICAL DATA AND FINANCIAL PERFORMANCE EThekwini Electricity Annual Report | 2017/18
ACTUALSJUNE 2018
ADJUSTED BUDGETJUNE 2018
Note CONTRACTED SERVICES
10947-Forensic Investigators
10955-Medical Examinations
10985.11-Monitoring & Evaluation
11440.10 - Employee Assistance Programme
10580-Occupational Health and Safety
10595-Research and Advisory
10600 - Quali�cation Veri�cation
10640 - Cleaning Services
10650.10 - Bush Clearing
10650.13 - Ground Maintenance
10720.10 - Consult Fees and Disbursement
10720.11 - Contract Meter Reading
10720.12 - Illegal Services
10720.13 - Inspects-Meter Sweep (Tamp
10795 - Electricity
10840.12 - External Security
Total Contracted Services
GENERAL EXPENSES
14105.17- Cleaning Materials
14105.18 - Computer Stationery
14105.19 - Consumables
14105.28 - Identity Cards
14105.32 - Mechanical Training Expenses
14105.34 - Oil
14105.43 - Purchase of Paper-General
14105.44 - Purchase of Paper- Direct
14105.45 - Refuse Bags
14105.47 - Spares
14105.48 - Stationery
14105.49-Tyres & Tyre Consumables
14105.51 - Vending Consumables
14110.10 - Fuel
Consumable Stores
15200 - Buildings
15400- Furniture and O�ce Equipment
15900 - Machinery and Equipment
Operating Leases
0
0
3 444 692
0
28 789
0
0
5 044 024
20 399 799
19 558
83 846
2 220 270
8 251 412
17 546 817
15 911 828
96 316 328
169 267 364
336 338
1 233 510
1 757 027
0
797 125
66 391
0
0
17 404
1 221 472
1 161 468
2 526 116
14 369
21 303 414
30 434 635
9 892 870
628 155
620 263
11 141 289
2 782 500
22 440
5 604 940
11 060
467 980
187 750
36 840
5 654 360
20 399 970
89 050
1 454 420
5 016 210
10 218 580
24 857 790
26 582 220
98 994 440
202 380 550
336 870
1 233 520
1 759 000
5 510
798 650
151 370
0
0
89 600
1 222 430
1 211 460
2 527 500
22 420
21 334 000
30 692 330
12 466 010
630 130
1 637 750
14 733 890
1 642 368
11 185
1 829 250
526
276 629
0
0
4 525 386
10 571 743
19 631
497 260
2 987 805
9 193 701
0
11 505 637
77 841 857
120 902 979
201 176
1 530 015
767 147
0
403 616
77 024
18 889
150
2 697
808 450
1 672 383
0
17 894
17 726 942
23 226 383
9 386 200
246 661
1 416 916
11 049 777
26
27
ACTUALSJUNE 2017
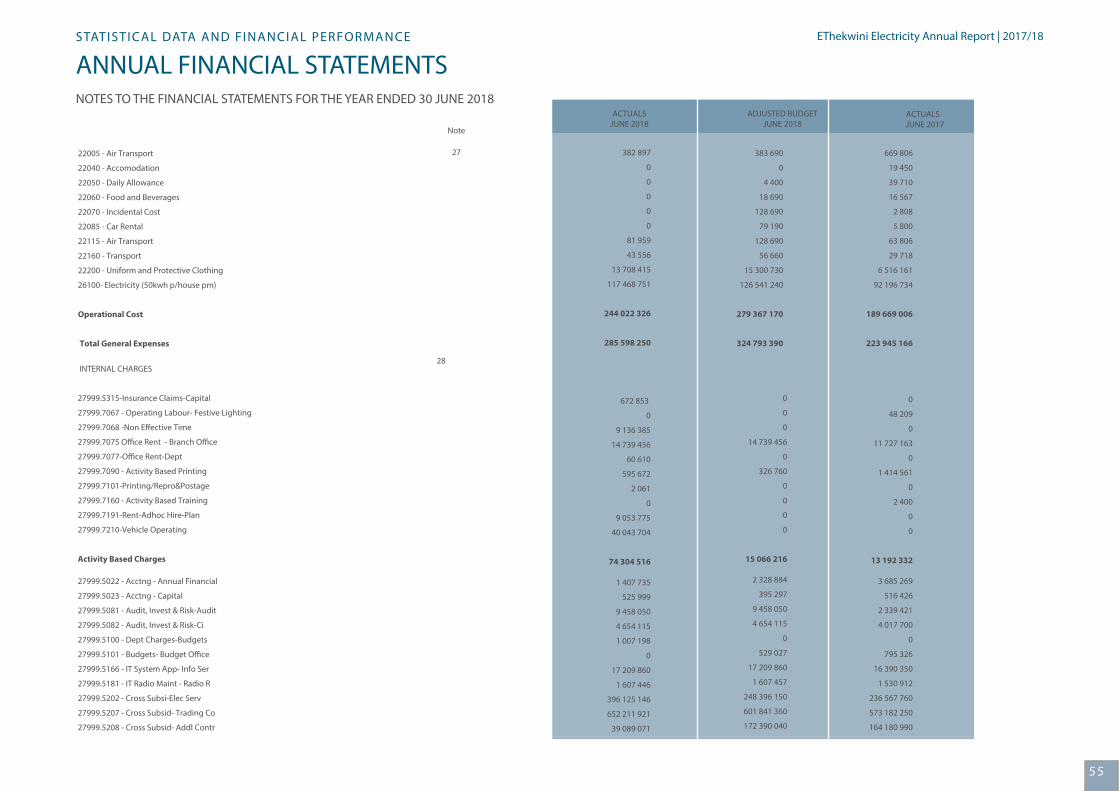
55
EThekwini Electricity Annual Report | 2016/17STATISTICAL DATA AND FINANCIAL PERFORMANCE
ANNUAL FINANCIAL STATEMENTSNOTES TO THE FINANCIAL STATEMENTS FOR THE YEAR ENDED 30 JUNE 2018
55555555
ACTUALSJUNE 2018
ADJUSTED BUDGETJUNE 2018
Note
22005 - Air Transport
22040 - Accomodation
22050 - Daily Allowance
22060 - Food and Beverages
22070 - Incidental Cost
22085 - Car Rental
22115 - Air Transport
22160 - Transport
22200 - Uniform and Protective Clothing
26100- Electricity (50kwh p/house pm)
Operational Cost
Total General Expenses
INTERNAL CHARGES
27999.5315-Insurance Claims-Capital
27999.7067 - Operating Labour- Festive Lighting
27999.7068 -Non E�ective Time
27999.7075 O�ce Rent - Branch O�ce
27999.7077-O�ce Rent-Dept
27999.7090 - Activity Based Printing
27999.7101-Printing/Repro&Postage
27999.7160 - Activity Based Training
27999.7191-Rent-Adhoc Hire-Plan
27999.7210-Vehicle Operating
Activity Based Charges
27999.5022 - Acctng - Annual Financial
27999.5023 - Acctng - Capital
27999.5081 - Audit, Invest & Risk-Audit
27999.5082 - Audit, Invest & Risk-Ci
27999.5100 - Dept Charges-Budgets
27999.5101 - Budgets- Budget O�ce
27999.5166 - IT System App- Info Ser
27999.5181 - IT Radio Maint - Radio R
27999.5202 - Cross Subsi-Elec Serv
27999.5207 - Cross Subsid- Trading Co
27999.5208 - Cross Subsid- Addl Contr
382 897
0
0
0
0
0
81 959
43 556
13 708 415
117 468 751
244 022 326
285 598 250
672 853
0
9 136 385
14 739 456
60 610
595 672
2 061
0
9 053 775
40 043 704
74 304 516
0
0
0
14 739 456
0
326 760
0
0
0
0
15 066 216
0
48 209
0
11 727 163
0
1 414 561
0
2 400
0
0
13 192 332
1 407 735
525 999
9 458 050
4 654 115
1 007 198
0
17 209 860
1 607 446
396 125 146
652 211 921
39 089 071
2 328 884
395 297
9 458 050
4 654 115
0
529 027
17 209 860
1 607 457
248 396 150
601 841 360
172 390 040
3 685 269
516 426
2 339 421
4 017 700
0
795 326
16 390 350
1 530 912
236 567 760
573 182 250
164 180 990
383 690
0
4 400
18 690
128 690
79 190
128 690
56 660
15 300 730
126 541 240
279 367 170
324 793 390
669 806
19 450
39 710
16 567
2 808
5 800
63 806
29 718
6 516 161
92 196 734
189 669 006
223 945 166
27
28
ACTUALSJUNE 2017
EThekwini Electricity Annual Report | 2017/18
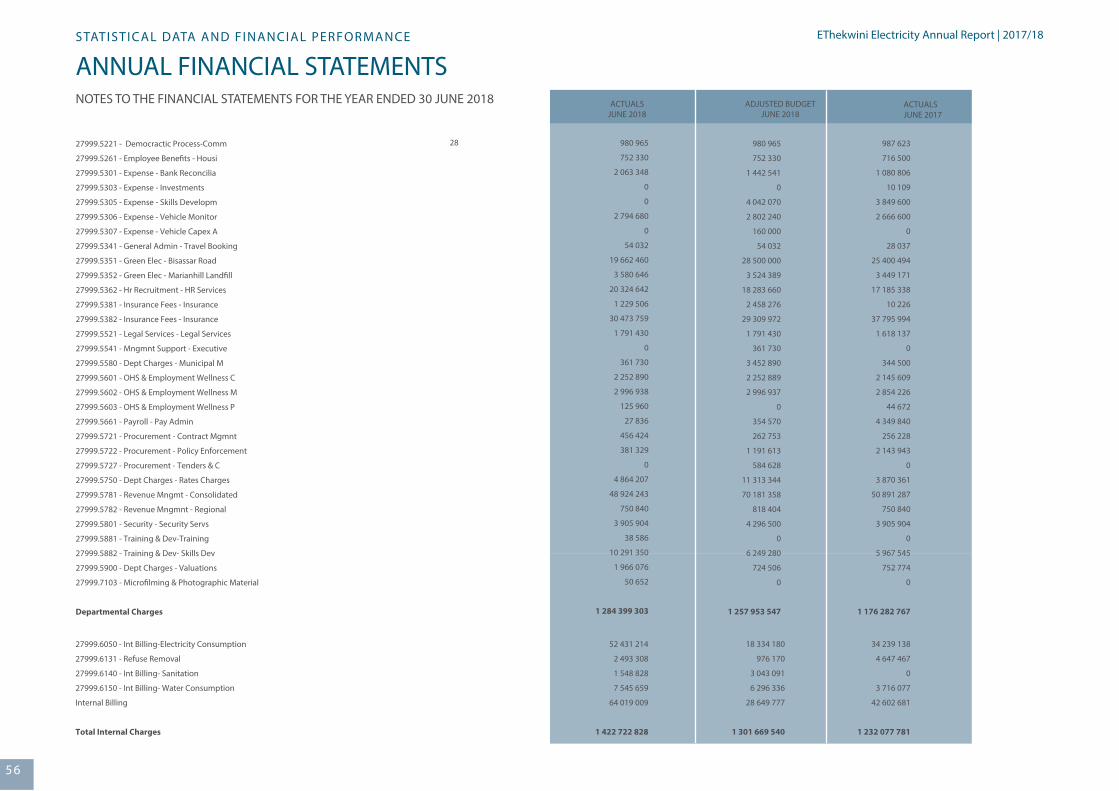
56
EThekwini Electricity Annual Report | 2016/17
ANNUAL FINANCIAL STATEMENTSSTATISTICAL DATA AND FINANCIAL PERFORMANCE
NOTES TO THE FINANCIAL STATEMENTS FOR THE YEAR ENDED 30 JUNE 2018
565656
ACTUALSJUNE 2018
ADJUSTED BUDGETJUNE 2018
27999.5221 - Democractic Process-Comm
27999.5261 - Employee Bene�ts - Housi
27999.5301 - Expense - Bank Reconcilia
27999.5303 - Expense - Investments
27999.5305 - Expense - Skills Developm
27999.5306 - Expense - Vehicle Monitor
27999.5307 - Expense - Vehicle Capex A
27999.5341 - General Admin - Travel Booking
27999.5351 - Green Elec - Bisassar Road
27999.5352 - Green Elec - Marianhill Land�ll
27999.5362 - Hr Recruitment - HR Services
27999.5381 - Insurance Fees - Insurance
27999.5382 - Insurance Fees - Insurance
27999.5521 - Legal Services - Legal Services
27999.5541 - Mngmnt Support - Executive
27999.5580 - Dept Charges - Municipal M
27999.5601 - OHS & Employment Wellness C
27999.5602 - OHS & Employment Wellness M
27999.5603 - OHS & Employment Wellness P
27999.5661 - Payroll - Pay Admin
27999.5721 - Procurement - Contract Mgmnt
27999.5722 - Procurement - Policy Enforcement
27999.5727 - Procurement - Tenders & C
27999.5750 - Dept Charges - Rates Charges
27999.5781 - Revenue Mngmt - Consolidated
27999.5782 - Revenue Mngmnt - Regional
27999.5801 - Security - Security Servs
27999.5881 - Training & Dev-Training
27999.5882 - Training & Dev- Skills Dev
27999.5900 - Dept Charges - Valuations
27999.7103 - Micro�lming & Photographic Material
Departmental Charges
27999.6050 - Int Billing-Electricity Consumption
27999.6131 - Refuse Removal
27999.6140 - Int Billing- Sanitation
27999.6150 - Int Billing- Water Consumption
Internal Billing
Total Internal Charges
980 965
752 330
2 063 348
0
0
2 794 680
0
54 032
19 662 460
3 580 646
20 324 642
1 229 506
30 473 759
1 791 430
0
361 730
2 252 890
2 996 938
125 960
27 836
456 424
381 329
0
4 864 207
48 924 243
750 840
3 905 904
38 586
10 291 350
1 966 076
50 652
1 284 399 303
52 431 214
2 493 308
1 548 828
7 545 659
64 019 009
1 422 722 828
18 334 180
976 170
3 043 091
6 296 336
28 649 777
1 301 669 540
34 239 138
4 647 467
0
3 716 077
42 602 681
1 232 077 781
980 965
752 330
1 442 541
0
4 042 070
2 802 240
160 000
54 032
28 500 000
3 524 389
18 283 660
2 458 276
29 309 972
1 791 430
361 730
3 452 890
2 252 889
2 996 937
0
354 570
262 753
1 191 613
584 628
11 313 344
70 181 358
818 404
4 296 500
0
6 249 280
724 506
0
1 257 953 547
987 623
716 500
1 080 806
10 109
3 849 600
2 666 600
0
28 037
25 400 494
3 449 171
17 185 338
10 226
37 795 994
1 618 137
0
344 500
2 145 609
2 854 226
44 672
4 349 840
256 228
2 143 943
0
3 870 361
50 891 287
750 840
3 905 904
0
5 967 545
752 774
0
1 176 282 767
28
ACTUALSJUNE 2017
EThekwini Electricity Annual Report | 2017/18
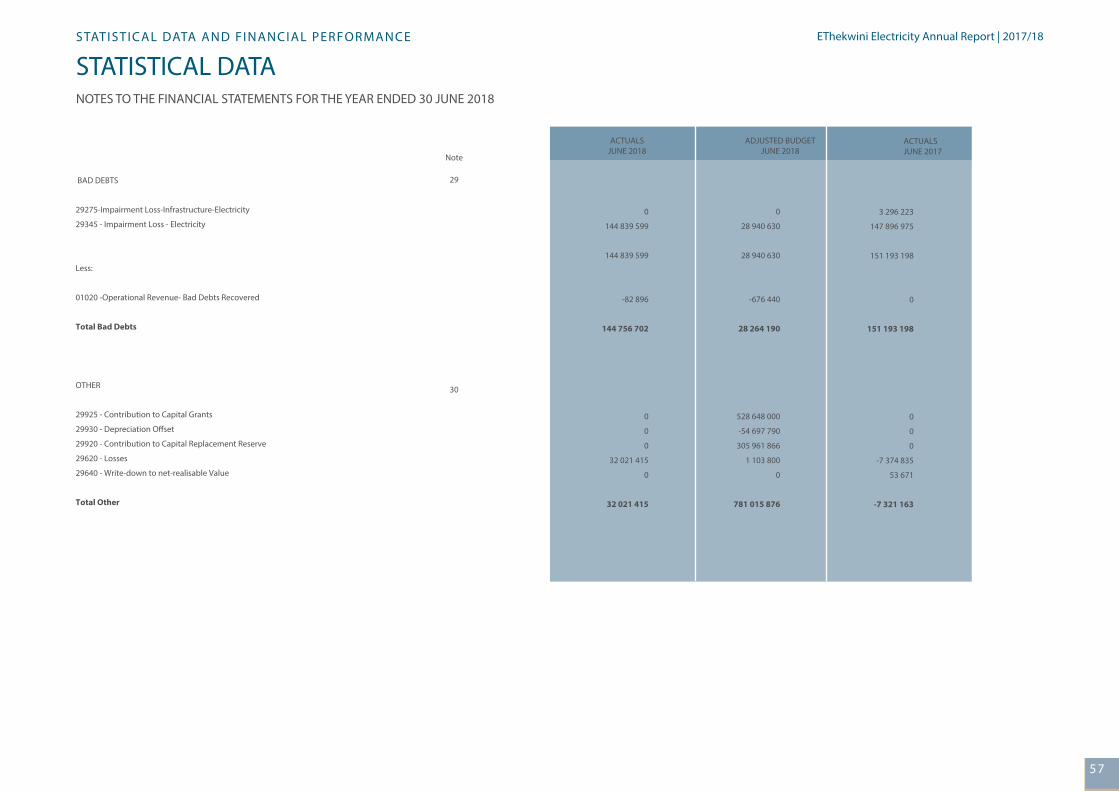
57
EThekwini Electricity Annual Report | 2016/17
STATISTICAL DATASTATISTICAL DATA AND FINANCIAL PERFORMANCE
NOTES TO THE FINANCIAL STATEMENTS FOR THE YEAR ENDED 30 JUNE 2018
57575757
ACTUALSJUNE 2018
ADJUSTED BUDGETJUNE 2018
Note
BAD DEBTS
29275-Impairment Loss-Infrastructure-Electricity
29345 - Impairment Loss - Electricity
Less:
01020 -Operational Revenue- Bad Debts Recovered
Total Bad Debts
OTHER
29925 - Contribution to Capital Grants
29930 - Depreciation O�set
29920 - Contribution to Capital Replacement Reserve
29620 - Losses
29640 - Write-down to net-realisable Value
Total Other
0
144 839 599
144 839 599
-82 896
144 756 702
0
0
0
32 021 415
0
32 021 415
0
28 940 630
28 940 630
-676 440
28 264 190
528 648 000
-54 697 790
305 961 866
1 103 800
0
781 015 876
3 296 223
147 896 975
151 193 198
0
151 193 198
0
0
0
-7 374 835
53 671
-7 321 163
29
30
ACTUALSJUNE 2017
EThekwini Electricity Annual Report | 2017/18
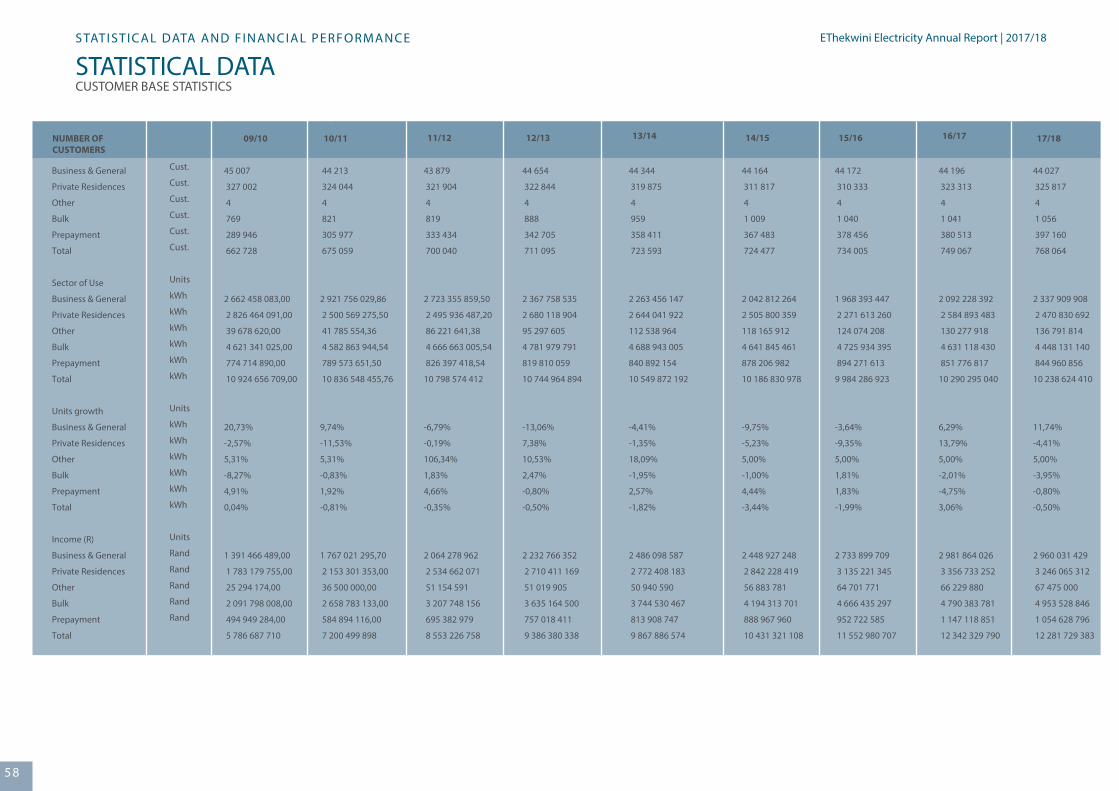
58
EThekwini Electricity Annual Report | 2016/17STATISTICAL DATA AND FINANCIAL PERFORMANCE
STATISTICAL DATACUSTOMER BASE STATISTICS
585858
EThekwini Electricity Annual Report | 2017/18
NUMBER OF CUSTOMERS
Business & General
Private Residences
Other
Bulk
Prepayment
Total
Sector of Use
Business & General
Private Residences
Other
Bulk
Prepayment
Total
Units growth
Business & General
Private Residences
Other
Bulk
Prepayment
Total
Income (R)
Business & General
Private Residences
Other
Bulk
Prepayment
Total
Cents/Unit
Business & General
Private Residences
Other
Bulk
Prepayment
Total
Ave Units/Mnth/Cust
Business & General
Private Residences
Other
Bulk
Prepayment
Total
Ave Rands/Month/Cust
Business & General
Private Residences
Other
Bulk
Prepayment
Total
Cust.
Cust.
Cust.
Cust.
Cust.
Cust.
Units
kWh
kWh
kWh
kWh
kWh
kWh
Units
kWh
kWh
kWh
kWh
kWh
kWh
Units
Rand
Rand
Rand
Rand
Rand
Units
Cents
Cents
Cents
Cents
Cents
Units
kWh
kWh
kWh
kWh
kWh
Units
Rand
Rand
Rand
Rand
Rand
09/10
45 007
327 002
4
769
289 946
662 728
2 662 458 083,00
2 826 464 091,00
39 678 620,00
4 621 341 025,00
774 714 890,00
10 924 656 709,00
20,73%
-2,57%
5,31%
-8,27%
4,91%
0,04%
1 391 466 489,00
1 783 179 755,00
25 294 174,00
2 091 798 008,00
494 949 284,00
5 786 687 710
52,26
63,09
63,75
45,26
63,89
52,97
4930
720
826638
500796
223
1374
09/10
2 576,39
454,43
526 961,96
226 679,45
142,25
727,63
10/11
44 213
324 044
4
821
305 977
675 059
2 921 756 029,86
2 500 569 275,50
41 785 554,36
4 582 863 944,54
789 573 651,50
10 836 548 455,76
9,74%
-11,53%
5,31%
-0,83%
1,92%
-0,81%
1 767 021 295,70
2 153 301 353,00
36 500 000,00
2 658 783 133,00
584 894 116,00
7 200 499 898
60,48
86,11
87,35
58,02
74,08
66,45
5507
643
870532
465171
215
1338
10 / 11
3 330,51
553,76
760 416,67
269 872,43
159,30
888,87
11/12
43 879
321 904
4
819
333 434
700 040
2 723 355 859,50
2 495 936 487,20
86 221 641,38
4 666 663 005,54
826 397 418,54
10 798 574 412
-6,79%
-0,19%
106,34%
1,83%
4,66%
-0,35%
2 064 278 962
2 534 662 071
51 154 591
3 207 748 156
695 382 979
8 553 226 758
75,80
101,55
59,33
68,74
84,15
79,21
5 172
646
1 796 284
474 833
207
1 285
11/12
3 920,40
656,16
1 065 720,64
326 388,70
173,79
1 018,18
12/13
44 654
322 844
4
888
342 705
711 095
2 367 758 535
2 680 118 904
95 297 605
4 781 979 791
819 810 059
10 744 964 894
-13,06%
7,38%
10,53%
2,47%
-0,80%
-0,50%
2 232 766 352
2 710 411 169
51 019 905
3 635 164 500
757 018 411
9 386 380 338
94,30
101,13
53,54
76,02
92,34
87,36
4 419
692
1 985 367
448 759
199
1 259
12/13
4 167
700
1 062 915
341 138
184
1 100
13/14
44 344
319 875
4
959
358 411
723 593
2 263 456 147
2 644 041 922
112 538 964
4 688 943 005
840 892 154
10 549 872 192
-4,41%
-1,35%
18,09%
-1,95%
2,57%
-1,82%
2 486 098 587
2 772 408 183
50 940 590
3 744 530 467
813 908 747
9 867 886 574
109,84
104,85
45,26
79,86
96,79
93,54
4 254
689
2 344 562
407 451
196
1 215
13/14
4 672
722
1 061 262
325 385
189
1 136
14/15
44 164
311 817
4
1 009
367 483
724 477
2 042 812 264
2 505 800 359
118 165 912
4 641 845 461
878 206 982
10 186 830 978
-9,75%
-5,23%
5,00%
-1,00%
4,44%
-3,44%
2 448 927 248
2 842 228 419
56 883 781
4 194 313 701
888 967 960
10 431 321 108
119,88
113,43
48,14
90,36
101,23
102,40
3 855
670
2 461 790
383 370
199
1 172
14/15
4 621
760
1 185 079
346 408
202
1 200
15/16
44 172
310 333
4
1 040
378 456
734 005
1 968 393 447
2 271 613 260
124 074 208
4 725 934 395
894 271 613
9 984 286 923
-3,64%
-9,35%
5,00%
1,81%
1,83%
-1,99%
2 733 899 709
3 135 221 345
64 701 771
4 666 435 297
952 722 585
11 552 980 707
138,89
138,02
52,15
98,74
106,54
115,71
3 714
610
2 584 879
378 681
197
1 134
15/16
5 158
842
1 347 954
373 913
210
1 312
16/17
44 196
323 313
4
1 041
380 513
749 067
2 092 228 392
2 584 893 483
130 277 918
4 631 118 430
851 776 817
10 290 295 040
6,29%
13,79%
5,00%
-2,01%
-4,75%
3,06%
2 981 864 026
3 356 733 252
66 229 880
4 790 383 781
1 147 118 851
12 342 329 790
142,52
129,86
50,84
103,44
134,67
119,94
3 945
666
2 714 123
370 727
187
1 145
16/17
5 622
865
1 379 789
383 476
251
1 373
17/18
44 027
325 817
4
1 056
397 160
768 064
2 337 909 908
2 470 830 692
136 791 814
4 448 131 140
844 960 856
10 238 624 410
11,74%
-4,41%
5,00%
-3,95%
-0,80%
-0,50%
2 960 031 429
3 246 065 312
67 475 000
4 953 528 846
1 054 628 796
12 281 729 383
126,61
131,38
49,33
111,36
124,81
119,95
4 425
632
2 849 829
351 020
177
1 111
17/18
5 603
830
1 405 729
390 903
221
1 333
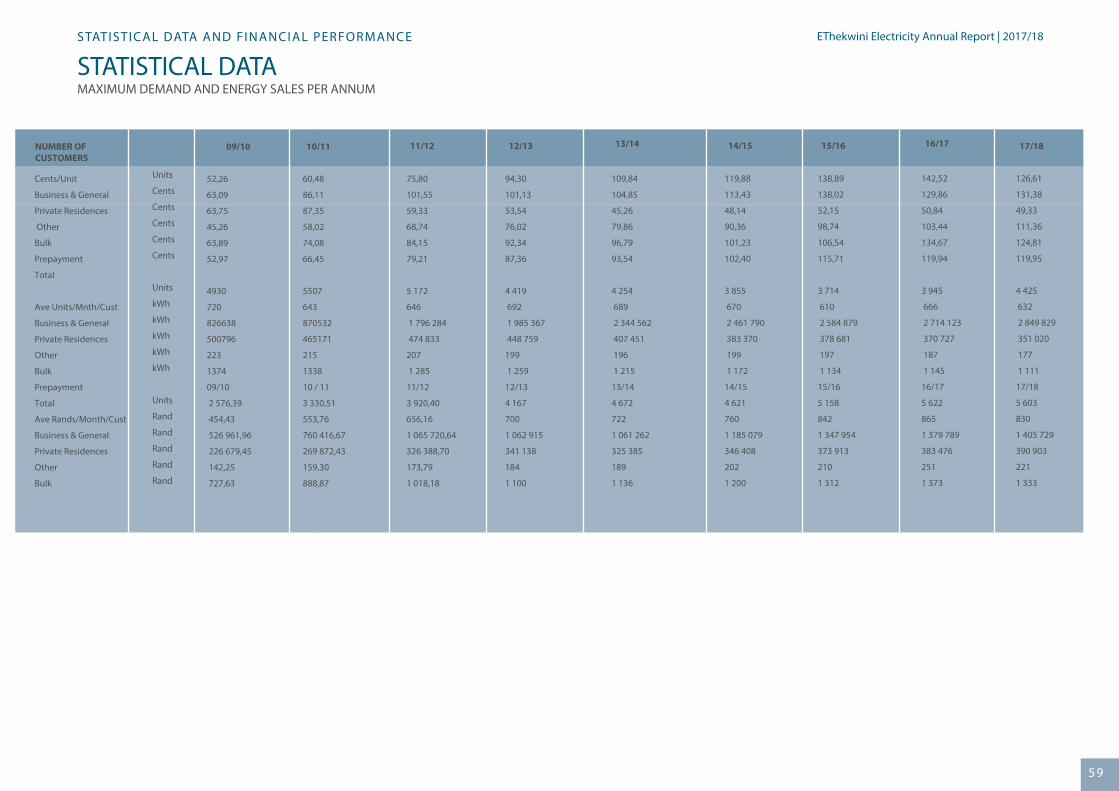
59
EThekwini Electricity Annual Report | 2016/17
STATISTICAL DATASTATISTICAL DATA AND FINANCIAL PERFORMANCE
MAXIMUM DEMAND AND ENERGY SALES PER ANNUM
59595959
EThekwini Electricity Annual Report | 2017/18
NUMBER OF CUSTOMERS
Cents/Unit
Business & General
Private Residences
Other
Bulk
Prepayment
Total
Ave Units/Mnth/Cust
Business & General
Private Residences
Other
Bulk
Prepayment
Total
Ave Rands/Month/Cust
Business & General
Private Residences
Other
Bulk
Units
Cents
Cents
Cents
Cents
Cents
Units
kWh
kWh
kWh
kWh
kWh
Units
Rand
Rand
Rand
Rand
Rand
09/10
52,26
63,09
63,75
45,26
63,89
52,97
4930
720
826638
500796
223
1374
09/10
2 576,39
454,43
526 961,96
226 679,45
142,25
727,63
10/11
60,48
86,11
87,35
58,02
74,08
66,45
5507
643
870532
465171
215
1338
10 / 11
3 330,51
553,76
760 416,67
269 872,43
159,30
888,87
11/12
75,80
101,55
59,33
68,74
84,15
79,21
5 172
646
1 796 284
474 833
207
1 285
11/12
3 920,40
656,16
1 065 720,64
326 388,70
173,79
1 018,18
12/13
94,30
101,13
53,54
76,02
92,34
87,36
4 419
692
1 985 367
448 759
199
1 259
12/13
4 167
700
1 062 915
341 138
184
1 100
13/14
109,84
104,85
45,26
79,86
96,79
93,54
4 254
689
2 344 562
407 451
196
1 215
13/14
4 672
722
1 061 262
325 385
189
1 136
14/15
119,88
113,43
48,14
90,36
101,23
102,40
3 855
670
2 461 790
383 370
199
1 172
14/15
4 621
760
1 185 079
346 408
202
1 200
15/16
138,89
138,02
52,15
98,74
106,54
115,71
3 714
610
2 584 879
378 681
197
1 134
15/16
5 158
842
1 347 954
373 913
210
1 312
16/17
142,52
129,86
50,84
103,44
134,67
119,94
3 945
666
2 714 123
370 727
187
1 145
16/17
5 622
865
1 379 789
383 476
251
1 373
17/18
126,61
131,38
49,33
111,36
124,81
119,95
4 425
632
2 849 829
351 020
177
1 111
17/18
5 603
830
1 405 729
390 903
221
1 333
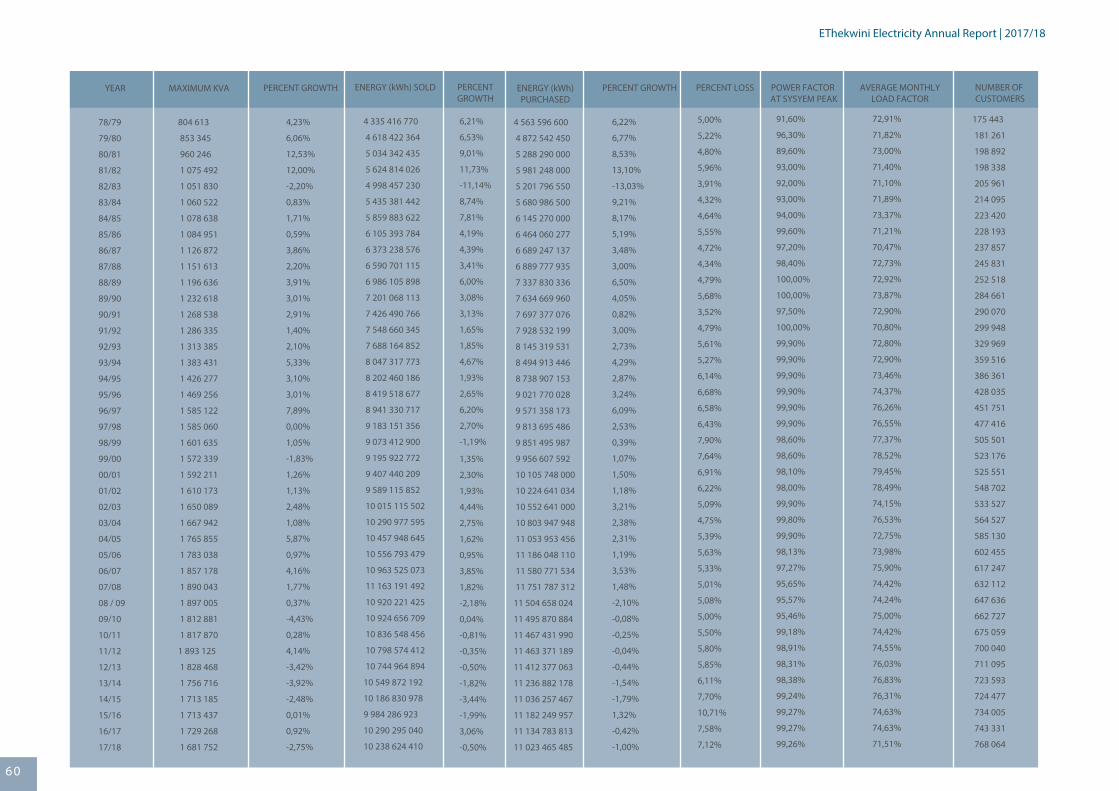
60
EThekwini Electricity Annual Report | 2016/17EThekwini Electricity Annual Report | 2017/18
YEAR MAXIMUM KVA
78/79
79/80
80/81
81/82
82/83
83/84
84/85
85/86
86/87
87/88
88/89
89/90
90/91
91/92
92/93
93/94
94/95
95/96
96/97
97/98
98/99
99/00
00/01
01/02
02/03
03/04
04/05
05/06
06/07
07/08
08 / 09
09/10
10/11
11/12
12/13
13/14
14/15
15/16
16/17
17/18
804 613
853 345
960 246
1 075 492
1 051 830
1 060 522
1 078 638
1 084 951
1 126 872
1 151 613
1 196 636
1 232 618
1 268 538
1 286 335
1 313 385
1 383 431
1 426 277
1 469 256
1 585 122
1 585 060
1 601 635
1 572 339
1 592 211
1 610 173
1 650 089
1 667 942
1 765 855
1 783 038
1 857 178
1 890 043
1 897 005
1 812 881
1 817 870
1 893 125
1 828 468
1 756 716
1 713 185
1 713 437
1 729 268
1 681 752
PERCENT GROWTH
4,23%
6,06%
12,53%
12,00%
-2,20%
0,83%
1,71%
0,59%
3,86%
2,20%
3,91%
3,01%
2,91%
1,40%
2,10%
5,33%
3,10%
3,01%
7,89%
0,00%
1,05%
-1,83%
1,26%
1,13%
2,48%
1,08%
5,87%
0,97%
4,16%
1,77%
0,37%
-4,43%
0,28%
4,14%
-3,42%
-3,92%
-2,48%
0,01%
0,92%
-2,75%
PERCENT GROWTH
6,22%
6,77%
8,53%
13,10%
-13,03%
9,21%
8,17%
5,19%
3,48%
3,00%
6,50%
4,05%
0,82%
3,00%
2,73%
4,29%
2,87%
3,24%
6,09%
2,53%
0,39%
1,07%
1,50%
1,18%
3,21%
2,38%
2,31%
1,19%
3,53%
1,48%
-2,10%
-0,08%
-0,25%
-0,04%
-0,44%
-1,54%
-1,79%
1,32%
-0,42%
-1,00%
PERCENT LOSS
5,00%
5,22%
4,80%
5,96%
3,91%
4,32%
4,64%
5,55%
4,72%
4,34%
4,79%
5,68%
3,52%
4,79%
5,61%
5,27%
6,14%
6,68%
6,58%
6,43%
7,90%
7,64%
6,91%
6,22%
5,09%
4,75%
5,39%
5,63%
5,33%
5,01%
5,08%
5,00%
5,50%
5,80%
5,85%
6,11%
7,70%
10,71%
7,58%
7,12%
POWER FACTOR AT SYSYEM PEAK
91,60%
96,30%
89,60%
93,00%
92,00%
93,00%
94,00%
99,60%
97,20%
98,40%
100,00%
100,00%
97,50%
100,00%
99,90%
99,90%
99,90%
99,90%
99,90%
99,90%
98,60%
98,60%
98,10%
98,00%
99,90%
99,80%
99,90%
98,13%
97,27%
95,65%
95,57%
95,46%
99,18%
98,91%
98,31%
98,38%
99,24%
99,27%
99,27%
99,26%
AVERAGE MONTHLYLOAD FACTOR
72,91%
71,82%
73,00%
71,40%
71,10%
71,89%
73,37%
71,21%
70,47%
72,73%
72,92%
73,87%
72,90%
70,80%
72,80%
72,90%
73,46%
74,37%
76,26%
76,55%
77,37%
78,52%
79,45%
78,49%
74,15%
76,53%
72,75%
73,98%
75,90%
74,42%
74,24%
75,00%
74,42%
74,55%
76,03%
76,83%
76,31%
74,63%
74,63%
71,51%
NUMBER OF CUSTOMERS
175 443
181 261
198 892
198 338
205 961
214 095
223 420
228 193
237 857
245 831
252 518
284 661
290 070
299 948
329 969
359 516
386 361
428 035
451 751
477 416
505 501
523 176
525 551
548 702
533 527
564 527
585 130
602 455
617 247
632 112
647 636
662 727
675 059
700 040
711 095
723 593
724 477
734 005
743 331
768 064
ENERGY (kWh) SOLD
4 335 416 770
4 618 422 364
5 034 342 435
5 624 814 026
4 998 457 230
5 435 381 442
5 859 883 622
6 105 393 784
6 373 238 576
6 590 701 115
6 986 105 898
7 201 068 113
7 426 490 766
7 548 660 345
7 688 164 852
8 047 317 773
8 202 460 186
8 419 518 677
8 941 330 717
9 183 151 356
9 073 412 900
9 195 922 772
9 407 440 209
9 589 115 852
10 015 115 502
10 290 977 595
10 457 948 645
10 556 793 479
10 963 525 073
11 163 191 492
10 920 221 425
10 924 656 709
10 836 548 456
10 798 574 412
10 744 964 894
10 549 872 192
10 186 830 978
9 984 286 923
10 290 295 040
10 238 624 410
PERCENTGROWTH
6,21%
6,53%
9,01%
11,73%
-11,14%
8,74%
7,81%
4,19%
4,39%
3,41%
6,00%
3,08%
3,13%
1,65%
1,85%
4,67%
1,93%
2,65%
6,20%
2,70%
-1,19%
1,35%
2,30%
1,93%
4,44%
2,75%
1,62%
0,95%
3,85%
1,82%
-2,18%
0,04%
-0,81%
-0,35%
-0,50%
-1,82%
-3,44%
-1,99%
3,06%
-0,50%
ENERGY (kWh)PURCHASED
4 563 596 600
4 872 542 450
5 288 290 000
5 981 248 000
5 201 796 550
5 680 986 500
6 145 270 000
6 464 060 277
6 689 247 137
6 889 777 935
7 337 830 336
7 634 669 960
7 697 377 076
7 928 532 199
8 145 319 531
8 494 913 446
8 738 907 153
9 021 770 028
9 571 358 173
9 813 695 486
9 851 495 987
9 956 607 592
10 105 748 000
10 224 641 034
10 552 641 000
10 803 947 948
11 053 953 456
11 186 048 110
11 580 771 534
11 751 787 312
11 504 658 024
11 495 870 884
11 467 431 990
11 463 371 189
11 412 377 063
11 236 882 178
11 036 257 467
11 182 249 957
11 134 783 813
11 023 465 485
6060


![[XLS]apsebea.orgapsebea.org/files/Tel-APTRANSCO-10.09.2011.xls · Web view132 KV Korutla 080-31,32 132 KV Manthani 0729/029-36 132 KV Huzurabad 033-35 132 KV Mallaram 08723-236164](https://static.fdocuments.net/doc/165x107/5b0e1ab67f8b9aa31f8b92d9/xls-view132-kv-korutla-080-3132-132-kv-manthani-0729029-36-132-kv-huzurabad.jpg)