Estimating the original cement content and water–cement ...BS 1881–124 (BSI, 1988) and the...
14
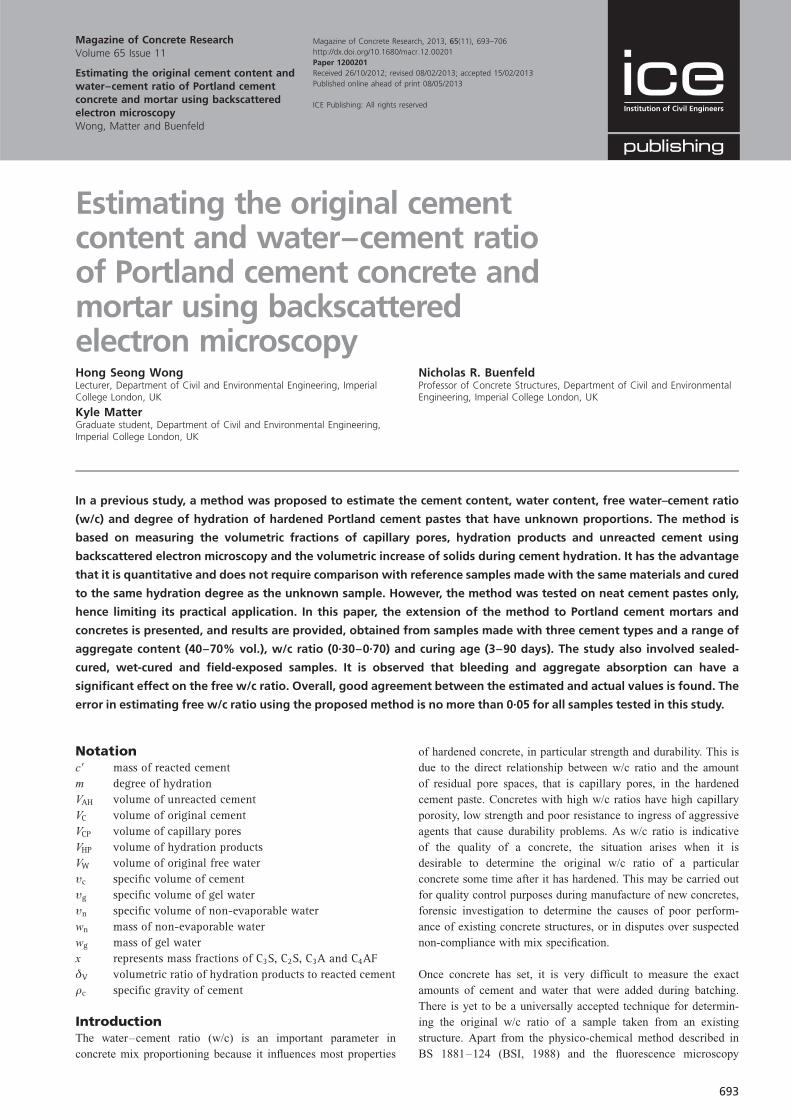
Magazine of Concrete Research, 2013, 65(11), 693–706 http://dx.doi.org/10.1680/macr.12.00201 Paper 1200201 Received 26/10/2012; revised 08/02/2013; accepted 15/02/2013 Published online ahead of print 08/05/2013 ICE Publishing: All rights reserved Magazine of Concrete Research Volume 65 Issue 11 Estimating the original cement content and water–cement ratio of Portland cement concrete and mortar using backscattered electron microscopy Wong, Matter and Buenfeld Estimating the original cement content and water–cement ratio of Portland cement concrete and mortar using backscattered electron microscopy Hong Seong Wong Lecturer, Department of Civil and Environmental Engineering, Imperial College London, UK Kyle Matter Graduate student, Department of Civil and Environmental Engineering, Imperial College London, UK Nicholas R. Buenfeld Professor of Concrete Structures, Department of Civil and Environmental Engineering, Imperial College London, UK In a previous study, a method was proposed to estimate the cement content, water content, free water–cement ratio (w/c) and degree of hydration of hardened Portland cement pastes that have unknown proportions. The method is based on measuring the volumetric fractions of capillary pores, hydration products and unreacted cement using backscattered electron microscopy and the volumetric increase of solids during cement hydration. It has the advantage that it is quantitative and does not require comparison with reference samples made with the same materials and cured to the same hydration degree as the unknown sample. However, the method was tested on neat cement pastes only, hence limiting its practical application. In this paper, the extension of the method to Portland cement mortars and concretes is presented, and results are provided, obtained from samples made with three cement types and a range of aggregate content (40–70% vol.), w/c ratio (0 . 30–0 . 70) and curing age (3–90 days). The study also involved sealed- cured, wet-cured and field-exposed samples. It is observed that bleeding and aggregate absorption can have a significant effect on the free w/c ratio. Overall, good agreement between the estimated and actual values is found. The error in estimating free w/c ratio using the proposed method is no more than 0 . 05 for all samples tested in this study. Notation c9 mass of reacted cement m degree of hydration V AH volume of unreacted cement V C volume of original cement V CP volume of capillary pores V HP volume of hydration products V W volume of original free water ı c specific volume of cement ı g specific volume of gel water ı n specific volume of non-evaporable water w n mass of non-evaporable water w g mass of gel water x represents mass fractions of C 3 S, C 2 S, C 3 A and C 4 AF ä V volumetric ratio of hydration products to reacted cement r c specific gravity of cement Introduction The water–cement ratio (w/c) is an important parameter in concrete mix proportioning because it influences most properties of hardened concrete, in particular strength and durability. This is due to the direct relationship between w/c ratio and the amount of residual pore spaces, that is capillary pores, in the hardened cement paste. Concretes with high w/c ratios have high capillary porosity, low strength and poor resistance to ingress of aggressive agents that cause durability problems. As w/c ratio is indicative of the quality of a concrete, the situation arises when it is desirable to determine the original w/c ratio of a particular concrete some time after it has hardened. This may be carried out for quality control purposes during manufacture of new concretes, forensic investigation to determine the causes of poor perform- ance of existing concrete structures, or in disputes over suspected non-compliance with mix specification. Once concrete has set, it is very difficult to measure the exact amounts of cement and water that were added during batching. There is yet to be a universally accepted technique for determin- ing the original w/c ratio of a sample taken from an existing structure. Apart from the physico-chemical method described in BS 1881–124 (BSI, 1988) and the fluorescence microscopy 693
Transcript of Estimating the original cement content and water–cement ...BS 1881–124 (BSI, 1988) and the...
Magazine of Concrete Research, 2013, 65(11), 693–706
http://dx.doi.org/10.1680/macr.12.00201
Paper 1200201
Received 26/10/2012; revised 08/02/2013; accepted 15/02/2013
Published online ahead of print 08/05/2013
ICE Publishing: All rights reserved
Magazine of Concrete ResearchVolume 65 Issue 11
Estimating the original cement content andwater–cement ratio of Portland cementconcrete and mortar using backscatteredelectron microscopyWong, Matter and Buenfeld
Estimating the original cementcontent and water–cement ratioof Portland cement concrete andmortar using backscatteredelectron microscopyHong Seong WongLecturer, Department of Civil and Environmental Engineering, ImperialCollege London, UK
Kyle MatterGraduate student, Department of Civil and Environmental Engineering,Imperial College London, UK
Nicholas R. BuenfeldProfessor of Concrete Structures, Department of Civil and EnvironmentalEngineering, Imperial College London, UK
In a previous study, a method was proposed to estimate the cement content, water content, free water–cement ratio
(w/c) and degree of hydration of hardened Portland cement pastes that have unknown proportions. The method is
based on measuring the volumetric fractions of capillary pores, hydration products and unreacted cement using
backscattered electron microscopy and the volumetric increase of solids during cement hydration. It has the advantage
that it is quantitative and does not require comparison with reference samples made with the same materials and cured
to the same hydration degree as the unknown sample. However, the method was tested on neat cement pastes only,
hence limiting its practical application. In this paper, the extension of the method to Portland cement mortars and
concretes is presented, and results are provided, obtained from samples made with three cement types and a range of
aggregate content (40–70% vol.), w/c ratio (0.30–0.70) and curing age (3–90 days). The study also involved sealed-
cured, wet-cured and field-exposed samples. It is observed that bleeding and aggregate absorption can have a
significant effect on the free w/c ratio. Overall, good agreement between the estimated and actual values is found. The
error in estimating free w/c ratio using the proposed method is no more than 0.05 for all samples tested in this study.
Notationc9 mass of reacted cement
m degree of hydration
VAH volume of unreacted cement
VC volume of original cement
VCP volume of capillary pores
VHP volume of hydration products
VW volume of original free water
ıc specific volume of cement
ıg specific volume of gel water
ın specific volume of non-evaporable water
wn mass of non-evaporable water
wg mass of gel water
x represents mass fractions of C3S, C2S, C3A and C4AF
�V volumetric ratio of hydration products to reacted cement
rc specific gravity of cement
IntroductionThe water–cement ratio (w/c) is an important parameter in
concrete mix proportioning because it influences most properties
of hardened concrete, in particular strength and durability. This is
due to the direct relationship between w/c ratio and the amount
of residual pore spaces, that is capillary pores, in the hardened
cement paste. Concretes with high w/c ratios have high capillary
porosity, low strength and poor resistance to ingress of aggressive
agents that cause durability problems. As w/c ratio is indicative
of the quality of a concrete, the situation arises when it is
desirable to determine the original w/c ratio of a particular
concrete some time after it has hardened. This may be carried out
for quality control purposes during manufacture of new concretes,
forensic investigation to determine the causes of poor perform-
ance of existing concrete structures, or in disputes over suspected
non-compliance with mix specification.
Once concrete has set, it is very difficult to measure the exact
amounts of cement and water that were added during batching.
There is yet to be a universally accepted technique for determin-
ing the original w/c ratio of a sample taken from an existing
structure. Apart from the physico-chemical method described in
BS 1881–124 (BSI, 1988) and the fluorescence microscopy
693

technique (Christensen et al., 1979; Jakobsen and Brown, 2006)
described in the Nordisk test method NT 361 (Nordtest, 1999),
there exists no other standardised test for w/c ratio, for example,
in RILEM (International Union of Laboratories and Experts in
Construction Materials, Systems and Structures), EN (European
Committee for Standardisation) or ASTM (American Society for
Testing and Materials). However, the physico-chemical method is
known to have low precision, estimated to be 0.1 (w/c ratio) or
greater (Concrete Society, 1989; Neville, 2003; St John et al.,
1998). The fluorescence method, on the other hand, relies on the
use of reference standards for comparison or calibration purposes,
which should be made with the same cement and aggregate type,
air content and degree of hydration, in addition to w/c ratio, as
the concrete being examined (Eden, 2010; Neville, 2003; St John
et al., 1998).
In a previous work (Wong and Buenfeld, 2009), the present
authors proposed a new microscopy-based method to estimate the
free w/c ratio of hardened cement pastes that does not require
comparison to any reference or calibration standards. The
proposed method is also able to estimate the degree of hydration
and the original cement content and water content separately.
Preliminary testing showed encouraging results, whereby a good
agreement was observed between the estimated and actual values
for samples with a range of w/c ratio (0.25–0.50) and curing age
(3–90 days). The error in determination of the w/c ratio was no
more than 0.025. However, the original study was limited to neat
cement pastes that were prepared and sealed-cured in the
laboratory. Therefore, the present work was carried out to extend
the proposed method to concrete and mortar samples having a
range of mix proportions, curing ages and curing conditions.
Methodology
Samples
Mortars and concretes with free w/c ratios ranging from 0.30 to
0.70 were prepared using three types of Portland cement. The
properties of the cements are shown in Table 1. N1 and N2 are
ordinary Portland cements (CEM I) whereas cement L is a ‘low-
heat’ Portland cement that has high C2S and low C3A contents.
The phase compositions of the cements were calculated from
their oxides composition using the modified form of the Bogue
equation (Taylor, 1989), while the volumetric ratio of hydration
products to the reacted cement �v was calculated using Equation
6. The cements have very similar �v values that were close to 2.
Thirteen mixes were prepared and divided into series I and series
II, representing laboratory and field samples, respectively. Series I
(Table 2) consists of mortars and concretes that were made with
cement N1 and Thames Valley gravel (5–12.7 mm) and sand
(, 5 mm) complying with the medium grading of BS 882 (BSI,
1992). The specific gravity of the sand and gravel was 2.63 and
2.53, respectively. The concretes had 70% volume fraction of
aggregates while the mortars had either 40% or 60%. The amount
of water needed to bring the aggregates to saturated, surface-dry
condition was determined and added to the batch water to achieve
the target free w/c ratio. A sulfonated naphthalene-based super-
plasticiser was used to improve the workability of mixes with low
w/c ratio (0.3). The batch water was also corrected for additional
water brought in by the admixture.
Mixes were batched by mass and mixed using a pan mixer.
Cylindrical samples (100 mm dia. 3 250 mm) were cast and
compacted in three layers using a vibrating table. Each layer was
compacted until no significant amount of air bubbles escaped the
top surface. The compacted samples were covered with plastic
sheets and wet hessian to prevent evaporation for the first 24 h,
then demoulded and sealed in cling film and polythene bags to
cure for 3, 7 and 90 days at 208C.
For series II (Table 3), four concrete mixes were prepared with
cements N2 and L. Fine and coarse aggregates were river sand
and crushed limestone with specific gravities of 2.60 and 2.65,
respectively. A water-reducing admixture (WR) and air-entraining
agent (AEA) were used. The total air content of the samples as
measured with point-count analysis ranged from 3.2% to 6.6%.
The samples were cast into blocks of dimension
100 3 100 3 400 mm, demoulded after 24 h and then cured in
water at 208C for 28 days. After curing, the samples were
exposed to the splash zone of a marine environment for 1 year.
Bleed water measurement
Bleeding was observed in some samples, particularly those with
high w/c ratio, despite care taken to avoid overvibration. This is
Designation Specific
gravity
Specific surface area:
m2/kg
Bogue composition: % LOI �V
C3S C2S C3A C2AF
N1 3.15 342 63.0 12.8 7.4 8.3 1.32 2.02
N2 3.16 331 54.7 20.4 9.5 8.7 0.66 2.12
L 3.22 357 31.0 51.1 2.7 8.7 0.64 1.97
Table 1. Properties of the cements used in this study
694
Magazine of Concrete ResearchVolume 65 Issue 11
Estimating the original cement contentand water–cement ratio of Portlandcement concrete and mortar usingbackscattered electron microscopyWong, Matter and Buenfeld

potentially a source of error for this study as the water lost to
bleeding may significantly reduce the free w/c ratio. Two parallel
samples were prepared in the same manner as before and covered
to prevent evaporation. The bleed water accumulated on the top
surfaces of the compacted samples was collected periodically
using a pipette, according to the procedure described in BS EN
480-4:2005 (BSI, 2005). The measured bleed water was con-
verted to value per mass of cement from the known mix
proportion to give an estimate of the corrected free w/c ratio.
Backscattered electron microscopy
An epoxy-impregnated polished block (40 3 20 3 8 mm) was
prepared from the mid-height of each cylinder after the desig-
nated curing or exposure period. Sectioning was done using a
diamond abrasive cutter operated at a slow feed rate of 0.3 mm/s.
The field samples were sectioned at 30 mm away from the
seawater exposed face to avoid areas that may be influenced by
leaching and/or brucite precipitation. The freshly cut surfaces
were tested with a phenolphthalein solution and no visible sign of
carbonation was detected. The blocks were freeze-dried to remove
pore water and then impregnated with a low-viscosity fluores-
cent-dyed epoxy. The epoxy was preheated to 508C and mixed
with 5% toluene to reduce its viscosity. A 2.5 bar pressure was
further applied on the impregnated blocks to ensure deep
penetration (Wong and Buenfeld, 2006a). The blocks were then
allowed to harden over several days. Following this, they were
ground using silicon carbide papers of successively finer grit size
of 68, 30, 18 and 14 �m, and then polished with diamond at 9, 6,
3, 1 and finally to a 0.25-micron finish. The grinding and
polishing was carried out at 70 r/min with a 7 N force applied on
each block. The time spent on each grinding and polishing stage
was no longer than 5 min to minimise relief. A non-aqueous
solution was used as lubricant for cutting and polishing. Cleaning
was carried out with acetone in an ultrasonic bath. The polished
blocks were carbon coated to prevent charging effects.
It is important to ensure that the blocks are well impregnated with
epoxy in order to preserve the microstructure and to provide atomic
contrast to the capillary pores. Pores not filled with epoxy will not
be visible in the backscattered electron (BSE) image. Fluorescent
dye is not required, but its presence helps to indicate that the
surface of the polished block is saturated with epoxy. Variation in
the depth of epoxy penetration has no effect on the BSE images
because the sampling depth of BSEs is less than 500 nm at 10 kV
beam accelerating voltage (Wong and Buenfeld, 2006b).
BSE images were collected using a field-emission scanning
electron microscope operated at 10 kV accelerating voltage and
10 mm working distance. The images were captured at 5003
magnification and digitised to 2560 3 2048 pixels at a pixel
spacing of 0.094 �m, thus giving a field of view of 240 3 192 �m
per image. A microanalytical standard (Al, 99.99% purity) was
Mix Free w/c Water:
kg/m3
Cement:
kg/m3
SP:
%
Sand: kg/m3 Gravel: kg/m3 Sealed curing
age: days
Mortars
M 0.3: 40 0.30 292 964 0.25 1040 (40% vol.) — 90
M 0.3: 60 0.30 193 642 1.0 1560 (60% vol.) —
M 0.5: 40 0.50 372 729 — 1040 (40% vol.) —
M 0.5: 60 0.50 253 486 — 1560 (60% vol.) —
Concretes
C 0.3: 70 0.30 166 482 0.5 628 (23.9% vol.) 1167 (46.1% vol.) 3, 7, 90
C 0.4: 70 0.40 191 415 —
C 0.5: 70 0.50 207 365 —
C 0.6: 70 0.60 220 325 —
C 0.7: 70 0.70 230 293 —
Table 2. Mix proportions of pastes, mortars and concretes from series I (laboratory samples)
Mix Free w/c Water:
kg/m3
Cement:
kg/m3
WR:
%
AEA:
%
Air content:
%
Sand:
kg/m3
Limestone:
kg/m3
Wet curing
age: days
C 0.4-N2 0.40 160 400 1.0 1.5 4.9 799 975 28
C 0.4-L 0.40 160 400 0.8 1.5 3.2 802 978
C 0.5-N2 0.50 160 320 0.8 1.5 6.6 830 1011
C 0.5-L 0.50 160 320 0.5 1.5 4.5 832 1014
Table 3. Mix proportions of concretes from series II (field samples)
695
Magazine of Concrete ResearchVolume 65 Issue 11
Estimating the original cement contentand water–cement ratio of Portlandcement concrete and mortar usingbackscattered electron microscopyWong, Matter and Buenfeld

used to calibrate the brightness and contrast settings so that the
brightness histogram was centred and stretched to span the entire
dynamic range of greyscale. Once the optimum setting had been
found, this was applied to all images captured for the particular
sample to ensure a faithful reproduction of grey values. Fifty
images were collected per sample in a random and uniform
manner by moving the stage in a grid fashion spanning the entire
sample. The imaged areas were selected randomly so that both
the bulk paste and interfacial transition zone (ITZ), that is paste
near aggregate particles, were sampled. Thus, the frequency of an
image containing either the ITZ, bulk paste or both depends on
the aggregate size distribution and volume fraction. If a frame fell
entirely on an aggregate particle, it was replaced by another
randomly chosen location within the neighbouring grids. How-
ever, areas near the sample edge were not imaged to avoid
sampling areas that may have been saw-damaged.
Image analysis
Aggregate segmentation
Randomly sampled BSE images of concretes and mortars will
contain a considerable fraction of aggregate particles, which must
first be removed before estimations of the w/c ratio and cement
content can be made. However, typical aggregates contain silica-
rich or calcium-rich minerals with backscatter coefficients that
are very similar to the cement hydrates. Thus, greyscale thresh-
olding is ineffective because of overlap in grey values. The
aggregates may be segmented using energy dispersive X-ray
mapping based on a priori knowledge of the aggregate miner-
alogy (Brough and Atkinson, 2000; Head and Buenfeld, 2006),
but this would require substantial imaging and processing time
for large image sets.
A simpler and faster, yet reasonably accurate approach is to trace
out the aggregate boundaries manually using a white line, thresh-
old the white boundary, then carry out a particle detection and
hole-filling operation (Figure 1). The first step is most crucial, so
the image must be enlarged to enable the aggregate boundary to
be marked accurately. This approach also allows the operator
simultaneously to detect and segment bond cracks that sometimes
appear between the aggregate and cement paste. These are drying
artefacts and should not be measured as part of the original pore
structure for the purpose of this study. However, it is difficult to
isolate the bond cracks accurately using automated procedures
because they have variable widths and do not always occur on
every particle. The aggregate boundary tracing method does not
require prior knowledge or assumptions made regarding the aggre-
gate mineralogy and works well even in areas where automated
procedures face difficulties (Wong and Buenfeld, 2006c). Once the
aggregate boundary is accurately marked, subsequent operations
are automated and defect free. This semi-manual segmentation
approach requires about 1 min per image to perform.
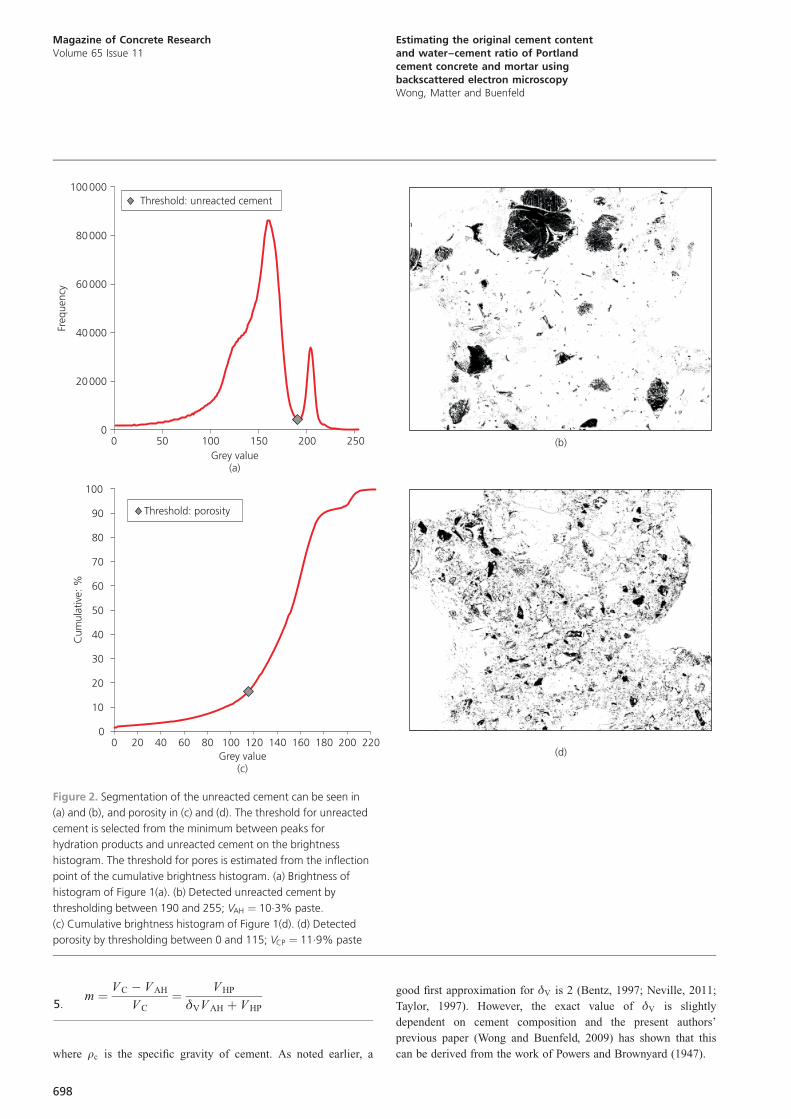
Unreacted cement and pore segmentation
The unreacted cement, hydration products and capillary pores are
then segmented to allow estimations of their volumetric fractions
using stereology. The unreacted cement particles are highly
contrasted from the hydration products so segmentation is rel-
atively easy by selecting the minimum grey value between peaks
for hydration products and the unreacted cement phase, as the
lower threshold value (Figure 2(a) and (b)). The exact location of
the minima is determined from the first derivative of the bright-
ness histogram. The capillary pores are segmented using the
‘overflow’ method (Wong et al., 2006), whereby the inflection
point of the cumulative brightness histogram is taken as the upper
threshold value. This is obtained from the intersection of two
best-fit lines in the cumulative brightness histogram (Figure 2(c)
and (d)). For the purpose of this study, the capillary porosity is
considered to include the hollow shell pores because Powers and
Brownyard’s model does not distinguish the latter pore type.
Microcracks owing to damage caused by the sample preparation
should not be included and care was taken to avoid imaging these
areas, in particular near the sample edges. Nevertheless, the
amount of microcracking observed in the samples was small and
therefore considered not to have a significant influence.
The authors note that the obtained threshold values will vary
slightly due to small and unavoidable fluctuations in the beam
conditions, sample surface and brightness/contrast settings. How-
ever, because every image is thresholded using a consistent rule,
the effect of this on the results is small. Finally, the volume
fraction of hydration products is obtained by simple subtraction,
taking care to exclude any entrapped or entrained air voids, which
can be easily distinguished owing to their large size and spherical
shape. The amount of air voids was measured using a modified
point-count approach described in Wong et al. (2011).
Estimating original cement content, watercontent and w/c ratioThe method is summarised here and the reader is referred to Wong
and Buenfeld (2009) for complete details. Figure 3 shows a
schematic representation of the volumetric proportions of the main
components in a hardened mortar or concrete. At any moment after
setting, the hardened mortar or concrete consists of the following
components: (a) the remaining unreacted cement, (b) hydration
products, (c) capillary pores, (d) air voids and (e) aggregate. The
sum of their volumes and any shrinkage must be equal to the sum
of volumes of the original cement, free water, aggregates and air
voids at the time of set. However, the amounts of aggregate and air
voids are invariant with time, and the total shrinkage is small and
negligible for the purpose of this study. Therefore
V C þ V W ¼ V AH þ V HP þ V CP1:
where VC, VW, VAH, VHP and VCP are volumes of the original
cement, original free water, unreacted cement, hydration products
and capillary pores. It is well known that for Portland cements
cured at room temperature, the products of cement hydration
occupy approximately twice the volume of reacted cement. Thus,
the volumes of the original cement and water can be expressed as
696
Magazine of Concrete ResearchVolume 65 Issue 11
Estimating the original cement contentand water–cement ratio of Portlandcement concrete and mortar usingbackscattered electron microscopyWong, Matter and Buenfeld

V C ¼ V AH þV HP
�V2:
V W ¼ V AH þ V HP þ V CP � V AH þV HP
�V
� �
¼ V HP 1þ 1
�V
� �þ V CP
3:
where �V is the volumetric ratio of hydration products to the
reacted cement (,2).
Thus, the free w/c ratio and the degree of hydration (m) can be
expressed as
w
c¼ V W
V Crc
¼ V HP �V � 1ð Þ þ �VV CP
�VV AH þ V HPð Þrc4:
(a) (b)
(c) (d)
Figure 1. Aggregate segmentation: (a) original BSE image at
5003 magnification; (b) aggregate boundary is manually traced
with a white line; (c) thresholding, particle detection and hole
filling to produce an aggregate binary mask; (d) final image with
the aggregate removed. (Field of view: 240 3 192�m, sample is
C 0.4-N2)
697
Magazine of Concrete ResearchVolume 65 Issue 11
Estimating the original cement contentand water–cement ratio of Portlandcement concrete and mortar usingbackscattered electron microscopyWong, Matter and Buenfeld
m ¼ V C � V AH
V C
¼ V HP
�VV AH þ V HP5:
where rc is the specific gravity of cement. As noted earlier, a
good first approximation for �V is 2 (Bentz, 1997; Neville, 2011;
Taylor, 1997). However, the exact value of �V is slightly
dependent on cement composition and the present authors’
previous paper (Wong and Buenfeld, 2009) has shown that this
can be derived from the work of Powers and Brownyard (1947).
(b)
(d)
0
20000
40000
60000
80000
100000
0 50 100 150 200 250Grey value
(a)
Freq
uenc
y
Threshold: unreacted cement
0
10
20
30
40
50
60
70
80
90
100
0 20 40 60 80 100 120 140 160 180 200 220Grey value
(c)
Cum
ulat
ive:
%
Threshold: porosity
Figure 2. Segmentation of the unreacted cement can be seen in
(a) and (b), and porosity in (c) and (d). The threshold for unreacted
cement is selected from the minimum between peaks for
hydration products and unreacted cement on the brightness
histogram. The threshold for pores is estimated from the inflection
point of the cumulative brightness histogram. (a) Brightness of
histogram of Figure 1(a). (b) Detected unreacted cement by
thresholding between 190 and 255; VAH ¼ 10.3% paste.
(c) Cumulative brightness histogram of Figure 1(d). (d) Detected
porosity by thresholding between 0 and 115; VCP ¼ 11.9% paste
698
Magazine of Concrete ResearchVolume 65 Issue 11
Estimating the original cement contentand water–cement ratio of Portlandcement concrete and mortar usingbackscattered electron microscopyWong, Matter and Buenfeld

�V ¼V HP
V C9
¼ c9vc þ wnvn þ wgvg
mcvc
¼ 1þ wn
c9
vn
vc
þ wg
c9
vg
vc6:
where c9, wn and wg are the mass of the reacted cement, non-
evaporable water and gel water, respectively, and ıc, ın and ıg
are the specific volumes of the cement, non-evaporable water
(0.72 cm3/g) and gel water (0.9 cm3/g), respectively. To apply
Equation 6, the functions wn=c9 and wg=c9, which are the non-
evaporable water per mass of hydrated cement and the gel water
per mass of hydrated cement, respectively, need to be known.
Powers and Brownyard (1947) showed that these can be estimated
as a function of the cement mineral composition
wn
c9¼ 0:187xC3S þ 0:158xC2S þ 0:665xC3A
þ 0:213xC4AF7:
wg
c9¼ 4wn
c93 (0:230xC3S þ 0:320xC2S
þ 0:317xC3A þ 0:368xC4AF)8:
where x represents the mass fractions of the C3S, C2S, C3A and
C4AF.
The above derivations show that the original cement content, free
water content, w/c ratio and degree of hydration can be
determined, at any time after setting, from the volume fractions
of the unreacted cement, hydration products and capillary pores.
These can be measured directly with image analysis on BSE
images. The volume fractions measured from each BSE image
(section 2.4) are then used to calculate the ‘local’ cement content,
free water content, free w/c ratio and degree of hydration, using
Equations 2–5. This is repeated for a large number of images
until their cumulative averages from successive frames do not
vary significantly, thereby indicating that a representative volume
has been analysed. The results are then converted to original
cement content and water content of the concrete. To apply this
method in practice for unknown concretes would require know-
ledge of the aggregate fraction. This can be measured accurately
from point-count analysis of a representative cross-section (Wong
et al., 2011).
Results
Bleed water
The amounts of bleed water measured from the mortar and
concrete specimens are shown in Table 4. The measured bleed
Hydration products ( )VHP
Air voids Air voids
Water ( )Vw
Capillary pores ( )VCP
Cement ( )VcUnreacted cement ( )VAH
Aggregates Aggregates
(a) (b)
Figure 3. Schematic representation of the volumetric proportions
(not to scale) of the main phases in mortar or concrete: (a) at
time of initial set and (b) at time t after setting
Sample Bleed water Corrected
free w/c
Per sample: g/kg Per cement: g/g
M 0.5: 40 4.32 0.013 0.487
M 0.5: 60 3.15 0.015 0.485
M 0.3: 40 0.48 0.001 0.299
M 0.3: 60 0 0 0.300
C 0.7 6.15 0.05 0.653
C 0.6 3.89 0.03 0.573
C 0.5 1.06 0.01 0.494
C 0.4 0.74 0 0.397
C 0.3 0 0 0.300
Table 4. Results from bleed water measurement (average of two
samples) to estimate the corrected free w/c ratio
699
Magazine of Concrete ResearchVolume 65 Issue 11
Estimating the original cement contentand water–cement ratio of Portlandcement concrete and mortar usingbackscattered electron microscopyWong, Matter and Buenfeld

water is converted to a value per mass of cement to determine the
‘corrected’ free w/c ratio. As expected, mixes with higher w/c
ratio displayed a greater tendency to bleed. It can also be seen
that the mortars tend to bleed more, particularly those at low sand
content, compared to concretes with the same w/c ratio. Although
the amount of extracted bleed water is small (, 0.7%) relative to
the mass of each sample, its effect on the free w/c ratio is
significant. The largest reduction in the free w/c ratio due to
bleeding was 0.05.
Unreacted cement, hydration products and porosity
The volume fractions of unreacted cement, hydration products
and capillary porosity measured from image analysis for all
samples are given in Tables 5, 6 and 7. These values are averages
of 50 frames per sample and normalised to the paste fraction.
The authors’ experience shows that the cumulative averages of
the unreacted cement, hydration products and capillary porosity
do not vary significantly after analysing about 50 frames, thereby
indicating a representative volume has been sampled. This was
found to be true for the lab-cured as well as field-exposed
samples.
As expected, samples with higher w/c ratios have higher
capillary porosity and lower unreacted cement content. At the
same w/c ratio, samples that were cured for longer had lower
capillary porosity and lower unreacted cement. Concretes from
series II (Table 7) had the lowest capillary porosity and
unreacted cement. Equivalent mortars and concretes at the same
w/c ratio and curing age showed similar values in capillary
porosity and unreacted cement content. This correlation also
extends to neat paste samples that were tested in the earlier
study. Thus, it appears that the presence of aggregates did not
make a significant difference in the measured values. Any
observed differences were marginal and within measurement
error or could be accounted for by the slight differences in the
degree of hydration.
Sample Unreacted cement: % Hydration products: % Porosity: % Estimated w/c Hydration degree
M 0.5: 40 6.0 (0.8) 69.5 (2.2) 24.5 (2.1) 0.47 (0.01) 0.85 (0.02)
M 0.5: 60 5.4 (0.9) 67.1 (1.6) 27.5 (1.0) 0.50 (0.03) 0.86 (0.02)
M 0.3: 40 19.3 (1.6) 65.9 (2.3) 14.9 (1.0) 0.30 (0.01) 0.63 (0.03)
M 0.3: 60 20.8 (1.5) 64.9 (1.8) 14.3 (0.9) 0.28 (0.01) 0.60 (0.02)
Table 5. Measured volume fractions of unreacted cement,
hydration products and capillary porosity (average of 50 frames,
normalised to paste fraction), estimated w/c and degree of
hydration for 90-day sealed-cured mortars. Values in parentheses
represent the respective 95% confidence interval
Sample Unreacted cement: % Hyd. products: % Porosity: % Estimated w/c Hydration degree
3 days 7 days 90 days 3 days 7 days 90 days 3 days 7 days 90 days 3 days 7 days 90 days 3 days 7 days 90 days
C 0.7 13.4
(1.2)
9.2
(1.1)
5.3
(0.6)
41.6
(1.8)
47.9
(1.8)
54.2
(1.8)
45.1
(1.6)
42.8
(1.3)
40.5
(1.7)
0.61
(0.04)
0.64
(0.02)
0.67
(0.03)
0.61
(0.03)
0.72
(0.03)
0.84
(0.02)
C 0.6 12.2
(1.6)
5.9
(0.8)
4.5
(0.9)
48.4
(1.7)
57.4
(1.2)
64.4
(1.3)
39.4
(1.3)
36.7
(1.2)
31.0
(1.2)
0.56
(0.03)
0.61
(0.02)
0.55
(0.03)
0.67
(0.03)
0.83
(0.02)
0.88
(0.02)
C 0.5 11.8
(1.3)
9.2
(0.9)
6.4
(0.9)
52.5
(1.6)
64.6
(1.1)
70.4
(1.6)
35.7
(1.1)
26.2
(1.0)
23.2
(1.2)
0.52
(0.02)
0.45
(0.01)
0.45
(0.01)
0.69
(0.03)
0.78
(0.02)
0.84
(0.02)
C 0.4 16.7
(1.4)
16.1
(1.4)
10.4
(1.6)
56.7
(1.6)
57.8
(1.9)
67.9
(1.9)
26.6
(0.7)
26.1
(1.0)
21.6
(1.0)
0.39
(0.01)
0.39
(0.01)
0.40
(0.02)
0.63
(0.03)
0.64
(0.02)
0.77
(0.03)
C 0.3 24.4
(1.4)
21.0
(1.4)
16.9
(1.6)
50.4
(1.9)
61.6
(2.0)
67.5
(1.9)
25.2
(0.9)
17.4
(1.0)
15.6
(1.0)
0.33
(0.01)
0.30
(0.01)
0.32
(0.01)
0.51
(0.02)
0.59
(0.02)
0.67
(0.03)
Table 6. Measured volume fractions of unreacted cement,
hydration products and capillary porosity from image analysis
(average of 50 frames, normalised to paste fraction), estimated
w/c and degree of hydration for sealed-cured concretes. Values
in parentheses represent the respective 95% confidence intervals
700
Magazine of Concrete ResearchVolume 65 Issue 11
Estimating the original cement contentand water–cement ratio of Portlandcement concrete and mortar usingbackscattered electron microscopyWong, Matter and Buenfeld

Estimated w/c ratio, cement content and water content
Figure 4 shows the estimated w/c ratios plotted against the actual
values after correcting for any bleeding effects, for all samples.
The y-axis error bars for each data point in the figures indicate the
95% confidence interval, calculated using Student’s t-distribution
(¼ 1:96s=ffiffiffinp
). There is a reasonably good agreement between the
estimated and actual w/c ratios for all samples, regardless of the
sample type, aggregate content, curing age or exposure condition.
The error in estimated w/c ratio ranged from �0.04 to +0.04
(�8.6 to +8.6%), and the average error (absolute value) was 0.02.
However, the maximum error in the case of mortars and concretes
(,0.04) is higher than for pastes (,0.025), which was reported in
Wong and Buenfeld (2009). The width of the error bars for the
estimated w/c ratio for mortars and concretes is also larger than
that for the pastes, and appears to increase with w/c ratio. This
suggests a larger spread in the ‘local’ w/c ratios in the micro-
structure of the mortars and concretes, and may be partly
attributable to bleeding effects. The presence of aggregate also
increases the variability of paste microstructure owing to the
particle-packing effect and micro-bleeding causing the ITZ
phenomenon.
An advantage of the method is that it is able to provide estimates
for the original cement content and water content. The results are
shown in Figure 5. Again, a reasonable agreement is observed
between the estimated and actual values. Considering that a wide
range of values was covered, the method does not appear to
overestimate or underestimate consistently. The errors in estimat-
ing the original cement content and water content ranged from
�29 to +33 kg/m3 (�3.2 to +10.2%) and �8 to +18 kg/m3 (�5
to +5.8%), respectively. The magnitude of error for all estima-
tions does not appear to be influenced by either the w/c ratio or
curing age. However, the maximum error in the case of mortars
and concretes is again higher than that for neat pastes.
Variability in local w/c ratio
The measured volume fractions from each image can be used to
calculate the ‘local’ cement content, water content and free w/c
ratio using Equations 2–4. This is repeated for the entire set of
50 images per sample. The results are used to plot frequency
distribution histograms in Figures 6 and 7 to show the spatial
variability of the ‘local’ w/c ratio. For example, the estimated w/c
ratio for sample M 0.3: 40 on each image was found to vary from
0.23 to 0.38 across the 50 images (Figure 6(a)). The variability in
local w/c ratio appears to increase slightly with increase in the
average w/c ratio. The variability is also higher for mortars and
concretes, in comparison to pastes (compare with Figure 6 in
Wong and Buenfeld (2009)). This is perhaps not surprising given
the tendency to bleed at high w/c ratios and that the presence of
aggregates increases the heterogeneity at the microscale. The
observed variability would also depend on the magnification and
field of view of the image. The variability would increase with
magnification, which is a trade-off for better resolution. Never-
theless, when a representatively large number of images is
measured and averaged, there appears to be a good agreement
Sample Unreacted cement: % Hydration products: % Porosity: % Estimated w/c Hydration degree
C 0.4-N2 3.7 (0.5) 83.8 (0.5) 12.4 (0.7) 0.42 (0.01) 0.92 (0.01)
C 0.4-L 6.8 (0.5) 76.9 (0.6) 16.3 (0.7) 0.38 (0.01) 0.85 (0.01)
C 0.5-N2 2.9 (0.5) 76.2 (0.7) 20.9 (0.9) 0.51 (0.01) 0.93 (0.01)
C 0.5-L 2.5 (0.2) 75.6 (0.5) 21.9 (0.5) 0.46 (0.005) 0.94 (0.005)
Table 7. Measured volume fractions of unreacted cement,
hydration products and capillary porosity (average of 50 frames,
normalised to paste fraction), estimated w/c and degree of
hydration for concretes that were wet-cured for 28 days
followed by 1 year of exposure in the splash zone of a marine
environment. Values in parentheses represent the respective
95% confidence intervals
0·2
0·3
0·4
0·5
0·6
0·7
0·2 0·3 0·4 0·5 0·6 0·7Actual w/c ratio
Estim
ated
w/c
rat
io
Concrete – 3 days
Concrete 7 d– ays
Concrete 28 d (series II)– ays
Concrete 90 d– ays
Mortar 90 d– ays
Figure 4. Comparison between the estimated and actual w/c ratio
for concretes and mortars at different curing ages. The error bars
represent 95% confidence interval of the averages (50 fields)
701
Magazine of Concrete ResearchVolume 65 Issue 11
Estimating the original cement contentand water–cement ratio of Portlandcement concrete and mortar usingbackscattered electron microscopyWong, Matter and Buenfeld

between the estimated and the actual values, as shown in Figures
4 and 5.
Degree of hydration
The degree of hydration was estimated using Equation 5 and the
results are shown in Tables 5–7. In Figure 8, the degree of
hydration is plotted against age for all samples from series I that
were sealed-cured. As expected, the degree of hydration in-
creases with curing age, particularly in the first 7 days when a
steep rise can be noted. At each age, the degree of hydration
tends to be higher in samples with larger w/c ratio. Samples
from series II showed the largest degree of hydration owing to
the long-term exposure to water. It is interesting to note that
samples C 0.4-N2, C 0.5-N2 and C 0.5-L had very similar
hydration degrees (,0.92–0.94), but the value for C 0.4-L was
somewhat lower at 0.85. This could either be attributable to a
measurement error or the slower reactivity of cement L that had
high belite content.
In Figure 9, the degree of hydration of samples from series I at
w/c 0.3, 0.4 and 0.5 was compared to the measured degree of
hydration of equivalent paste samples cured in the same manner
by the conventional method of measuring the non-evaporable
water content by loss-on-ignition (LOI). This was carried out by
200
400
600
800
1000
200 400 600 800 1000
Actual cement content: kg/m(a)
3
Estim
ated
cem
ent
cont
ent:
kg/
m3
Concrete – 3 days
Concrete 7 d– ays
Concrete 28 d (series II)– ays
Concrete 90 d– ays
Mortar 90 d– ays
100
200
300
400
100 200 300 400Actual water content: kg/m
(b)
3
Estim
ated
wat
er c
onte
nt: k
g/m
3
Concrete 3 d– ays
Concrete 7 d– ays
Concrete 28 d (series II)– ays
Concrete 90 d– ays
Mortar 90 d– ays
Figure 5. Comparison between the estimated and actual values
for (a) original cement content and (b) water content for all
samples investigated. The error bars represent 95% confidence
interval of the averages (50 fields)
0
1
2
3
4
5
6
7
8
9
0·20 0·25 0·30 0·35 0·40Estimated w/c ratio
(a)
Freq
uenc
y
M 0·3: 40
M 0·3: 60
0
1
2
3
4
5
6
7
8
0·35 0·40 0·45 0·50 0·55 0·60 0·65Estimated w/c ratio
(b)
Freq
uenc
y
M 0·5: 40
M 0·5: 60
Figure 6. Frequency distribution histograms showing the spatial
variability of the ‘local’ w/c ratio in mortars: (a) w/c ¼ 0.3;
(b) w/c ¼ 0.5
702
Magazine of Concrete ResearchVolume 65 Issue 11
Estimating the original cement contentand water–cement ratio of Portlandcement concrete and mortar usingbackscattered electron microscopyWong, Matter and Buenfeld

drying approximately 35 g of the equivalent paste at 1058C until
constant mass to remove evaporable water, then crushing and
heating to 10508C for 3 h. The non-evaporable water was taken as
the mass loss between 1058C and 10508C, corrected for the LOI
of the dry cement. The degree of hydration, m (LOI), was then
calculated as the ratio of the non-evaporable water content per
gram of cement to the amount at complete hydration, which is
equal to 0.23 g/g for ordinary Portland cement (Brouwers, 2004;
Hansen, 1986). The LOI method is not suitable for mortars and
concretes because the presence of aggregates would affect its
accuracy. A relatively good agreement between the proposed
method and the LOI measured values was observed. The
discrepancy between the two measurements ranged from �9.8%
to 11.1%. This compares well with the results from Feng et al.
(2004), who estimated the degree of hydration of cement paste
using a point-counting method on BSE micrographs and found an
agreement of within �10% to the LOI method.
0
2
4
6
8
10
12
0·20 0·25 0·30 0·35 0·40 0·45Estimated w/c ratio
(a)
Freq
uenc
y
C 0·3 – 3 days
C 0·3 – 90 days
0
1
2
3
4
5
6
7
8
0·35 0·40 0·45 0·50 0·55 0·60 0·65 0·70Estimated w/c ratio
(b)
Freq
uenc
y
C 0·5 – 3 days
C 0·5 – 90 days
Figure 7. Frequency distribution histograms showing the spatial
variability of the ‘local’ w/c ratio in concretes: (a) w/c ¼ 0.3;
(b) w/c ¼ 0.5
0·4
0·5
0·6
0·7
0·8
0·9
0 20 40 60 80 100Curing age: days
m(b
y pr
opos
ed m
etho
d)
C 0·3 C 0·4
C 0·5 C 0·6
C 0·7 M 0·3
M 0·5
Figure 8. Variation in estimated degree of hydration with curing
age for concretes and mortars from series I. The error bars
represent 95% confidence interval of the averages (50 fields)
0·4
0·5
0·6
0·7
0·8
0·9
1·0
0·4 0·5 0·6 0·7 0·8 0·9 1·0m (by LOI)
m(b
y pr
opos
ed m
etho
d)
C 0·3
C 0·4
C 0·5
M 0·3
M 0·5
Figure 9. Comparison between the estimated degrees of
hydration of samples from series I and measured degree of
hydration from loss-on-ignition carried out on equivalent paste
samples
703
Magazine of Concrete ResearchVolume 65 Issue 11
Estimating the original cement contentand water–cement ratio of Portlandcement concrete and mortar usingbackscattered electron microscopyWong, Matter and Buenfeld

DiscussionThe results show that the proposed method for estimating original
w/c ratio can be extended to hardened mortars and concretes with
a range of w/c ratio and hydration degree. The main advantage of
the method is that it does not require the use of reference samples
or calibration standards made with the same ingredients, w/c ratio
and degree of hydration. The presence of aggregates does not
influence the method because its volume fraction is constant with
time. However, aggregates increase the heterogeneity of the
microstructure, hence a large number of images must be analysed
to obtain representative results. The method is also able to make
independent estimations of the original cement, water content and
degree of hydration, without having prior knowledge of the mix
proportions.
Measuring the hydration degree of mortars and concretes using
the LOI method is difficult because aggregates must first be
removed from the paste so that the original cement content can
be obtained from the mass remaining at the end of ignition. The
aggregates can be separated either by crushing followed by
sieving, or by dissolving the paste with concentrated acid, but
neither method is very effective. As such, the hydration degree of
mortars and concretes is often determined from LOI of parallel
cement paste samples that have undergone the same curing
regime, making the implicit assumption that both are ‘equivalent’.
The observed discrepancy between the proposed method and the
LOI method could be attributable to errors in the measurement or
simply because of actual differences between the degree of
hydration of concrete and its ‘equivalent’ paste. The discrepancy
may also be caused by partial dehydration of hydration products,
particularly the AFm and AFt phases at temperatures below
1058C and decomposition of carbonates during ignition.
The proposed method relies on the volumetric ratio of hydra-
tion products to the reacted cement (�V). However, �V varies
only slightly with cement type and a value of 2 is a good first
approximation if the cement composition is unknown. The
coefficient �v may be replaced by a more comprehensive time-
dependent function, which could be obtained using hydration
kinetics models that allow the prediction of the quantity and
composition of hydrate assemblages (Lothenbach and Winne-
feld, 2006; Lothenbach et al., 2008; Nielsen et al., 2005). In
the current approach, the authors have used a constant �V for
the sake of simplicity. This implicitly assumes that the differ-
ent hydration products that make up the hardened cement paste
are formed at approximately the same rate and mutual
proportions at all stages of hydration (Brouwers, 2004; Hansen,
1986). This approach perhaps oversimplifies the hydration
kinetics, particularly at early ages, but should not severely
violate the values at later ages, when the proposed method is
more likely to be applied. For example, Nielsen et al. (2005)
modelled the equilibrium phase assemblage in cement pastes
made with three Portland cements that were wet-cured for 6
months. The calculated phase content shows that the �v values
for the cements were 1.94, 2.02 and 2.03. The corresponding
values calculated using Equation 6 are 1.95, 2.11 and 2.03,
respectively.
The main motivation for assessing the original w/c ratio of
hardened concrete is to check for compliance and quality control.
It is often the case that when disputes occur, samples are tested
to determine if their w/c ratio is higher than what was originally
specified. Therefore, concretes with suspected high w/c ratio will
be of most interest in the context of resolving disputes. However,
concretes with high w/c ratio and water content have a greater
tendency to bleed. Any bleed water that rises to the top surface of
a freshly compacted sample is subsequently lost to evaporation.
Measurements from the present study show that although this
amount is small relative to the sample weight, it can decrease the
free w/c ratio significantly. In poorly designed mixtures, the
decrease in free w/c ratio may be even greater.
Excessive bleeding potentially creates uncertainties if one wishes
to estimate the ‘original’ w/c ratio, because the amount of
bleeding is usually not measured on site. There is also a possible
scenario in which a user justifies the addition of excess water into
a mix by expecting that bleeding reduces the free w/c ratio to the
specified value. However, the quality of concrete that has
experienced excessive bleeding is likely to be inferior to one that
has not. Although a lower free w/c ratio in theory should result in
better strength and durability, excessive bleeding produces other
undesirable effects that are detrimental to performance. For
example, rising bleed water that becomes trapped on the under-
side of steel reinforcement creates large voids that decrease the
bond between the steel and concrete, and reduce the resistance of
steel to corrosion. Concrete that had excessive bleeding is
expected to show a larger variability in the ‘local’ w/c ratio
compared to one that had not, and this characteristic may be used
to differentiate the two.
Similarly, the aggregates may have a significant effect on the free
w/c ratio. The extent of this depends on the aggregate content in
the mix, the absorption of the aggregates and its moisture
condition during batching. For example, if aggregate absorption
was not taken into account in this study, the actual free w/c ratio
could be smaller than the targeted value by up to 0.1 owing to
water lost to the aggregates. This ‘error’ is significant for the
purpose of estimating the original w/c ratio. The occurrence of
excessive bleeding and aggregate absorption should not affect the
proposed method because it is designed to measure the free w/c
ratio. However, if they are not monitored and accounted for, then
the proposed method would produce results significantly different
from expected values.
The proposed method is only applicable to samples that have not
experienced any physical or chemical degradation. The samples
must not have experienced substantial volumetric change such
that Equation 1 no longer applies and reactions that may affect
the porosity or alter the characteristics of the hydration products
formed such as leaching and carbonation. However, the proposed
704
Magazine of Concrete ResearchVolume 65 Issue 11
Estimating the original cement contentand water–cement ratio of Portlandcement concrete and mortar usingbackscattered electron microscopyWong, Matter and Buenfeld

method may be applicable to samples that are poorly compacted
and with entrained air by carefully excluding the air voids during
image analysis. Supplementary cementitious materials such as
slag and fly ash are increasingly being used in concrete. Work is
currently on-going to extend the applicability of the proposed
method to concretes that contain such materials.
ConclusionA method to estimate the original cement content, water content
and free w/c ratio of hardened concretes and mortars made with
Portland cement is presented. The method was tested on con-
cretes and mortars made with three cement types, a range of w/c
ratios (0.30–0.70), curing ages (3–90 days) and aggregate
volume fractions (40–70%). Laboratory and field-exposed sam-
ples were tested. Samples with high w/c ratios (> 0.5) tend to
bleed after compaction and this can decrease the free w/c ratio
significantly. A reasonably good agreement was obtained between
the estimated free w/c ratios and the actual values, after correct-
ing for any bleeding effects. The error in estimating free w/c ratio
using the proposed method was found to be no more than 0.05
for all the samples tested in this study.
AcknowledgementsThe authors would like to thank Mr Andrew Morris for his
assistance in the laboratory and Dr Kazuo Yamada (Taiheiyo
Cement Corp.) for the provision of samples.
REFERENCES
Bentz DP (1997) Three-dimensional computer simulation of
Portland cement hydration and microstructure development.
Journal of the American Ceramic Society 80(1): 3–21.
Brough AR and Atkinson A (2000) Automated identification of
the aggregate–paste interfacial transition zone in mortars of
silica sand with Portland or alkali-activated slag cement
paste. Cement and Concrete Research 30(6): 849–854.
Brouwers HJH (2004) The work of Powers and Brownyard
revisited: Part 1. Cement and Concrete Research 34(9):
1697–1716.
BSI (1988) BS 1881: Part 124: 1988: Methods for analysis of
hardened concrete. BSI, London, UK.
BSI (1992) BS 882:1992: Specification for aggregates from
natural sources for concrete. BSI, London, UK.
BSI (2005) BS EN 480-4:2005: Determination of bleeding of
concrete. BSI, London, UK.
Christensen P, Gudmundsson H, Thaulow H, Damgard-Jensen AD
and Chatterji S (1979) Structural and ingredient analysis of
concrete – methods, results and experience. Nordisk Betong
3: 4–9.
Concrete Society (1989) Analysis of Hardened Concrete. Concrete
Society, Camberley, UK, Technical Report 32, p. 110.
Eden MA (2010) A Code of Practice for the Petrographic
Examination of Concrete. Applied Petrography Group,
London, UK, Special Report 2, see
www.appliedpetrographygroup.com (accessed 26/10/2012).
Feng X, Garboczi EJ, Bentz DP, Stutzman PE and Mason TO
(2004) Estimation of the degree of hydration of blended
cement pastes by a scanning electron microscope point-count
procedure. Cement and Concrete Research 34(10): 1787–
1793.
Hansen TC (1986) Physical structure of hardened cement paste. A
classical approach. Materials and Structures 19(6): 423–436.
Head MK and Buenfeld NR (2006) Measurement of aggregate
interfacial porosity in complex, multi-phase aggregate
concrete: binary mask production using backscattered
electron, and energy dispersive X-ray images. Cement and
Concrete Research 36(2): 337–345.
Jakobsen UH and Brown DR (2006) Reproducibility of w/c ratio
determination from fluorescent impregnated thin sections.
Cement and Concrete Research 36(8): 1567–1573.
Lothenbach B and Winnefeld F (2006) Thermodynamic
modelling of the hydration of Portland cement. Cement and
Concrete Research 36(2): 209–226.
Lothenbach B, Matschei T, Moschner G and Glasser FP (2008)
Thermodynamic modelling of the effect of temperature on
the hydration and porosity of Portland cement. Cement and
Concrete Research 38(1): 1–18.
Neville AM (2003) How closely can we determine the water–
cement ratio of hardened concrete. Materials and Structures
36(5): 311–318.
Neville AM (2011) Properties of Concrete, 5th edn. Pearson,
Harlow, UK.
Nielsen EP, Herfort D and Geiker MR (2005) Phase equilibria of
hydrated Portland cement. Cement and Concrete Research
35(1): 109–115.
Nordtest (1999) NT Build 361–1999: Concrete, Hardened:
Water–Cement Ratio. Nordic Innovation, Oslo, Norway,
Nordtest Method, Edition 2.
Powers TC and Brownyard TL (1947) Studies of the physical
properties of hardened Portland cement paste. Research
Laboratory of Portland Cement Association, Skokie, IL,
USA, Bulletin 22, reprinted from Journal of the American
Concrete Institute (Proceedings) 43: 101–132, 249–336,
469–504, 549–602, 669–712, 845–880, 933–992.
St John DA, Poole AW and Sims I (1998) Concrete Petrography.
Arnold and John Wiley, London, UK.
Taylor HFW (1989) Modification of the Bogue calculation.
Advances in Cement Research 2(6): 73–77.
Taylor HFW (1997) Cement Chemistry, 2nd edn. Thomas Telford,
London, UK.
Wong HS and Buenfeld NR (2006a) Patch microstructure in
cement-based materials: fact or artefact? Cement and
Concrete Research 36(5): 990–997.
Wong HS and Buenfeld NR (2006b) Monte Carlo simulation of
electron–solid interactions in cement-based materials.
Cement and Concrete Research 36(6): 1076–1082
Wong HS and Buenfeld NR (2006c) Euclidean distance mapping
for computing microstructural gradients at interfaces in
composite materials. Cement and Concrete Research 36(6):
1091–1097.
Wong HS and Buenfeld NR (2009) Determining the water–
705
Magazine of Concrete ResearchVolume 65 Issue 11
Estimating the original cement contentand water–cement ratio of Portlandcement concrete and mortar usingbackscattered electron microscopyWong, Matter and Buenfeld

cement ratio, cement content, water content and degree of
hydration of hardened cement pastes: method development
and validation on paste samples. Cement and Concrete
Research 39(10): 957–965.
Wong HS, Head MK and Buenfeld NR (2006) Pore
segmentation of cement-based materials from backscattered
electron images. Cement and Concrete Research 36(6):
1083–1090.
Wong HS, Pappas AM, Zimmerman RW and Buenfeld NR (2011)
Effect of entrained air voids on the microstructure and mass
transport properties of concrete. Cement and Concrete
Research 41(10): 1067–1077.
WHAT DO YOU THINK?
To discuss this paper, please submit up to 500 words to
the editor at www.editorialmanager.com/macr by 1
December 2013. Your contribution will be forwarded to
the author(s) for a reply and, if considered appropriate
by the editorial panel, will be published as a discussion
in a future issue of the journal.
706
Magazine of Concrete ResearchVolume 65 Issue 11
Estimating the original cement contentand water–cement ratio of Portlandcement concrete and mortar usingbackscattered electron microscopyWong, Matter and Buenfeld